

Variation in Body Composition Components Across Different Age Groups and Proposal of Age-Specific Normative Tables: A Cross-Sectional Study
 ,
,  ,
,  and
and 
Abstract
:1. Introduction
2. Materials and Methods
2.1. Study Design
2.2. Statistical Power Analysis
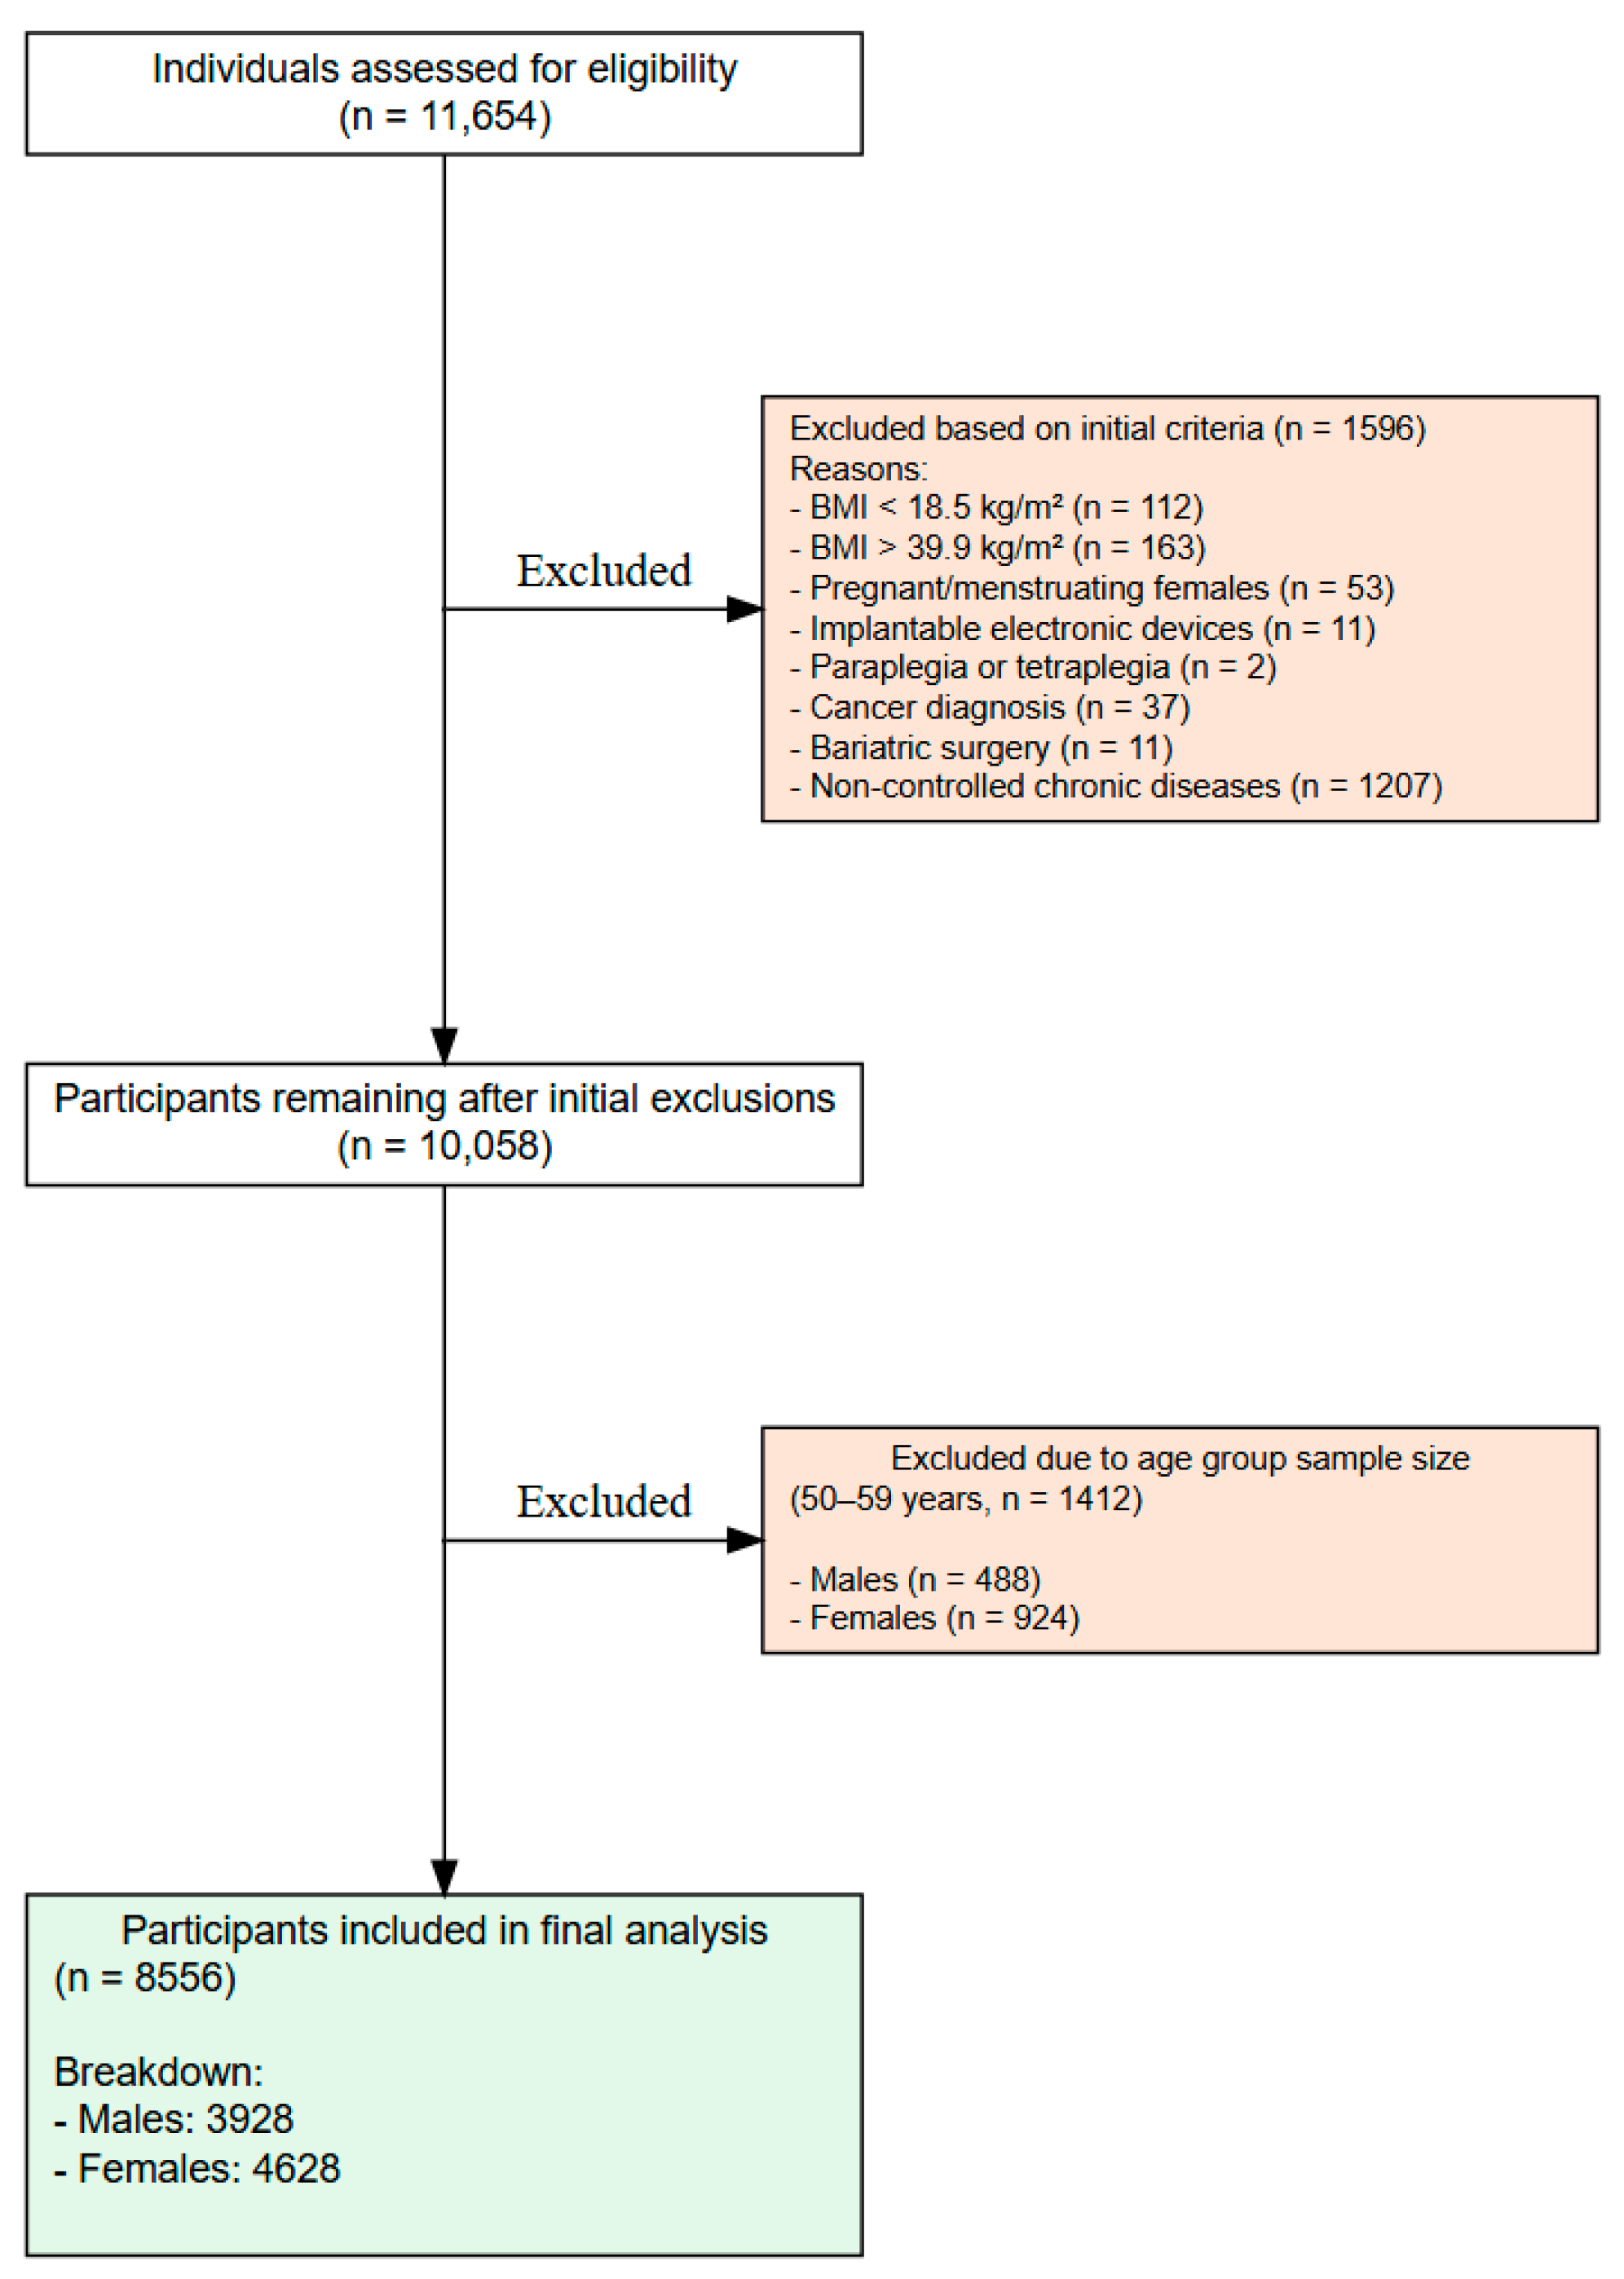
2.3. Participants
2.4. Ethical Considerations
2.5. Data Collection
2.6. Anthropometry Protocol
2.7. Body Composition via Bioelectrical Impedance Analysis
2.8. Statistical Analysis
2.9. Establishing a Normative Table
3. Results
3.1. Descriptive Statistics
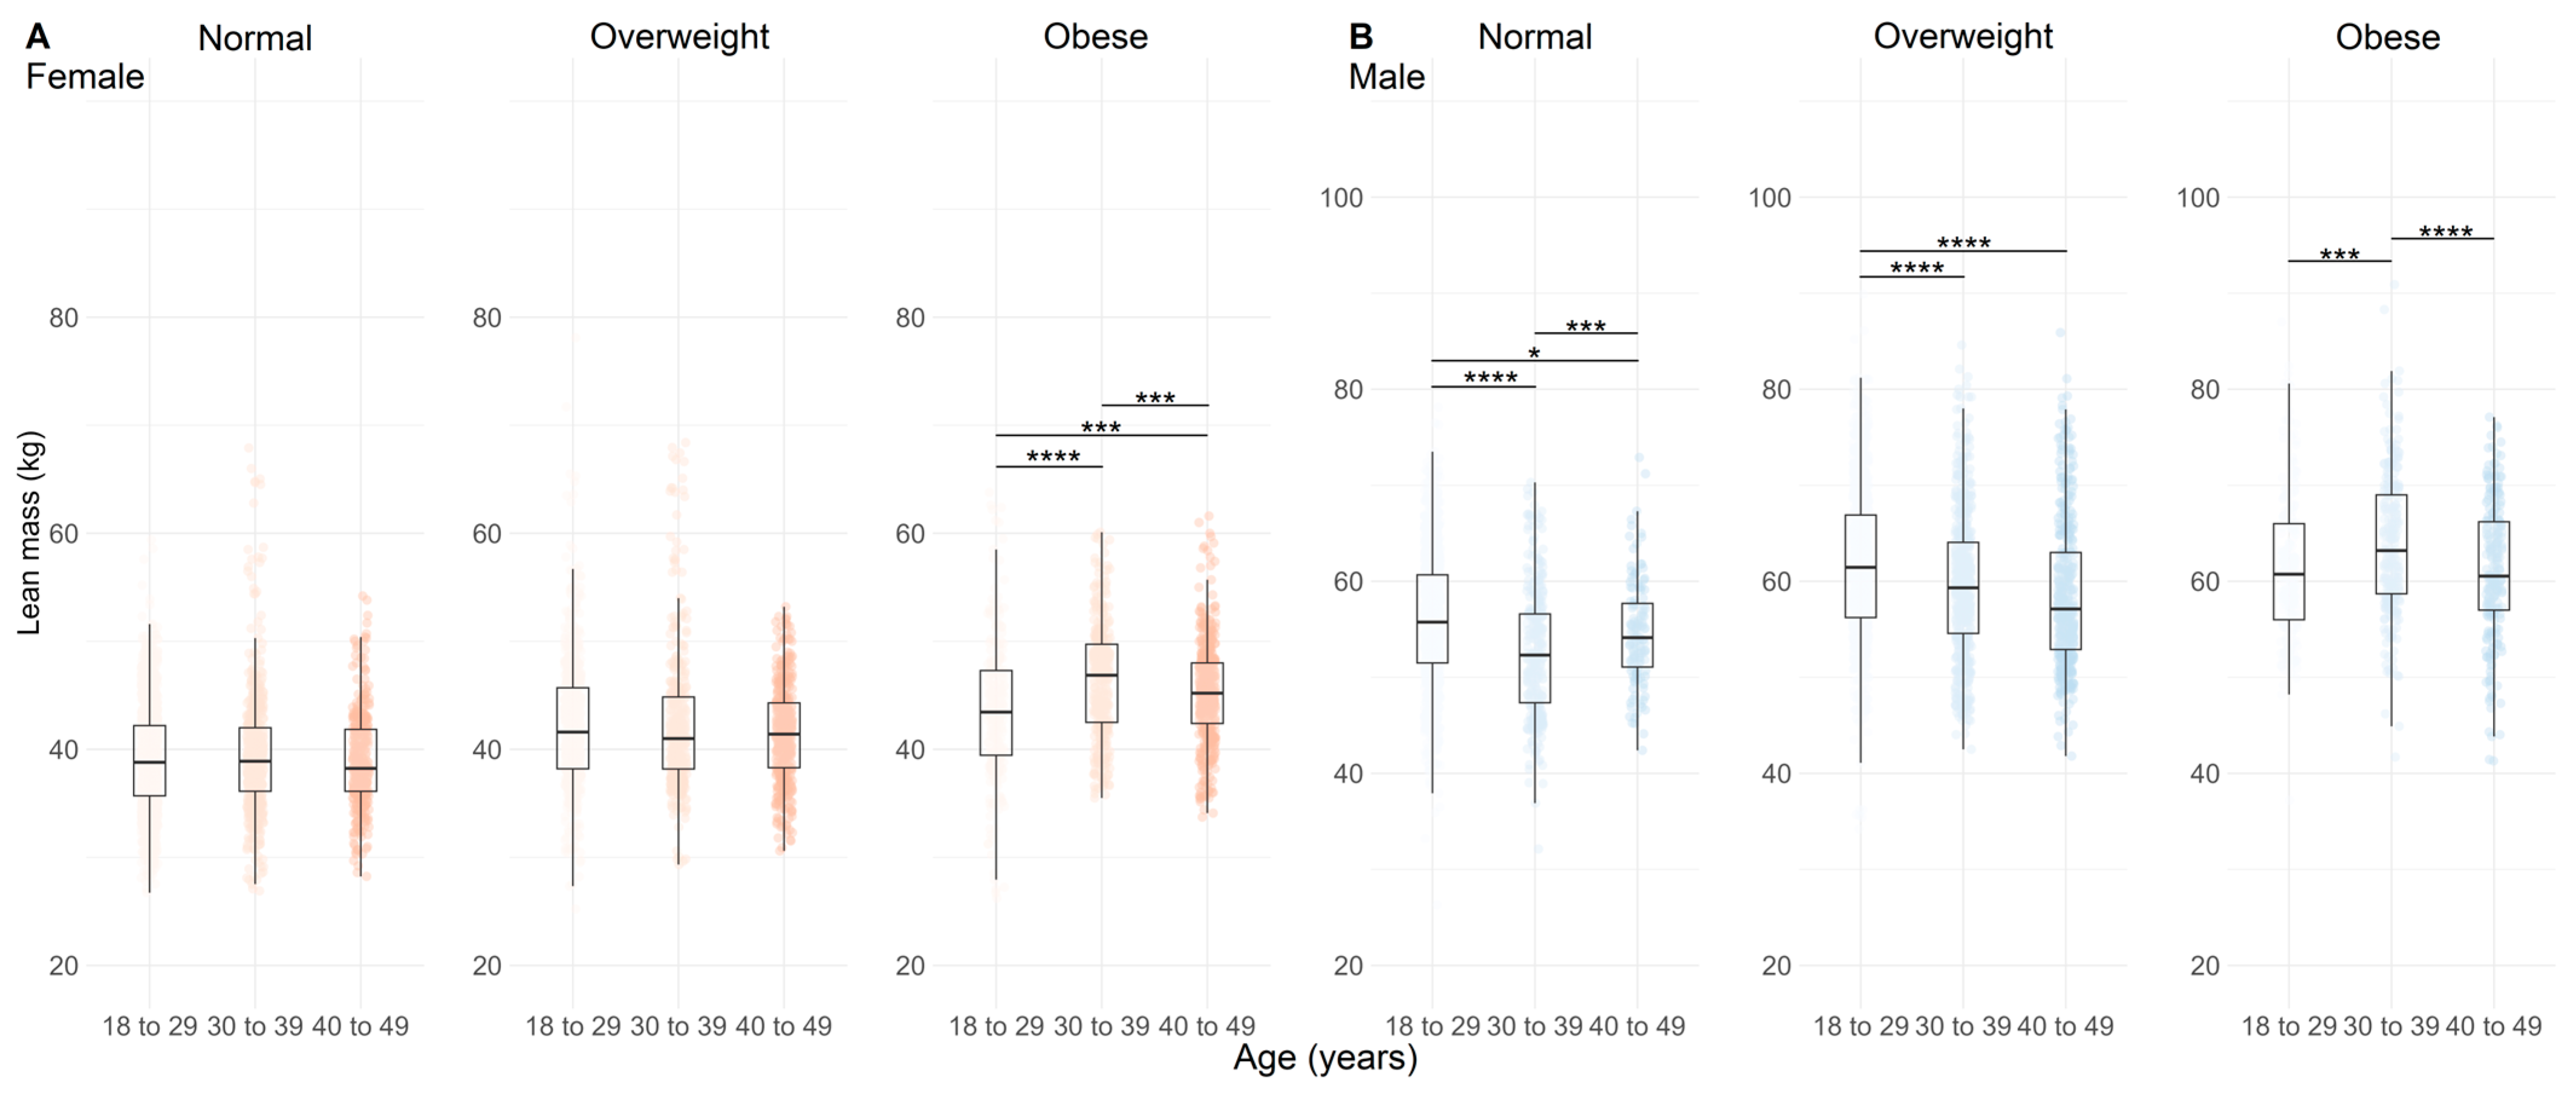
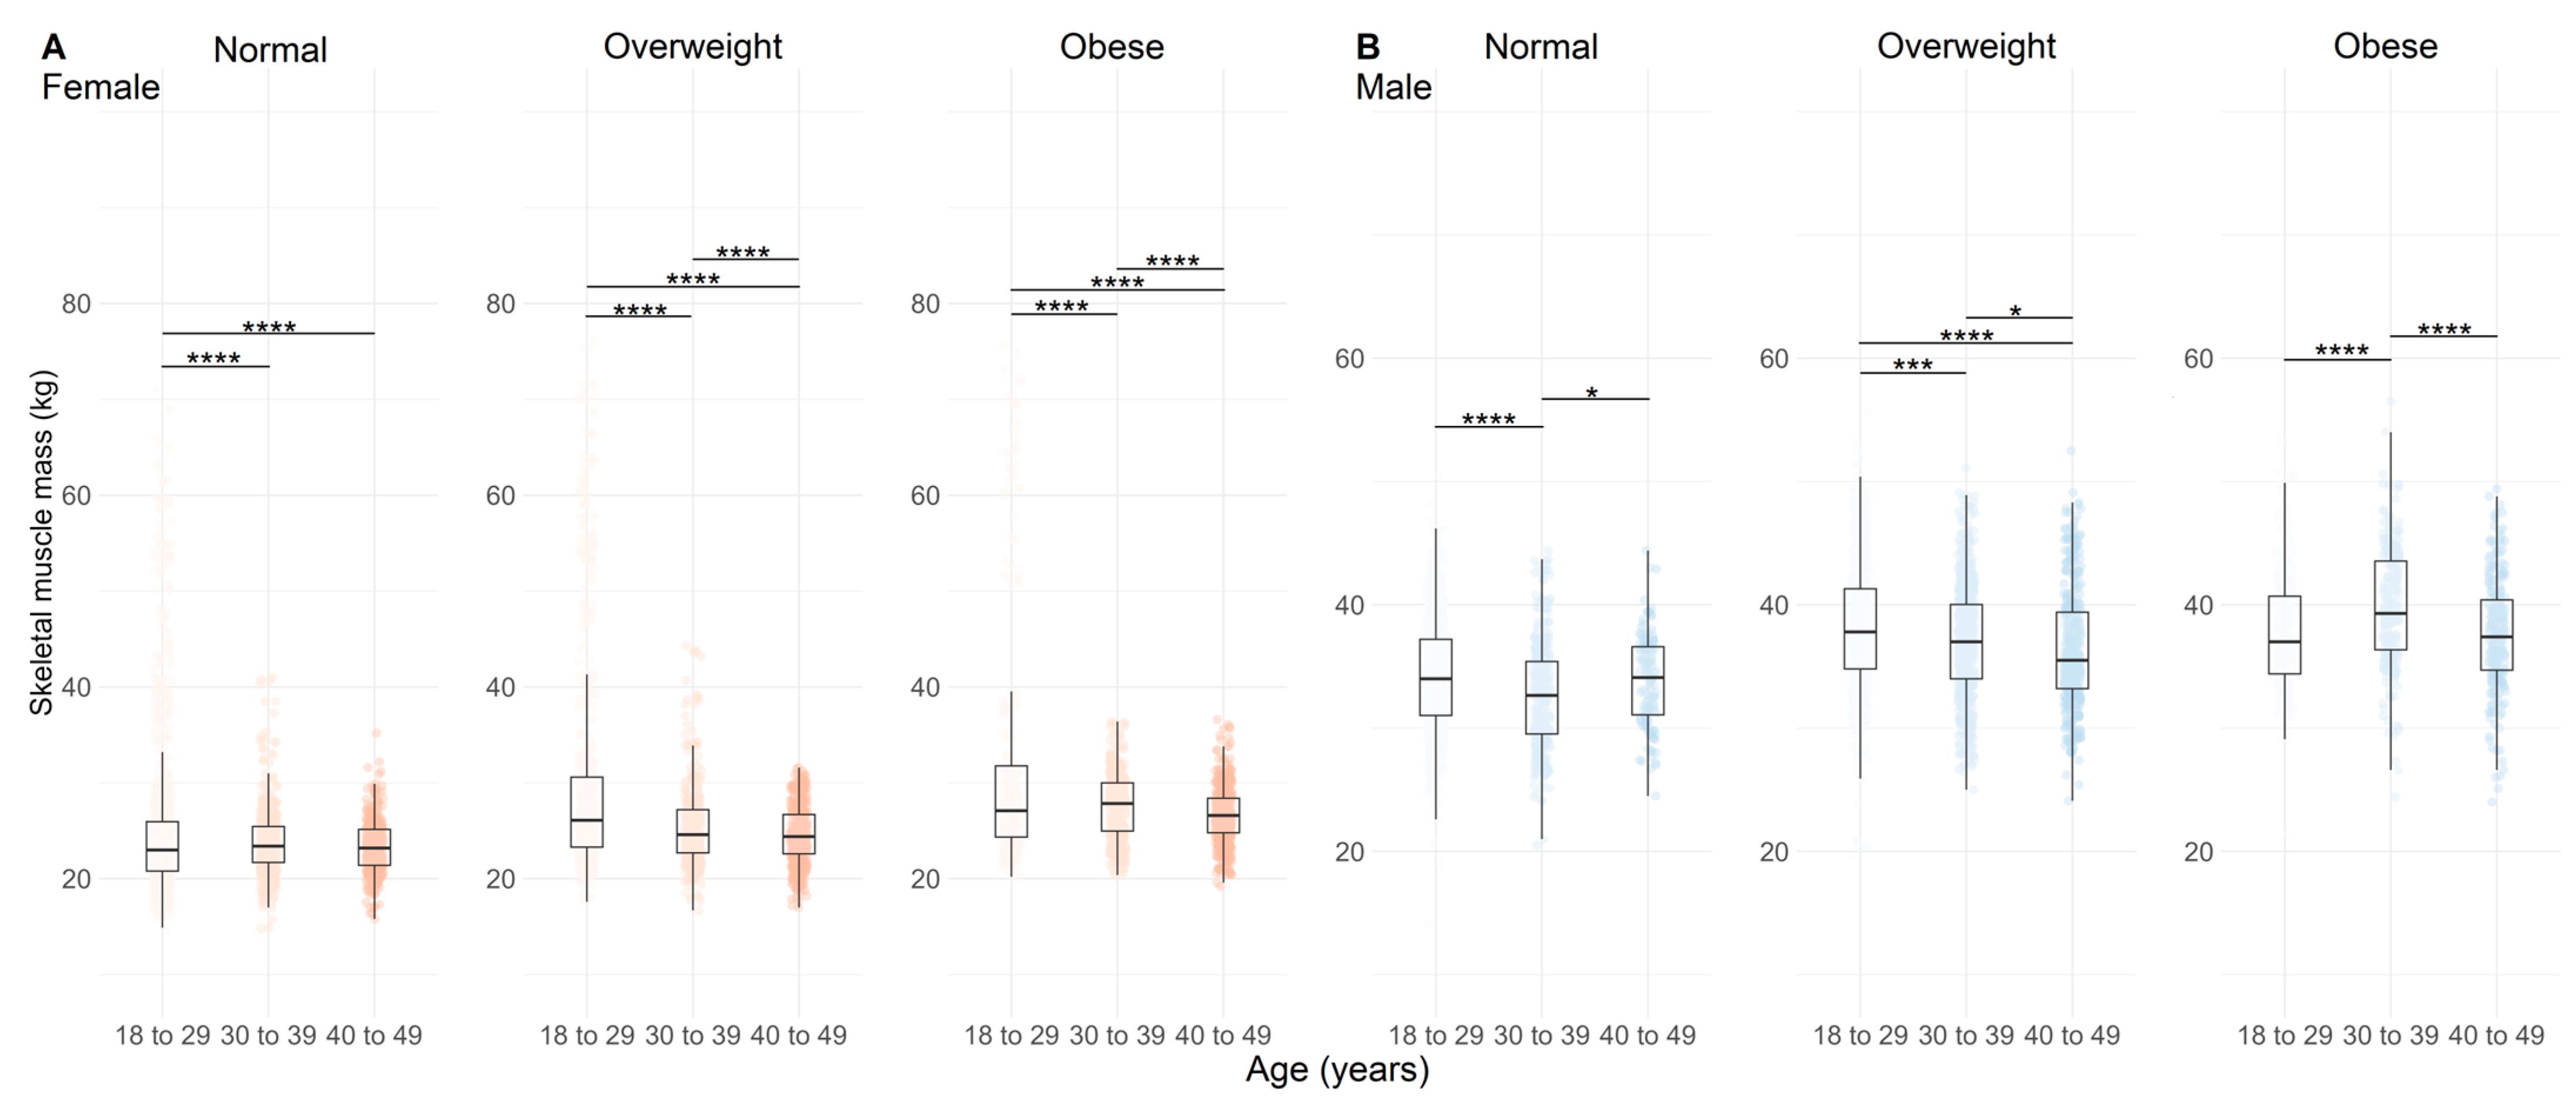
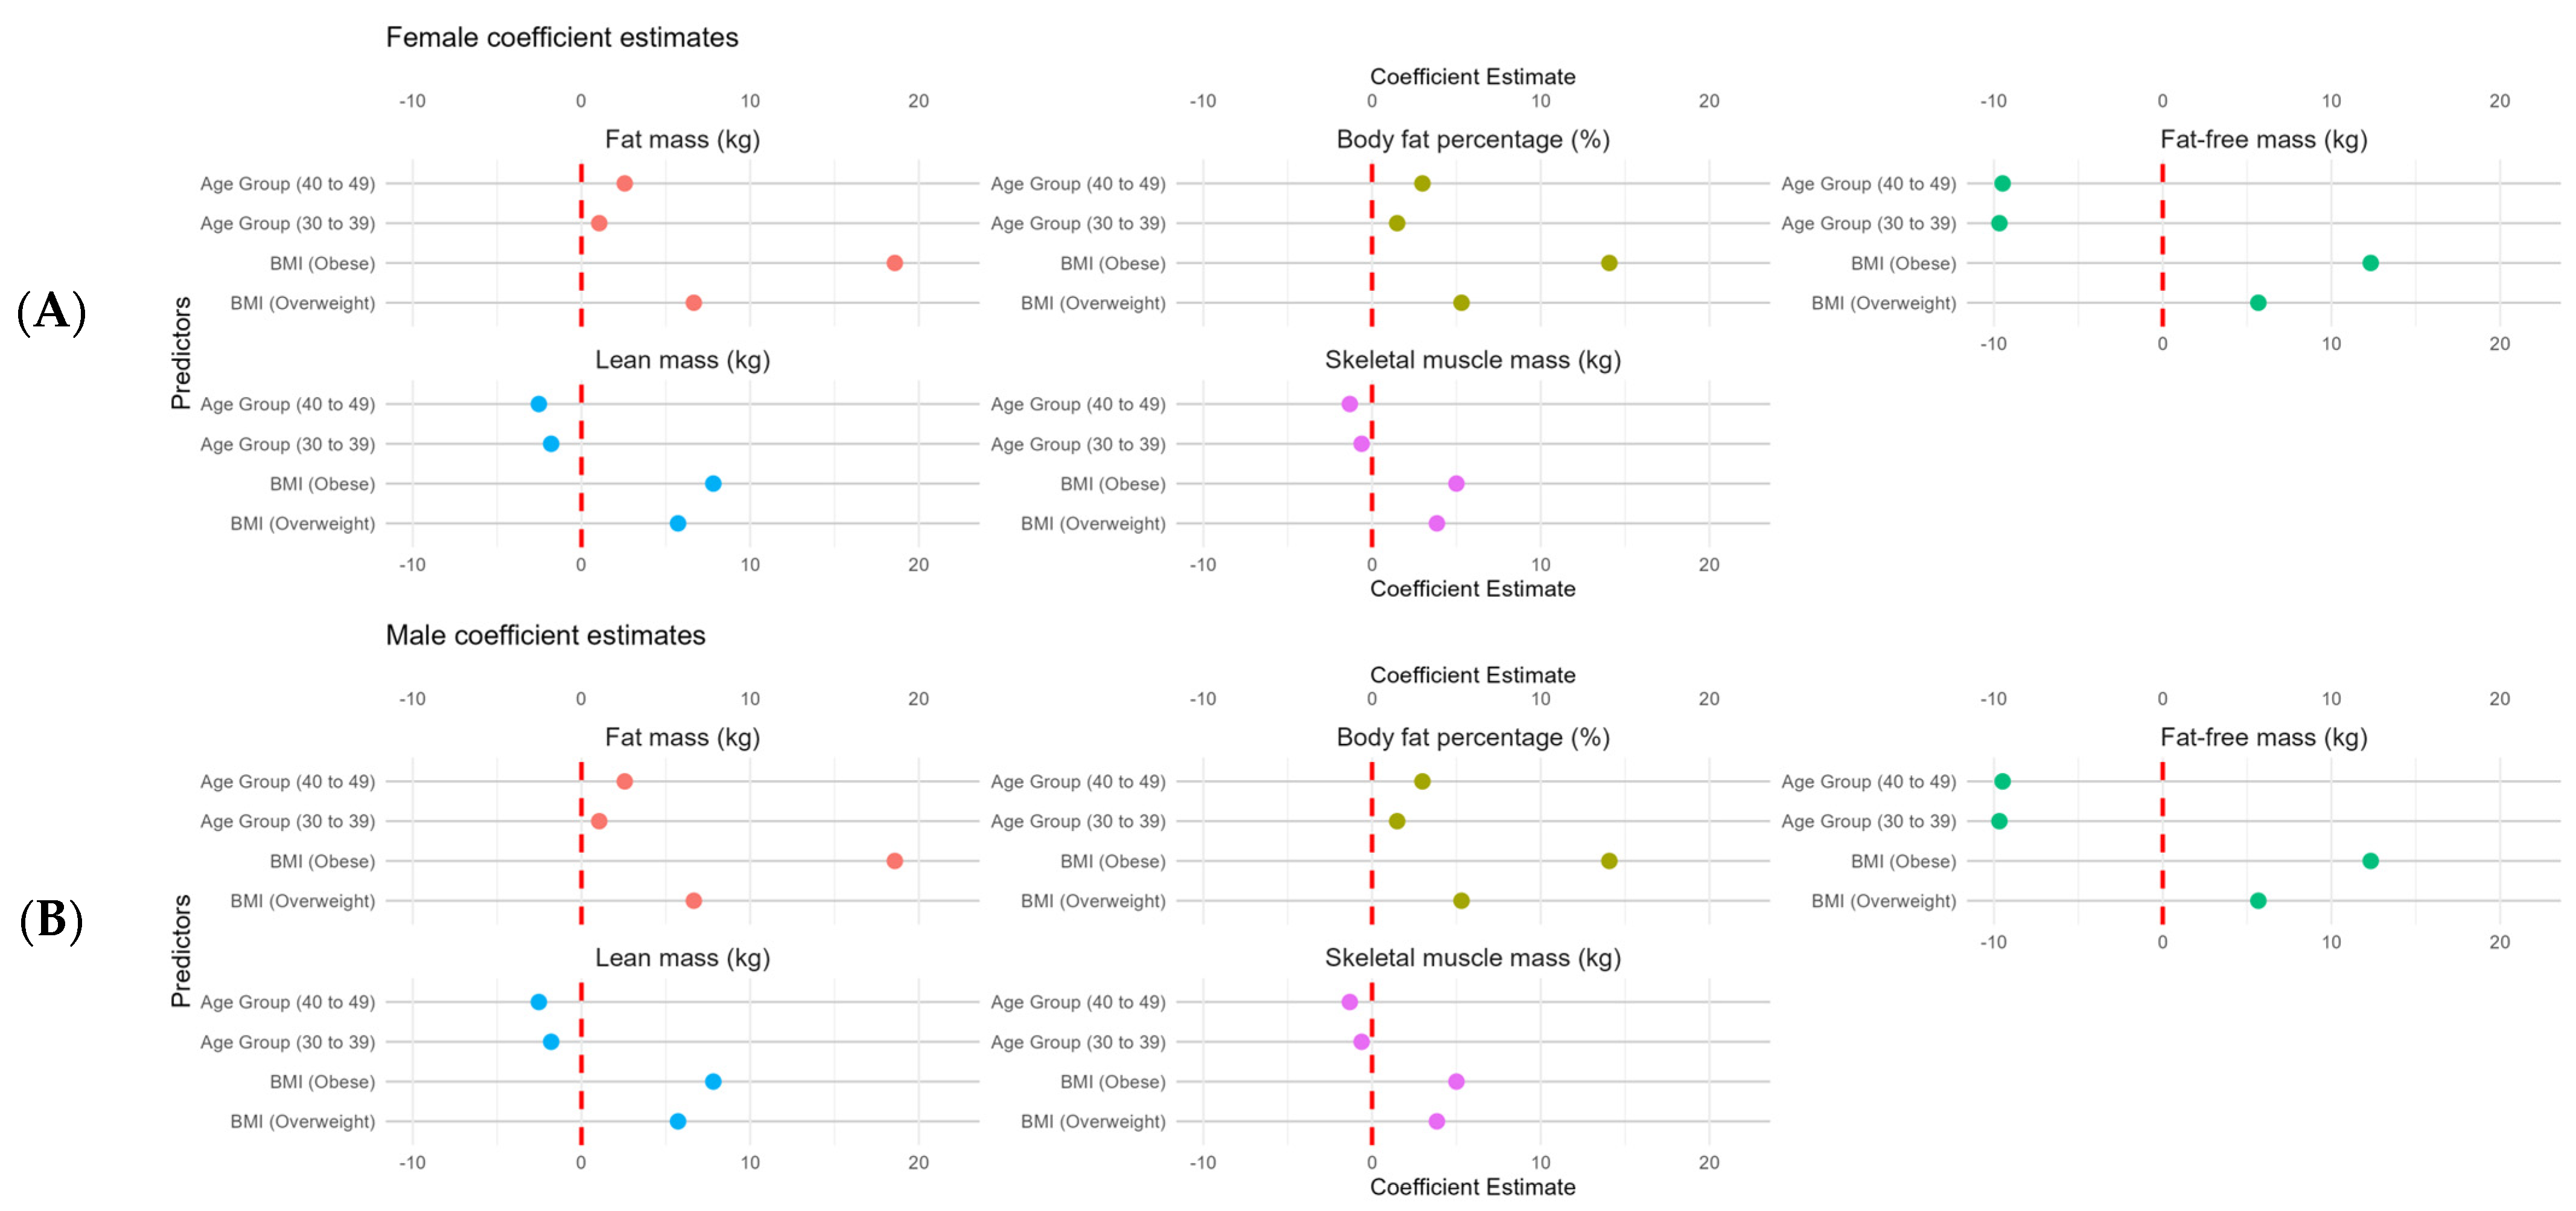
3.2. Body Composition Comparison According to Age and BMI
4. Discussion
5. Limitations and Strengths of the Study
6. Practical Applications
7. Conclusions
Author Contributions
Funding
Institutional Review Board Statement
Informed Consent Statement
Data Availability Statement
Acknowledgments
Conflicts of Interest
References
- Bazzocchi, A. Importance of body composition analysis in clinical nutrition. Front. Nutr. 2023, 9, 1080636. [Google Scholar] [CrossRef] [PubMed]
- Powell-Wiley, T.M.; Poirier, P.; Burke, L.E.; Després, J.P.; Gordon-Larsen, P.; Lavie, C.J.; Lear, S.A.; Ndumele, C.E.; Neeland, I.J.; Sanders, P.; et al. Obesity and cardiovascular disease: A scientific statement from the American Heart Association. Circulation 2021, 143, e984–e1010. [Google Scholar] [CrossRef] [PubMed]
- Oliveira, B.B.R.; Coelho, C.G.; Barreto, S.M.; Giatti, L.; Araújo, L.F. Body fat distribution and its risk for cardiovascular events in 10 years: Brazilian Longitudinal Study of Adult Health (ELSA-Brasil). Cad. Saúde Pública 2022, 38, e00346520. [Google Scholar] [CrossRef] [PubMed]
- Wewege, M.A.; Desai, I.; Honey, C.; Coorie, B.; Jones, M.D.; Clifford, B.K.; Leake, H.B.; Hagstrom, A.D. The effect of resistance training in healthy adults on body fat percentage. fat mass and visceral fat: A systematic review and meta-analysis. Sports Med. 2022, 52, 287–300. [Google Scholar] [CrossRef]
- Branco, B.H.M.; Bernuci, M.P.; Marques, D.C.; Carvalho, I.Z.; Barrero, C.A.L.; Oliveira, F.M.; Ladeia, G.F.; Nardo Júnior, N. Proposal of a normative table for body fat percentages of Brazilian young adults through bioimpedanciometry. J. Exerc. Rehabil. 2018, 14, 974. [Google Scholar] [CrossRef]
- Catapano, A.; Trinchese, G.; Cimmino, F.; Petrella, L.; D’Angelo, M.; Di Maio, G.; Crispino, M.; Cavaliere, G.; Monda, M.; Mollica, M.P. Impedance analysis to evaluate nutritional status in physiological and pathological conditions. Nutrients 2023, 15, 2264. [Google Scholar] [CrossRef]
- Holmes, C.J.; Racette, S.B. The utility of body composition assessment in nutrition and clinical practice: An overview of current methodology. Nutrients 2021, 13, 2493. [Google Scholar] [CrossRef]
- Jayedi, A. Anthropometric and adiposity indicators and risk of type 2 diabetes: Systematic review and dose-response meta-analysis of cohort studies. BMJ 2022, 376, e067516. [Google Scholar] [CrossRef]
- Mohammadian, K.N.; Khashayar, P.; Shahrestanaki, E.; Kelishadi, R.; Nami, S.M.; Heidari-Beni, M.; Abdar, Z.E.; Tabatabaei-Malazy, O.; Qorbani, M. Normal weight obesity and cardiometabolic risk factors: A systematic review and meta-analysis. Front. Endocrinol. 2022, 13, 857930. [Google Scholar] [CrossRef]
- Park, J.H.; Moon, J.H.; Kim, H.J.; Kong, M.H.; Oh, Y.H. Sedentary lifestyle: Overview of updated evidence of potential health risks. Korean J. Fam. Med. 2020, 41, 365. [Google Scholar] [CrossRef]
- Ponti, F.; Santoro, A.; Mercatelli, D.; Gasperini, C.; Conte, M.; Martucci, M.; Sangiorgi, L.; Franceschi, C.; Bazzocchi, A. Aging and Imaging Assessment of Body Composition: From Fat to Facts. Front. Endocrinol. 2020, 10, 861. [Google Scholar] [CrossRef] [PubMed]
- Xie, Y.; Gu, Y.; Li, Z.; He, B.; Zhang, L. Effects of Different Exercises Combined with Different Dietary Interventions on Body Composition: A systematic review and network meta-analysis. Nutrients 2024, 16, 3007. [Google Scholar] [CrossRef] [PubMed]
- Eglseer, D.; Traxler, M.; Embacher, S.; Reiter, L.; Schoufour, J.D.; Weijs, P.J.M.; Voortman, T.; Boirie, Y.; Cruz-Jentoft, A.; Bauer, S. Nutrition and Exercise Interventions to Improve Body Composition for Persons with Overweight or Obesity Near Retirement Age: A systematic review and network meta-analysis of randomized controlled trials. Adv. Nutr. 2023, 14, 516–538. [Google Scholar] [CrossRef] [PubMed]
- Sena, R.P.; Santos, I.C.; de Oliveira, F.M.; Acencio, F.R.; Franco, C.B.; Branco, B.H.M. Establishing a normative table for classifying body fat percentage in adolescents. Rev. Bras. Crescimento Desenvolv. Hum. 2022, 32, 45–53. [Google Scholar] [CrossRef]
- Cerqueira, B.S.; Cerqueira, M.B.; Ferreira, W.C.; De-Oliveira, F.M.; Andreato, L.V.; Dos-Santos-Junior, R.B.; Valdés-Badilla, P.; Branco, B.H.M. Proposal of a Normative Table for Classification of Body Fat Percentage in Brazilian Jiu-Jitsu Athletes. Int. J. Morphol. 2022, 40, 57–61. [Google Scholar] [CrossRef]
- Maffetone, P.B.; Laursen, P.B. The Perfect Storm: Coronavirus (COVID-19) pandemic meets overfat pandemic. Front. Public Health 2020, 8, 135. [Google Scholar] [CrossRef]
- Lee, J.B.; Sung, B.J.; Ko, B.G.; Cho, E.H.; Seo, T.B. A comparative study on the reliability and validity of body composition results by impedance method measurement device. J. Exerc. Rehabil. 2023, 19, 299. [Google Scholar] [CrossRef]
- Liao, Y.-S.; Li, H.-C.; Lu, H.-K.; Lai, C.-L.; Wang, Y.-S.; Hsieh, K.-C. Comparison of bioelectrical impedance analysis and dual energy X-ray absorptiometry for total and segmental bone mineral content with a three-compartment model. Int. J. Environ. Res. Public Health 2020, 17, 2595. [Google Scholar] [CrossRef]
- Tyrovolas, S.; Koyanagi, A.; Olaya, B.; Ayuso-Mateos, J.L.; Miret, M.; Chatterji, S.; Tobiasz-Adamczyk, B.; Koskinen, S.; Leonardi, M.; Haro, J.M. Factors associated with skeletal muscle mass, sarcopenia, and sarcopenic obesity in older adults: A multi-continent study. J. Cachexia Sarcopenia Muscle 2016, 7, 312–321. [Google Scholar] [CrossRef]
- Rodrigues, F.; Domingos, C.; Monteiro, D.; Morouço, P. A review on aging sarcopenia. Falls and resistance training in community-dwelling older adults. Int. J. Environ. Res. Public Health 2022, 19, 874. [Google Scholar] [CrossRef]
- Looney, D.P.; Schafer, E.A.; Chapman, C.L.; Pryor, R.R.; Potter, A.W.; Roberts, B.M.; Friedl, K.E. Reliability, biological variability, and accuracy of multi-frequency bioelectrical impedance analysis for measuring body composition components. Front. Nutr. 2024, 11, 1491931. [Google Scholar] [CrossRef] [PubMed]
- Thomas, J.R.; Nelson, J.K.; Silverman, S.J. Research Methods in Physical Activity, 6th ed.; Human Kinetics Publishers: Champaign, IL, USA, 2011. [Google Scholar]
- Von, E.E.; Altman, D.G.; Egger, M.; Pocock, S.J.; Gøtzsche, P.C.; Vandenbroucke, J.P. The Strengthening the Reporting of Observational Studies in Epidemiology (STROBE) statement: Guidelines for reporting observational studies. J. Clin. Epidemiol. 2008, 61, 344–349. [Google Scholar] [CrossRef]
- Matsudo, S.; Araújo, T.; Matsudo, V.; Andrade, D.; Andrade, E.; Braggion, G. Questionário internacional de atividade f1sica (IPAQ): Estudo de validade e reprodutibilidade no Brasil. Rev. Bras. Ativ. Fís. Saúde 2001, 6, 5–18. [Google Scholar]
- Lohman, T.G.; Roche, A.F.; Martorell, R. Anthropometric Standardization Reference Manual; Human Kinetics: Champaign, IL, USA, 1992. [Google Scholar]
- Ballarin, G.; Monfrecola, F.; Alicante, P.; Chierchia, R.; Marra, M.; Sacco, A.; Scalfi, L. Raw Bioelectrical Impedance Analysis Variables (Impedance Ratio and Phase Angle) and Physical Fitness in Cross-Fit R Athletes. In Proceedings of the 8th International Conference on Sport Sciences Research and Technology Support, Online, 5–6 November 2020; pp. 103–108. [Google Scholar] [CrossRef]
- Campa, F.; Toselli, S.; Mazzilli, M.; Gobbo, L.A.; Coratella, G. Assessment of body composition in athletes: A narrative review of available methods with special reference to quantitative and qualitative bioimpedance analysis. Nutrients 2021, 13, 1620. [Google Scholar] [CrossRef]
- Patil, I. Visualizations with statistical details: The ‘ggstatsplot’ approach. J. Open Source Softw. 2021, 6, 3167. [Google Scholar] [CrossRef]
- Amaral, M.A.; Mundstock, E.; Scarpatto, C.H.; Cañon-Montañez, W.; Mattiello, R. Reference percentiles for bioimpedance body composition parameters of healthy individuals: A cross-sectional study. Clinics 2022, 77, 100078. [Google Scholar] [CrossRef]
- Ofenheimer, A.; Breyer-Kohansal, R.; Hartl, S.; Burghuber, O.C.; Krach, F.; Schrott, A.; Wouters, E.F.M.; Franssen, F.M.E.; Breyer, M.K. Reference values of body composition parameters and visceral adipose tissue (VAT) by DXA in adults aged 18–81 years—Results from the LEAD cohort. Eur. J. Clin. Nutr. 2020, 74, 1181–1191. [Google Scholar] [CrossRef]
- ACSM’s. American College of Sports Medicine Guidelines for Exercise Testing and Prescription, 12th ed.; Lippincott Williams & Wilkins: Philadelphia, PA, USA, 2025; 688p. [Google Scholar]
- Deutz, N.E.P.; Bauer, J.M.; Barazzoni, R.; Biolo, G.; Boirie, Y.; Bosy-Westphal, A.; Cederholm, T.; Cruz-Jentoft, A.; Krznariç, Z.; Nair, K.S. Protein intake and exercise for optimal muscle function with aging: Recommendations from the espen expert group. Clin. Nutr. 2014, 33, 929–936. [Google Scholar] [CrossRef]
- Thomas, D.T.; Erdman, K.A.; Burke, L.M. Position of the Academy of Nutrition and Dietetics. Dietitians of Canada. and the American College of Sports Medicine: Nutrition and Athletic Performance. J. Acad. Nutr. Diet. 2016, 116, 501–528. [Google Scholar] [CrossRef]


| Males (n = 3928) | 18–29 Years (n = 2069) | 30–39 Years (n = 1098) | 40–49 Years (n = 761) | |||
|---|---|---|---|---|---|---|
| Variables | Mean ± SD | Min–Max | Mean ± SD | Min–Max | Mean ± SD | Min–Max |
| Body mass (kg) | 79.6 ± 11.8 | 51.3–115.3 | 83.9 ± 12.5 | 51.6–110.0 | 87.6 ± 11.3 | 55.1–109.9 |
| Height (cm) | 176.7 ± 7.1 | 150.0–206.0 | 175.6 ± 6.6 | 152.0–199.0 | 175.5 ± 6.5 | 150.0–196.0 |
| BMI (kg/m2) | 25.5 ± 3.4 | 18.5–37.7 | 27.1 ± 3.5 | 18.5–39.3 | 28.2 ± 3.3 | 19.3–39.0 |
| FM (kg) | 16.2 ± 8.2 | 1.9–53.8 | 19.9 ± 8.2 | 2.5–50.9 | 23.0 ± 8.7 | 4.7–53.4 |
| BFP (%) | 19.7 ± 7.9 | 3.0–51.6 | 23.3 ± 7.4 | 3.0–51.4 | 26.0 ± 7.8 | 5.4–51.0 |
| FFM (kg) | 54.3 ± 21.7 | 2.1–95.5 | 46.3 ± 24.7 | 3.0–97.0 | 47.8 ± 23.4 | 3.9–90.9 |
| LM (kg) | 59.0 ± 7.9 | 26.3–89.9 | 58.6 ± 8.4 | 32.1–90.9 | 58.7 ± 7.4 | 41.3–85.9 |
| SMM (kg) | 36.1 ± 5.1 | 14.1–55.6 | 36.4 ± 5.3 | 20.5–56.5 | 36.3 ± 4.7 | 24.0–52.5 |
| Females (n = 4628) | 18–29 Years (n = 2179) | 30–39 Years (n = 1237) | 40–49 Years (n = 1212) | |||
|---|---|---|---|---|---|---|
| Variables | Mean ± SD | Min–Max | Mean ± SD | Min–Max | Mean ± SD | Min–Max |
| Body mass (kg) | 65.7 ± 12.1 | 45.0–110.2 | 72.2 ± 14.5 | 45.9–110.0 | 74.6 ± 13.9 | 46.5–110.0 |
| Height (cm) | 163.9 ± 6.6 | 145.0–190.0 | 164.1 ± 6.2 | 147.5–195.0 | 162.2 ± 6.6 | 138.0–187.0 |
| BMI (kg/m2) | 24.6 ± 4.0 | 18.5–39.5 | 26.7 ± 5.0 | 18.6–39.9 | 28.3 ± 5.1 | 18.7–39.9 |
| FM (kg) | 21.7 ± 9.1 | 3.4–57.1 | 26.2 ± 11.0 | 4.4–56.4 | 29.2 ± 10.9 | 5.4–11.8 |
| BFP (%) | 31.8 ± 8.5 | 4.0–54.0 | 32.5 ± 10.6 | 5.9–56.5 | 37.9 ± 8.3 | 9.0–53.8 |
| FFM (kg) | 40.0 ± 10.8 | 5.6–83.0 | 38.1 ± 14.7 | 4.6–72.4 | 40.5 ± 12.3 | 2.8–65.4 |
| LM (kg) | 40.5 ± 5.7 | 25.2–78.1 | 42.2 ± 6.4 | 26.9–68.4 | 42.1 ± 5.2 | 28.2–61.6 |
| SMM (kg) | 27.6 ± 10.7 | 14.9–76.2 | 25.3 ± 4.0 | 14.8–44.3 | 24.9 ± 3.2 | 15.8–36.6 |
| Percentiles | p3 | p10 | p25 | p50 | p75 | p90 | p97 |
|---|---|---|---|---|---|---|---|
| Fat mass (kg) percentiles | |||||||
| 18–29 years | 5.8–7.6 | 7.7–10.2 | 10.3–14.0 | 14.1–19.7 | 19.8–27.9 | 28.0–37.0 | ≥37.1 |
| 30–39 years | 7.9–10.6 | 10.7–13.8 | 13.9–18.5 | 18.6–24.7 | 24.8–31.0 | 31.1–35.5 | ≥35.4 |
| 40–49 years | 9.7–12.3 | 12.4–16.1 | 16.2–21.8 | 21.9–29.2 | 29.3–35.2 | 35.3–40.2 | ≥40.3 |
| Body fat percentage percentiles | |||||||
| 18–29 years | 8.6–10.8 | 10.9–13.7 | 13.8–18.0 | 18.1–24.1 | 24.2–30.7 | 30.8–38.3 | ≥38.4 |
| 30–39 years | 10.5–13.8 | 13.9–17.7 | 17.8–22.8 | 22.9–28.1 | 28.2–33.1 | 33.2–35.9 | ≥36.0 |
| 40–49 years | 13.1–16.0 | 16.1–19.8 | 19.9–25.7 | 25.8–31.6 | 31.7–36.2 | 36.3–41.1 | ≥41.2 |
| Fat-free mass (kg) percentiles | |||||||
| 18–29 years | 5.7–10.9 | 11.0–52.5 | 52.6–60.7 | 60.8–67.1 | 67.2–73.2 | 73.3–80.0 | ≥80.1 |
| 30–39 years | 7.2–10.1 | 10.2–17.9 | 18.0–55.6 | 55.7–65.7 | 65.8–73.4 | 73.5–77.3 | ≥77.4 |
| 40–49 years | 7.8–11.2 | 11.3–21.5 | 21.6–56.9 | 57.0–65.2 | 65.3–73.2 | 73.3–79.0 | ≥79.1 |
| Lean mass (kg) percentiles | |||||||
| 18–29 years | 45.1–49.4 | 49.5–53.6 | 53.7–58.5 | 58.6–63.7 | 63.8–69.6 | 69.7–75.5 | ≥75.6 |
| 30–39 years | 44.7–47.2 | 47.3–52.3 | 52.4–58.4 | 58.5–63.9 | 64.0–69.7 | 69.8–72.9 | ≥73.0 |
| 40–49 years | 46.7–49.6 | 49.7–53.0 | 53.1–57.5 | 57.6–63.6 | 63.7–69.6 | 69.7–74.4 | ≥74.5 |
| Skeletal muscle mass (kg) percentiles | |||||||
| 18–29 years | 27.4–29.9 | 30.0–32.6 | 32.7–35.9 | 36.0–39.2 | 39.3–42.7 | 42.8–46.7 | ≥46.8 |
| 30–39 years | 26.8–29.3 | 29.4–32.7 | 32.8–36.3 | 36.4–39.9 | 40.0–43.5 | 43.6–45.3 | ≥45.4 |
| 40–49 years | 28.1–30.2 | 30.3–33.1 | 33.2–35.8 | 35.9–39.0 | 39.1–43.3 | 43.6–45.3 | ≥45.4 |
| Percentiles | p3 | p10 | p25 | p50 | p75 | p90 | p97 |
|---|---|---|---|---|---|---|---|
| Fat mass (kg) percentiles | |||||||
| 18–29 years | 9.3–11.9 | 12.0–14.9 | 15.0–19.9 | 20.0–26.8 | 29.9–34.1 | 34.2–43.8 | ≥43.9 |
| 30–39 years | 10.6–13.1 | 13.2–17.6 | 17.7–24.3 | 24.4–33.4 | 33.5–43.1 | 43.2–50.3 | ≥50.4 |
| 40–49 years | 11.8–16.2 | 16.3–20.8 | 20.9–27.9 | 28.0–36.9 | 37.0–45.1 | 45.2–50.8 | ≥50.9 |
| Body fat percentage percentiles | |||||||
| 18–29 years | 15.3–20.9 | 21.0–25.9 | 26.0–32.1 | 32.2–37.5 | 37.6–42.5 | 42.6–48.4 | ≥48.5 |
| 30–39 years | 13.2–17.8 | 17.9–24.2 | 24.3–32.9 | 33.0–40.7 | 40.8–47.6 | 47.7–51.0 | ≥51.1 |
| 40–49 years | 20.8–26.8 | 26.9–32.3 | 32.4–38.1 | 38.2–44.4 | 44.5–49.1 | 49.2–51.5 | ≥51.6 |
| Fat-free mass (kg) percentiles | |||||||
| 18–29 years | 12.2–20.3 | 20.4–25.9 | 26.0–32.1 | 32.2–37.5 | 37.6–42.5 | 42.6–48.4 | ≥48.5 |
| 30–39 years | 7.4–12.3 | 12.4–31.6 | 31.7–41.8 | 41.9–47.3 | 47.4–53.2 | 53.3–60.2 | ≥60.3 |
| 40–49 years | 7.9–15.7 | 15.8–38.6 | 38.7–43.7 | 43.8–47.9 | 48.0–51.6 | 51.7–55.0 | ≥55.1 |
| Lean mass (kg) percentiles | |||||||
| 18–29 years | 30.9–33.8 | 33.9–36.6 | 36.7–39.7 | 39.8–43.9 | 44.0–47.8 | 47.9–52.5 | ≥52.6 |
| 30–39 years | 32.3–35.3 | 35.4–37.6 | 37.7–40.9 | 41.0–45.6 | 45.7–50.5 | 50.6–57.5 | ≥57.6 |
| 40–49 years | 32.9–35.6 | 35.7–38.1 | 38.2–41.9 | 42.0–45.5 | 45.6–48.6 | 48.7–51.8 | ≥51.9 |
| Skeletal muscle mass (kg) percentiles | |||||||
| 18–29 years | 18.4–19.8 | 19.9–21.7 | 21.8–24.2 | 24.3–27.8 | 27.9–40.7 | 40.8–60.7 | ≥60.8 |
| 30–39 years | 19.3–20.8 | 20.9–22.4 | 22.5–24.6 | 24.7–27.4 | 27.5–30.3 | 30.4–34.4 | ≥34.5 |
| 40–49 years | 19.3–20.8 | 20.9–22.5 | 22.6–24.7 | 24.8–27.0 | 27.1–29.3 | 29.4–30.9 | ≥31.0 |
Disclaimer/Publisher’s Note: The statements, opinions and data contained in all publications are solely those of the individual author(s) and contributor(s) and not of MDPI and/or the editor(s). MDPI and/or the editor(s) disclaim responsibility for any injury to people or property resulting from any ideas, methods, instructions or products referred to in the content. |
© 2025 by the authors. Licensee MDPI, Basel, Switzerland. This article is an open access article distributed under the terms and conditions of the Creative Commons Attribution (CC BY) license (https://creativecommons.org/licenses/by/4.0/).
Share and Cite
Barbão, K.E.G.; Pavanello, A.; Oliveira, F.M.; Santos, N.Q.; Valdés-Badilla, P.; Marchiori, L.L.M.; Franchini, E.; Branco, B.H.M. Variation in Body Composition Components Across Different Age Groups and Proposal of Age-Specific Normative Tables: A Cross-Sectional Study. Nutrients 2025, 17, 1435. https://doi.org/10.3390/nu17091435
Barbão KEG, Pavanello A, Oliveira FM, Santos NQ, Valdés-Badilla P, Marchiori LLM, Franchini E, Branco BHM. Variation in Body Composition Components Across Different Age Groups and Proposal of Age-Specific Normative Tables: A Cross-Sectional Study. Nutrients. 2025; 17(9):1435. https://doi.org/10.3390/nu17091435
Chicago/Turabian StyleBarbão, Kleber E. G., Audrei Pavanello, Fabiano M. Oliveira, Natalia Q. Santos, Pablo Valdés-Badilla, Luciana L. M. Marchiori, Emerson Franchini, and Braulio H. M. Branco. 2025. "Variation in Body Composition Components Across Different Age Groups and Proposal of Age-Specific Normative Tables: A Cross-Sectional Study" Nutrients 17, no. 9: 1435. https://doi.org/10.3390/nu17091435
APA StyleBarbão, K. E. G., Pavanello, A., Oliveira, F. M., Santos, N. Q., Valdés-Badilla, P., Marchiori, L. L. M., Franchini, E., & Branco, B. H. M. (2025). Variation in Body Composition Components Across Different Age Groups and Proposal of Age-Specific Normative Tables: A Cross-Sectional Study. Nutrients, 17(9), 1435. https://doi.org/10.3390/nu17091435