
Impact of Maternal Metabolic Status on Human Milk Oligosaccharide Composition: A Population-Based Cross-Sectional Study in Central South China

 , and
, and Highlights
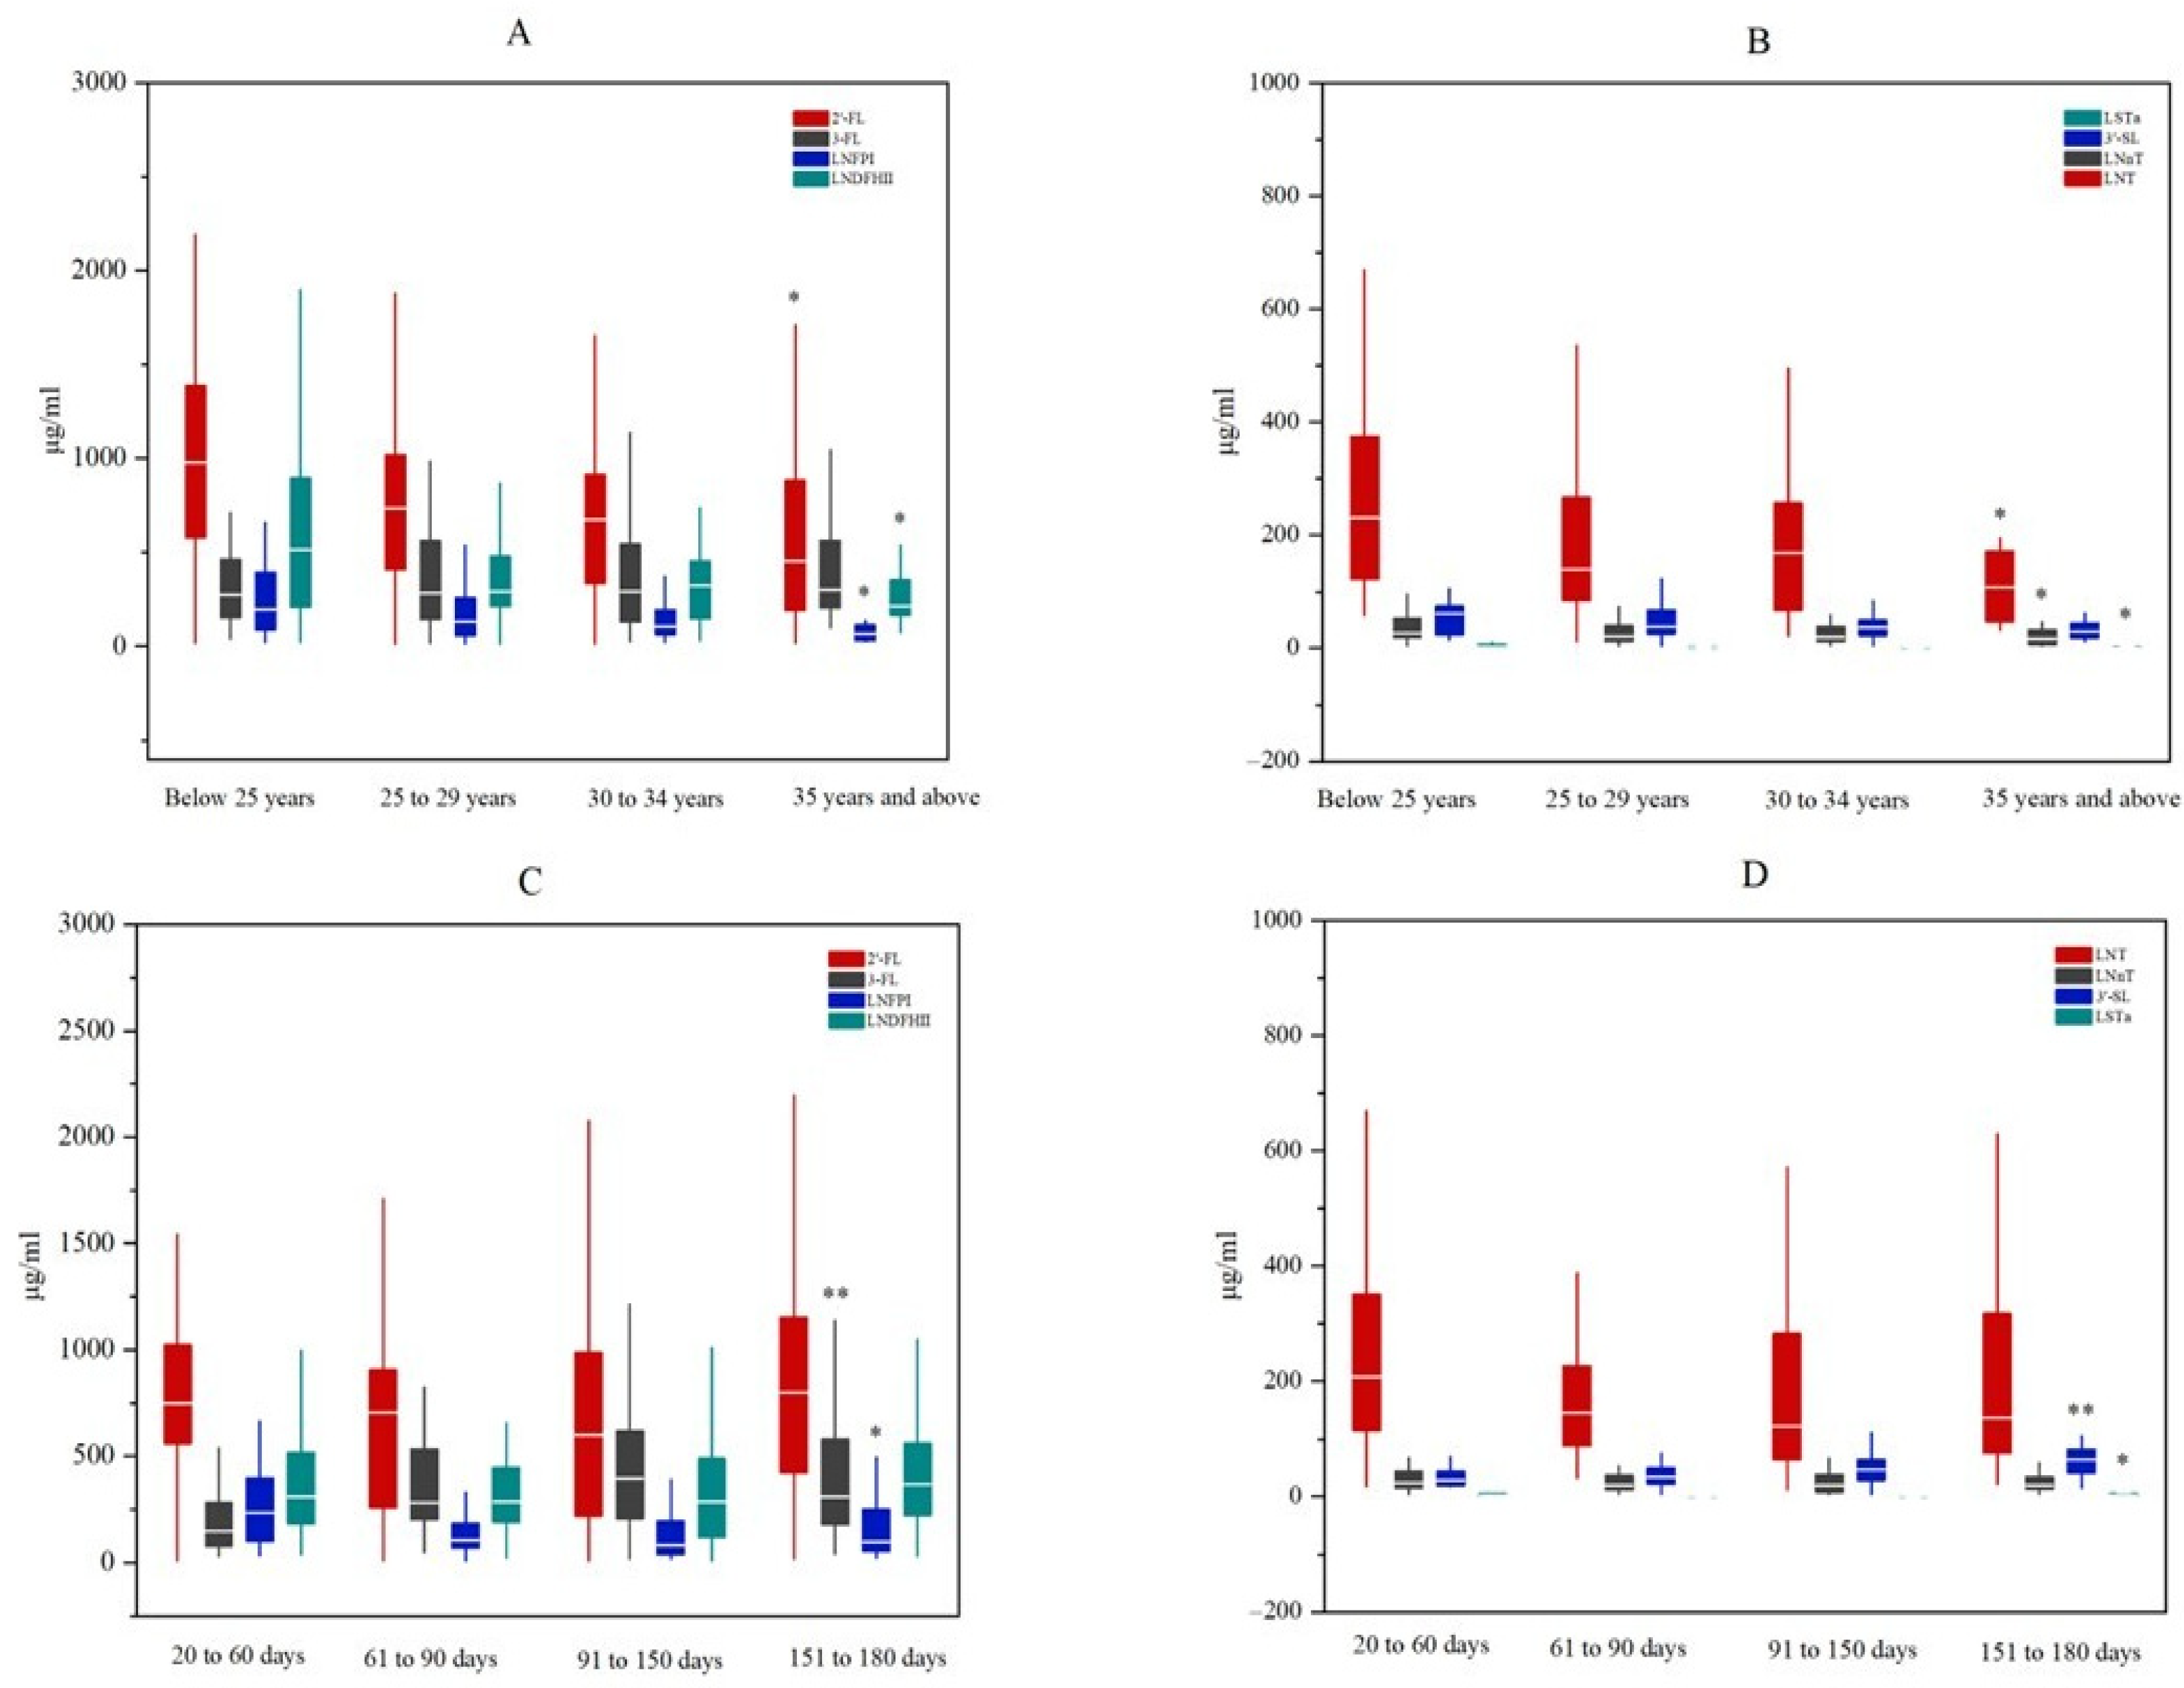
- The variations in several human milk oligosaccharides (HMOs) among mothers from South Central China were associated with maternal age and lactation period.
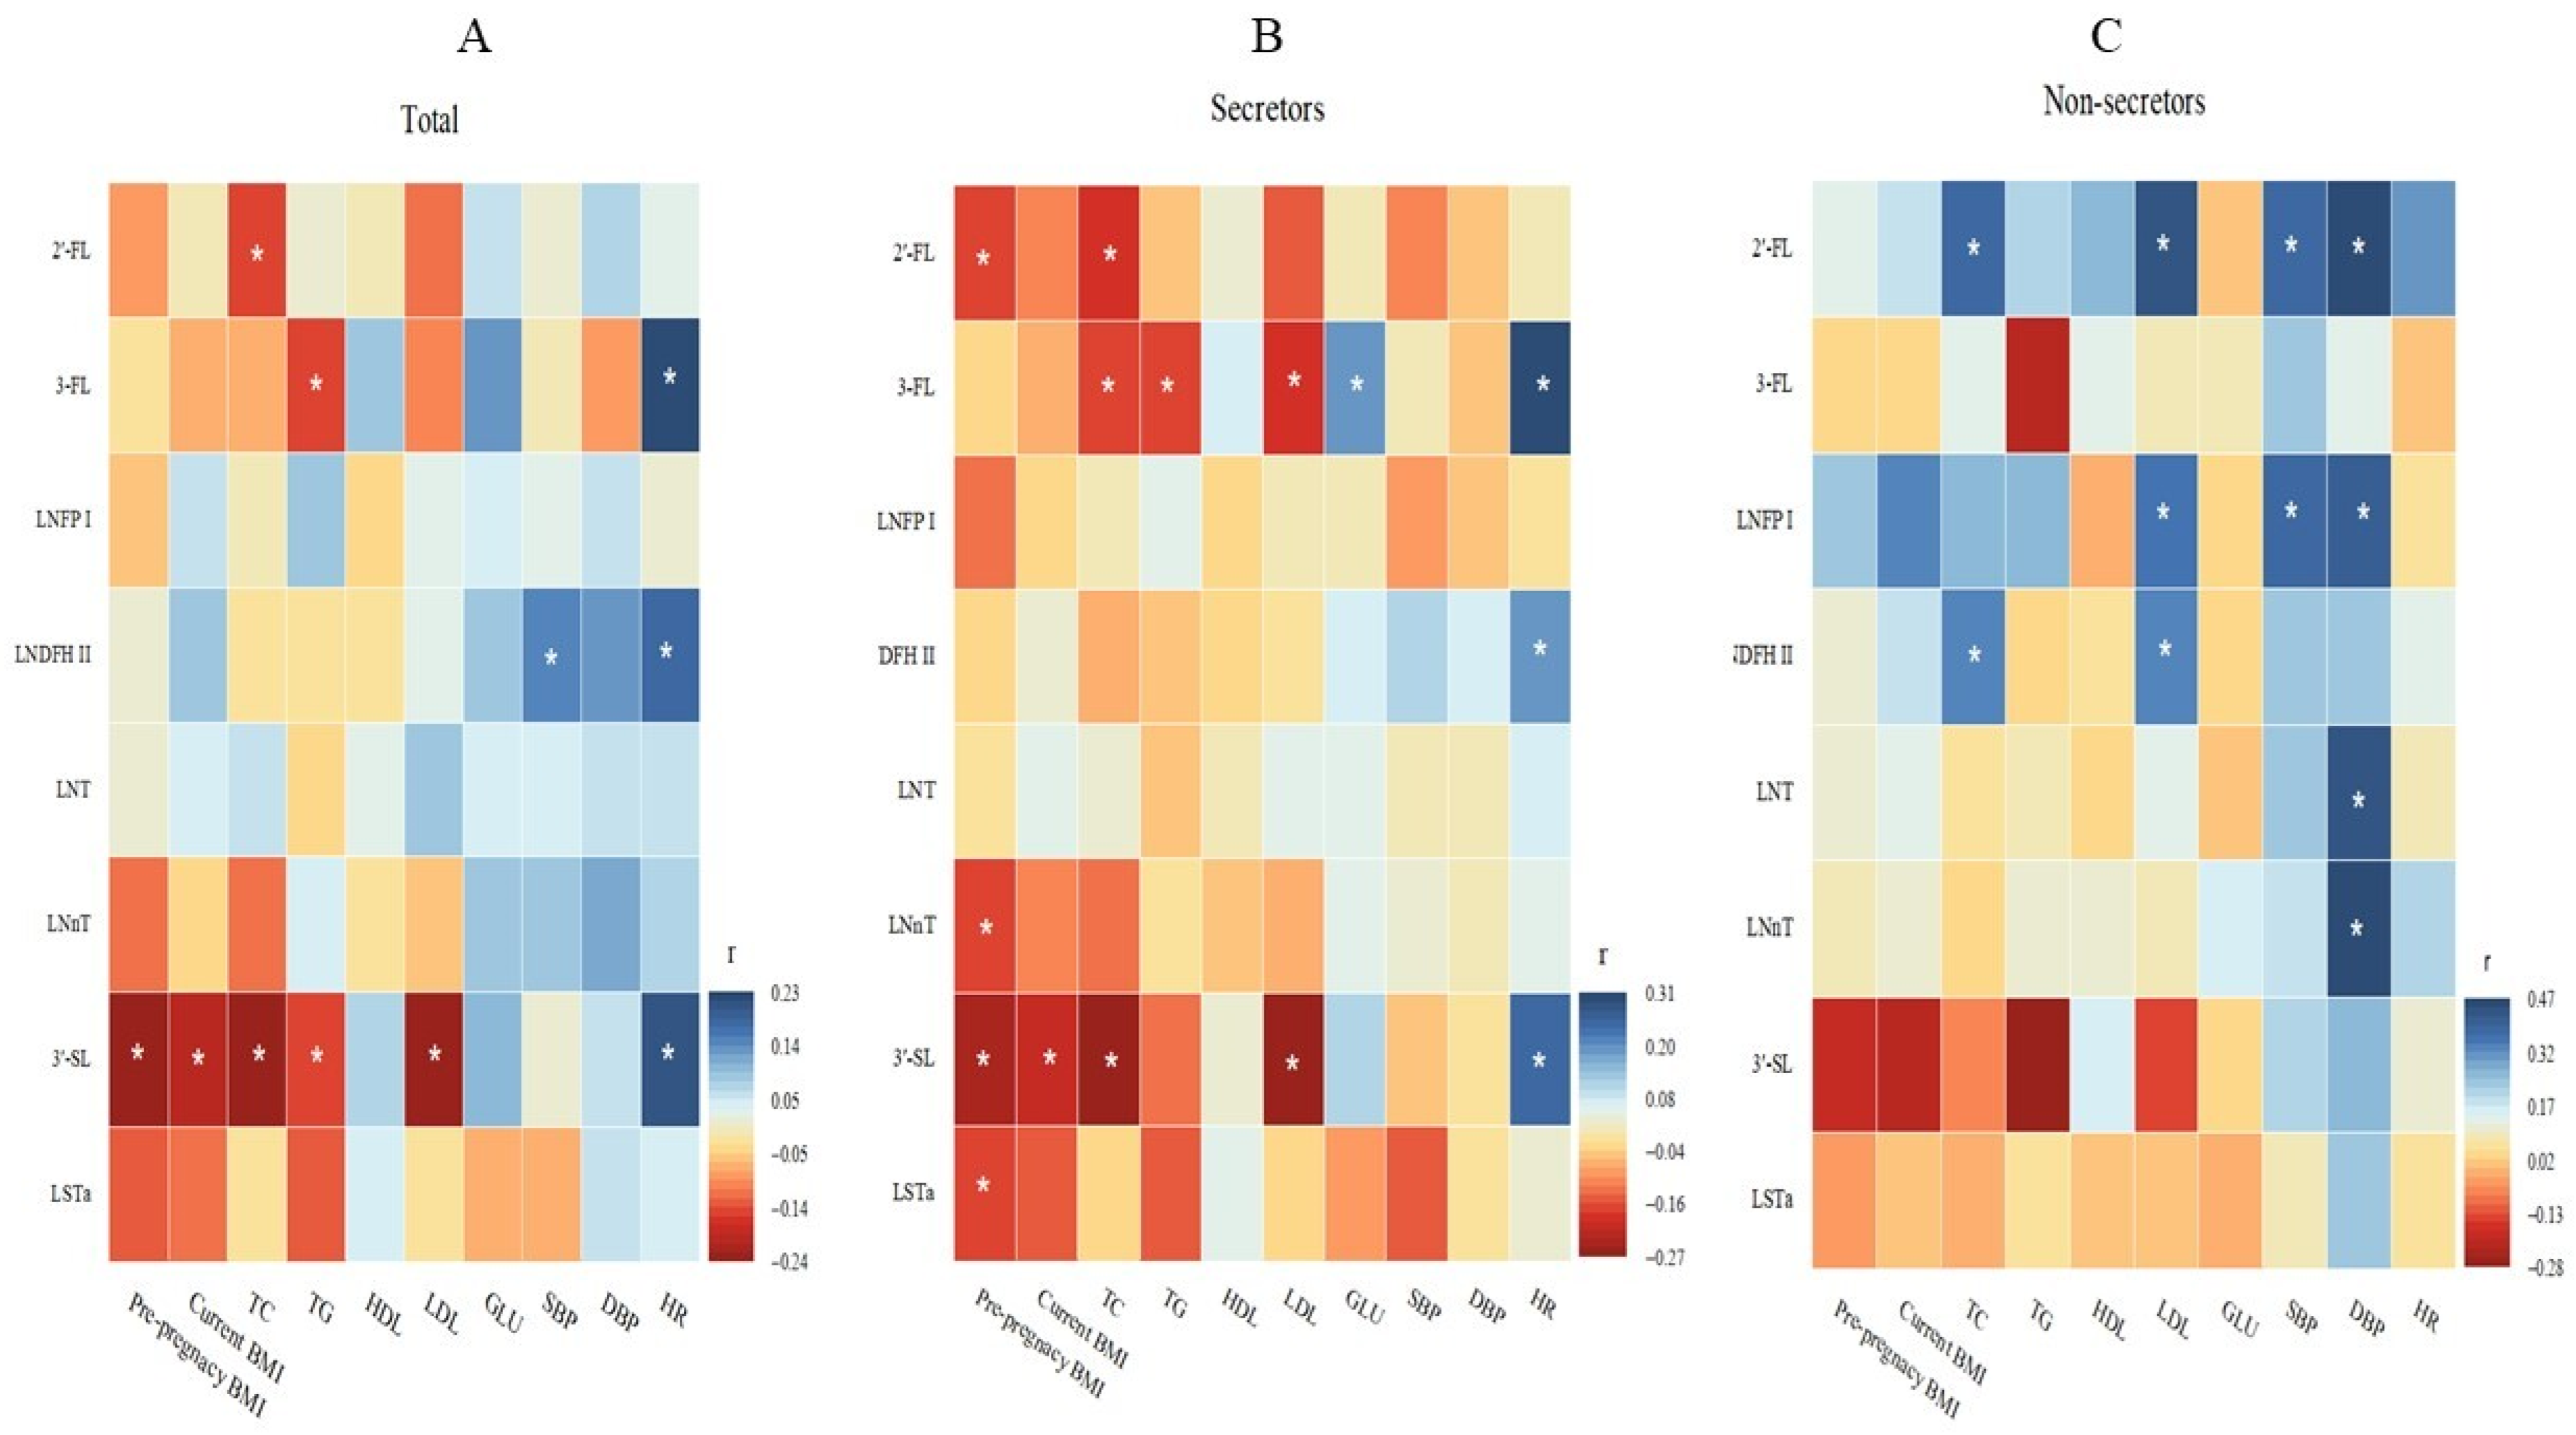
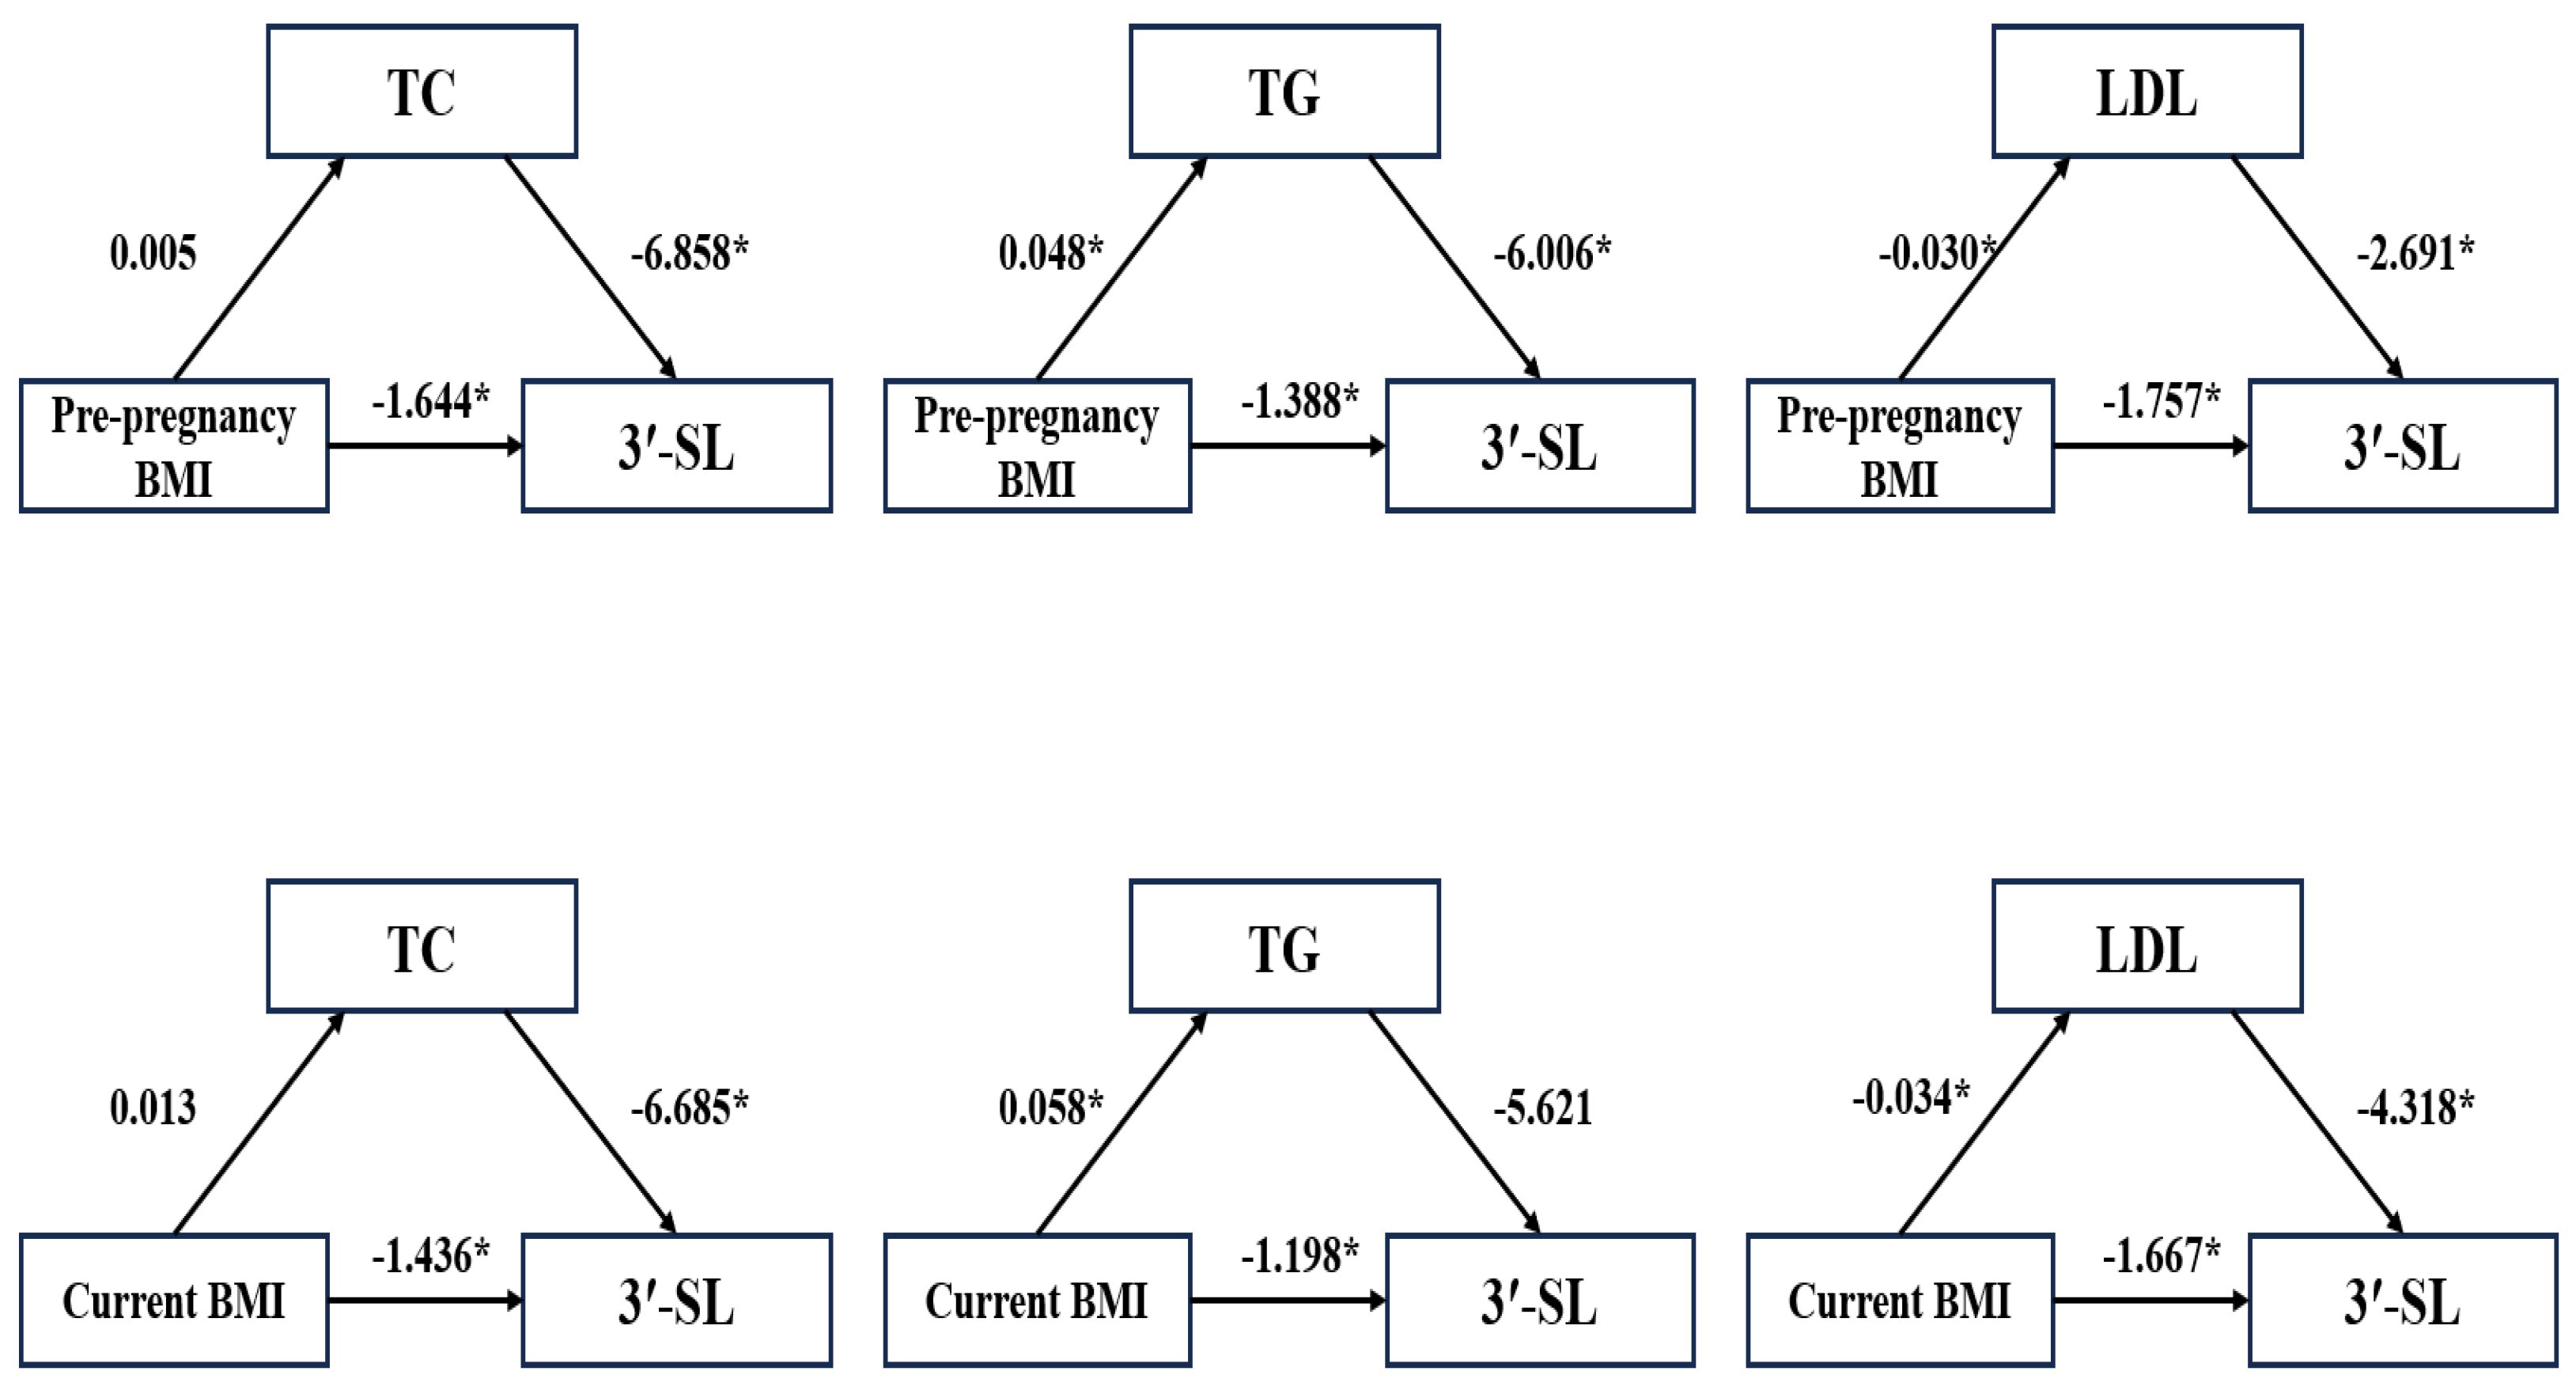
- The concentration of 3′-Sialyllactose (3′-SL) was negatively correlated with maternal pre-pregnancy BMI.
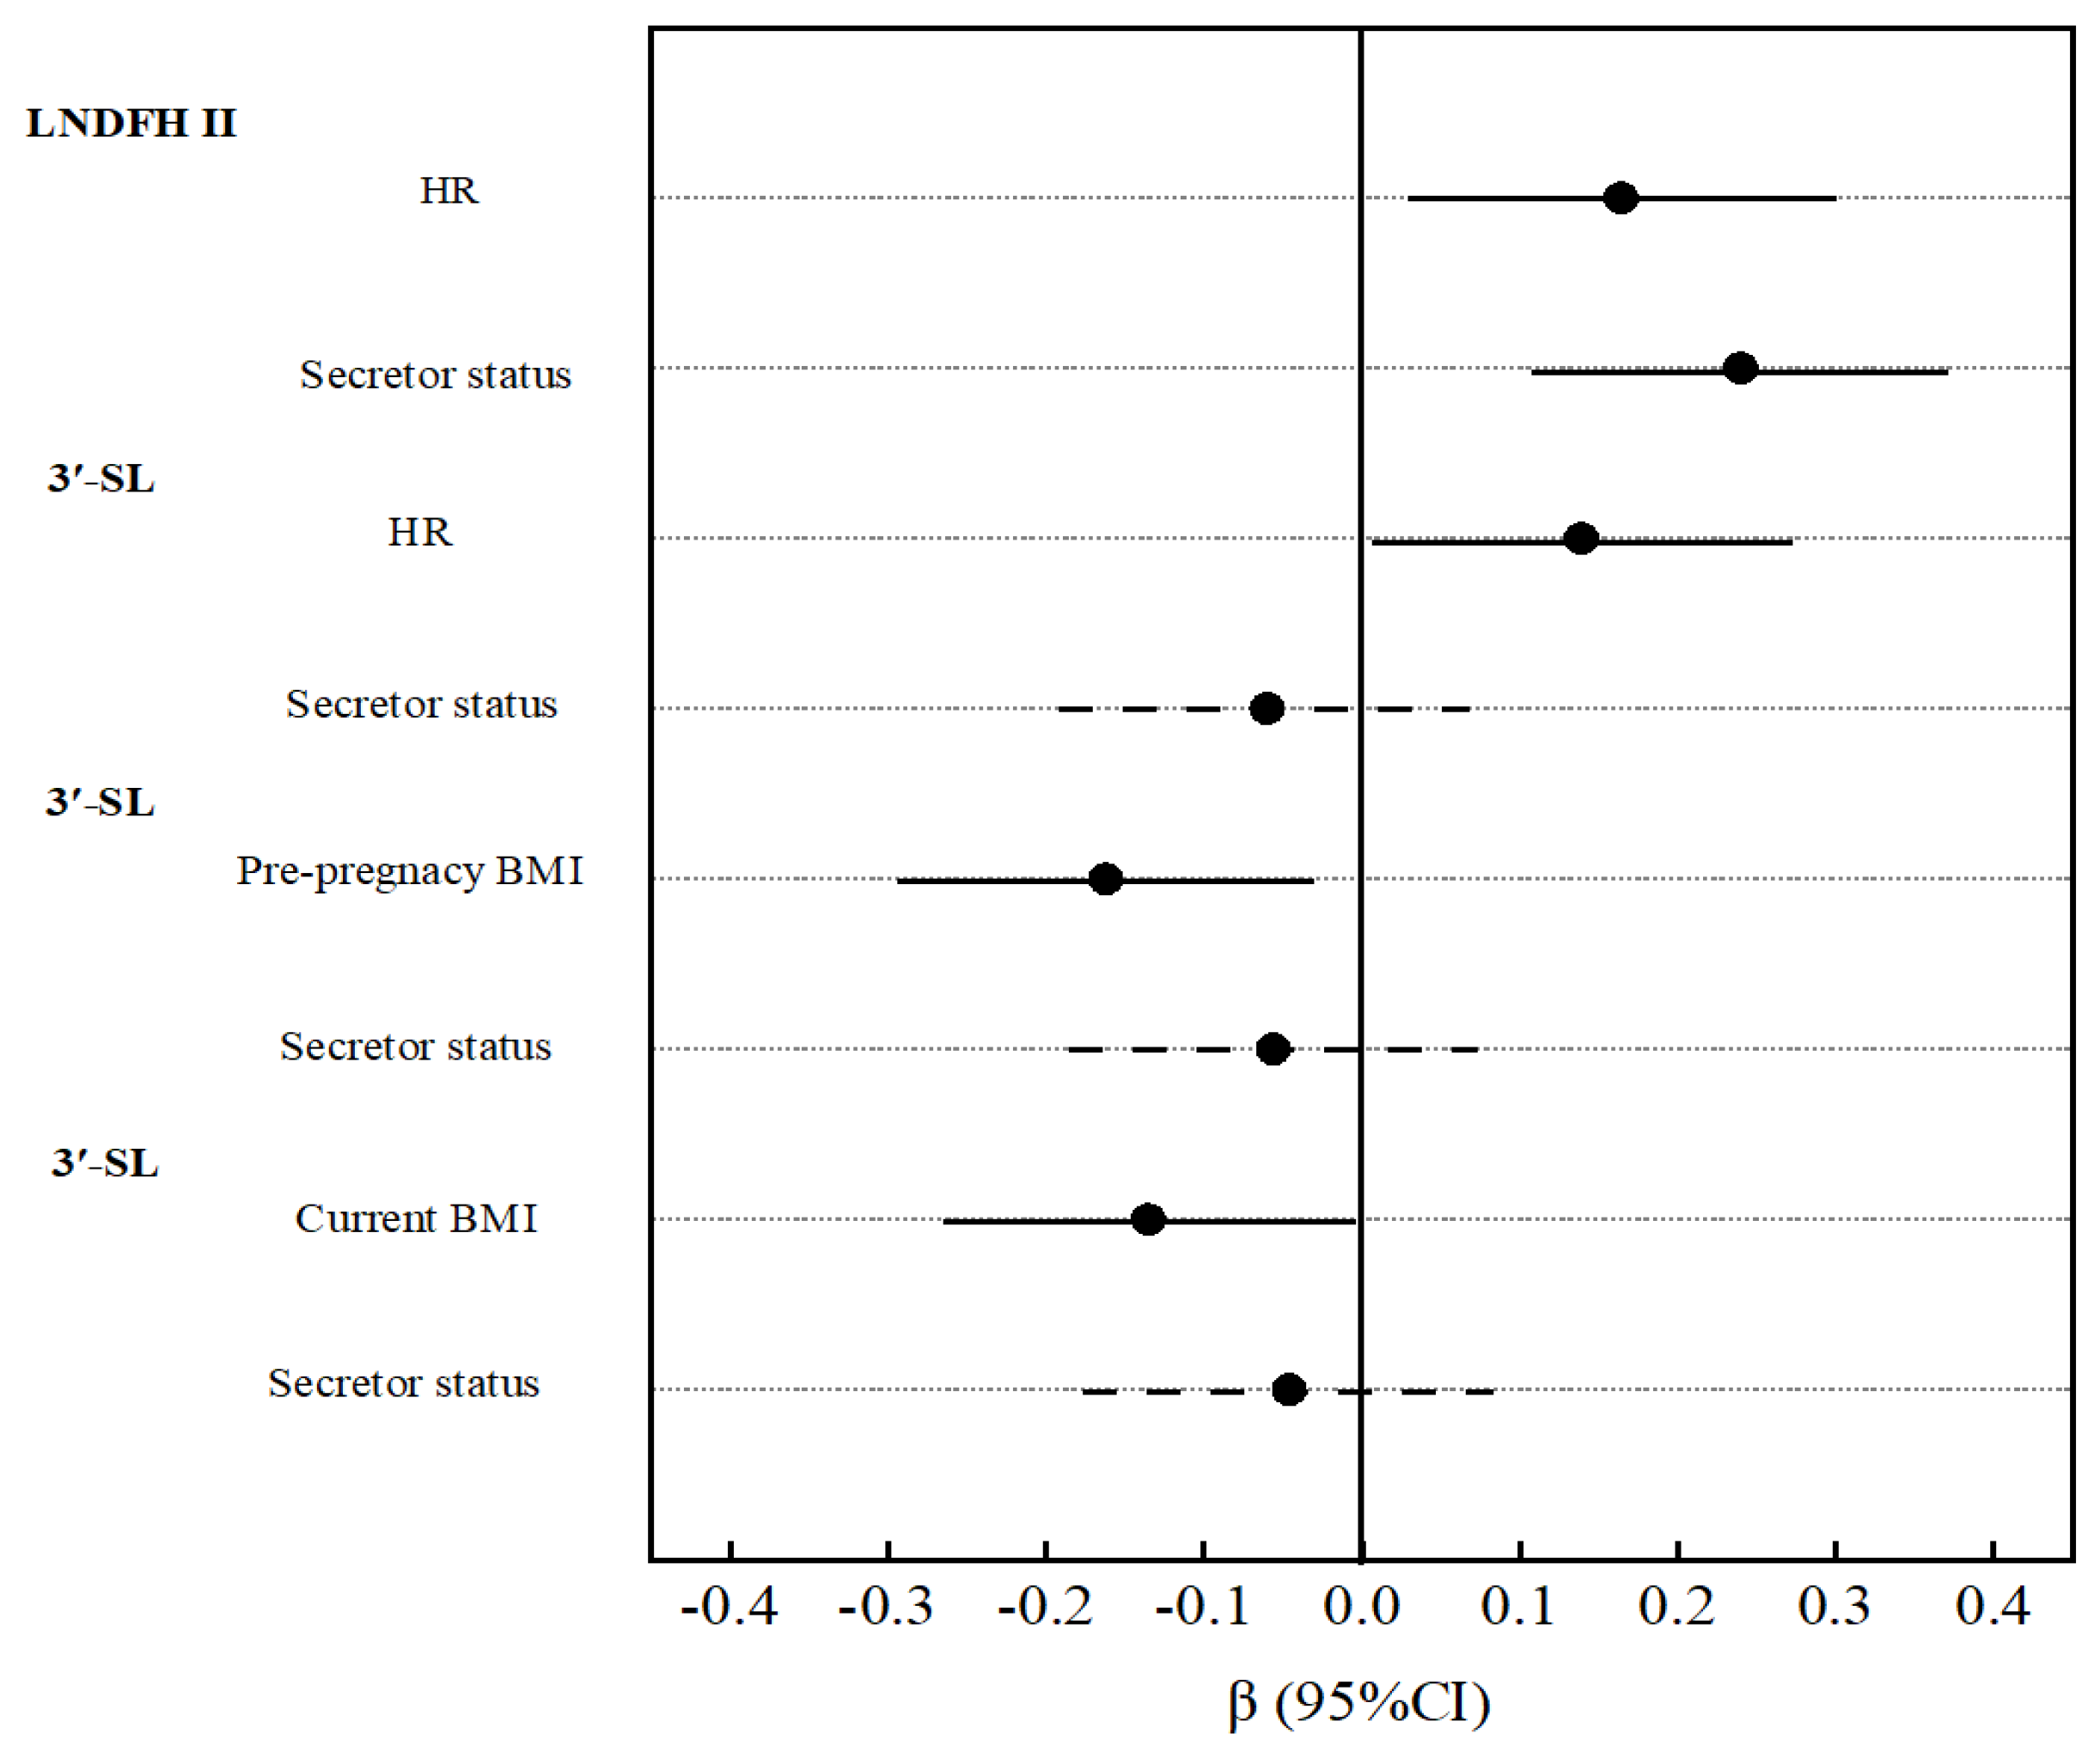
- The potential mechanism underlying the influence of maternal BMI on 3′-SL levels may involve maternal lipid metabolism and genetic factors.
Abstract
1. Introduction
2. Materials and Methods
2.1. Study Design and Participants
2.2. HMO Analysis
2.3. Metabolic Factors
2.4. Exposure Variables
2.5. Statistical Analysis
3. Results
3.1. Participant Demographic Characteristics
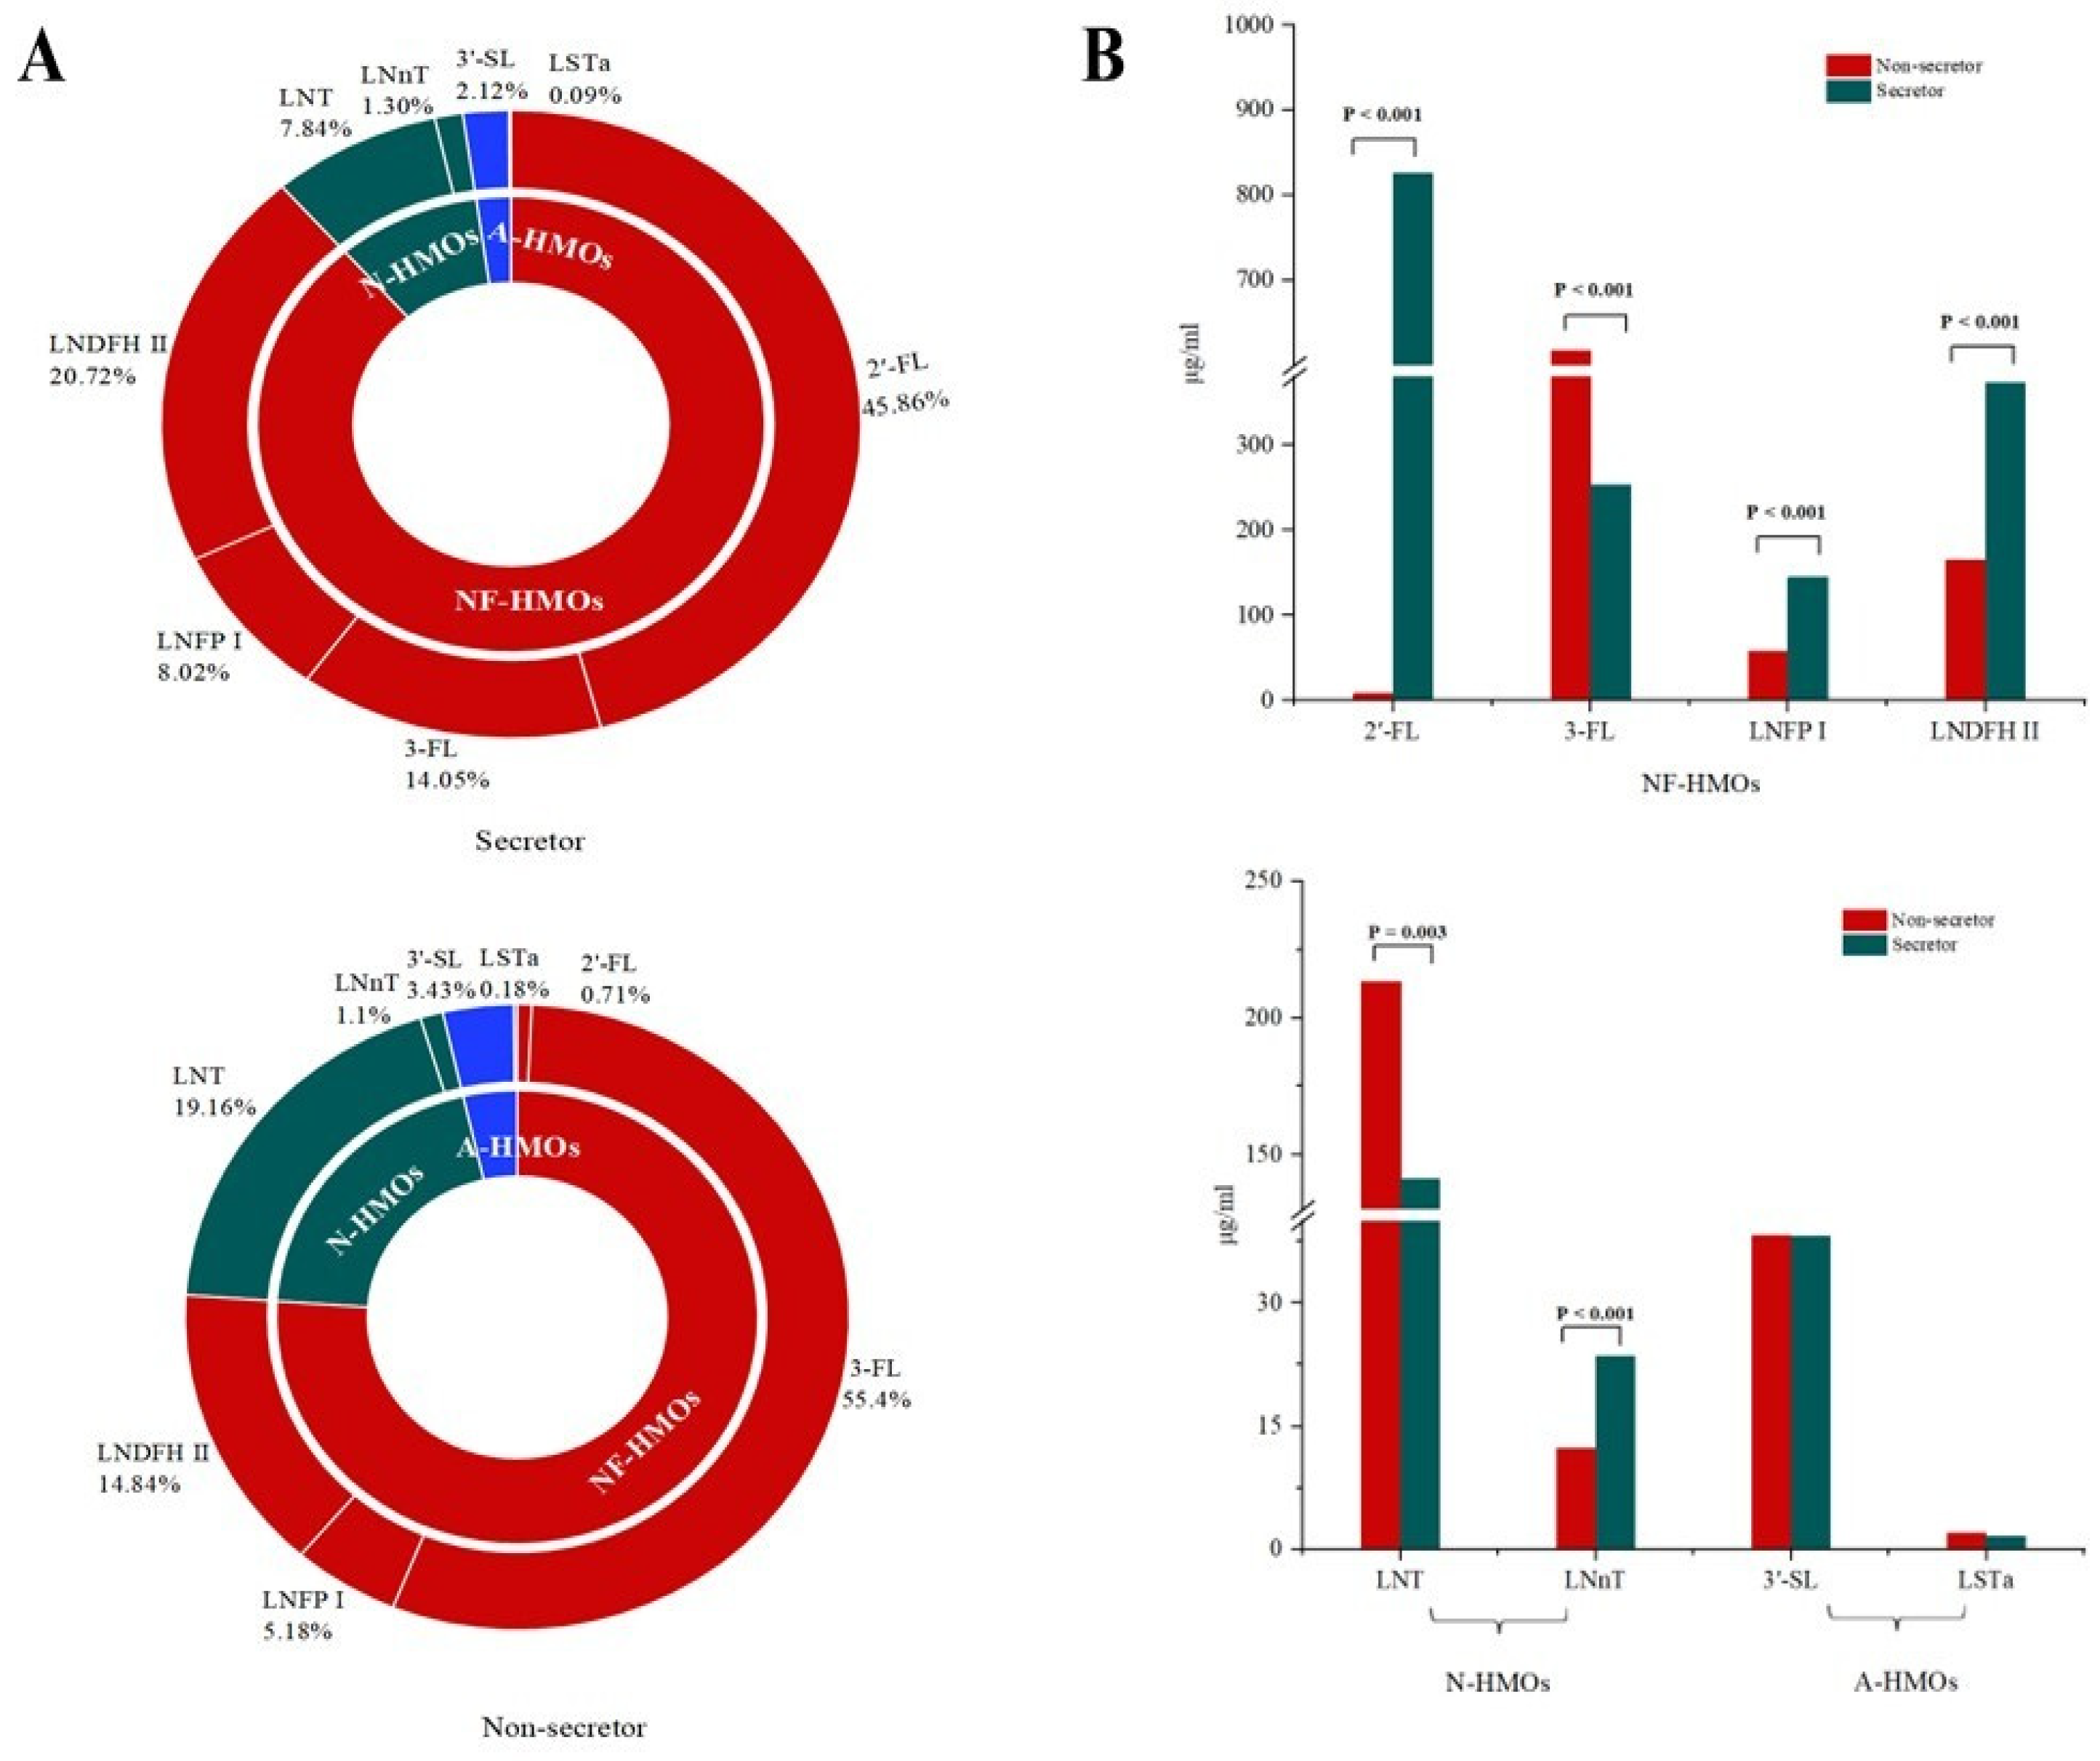
3.2. Oligosaccharides in Breast Milk
3.3. Association of Maternal Metabolic Factors with Oligosaccharides
3.4. Mediating Effect of Maternal Metabolic Factors with Oligosaccharides
4. Discussion
5. Conclusions
Supplementary Materials
Author Contributions
Funding
Institutional Review Board Statement
Informed Consent Statement
Data Availability Statement
Conflicts of Interest
Abbreviations
| HMOs | Human milk oligosaccharides |
| Se | Secretor status |
| BMI | Body mass index |
| LC-MS/MS | Tandem mass spectrometry |
| 2′-FL | 2′-Fucosyllactose |
| 3-FL | 3-Fucosyllactose |
| LNT | Lacto-N-tetracose |
| LNnT | Lac-to-N-neotetraose |
| LNFP-I | N-fucopentaose I |
| LNDFH-II | Lacto-N-difucosylhexaose II |
| 3′-SL | 3′-Sialyllactose |
| LSTa | Sialyllacto-N-tetraose a |
| SBP | Systolic blood pressure |
| DBP | Diastolic blood pressure |
| HR | Heart rate |
| GLU | Glucose |
| TG | Triglycerides |
| CHOL | Cholesterol |
| HDL-C | High-density lipoprotein cholesterol |
| LDL-C | Low-density lipoprotein cholesterol |
| IQR | Interquartile range |
References
- Meek, J.Y.; Noble, L. Policy Statement: Breastfeeding and the Use of Human Milk. Pediatrics 2022, 150, e2022057988. [Google Scholar] [CrossRef] [PubMed]
- Chinese Society of Food Science and Technology. Scientific consensus on human milk oligosaccharides. J. Chin. Inst. Food Sci. Technol. 2023, 23, 452–457. [Google Scholar] [CrossRef]
- Bosheva, M.; Tokodi, I.; Krasnow, A.; Pedersen, H.K.; Lukjancenko, O.; Eklund, A.C.; Grathwohl, D.; Sprenger, N.; Berger, B.; Cercamondi, C.I. Infant Formula with a Specific Blend of Five Human Milk Oligosaccharides Drives the Gut Microbiota Development and Improves Gut Maturation Markers: A Randomized Controlled Trial. Front. Nutr. 2022, 9, 920362. [Google Scholar] [CrossRef] [PubMed]
- Bode, L. Human milk oligosaccharides: Every baby needs a sugar mama. Glycobiology 2012, 22, 1147–1162. [Google Scholar] [CrossRef]
- Doherty, A.M.; Lodge, C.J.; Dharmage, S.C.; Xin, D.; Lars, B.; Lowe, A.J. Human Milk Oligosaccharides and Associations With Immune-Mediated Disease and Infection in Childhood: A Systematic Review. Front. Pediatr. 2018, 6, 91. [Google Scholar] [CrossRef]
- Cho, S.; Zhu, Z.; Li, T.; Baluyot, K.; Lin, W. Human milk 3′-Sialyllactose is positively associated with language development during infancy. Am. J. Clin. Nutr. 2021, 114, 588–597. [Google Scholar] [CrossRef]
- Puccio, G.; Alliet, P.; Cajozzo, C.; Janssens, E.; Corsello, G.; Sprenger, N.; Wernimont, S.; Egli, D.; Gosoniu, L.; Steenhout, P. Effects of Infant Formula With Human Milk Oligosaccharides on Growth and Morbidity: A Randomized Multicenter Trial. J. Pediatr. Gastroenterol. Nutr. 2017, 64, 624–631. [Google Scholar] [CrossRef]
- Wang, A.; Koleva, P.; Toit, E.D.; Geddes, D.T.; Slupsky, C.M. The Milk Metabolome of Non-secretor and Lewis Negative Mothers. Front. Nutr. 2021, 7, 576966. [Google Scholar] [CrossRef]
- Thurl, S.; Munzert, M.; Boehm, G.; Matthews, C.; Stahl, B. Systematic review of the concentrations of oligosaccharides in human milk. Nutr. Rev. 2017, 75, 920–933. [Google Scholar] [CrossRef]
- Thurl, S.; Munzert, M.; Henker, J.; Boehm, G.; Müller-Werner, B.; Jelinek, J.; Stahl, B. Variation of human milk oligosaccharides in relation to milk groups and lactational periods. Br. J. Nutr. 2010, 104, 1261–1271. [Google Scholar] [CrossRef]
- Zhu, L.; Peng, X.; Li, H.; Luo, T.; Wang, J.; Gao, Y.; Deng, Z.; Li, J.; Li, W.; Zheng, L.; et al. Systematic Characterization of the Oligosaccharide Profile of Human Milk in Rural Areas of Central China: Quantitative Tracking of Human Milk Oligosaccharide Composition during 12 Months of Lactation. J. Agric. Food Chem. 2024, 72, 22798–22813. [Google Scholar] [CrossRef]
- Han, S.M.; Derraik, J.G.B.; Binia, A.; Sprenger, N.; Vickers, M.H.; Cutfield, W.S. Maternal and Infant Factors Influencing Human Milk Oligosaccharide Composition: Beyond Maternal Genetics. J. Nutr. 2021, 151, 1383–1393. [Google Scholar] [CrossRef] [PubMed]
- Astono, J.; Huang, Y.-P.; Sundekilde, U.K.; Barile, D. Human milk oligosaccharide profiles remain unaffected by maternal pre-pregnancy body mass index in an observational study. Front. Nutr. 2024, 11, 1455251. [Google Scholar] [CrossRef] [PubMed]
- Li, G.; Kong, L.; Zhang, L.; Fan, L.; Su, Y.; Rose, J.C.; Zhang, W. Early Pregnancy Maternal Lipid Profiles and the Risk of Gestational Diabetes Mellitus Stratified for Body Mass Index. Reprod. Sci. 2015, 22, 712–717. [Google Scholar] [CrossRef] [PubMed]
- Tesfa, E.; Nibret, E.; Munshea, A. Maternal lipid profile and risk of pre-eclampsia in African pregnant women: A systematic review and meta-analysis. PLoS ONE 2020, 15, e0243538. [Google Scholar] [CrossRef]
- Schönbacher, L.; Treichler, C.; Brandl, W.; Köfeler, H.C.; Fluhr, H.; Jantscher-Krenn, E.; van Poppel, M.N.M. Prenatal Human Milk Oligosaccharides (HMOs) in the Context of BMI, Gestational Weight Gain, and Lipid Profile-An Association Study in Pregnant Women with Overweight or Obesity. Mol. Nutr. Food Res. 2024, 68, e2300533. [Google Scholar] [CrossRef]
- Huang, X.; Zhu, B.; Jiang, T.; Yang, C.; Qiao, W.; Hou, J.; Han, Y.; Xiao, H.; Chen, L. Improved Simple Sample Pretreatment Method for Quantitation of Major Human Milk Oligosaccharides Using Ultrahigh Pressure Liquid Chromatography with Fluorescence Detection. J. Agric. Food Chem. 2019, 67, 12237–12244. [Google Scholar] [CrossRef]
- Austin, S.; Bénet, T. Quantitative determination of non-lactose milk oligosaccharides. Anal. Chim. Acta 2018, 1010, 86–96. [Google Scholar] [CrossRef]
- Ruhaak, L.R.; Steenvoorden, E.; Koeleman, C.A.M.; Deelder, A.M.; Wuhrer, M. 2-Picoline-Borane: A Non-toxic Reducing Agent for Oligosaccharide Labeling by Reductive Amination. Proteomics 2010, 10, 2330–2336. [Google Scholar] [CrossRef]
- Liu, S.; Mao, Y.; Wang, J.; Tian, F.; Hill, D.R.; Xiong, X.; Li, X.; Zhao, Y.; Wang, S. Lactational and geographical variation in the concentration of six oligosaccharides in Chinese breast milk: A multicenter study over 13 months postpartum. Front. Nutr. 2023, 10, 1267287. [Google Scholar] [CrossRef]
- Liu, S.; Liu, J.; Miao, Y.-Y.; Cai, X.-K.; Tian, F.; Zhao, Y.-R.; Wang, S. Concentrations of Oligosaccharides in Mature Breast Milks Sample from Six Cities of China. Acta Nutr. Sin. 2020, 42, 219–223. [Google Scholar] [CrossRef]
- Zhu, J.; Shi, Y.-J.; Wu, L.-F.; Sun, H.-N.; Wang, X.; Wang, Z.; Guan, L.; Yu, K.; Yang, Y.-X. Detection and comparison of 10 human milk oligosaccharides during lactational stage. Chin. J. Food Hyg. 2017, 29, 417–422. [Google Scholar] [CrossRef]
- McGuire, M.K.; Meehan, C.L.; McGuire, M.A.; Williams, J.E.; Foster, J.; Sellen, D.W.; Kamau-Mbuthia, E.W.; Kamundia, E.W.; Mbugua, S.; Moore, S.E.; et al. What’s normal? Oligosaccharide concentrations and profiles in milk produced by healthy women vary geographically. Am. J. Clin. Nutr. 2017, 105, 1086–1100. [Google Scholar] [CrossRef] [PubMed]
- Konieczna, M.; Koryszewska-Bagińska, A.; Bzikowska-Jura, A.; Chmielewska-Jeznach, M.; Jarzynka, S.; Olędzka, G. Modifiable and Non-Modifiable Factors That Affect Human Milk Oligosaccharides Composition. Nutrients 2024, 16, 2887. [Google Scholar] [CrossRef]
- Larsson, M.W.; Lind, M.V.; Laursen, R.P.; Yonemitsu, C.; Larnkjær, A.; Mølgaard, C.; Michaelsen, K.F.; Bode, L. Human Milk Oligosaccharide Composition Is Associated With Excessive Weight Gain During Exclusive Breastfeeding-An Explorative Study. Front. Pediatr. 2019, 7, 297. [Google Scholar] [CrossRef]
- Fan, Y.; Vinjamuri, A.; Tu, D.; Lebrilla, C.B.; Donovan, S.M. Determinants of human milk oligosaccharides profiles of participants in the STRONG kids 2 cohort. Front. Nutr. 2023, 10, 1105668. [Google Scholar] [CrossRef]
- Huang, Z.; Li, N.; Hu, Y.M. Dietary patterns and their effects on postpartum weight retention of lactating women in south central China. Nutrition 2019, 67–68, 110555. [Google Scholar] [CrossRef]
- Huang, Z.; Hu, Y.M. Dietary patterns and their association with breast milk macronutrient composition among lactating women. Int. Breastfeed. J. 2020, 15, 52. [Google Scholar] [CrossRef]
- Seppo, A.E.; Kukkonen, A.K.; Kuitunen, M.; Savilahti, E.; Yonemitsu, C.; Bode, L.; Järvinen, K.M. Association of Maternal Probiotic Supplementation With Human Milk Oligosaccharide Composition. JAMA Pediatr. 2019, 173, 286–288. [Google Scholar] [CrossRef]
- Saben, J.L.; Sims, C.R.; Abraham, A.; Bode, L.; Andres, A. Human Milk Oligosaccharide Concentrations and Infant Intakes Are Associated with Maternal Overweight and Obesity and Predict Infant Growth. Nutrients 2021, 13, 446. [Google Scholar] [CrossRef]
- Selma-Royo, M.; González, S.; Gueimonde, M.; Chang, M.; Fürst, A.; Martínez-Costa, C.; Bode, L.; Collado, M.C. Maternal Diet Is Associated with Human Milk Oligosaccharide Profile. Mol. Nutr. Food Res. 2022, 66, e2200058. [Google Scholar] [CrossRef] [PubMed]
- Jantscher-Krenn, E.; Treichler, C.; Brandl, W.; Schönbacher, L.; Köfeler, H.; van Poppel, M.N.M. The association of human milk oligosaccharides with glucose metabolism in overweight and obese pregnant women. Am. J. Clin. Nutr. 2019, 110, 1335–1343. [Google Scholar] [CrossRef] [PubMed]
- Pausan, M.R.; Kolovetsiou-Kreiner, V.; Richter, G.L.; Madl, T.; Giselbrecht, E.; Obermayer-Pietsch, B.; Weiss, E.C.; Jantscher-Krenn, E.; Moissl-Eichinger, C. Human Milk Oligosaccharides Modulate the Risk for Preterm Birth in a Microbiome-Dependent and -Independent Manner. mSystems 2020, 5, 10. [Google Scholar] [CrossRef]
- Jantscher-Krenn, E.; von Schirnding, L.; Trötzmüller, M.; Köfeler, H.; Kurtovic, U.; Fluhr, H.; Müller, A.; Bagci, S. Human Milk Oligosaccharides Are Present in Amniotic Fluid and Show Specific Patterns Dependent on Gestational Age. Nutrients 2022, 14, 2065. [Google Scholar] [CrossRef]
- Tang, W.H.; Kitai, T.; Hazen, S.L. Gut Microbiota in Cardiovascular Health and Disease. Circ. Res. 2017, 120, 1183–1196. [Google Scholar] [CrossRef]
- Dalile, B.; Van Oudenhove, L.; Vervliet, B.; Verbeke, K. The role of short-chain fatty acids in microbiota-gut-brain communication. Nat. Rev. Gastroenterol. Hepatol. 2019, 16, 461–478. [Google Scholar] [CrossRef]
- Ahmadian, F.; Razmpoosh, E.; Ejtahed, H.S.; Javadi, M.; Mirmiran, P.; Azizi, F. Effects of probiotic supplementation on major cardiovascular-related parameters in patients with type-2 diabetes mellitus: A secondary-data analysis of a randomized double-blind controlled trial. Diabetol. Metab. Syndr. 2022, 14, 52. [Google Scholar] [CrossRef] [PubMed]
- Dou, Y.; Luo, Y.; Xing, Y.; Liu, H.; Chen, B.; Zhu, L.; Ma, D.; Zhu, J. Human Milk Oligosaccharides Variation in Gestational Diabetes Mellitus Mothers. Nutrients 2023, 15, 1441. [Google Scholar] [CrossRef]
- Williams, J.E.; Price, W.J.; Shafii, B.; Yahvah, K.M.; Bode, L.; McGuire, M.A.; McGuire, M.K. Relationships Among Microbial Communities, Maternal Cells, Oligosaccharides, and Macronutrients in Human Milk. J. Hum. Lact. 2017, 33, 540–551. [Google Scholar] [CrossRef]
- Charbonneau, M.R.; O’Donnell, D.; Blanton, L.V.; Totten, S.M.; Davis, J.C.; Barratt, M.J.; Cheng, J.; Guruge, J.; Talcott, M.; Bain, J.R.; et al. Sialylated Milk Oligosaccharides Promote Microbiota-Dependent Growth in Models of Infant Undernutrition. Cell 2016, 164, 859–871. [Google Scholar] [CrossRef]
- Gart, E.; Salic, K.; Morrison, M.C.; Giera, M.; Attema, J.; de Ruiter, C.; Caspers, M.; Schuren, F.; Bobeldijk-Pastorova, I.; Heer, M.; et al. The Human Milk Oligosaccharide 2′-Fucosyllactose Alleviates Liver Steatosis, ER Stress and Insulin Resistance by Reducing Hepatic Diacylglycerols and Improved Gut Permeability in Obese Ldlr-/-.Leiden Mice. Front. Nutr. 2022, 9, 904740. [Google Scholar] [CrossRef] [PubMed]
- Lee, S.; Goodson, M.; Vang, W.; Kalanetra, K.; Barile, D.; Raybould, H. 2′-fucosyllactose Supplementation Improves Gut-Brain Signaling and Diet-Induced Obese Phenotype and Changes the Gut Microbiota in High Fat-Fed Mice. Nutrients 2020, 12, 1003. [Google Scholar] [CrossRef] [PubMed]
- Mokhtari, P.; Schmidt, K.A.; Zamanian, H.; Babaei, M.; Machle, C.J.; Trifonova, D.; Alderete, T.L.; Holzhausen, E.A.; Ottino-González, J.; Chalifour, B.N.; et al. Maternal Diet Associated with Oligosaccharide Abundances in Human Milk from Latina Mothers. Nutrients 2024, 16, 1795. [Google Scholar] [CrossRef] [PubMed]

| Characteristics | N (%) | |
|---|---|---|
| Maternal age | ||
| Below 25 years | 31 (15.82) | |
| 25 to 29 years | 79 (40.31) | |
| 30 to 34 years | 64 (32.65) | |
| 35 years and above | 22 (11.22) | |
| Lactating period | ||
| 20 to 60 days | 48 (24.49) | |
| 61 to 90 days | 52 (26.53) | |
| 91 to 150 days | 59 (30.10) | |
| 151 to 180 days | 37 (18.88) | |
| Occupation | ||
| Laborers and farmers | 20 (10.20) | |
| Office staff | 73 (37.24) | |
| Private industry and commerce | 34 (17.35) | |
| Other | 69 (35.20) | |
| Education | ||
| College and above | 102 (52.04) | |
| High and secondary technical school | 66 (33.67) | |
| Junior school and below | 28 (14.29) | |
| Family income | ||
| 50,000 yuan and above | 109 (55.61) | |
| 20,000 to 50,000 yuan | 53 (27.04) | |
| Below 20,000 yuan | 34 (17.35) | |
| Parity | ||
| Once | 92 (46.94) | |
| Twice | 81 (41.33) | |
| Three times and above | 23 (11.73) | |
| Metabolic Factors | Total | Non-Secretor | Secretor | p | |||
|---|---|---|---|---|---|---|---|
| Pre-pregnancy BMI | 21.56 | (19.82, 23.92) | 21.48 | (19.56, 23.73) | 21.64 | (19.84, 23.93) | 0.774 |
| Current BMI | 23.11 | (21.08, 25.71) | 22.77 | (20.31, 24.16) | 23.36 | (21.16, 25.90) | 0.219 |
| TC mmol/L | 4.98 | (4.25, 5.43) | 5.03 | (4.20, 5.88) | 4.98 | (4.26, 5.34) | 0.291 |
| TG mmol/L | 0.92 | (0.70, 1.43) | 0.89 | (0.65, 1.55) | 0.92 | (0.75, 1.41) | 0.542 |
| HDL mmol/L | 1.59 | (1.41, 1.79) | 1.61 | (1.43, 1.77) | 1.59 | (1.40, 1.80) | 0.473 |
| LDL mmol/L | 2.93 | (2.50, 3.44) | 2.94 | (2.47, 3.59) | 2.93 | (2.50, 3.42) | 0.449 |
| GLU mmol/L | 4.77 | (4.44, 5.22) | 4.72 | (4.44, 5.10) | 4.81 | (4.44, 5.23) | 0.426 |
| SBP mmHg | 114 | (103, 122) | 111 | (99, 122) | 115 | (105, 123) | 0.197 |
| DBP mmHg | 71 | (64, 79) | 68 | (61, 76) | 71 | (64, 80) | 0.080 |
| HR bmp | 80 | (71, 88) | 80 | (72, 87) | 80 | (71, 89) | 0.899 |
| Metabolic Factors | 2′-FL | 3-FL | LNFP I | LNDFH II | ||||||||
|---|---|---|---|---|---|---|---|---|---|---|---|---|
| β (95% CI) | p | β (95% CI) | p | β (95% CI) | p | β (95% CI) | p | |||||
| Pre-pregnancy BMI | −0.07 | (−0.22, 0.07) | 0.29 | 0.01 | (−0.13, 0.15) | 0.86 | −0.09 | (−0.23, 0.05) | 0.20 | −0.02 | (−0.16, 0.12) | 0.73 |
| Current BMI | −0.02 | (−0.16, 0.12) | 0.77 | −0.05 | (−0.19, 0.09) | 0.52 | −0.03 | (−0.17, 0.11) | 0.64 | 0.05 | (−0.09, 0.19) | 0.45 |
| TC | −0.12 | (−0.27, 0.02) | 0.10 | 0.05 | (−0.10, 0.20) | 0.48 | 0.02 | (−0.13, 0.17) | 0.78 | 0.10 | (−0.04, 0.25) | 0.16 |
| TG | 0.00 | (−0.14, 0.14) | 1.00 | −0.11 | (−0.25, 0.03) | 0.13 | −0.02 | (−0.16, 0.12) | 0.74 | −0.02 | (−0.16, 0.12) | 0.77 |
| HDL | −0.07 | (−0.20, 0.07) | 0.35 | 0.13 | (−0.01, 0.27) | 0.06 | −0.03 | (−0.17, 0.11) | 0.67 | −0.01 | (−0.15, 0.12) | 0.84 |
| LDL | −0.11 | (−0.26, 0.04) | 0.15 | 0.02 | (−0.13, 0.16) | 0.84 | 0.02 | (−0.12, 0.17) | 0.76 | 0.14 | (−0.01, 0.28) | 0.07 |
| GLU | 0.01 | (−0.13, 0.15) | 0.88 | 0.04 | (−0.10, 0.18) | 0.61 | 0.04 | (−0.10, 0.18) | 0.58 | 0.11 | (−0.03, 0.24) | 0.13 |
| SBP | 0.03 | (−0.11, 0.17) | 0.72 | 0.01 | (−0.13, 0.15) | 0.93 | 0.03 | (−0.11, 0.17) | 0.68 | 0.13 | (0.00, 0.27) | 0.06 |
| DBP | 0.10 | (−0.04, 0.23) | 0.18 | −0.06 | (−0.20, 0.08) | 0.40 | 0.08 | (−0.06, 0.22) | 0.25 | 0.13 | (−0.01, 0.26) | 0.07 |
| HR | 0.04 | (−0.10, 0.18) | 0.61 | 0.09 | (−0.05, 0.23) | 0.22 | 0.00 | (−0.14, 0.14) | 0.98 | 0.17 | (0.03, 0.31) | 0.01 |
| Metabolic Factors | LNT | LNnT | 3′-SL | LSTa | ||||||||
|---|---|---|---|---|---|---|---|---|---|---|---|---|
| β (95% CI) | p | β (95% CI) | p | β (95% CI) | p | β (95% CI) | p | |||||
| Pre-pregnancy BMI | 0.02 | (−0.12, 0.17) | 0.75 | 0.02 | (−0.13, 0.16) | 0.83 | −0.16 | (−0.29, −0.03) | 0.02 | −0.05 | (−0.19, 0.09) | 0.50 |
| Current BMI | 0.03 | (−0.11, 0.18) | 0.66 | 0.04 | (−0.10, 0.18) | 0.56 | −0.14 | (−0.27, −0.01) | 0.04 | −0.02 | (−0.16, 0.12) | 0.80 |
| TC | 0.05 | (−0.10, 0.20) | 0.49 | −0.06 | (−0.21, 0.09) | 0.42 | −0.11 | (−0.24, 0.03) | 0.14 | −0.02 | (−0.17, 0.13) | 0.83 |
| TG | 0.02 | (−0.12, 0.17) | 0.75 | 0.02 | (−0.13, 0.16) | 0.82 | −0.09 | (−0.22, 0.04) | 0.19 | 0.03 | (−0.11, 0.18) | 0.63 |
| HDL | 0.04 | (−0.10, 0.18) | 0.57 | −0.04 | (−0.18, 0.10) | 0.54 | 0.04 | (−0.09, 0.17) | 0.59 | 0.02 | (−0.12, 0.16) | 0.75 |
| LDL | 0.06 | (−0.09, 0.21) | 0.46 | −0.04 | (−0.19, 0.11) | 0.59 | −0.11 | (−0.25, 0.03) | 0.11 | −0.03 | (−0.18, 0.12) | 0.73 |
| GLU | 0.03 | (−0.11, 0.18) | 0.64 | 0.09 | (−0.05, 0.23) | 0.22 | 0.07 | (−0.06, 0.20) | 0.27 | 0.05 | (−0.09, 0.19) | 0.48 |
| SBP | 0.10 | (−0.04, 0.25) | 0.15 | 0.16 | (0.02, 0.30) | 0.03 | 0.01 | (−0.12, 0.14) | 0.88 | 0.05 | (−0.09, 0.19) | 0.47 |
| DBP | 0.13 | (−0.01, 0.27) | 0.07 | 0.19 | (0.05, 0.33) | 0.01 | 0.07 | (−0.07, 0.20) | 0.32 | 0.11 | (−0.04, 0.25) | 0.14 |
| HR | 0.01 | (−0.14, 0.15) | 0.93 | −0.04 | (−0.19, 0.10) | 0.57 | 0.14 | (0.01, 0.27) | 0.04 | −0.02 | (−0.16, 0.13) | 0.81 |
Disclaimer/Publisher’s Note: The statements, opinions and data contained in all publications are solely those of the individual author(s) and contributor(s) and not of MDPI and/or the editor(s). MDPI and/or the editor(s) disclaim responsibility for any injury to people or property resulting from any ideas, methods, instructions or products referred to in the content. |
© 2025 by the authors. Licensee MDPI, Basel, Switzerland. This article is an open access article distributed under the terms and conditions of the Creative Commons Attribution (CC BY) license (https://creativecommons.org/licenses/by/4.0/).
Share and Cite
Huang, Z.; Luo, S.; Li, Y.; Li, Z.; Yi, C.; Zhang, Y.; Hu, Y.; Chen, B. Impact of Maternal Metabolic Status on Human Milk Oligosaccharide Composition: A Population-Based Cross-Sectional Study in Central South China. Nutrients 2025, 17, 1480. https://doi.org/10.3390/nu17091480
Huang Z, Luo S, Li Y, Li Z, Yi C, Zhang Y, Hu Y, Chen B. Impact of Maternal Metabolic Status on Human Milk Oligosaccharide Composition: A Population-Based Cross-Sectional Study in Central South China. Nutrients. 2025; 17(9):1480. https://doi.org/10.3390/nu17091480
Chicago/Turabian StyleHuang, Zhi, Shurong Luo, Yuxin Li, Ziming Li, Chuanzhu Yi, Yan Zhang, Yuming Hu, and Bo Chen. 2025. "Impact of Maternal Metabolic Status on Human Milk Oligosaccharide Composition: A Population-Based Cross-Sectional Study in Central South China" Nutrients 17, no. 9: 1480. https://doi.org/10.3390/nu17091480
APA StyleHuang, Z., Luo, S., Li, Y., Li, Z., Yi, C., Zhang, Y., Hu, Y., & Chen, B. (2025). Impact of Maternal Metabolic Status on Human Milk Oligosaccharide Composition: A Population-Based Cross-Sectional Study in Central South China. Nutrients, 17(9), 1480. https://doi.org/10.3390/nu17091480