Patterns of Food Parenting Practices and Children’s Intake of Energy-Dense Snack Foods

Abstract
:1. Introduction
2. Methods
2.1. Study Design and Participants
2.2. Measures
2.2.1. Parent and Child Background Information
2.2.2. Food Parenting Practices
2.2.3. Intake of Energy-Dense Snack Foods
2.3. Statistical Analysis
3. Results
3.1. Sample
3.2. Identification of Clusters
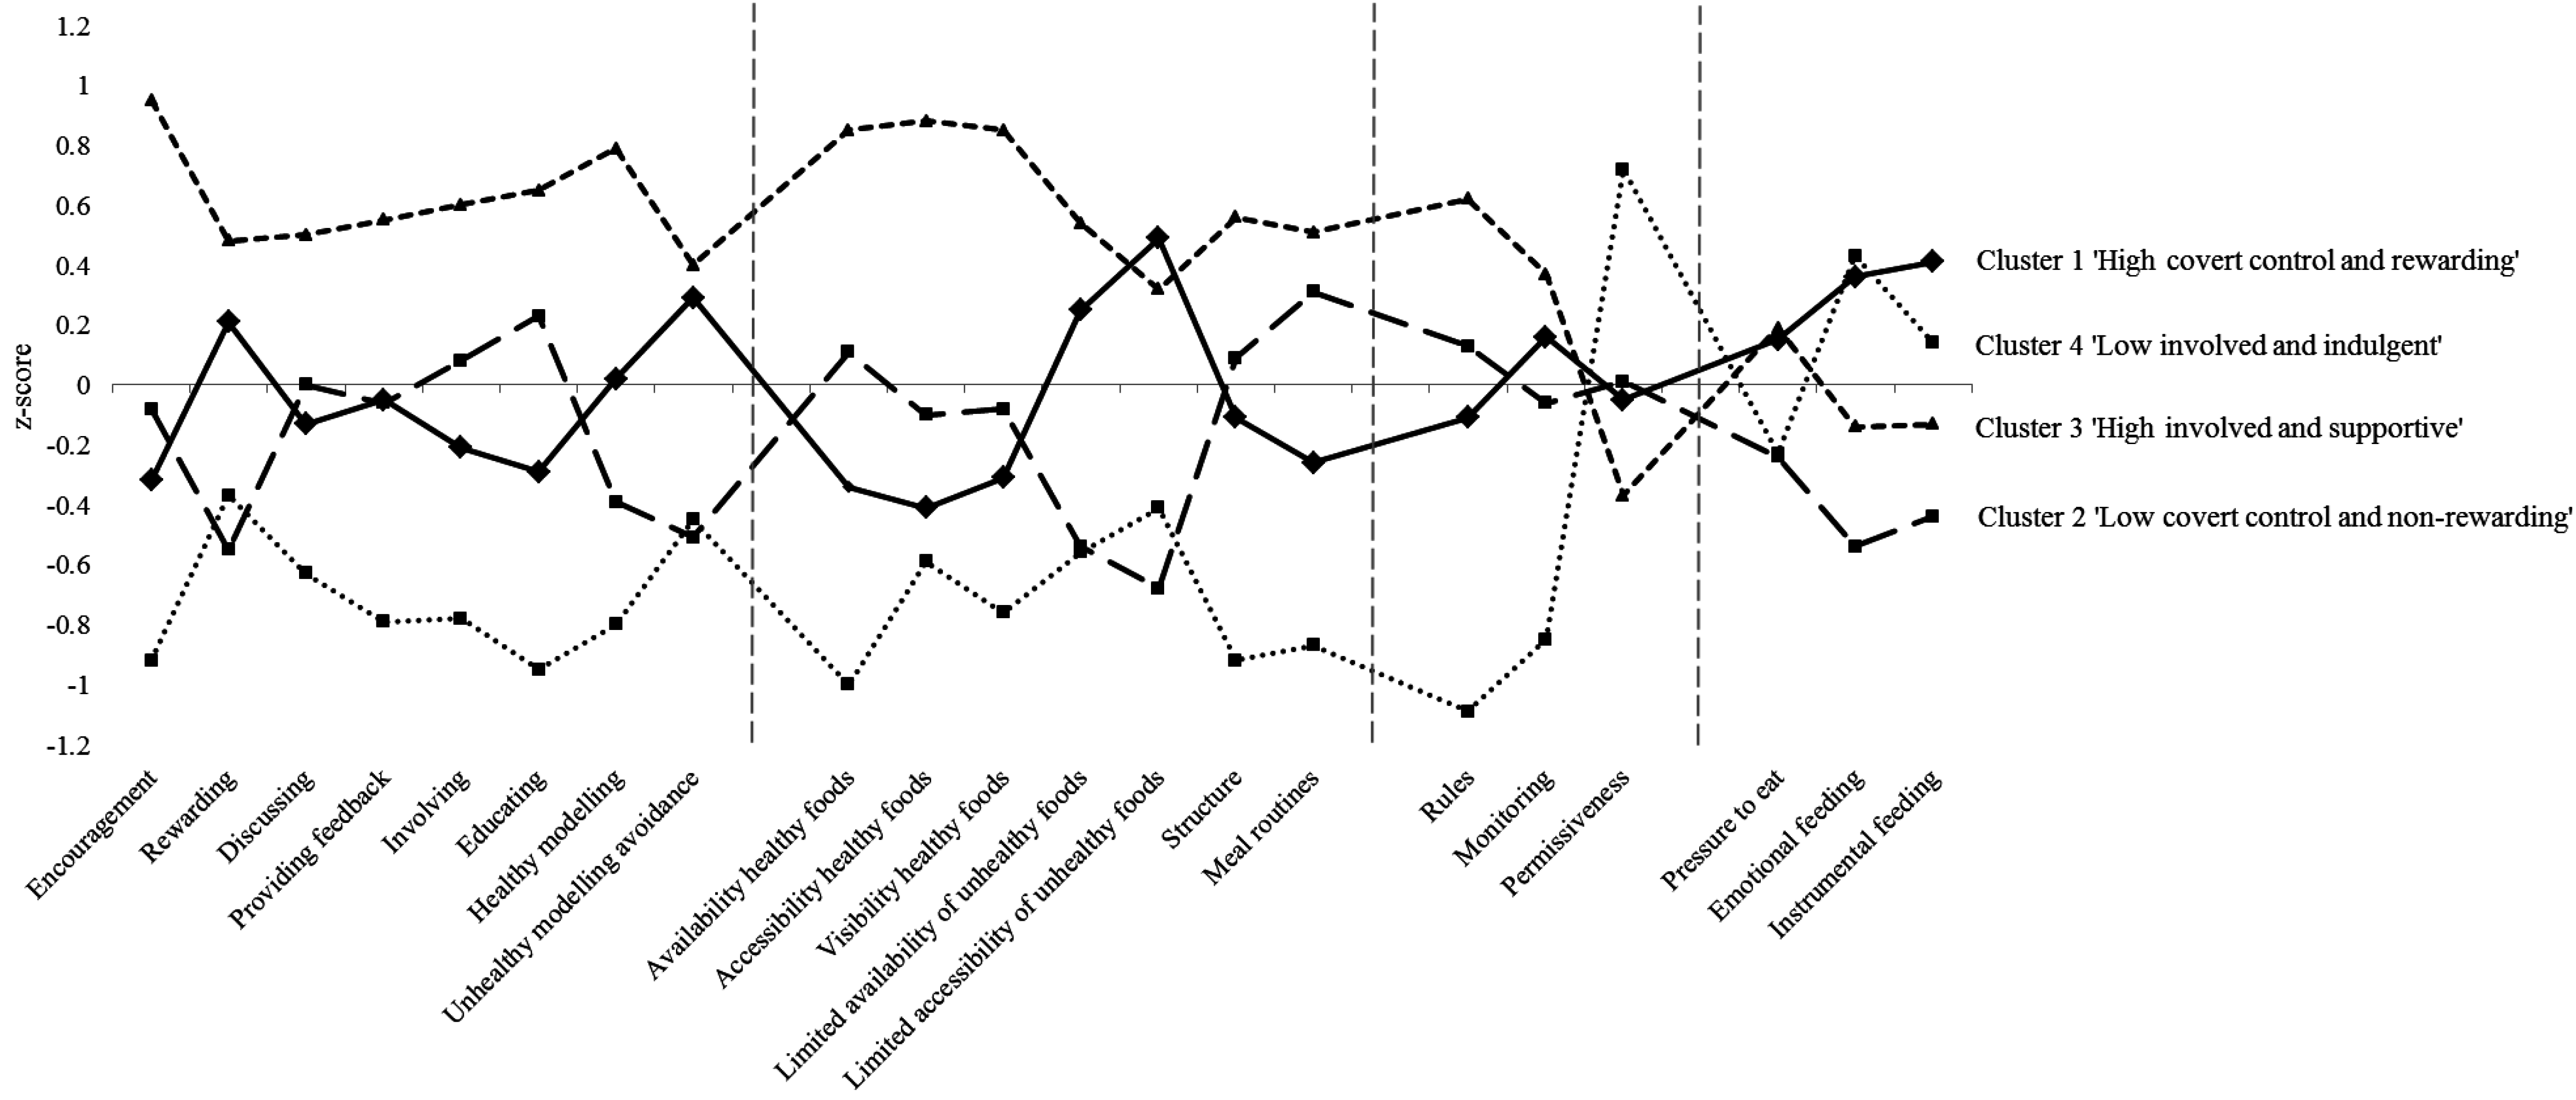
3.3. Characterizing Cluster Membership

| Cluster 1 High Covert Control and Rewarding n = 273 (30.7%) | Cluster 2 Low Covert Control and Non-rewarding n = 227 (25.6%) | Cluster 3 High Involvement and Supportive n = 247 (27.8%) | Cluster 4 Low Involvement and Indulgent n = 141 (15.9%) | |||||
|---|---|---|---|---|---|---|---|---|
| Responsiveness | ||||||||
| Encouragement | −0.32 | −0.08 | 0.95 | −0.92 | ||||
| Rewarding | 0.21 | −0.55 | 0.48 | −0.37 | ||||
| Discussing | −0.13 | 0.00 | 0.50 | −0.63 | ||||
| Providing feedback | −0.05 | −0.06 | 0.55 | −0.79 | ||||
| Involving | −0.21 | 0.08 | 0.60 | −0.78 | ||||
| Educating | −0.29 | 0.23 | 0.65 | −0.95 | ||||
| Healthy modelling | 0.02 | −0.39 | 0.79 | −0.80 | ||||
| Unhealthy modelling avoidance | 0.29 | −0.51 | 0.40 | −0.45 | ||||
| Structure | ||||||||
| Availability of healthy foods | −0.34 | 0.11 | 0.85 | −1.00 | ||||
| Accessibility of healthy foods | −0.41 | −0.10 | 0.88 | −0.59 | ||||
| Visibility of healthy foods | −0.31 | −0.08 | 0.85 | −0.76 | ||||
| Limited availability of unhealthy foods | 0.25 | −0.54 | 0.54 | −0.56 | ||||
| Limited accessibility of unhealthy foods | 0.49 | −0.68 | 0.32 | −0.41 | ||||
| Structure | −0.11 | 0.09 | 0.56 | −0.92 | ||||
| Meal routines | −0.26 | 0.31 | 0.51 | −0.87 | ||||
| Behavioral Control | ||||||||
| Rules | −0.11 | 0.13 | 0.62 | −1.09 | ||||
| Monitoring | 0.16 | −0.06 | 0.37 | −0.85 | ||||
| Permissiveness | −0.05 | 0.01 | −0.37 | 0.72 | ||||
| Psychological Control | ||||||||
| Pressure to eat | 0.15 | −0.24 | 0.19 | −0.23 | ||||
| Emotional feeding | 0.36 | −0.54 | −0.14 | 0.43 | ||||
| Instrumental feeding | 0.41 | −0.44 | −0.13 | 0.14 | ||||

| Total Sample | Cluster 1 High Covert Control and Rewarding | Cluster 2 Low Covert Control and Non-rewarding | Cluster 3 High Involvement and Supportive | Cluster 4 Low Involvement and Indulgent | p-value Overall F or Chi-square Test | Cluster Differences | |
|---|---|---|---|---|---|---|---|
| Parent characteristics | |||||||
| Age (years), mean SD | 40.6 (5.8) | 40.0 (5.5%) | 41.2 (5.4%) | 40.2 (6.3%) | 41.6 (6.0) | 0.01 a | 4 > 1 c |
| Gender (female) (%) | 65.2% | 64.8% | 71.4% | 65.2% | 56.0% | 0.03 b | 2 > 4 d |
| BMI (kg/m2), mean SD 1 | 25.2 (4.2) | 24.9 (4.1) | 25.0 (4.0) | 25.3 (4.1) | 26.2 (4.3) | 0.01 a | 4 > 1,2 c |
| Ethnicity (Dutch ethnicity) (%) | 91.0% | 90.1% | 94.3% | 89.9% | 89.4% | NS b | NA |
| SEP (factor score), mean SD 2 | 0.1 (1.2) | 0.2 (1.1) | 0.0 (1.3) | 0.1 (1.3) | 0.4 (1.0) | 0.03 a | 4 > 2 c |
| Work status (in employment) (%) | 79.3% | 76.2% | 79.3% | 79.8% | 84.4% | NS b | NA |
| Educational level | NS b | NA | |||||
| Low (%) | 11.1% | 12.1% | 12.3% | 7.7% | 13.5% | ||
| Medium (%) | 45.3% | 46.2% | 43.6% | 43.3% | 49.6% | ||
| High (%) | 43.6% | 41.8% | 44.1% | 49.0% | 36.9% | ||
| Child characteristics | |||||||
| Age (years), mean SD | 7.9 (2.6) | 7.1 (2.6) | 8.5 (2.4) | 7.7 (2.6) | 8.5 (2.6) | < 0.01 a | 2, 3, 4 > 1; 2 > 3 ; 4 > 3 c |
| Gender (female) (%) | 49.7% | 49.5% | 50.2% | 54.3% | 41.1% | NS b | NA |
| BMI-z, mean (SD) | −0.2 (1.4) | −0.1 (1.4) | –0.4 (1.2) | −0.3 (1.4) | 0.1 (1.5) | < 0.01 a | 1, 4 > 2; 4 > 3 c |
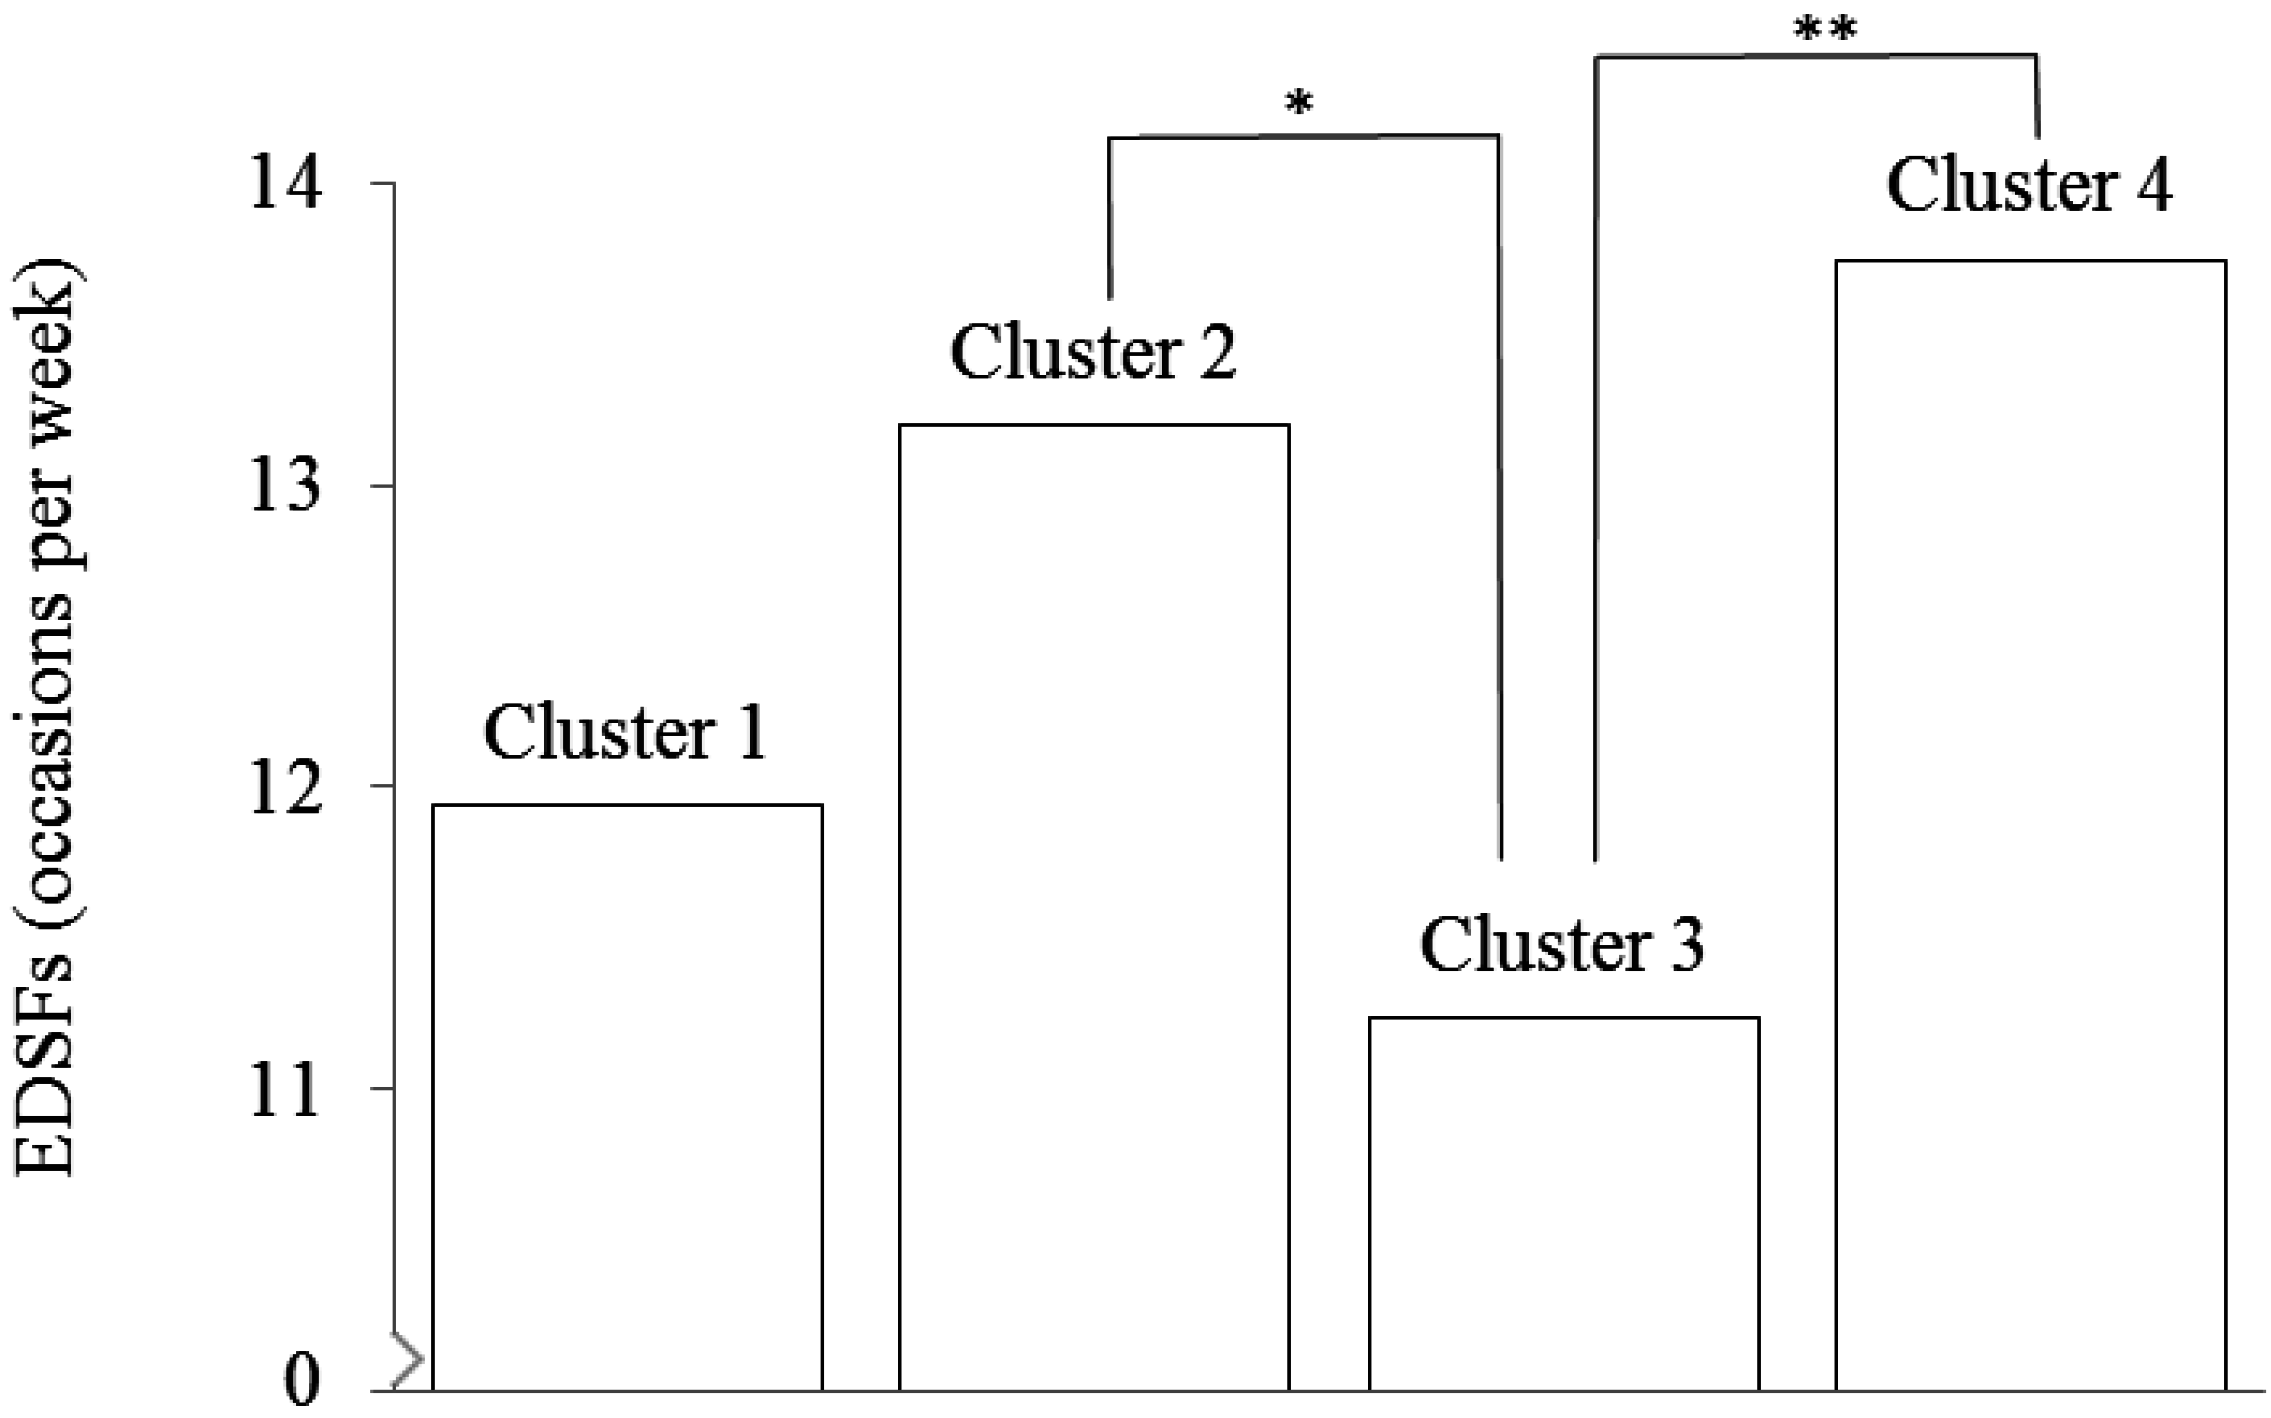
| EDSFs (occasions per week), mean SD 3 | 12.4 (5.9) | 11.9 (5.5) | 13.2 (5.9) | 11.2 (5.7) | 13.7 (6.3) | < 0.01 a, e | 2, 4 > 3 d, e |

4. Discussion
5. Conclusions
Author Contributions
Conflicts of Interest
References
- Lobstein, T.; Baur, L.; Uauy, R.; TaskForce, I.I.O. Obesity in children and young people: A crisis in public health. Obes. Rev. 2004, 5, 4–104. [Google Scholar] [CrossRef] [PubMed]
- Schonbeck, Y.; Talma, H.; van Dommelen, P.; Bakker, B.; Buitendijk, S.E.; Hirasing, R.A.; van Buuren, S. Increase in prevalence of overweight in dutch children and adolescents: A comparison of nationwide growth studies in 1980, 1997 and 2009. PLoS One 2011, 6, e27608. [Google Scholar] [CrossRef] [PubMed]
- Daniels, S.R. Complications of obesity in children and adolescents. Int. J. Obes. 2009, 33, S60–S65. [Google Scholar] [CrossRef] [PubMed]
- Singh, A.S.; Mulder, C.; Twisk, J.W.R.; van Mechelen, W.; Chinapaw, M.J.M. Tracking of childhood overweight into adulthood: A systematic review of the literature. Obes. Rev. 2008, 9, 474–488. [Google Scholar] [CrossRef] [PubMed]
- Larson, N.; Story, M. A review of snacking patterns among children and adolescents: What are the implications of snacking for weight status? Child. Obes. 2013, 9, 104–115. [Google Scholar] [PubMed]
- Gevers, D.W.M.; Kremers, S.P.J.; De Vries, N.K.; Van Assema, P. Intake of energy-dense snack foods and drinks among dutch children aged 7 to 12: How many, how much, when, where, and which? Public Health Nutr. 2015, 1–10. [Google Scholar]
- Golan, M.; Crow, S. Parents are key players in the prevention and treatment of weight-related problems. Nutr. Rev. 2004, 62, 39–50. [Google Scholar] [CrossRef] [PubMed]
- Gevers, D.W.M.; Kremers, S.P.J.; de Vries, N.K.; van Assema, P. Clarifying concepts of food parenting practices. A delphi study with an application to snacking behavior. Appetite 2014, 79, 51–57. [Google Scholar] [CrossRef] [PubMed]
- Hendy, H.M.; Williams, K.E.; Camise, T.S.; Eckman, N.; Hedemann, A. The parent mealtime action scale (PMAS). Development and association with children’s diet and weight. Appetite 2009, 52, 328–339. [Google Scholar] [CrossRef] [PubMed]
- Kroller, K.; Warschburger, P. Associations between maternal feeding style and food intake of children with a higher risk for overweight. Appetite 2008, 51, 166–172. [Google Scholar] [CrossRef] [PubMed]
- Melbye, E.L.; Ogaard, T.; Overby, N.C. Associations between parental feeding practices and child vegetable consumption. Mediation by child cognitions? Appetite 2013, 69, 23–30. [Google Scholar] [CrossRef] [PubMed]
- Melbye, E.L.; Ogaard, T.; Overby, N.C.; Hansen, H. Parental food-related behaviors and family meal frequencies: Associations in Norwegian dyads of parents and preadolescent children. BMC Public Health 2013, 13, 820. [Google Scholar] [CrossRef] [PubMed]
- Van Lippevelde, W.; te Velde, S.J.; Verloigne, M.; De Bourdeaudhuij, I.; Manios, Y.; Bere, E.; Jan, N.; Fernandez-Alvira, J.M.; Chinapaw, M.J.M.; Bringolf-Isler, B.; et al. Associations between home- and family-related factors and fruit juice and soft drink intake among 10- to 12-year old children. The energy project. Appetite 2013, 61, 59–65. [Google Scholar] [CrossRef] [PubMed]
- Vereecken, C.A.; Keukelier, E.; Maes, L. Influence of mother’s educational level on food parenting practices and food habits of young children. Appetite 2004, 43, 93–103. [Google Scholar] [CrossRef] [PubMed]
- O’Connor, T.M.; Hughes, S.; Watson, K.B.; Baranowski, T.; Nicklas, T.A.; Fisher, J.O.; Beltran, A.; Baranowski, J.C.; Qu, H.; Shewchuk, R.M. Parenting practices are associated with fruit and vegetable consumption in pre-school children. Public Health Nutr. 2010, 13, 91–101. [Google Scholar] [CrossRef] [PubMed]
- Baranowski, T.; Chen, T.A.; O’Connor, T.; Hughes, S.; Beltran, A.; Frankel, L.; Diep, C.; Baranowski, J.C. Dimensions of vegetable parenting practices among preschoolers. Appetite 2013, 69, 89–93. [Google Scholar] [CrossRef] [PubMed]
- Rodenburg, G.; Oenema, A.; Kremers, S.P.; van de Mheen, D. Clustering of diet- and activity-related parenting practices: Cross-sectional findings of the inpact study. Int. J. Behav. Nutr. Phys. Act. 2013, 10, 36. [Google Scholar] [CrossRef] [PubMed]
- The International Organization for Standardization Standards. Available online: http://www.iso.org/iso/home/standards.htm (accessed on 13 January 2015).
- Central Committee on Research Involving Human Subjects. Available online: http://www.ccmo.nl/en/your-research-does-it-fall-under-the-wmo (accessed on 22 May 2015).
- The Netherlands Institute for Social Research. Statusscores. Available online: http://www.scp.nl/ (accessed on 22 May 2015).
- Fredriks, A.M.; van Buuren, S.; Wit, J.M.; Verloove-Vanhorick, S.P. Body index measurements in 1996–7 compared with 1980. Arch. Dis. Child. 2000, 82, 107–112. [Google Scholar] [CrossRef] [PubMed]
- Gevers, D.W.M.; Kremers, S.P.; de Vries, N.K.; van Assema, P. Development of the Comprehensive Snack Parenting Questionnaire: Test-retest reliability and discriminative value of constructs. Unpublished data.
- Sleddens, E.F.; O’Connor, T.M.; Watson, K.B.; Hughes, S.O.; Power, T.G.; Thijs, C.; De Vries, N.K.; Kremers, S.P. Development of the comprehensive general parenting questionnaire for caregivers of 5–13 year olds. Int. J. Behav. Nutr. Phys. Act. 2014, 11, 15. [Google Scholar] [CrossRef] [PubMed]
- Brants, H.; Stafleu, A.; ter Doest, D.; Hulshof, K.; Thijs, C. Ontwikkeling van een voedselfrequentievragenlijst (development of a food frequency questionnaire). VoedingNu 2006, 2, 25–28. [Google Scholar]
- Dutman, A.E.; Stafleu, A.; Kruizinga, A.; Brants, H.A.M.; Westerterp, K.R.; Kistemaker, C.; Meuling, W.J.A.; Goldbohm, R.A. Validation of an FFQ and options for data processing using the doubly labelled water method in children. Public Health Nutr. 2011, 14, 410–417. [Google Scholar] [CrossRef] [PubMed]
- Tabachnick, B.G.; Fidell, L.S. Using multivariate statistics, 4th ed.; Allyn and Bacon: Boston, MA, USA, 2001; p. 93. [Google Scholar]
- Hair, J.R.; Anderson, R.E.; Tatham, R.L.; Black, W.C. Multivariate data analysis, 5th ed.; Prentice-Hall: Upper Saddle River, NJ, USA, 1998; pp. 469–517. [Google Scholar]
- Breckenridge, J.N. Validating cluster analysis: Consistent replication and symmetry. Multivariate Behav. Res. 2000, 35, 261–285. [Google Scholar] [CrossRef]
- Landis, J.R.; Koch, G.G. The measurement of observer agreement for categorical data. Biometrics 1977, 33, 159–174. [Google Scholar] [CrossRef] [PubMed]
- Statistics Netherlands, Statline. Available online: http://statline.cbs.nl/ (accessed on 22 May 2015).
- Schokker, D.F.; Visscher, T.L.S.; Nooyens, A.C.J.; van Baak, M.A.; Seidell, J.C. Prevalence of overweight and obesity in the Netherlands. Obes. Rev. 2007, 8, 101–107. [Google Scholar] [CrossRef] [PubMed]
- Barlow, S.E. Expert committee recommendations regarding the prevention, assessment, and treatment of child and adolescent overweight and obesity: Summary report. Pediatrics 2007, 120, S164–S192. [Google Scholar] [CrossRef] [PubMed]
- Kremers, S.; Sleddens, E.; Gerards, S.; Gubbels, J.; Rodenburg, G.; Gevers, D.; van Assema, P. General and food-specific parenting: Measures and interplay. Child. Obes. 2013, 9, S22–S31. [Google Scholar] [PubMed]
- Ogden, J.; Reynolds, R.; Smith, A. Expanding the concept of parental control: A role for overt and covert control in children’s snacking behaviour? Appetite 2006, 47, 100–106. [Google Scholar] [CrossRef] [PubMed]
- Gerards, S.M.; Kremers, S.P. The role of food parenting skills and the home food environment in children’s weight gain and obesity. Curr. Obes. Rep. 2015, 4, 30–36. [Google Scholar] [CrossRef] [PubMed]
- Sleddens, E.F.C.; Kremers, S.P.J.; De Vries, N.K.; Thijs, C. Relationship between parental feeding styles and eating behaviours of dutch children aged 6–7. Appetite 2010, 54, 30–36. [Google Scholar] [CrossRef] [PubMed]
- de Bruijn, G.J.; Kremers, S.P.; de Vries, H.; van Mechelen, W.; Brug, J. Associations of social-environmental and individual-level factors with adolescent soft drink consumption: Results from the smile study. Health Educ. Res. 2007, 22, 227–237. [Google Scholar] [CrossRef] [PubMed]
- Gevers, D.W.M.; van Assema, P.; Sleddens, E.F.C.; de Vries, N.K.; Kremers, S.P.J. Associations between general parenting, restrictive snacking rules, and adolescent’s snack intake. The roles of fathers and mothers and interparental congruence. Appetite 2015, 87, 184–191. [Google Scholar] [CrossRef] [PubMed]
- van der Horst, K.; Kremers, S.; Ferreira, I.; Singh, A.; Oenema, A.; Brug, J. Perceived parenting style and practices and the consumption of sugar-sweetened beverages by adolescents. Health Educ. Res. 2007, 22, 295–304. [Google Scholar] [CrossRef] [PubMed]
- Masse, L.C.; Watts, A.W. Stimulating innovations in the measurement of parenting constructs. Child. Obes. 2013, 9, S5–S13. [Google Scholar] [PubMed]
© 2015 by the authors; licensee MDPI, Basel, Switzerland. This article is an open access article distributed under the terms and conditions of the Creative Commons Attribution license (http://creativecommons.org/licenses/by/4.0/).
Share and Cite
Gevers, D.W.M.; Kremers, S.P.J.; De Vries, N.K.; Van Assema, P. Patterns of Food Parenting Practices and Children’s Intake of Energy-Dense Snack Foods. Nutrients 2015, 7, 4093-4106. https://doi.org/10.3390/nu7064093
Gevers DWM, Kremers SPJ, De Vries NK, Van Assema P. Patterns of Food Parenting Practices and Children’s Intake of Energy-Dense Snack Foods. Nutrients. 2015; 7(6):4093-4106. https://doi.org/10.3390/nu7064093
Chicago/Turabian StyleGevers, Dorus W. M., Stef P. J. Kremers, Nanne K. De Vries, and Patricia Van Assema. 2015. "Patterns of Food Parenting Practices and Children’s Intake of Energy-Dense Snack Foods" Nutrients 7, no. 6: 4093-4106. https://doi.org/10.3390/nu7064093
APA StyleGevers, D. W. M., Kremers, S. P. J., De Vries, N. K., & Van Assema, P. (2015). Patterns of Food Parenting Practices and Children’s Intake of Energy-Dense Snack Foods. Nutrients, 7(6), 4093-4106. https://doi.org/10.3390/nu7064093