The Effect of Piceatannol from Passion Fruit (Passiflora edulis) Seeds on Metabolic Health in Humans


Abstract
:1. Introduction
2. Materials and Methods
2.1. Subjects and Study Design
2.2. Overall Visits and Interventions
2.3. Ethical Approval
2.4. General Measurements
2.5. Blood Sample Analysis
2.6. Flow Mediated Dilation (FMD)
2.7. Sirt1 Expression and p-AMPK Expression in Isolated Peripheral Blood Mononuclear Cells (PBMNCs)
2.8. Evaluation of Mood States, Weariness and Stiffness
2.9. Statistical Analysis
3. Results
3.1. Baseline Characteristics
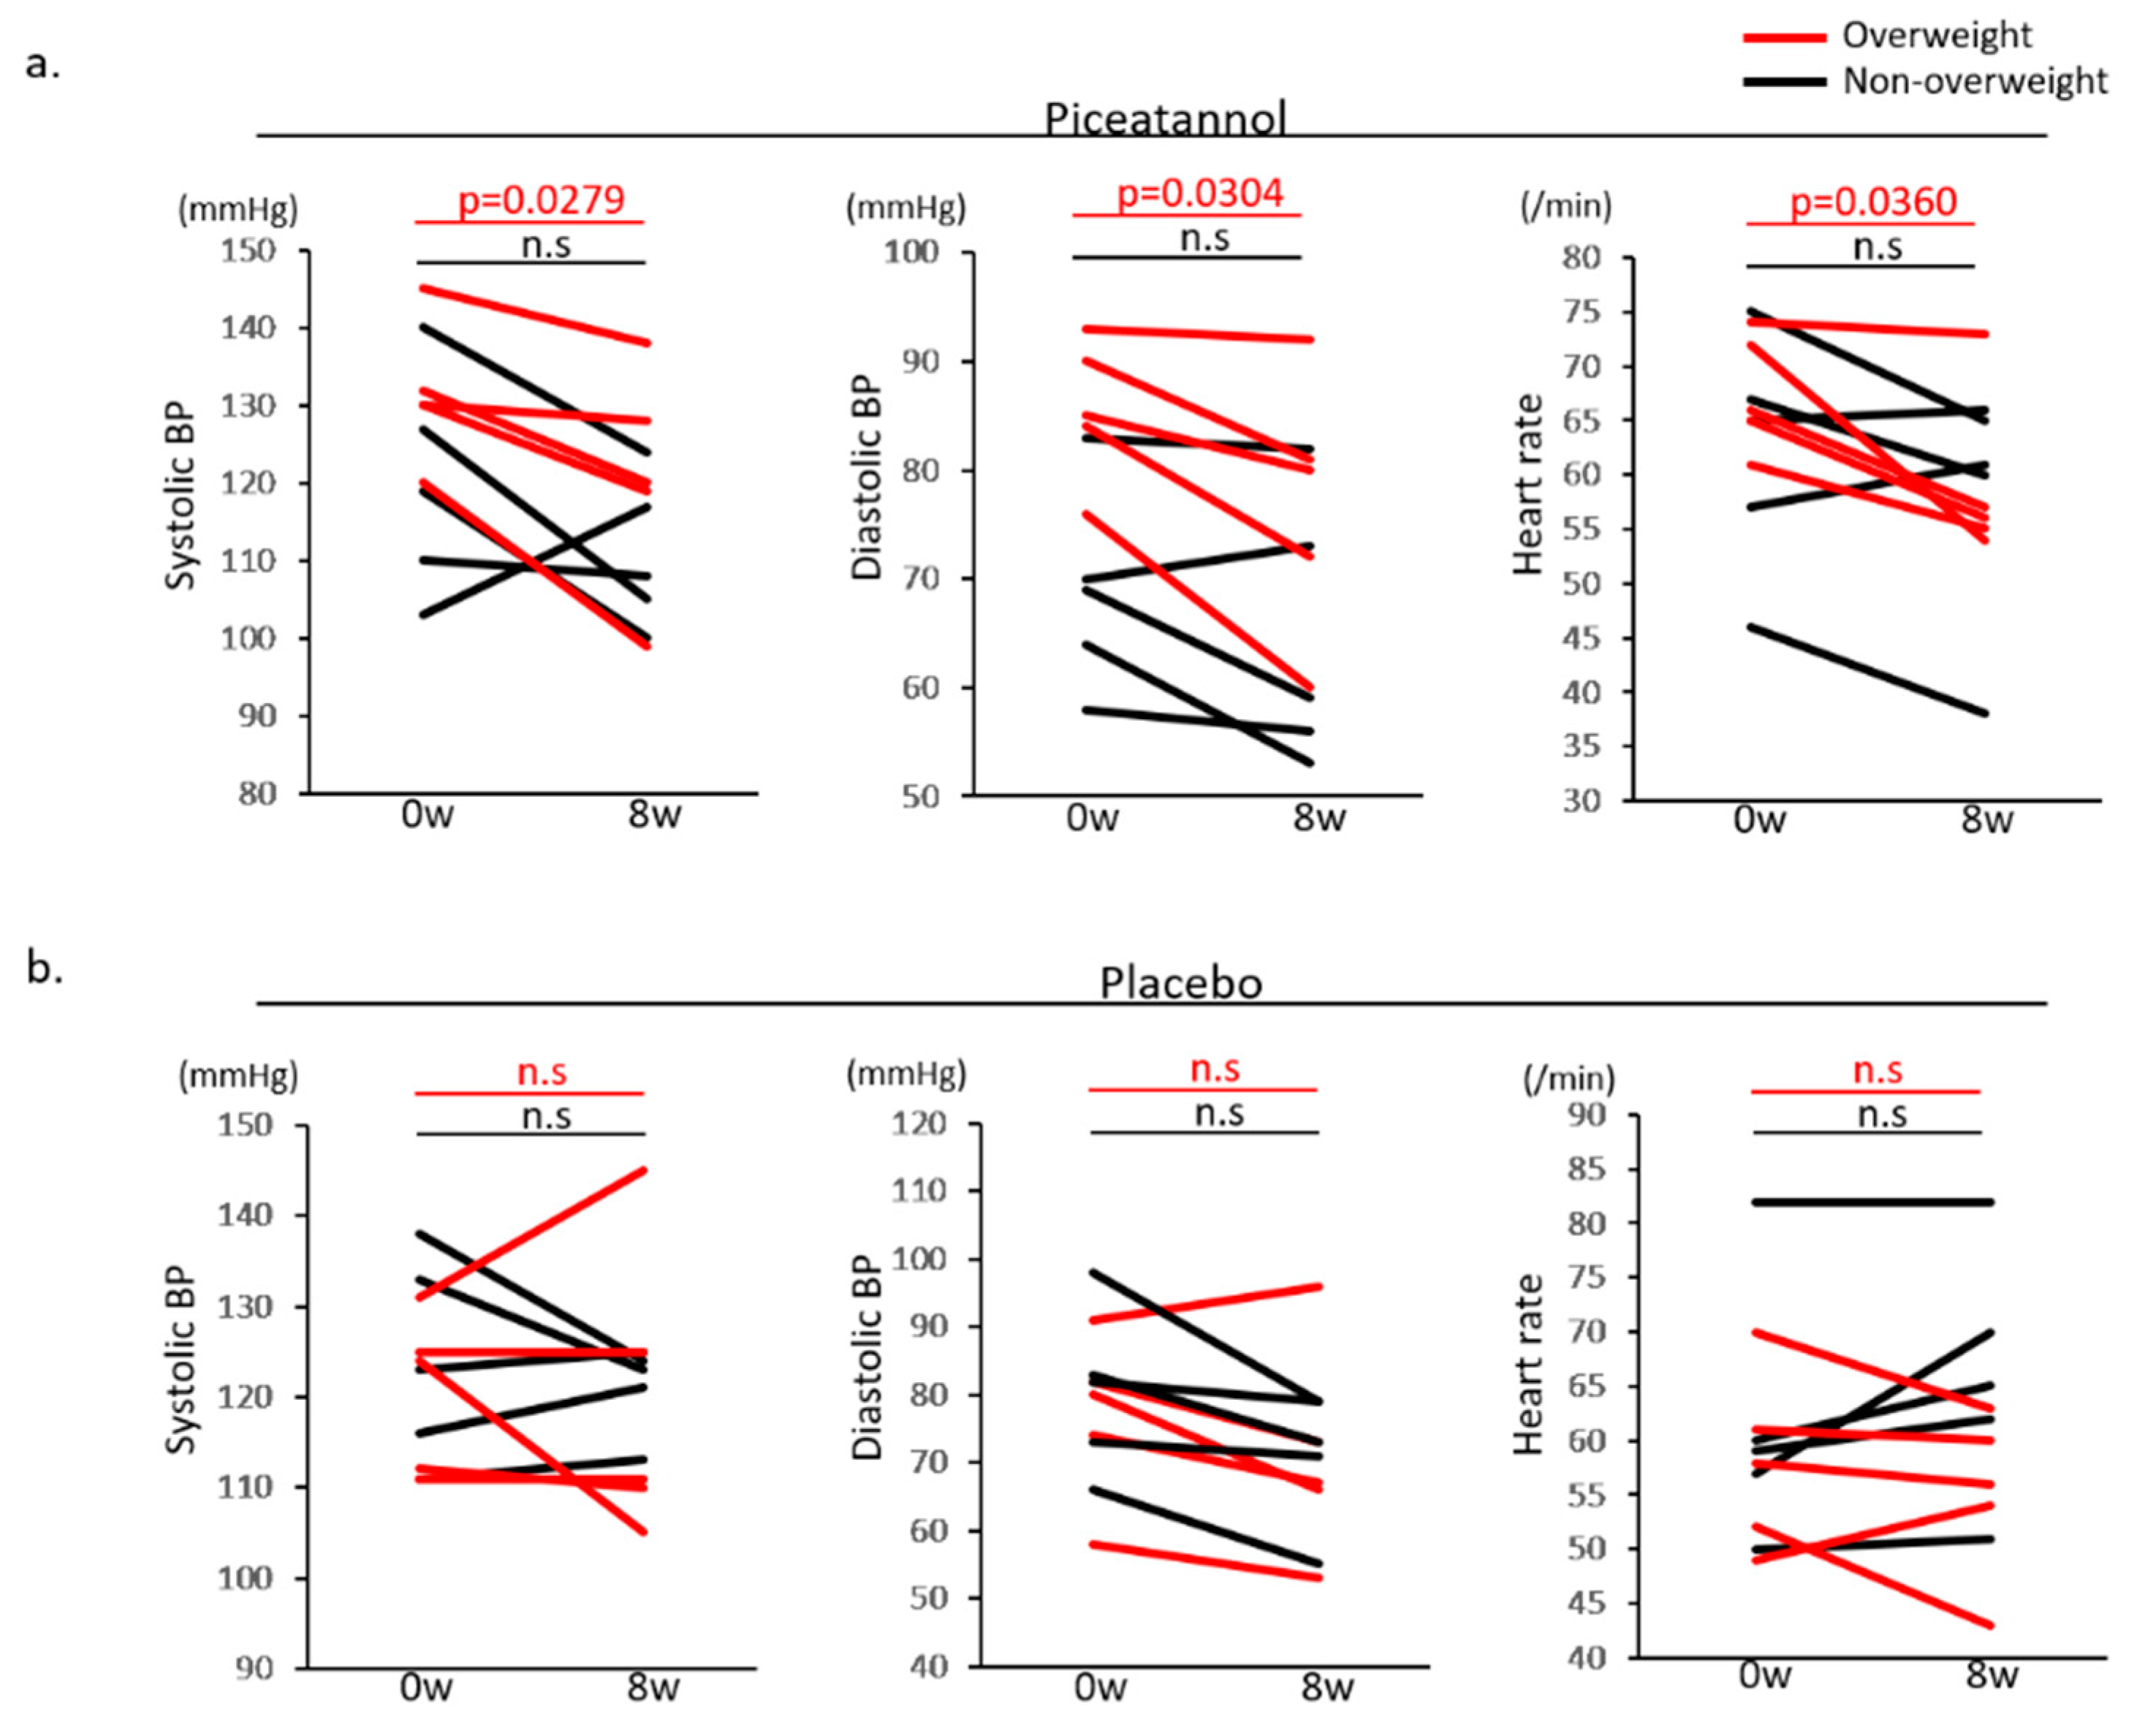
3.2. Changing BW, BMI, Body Composition, BP and HR
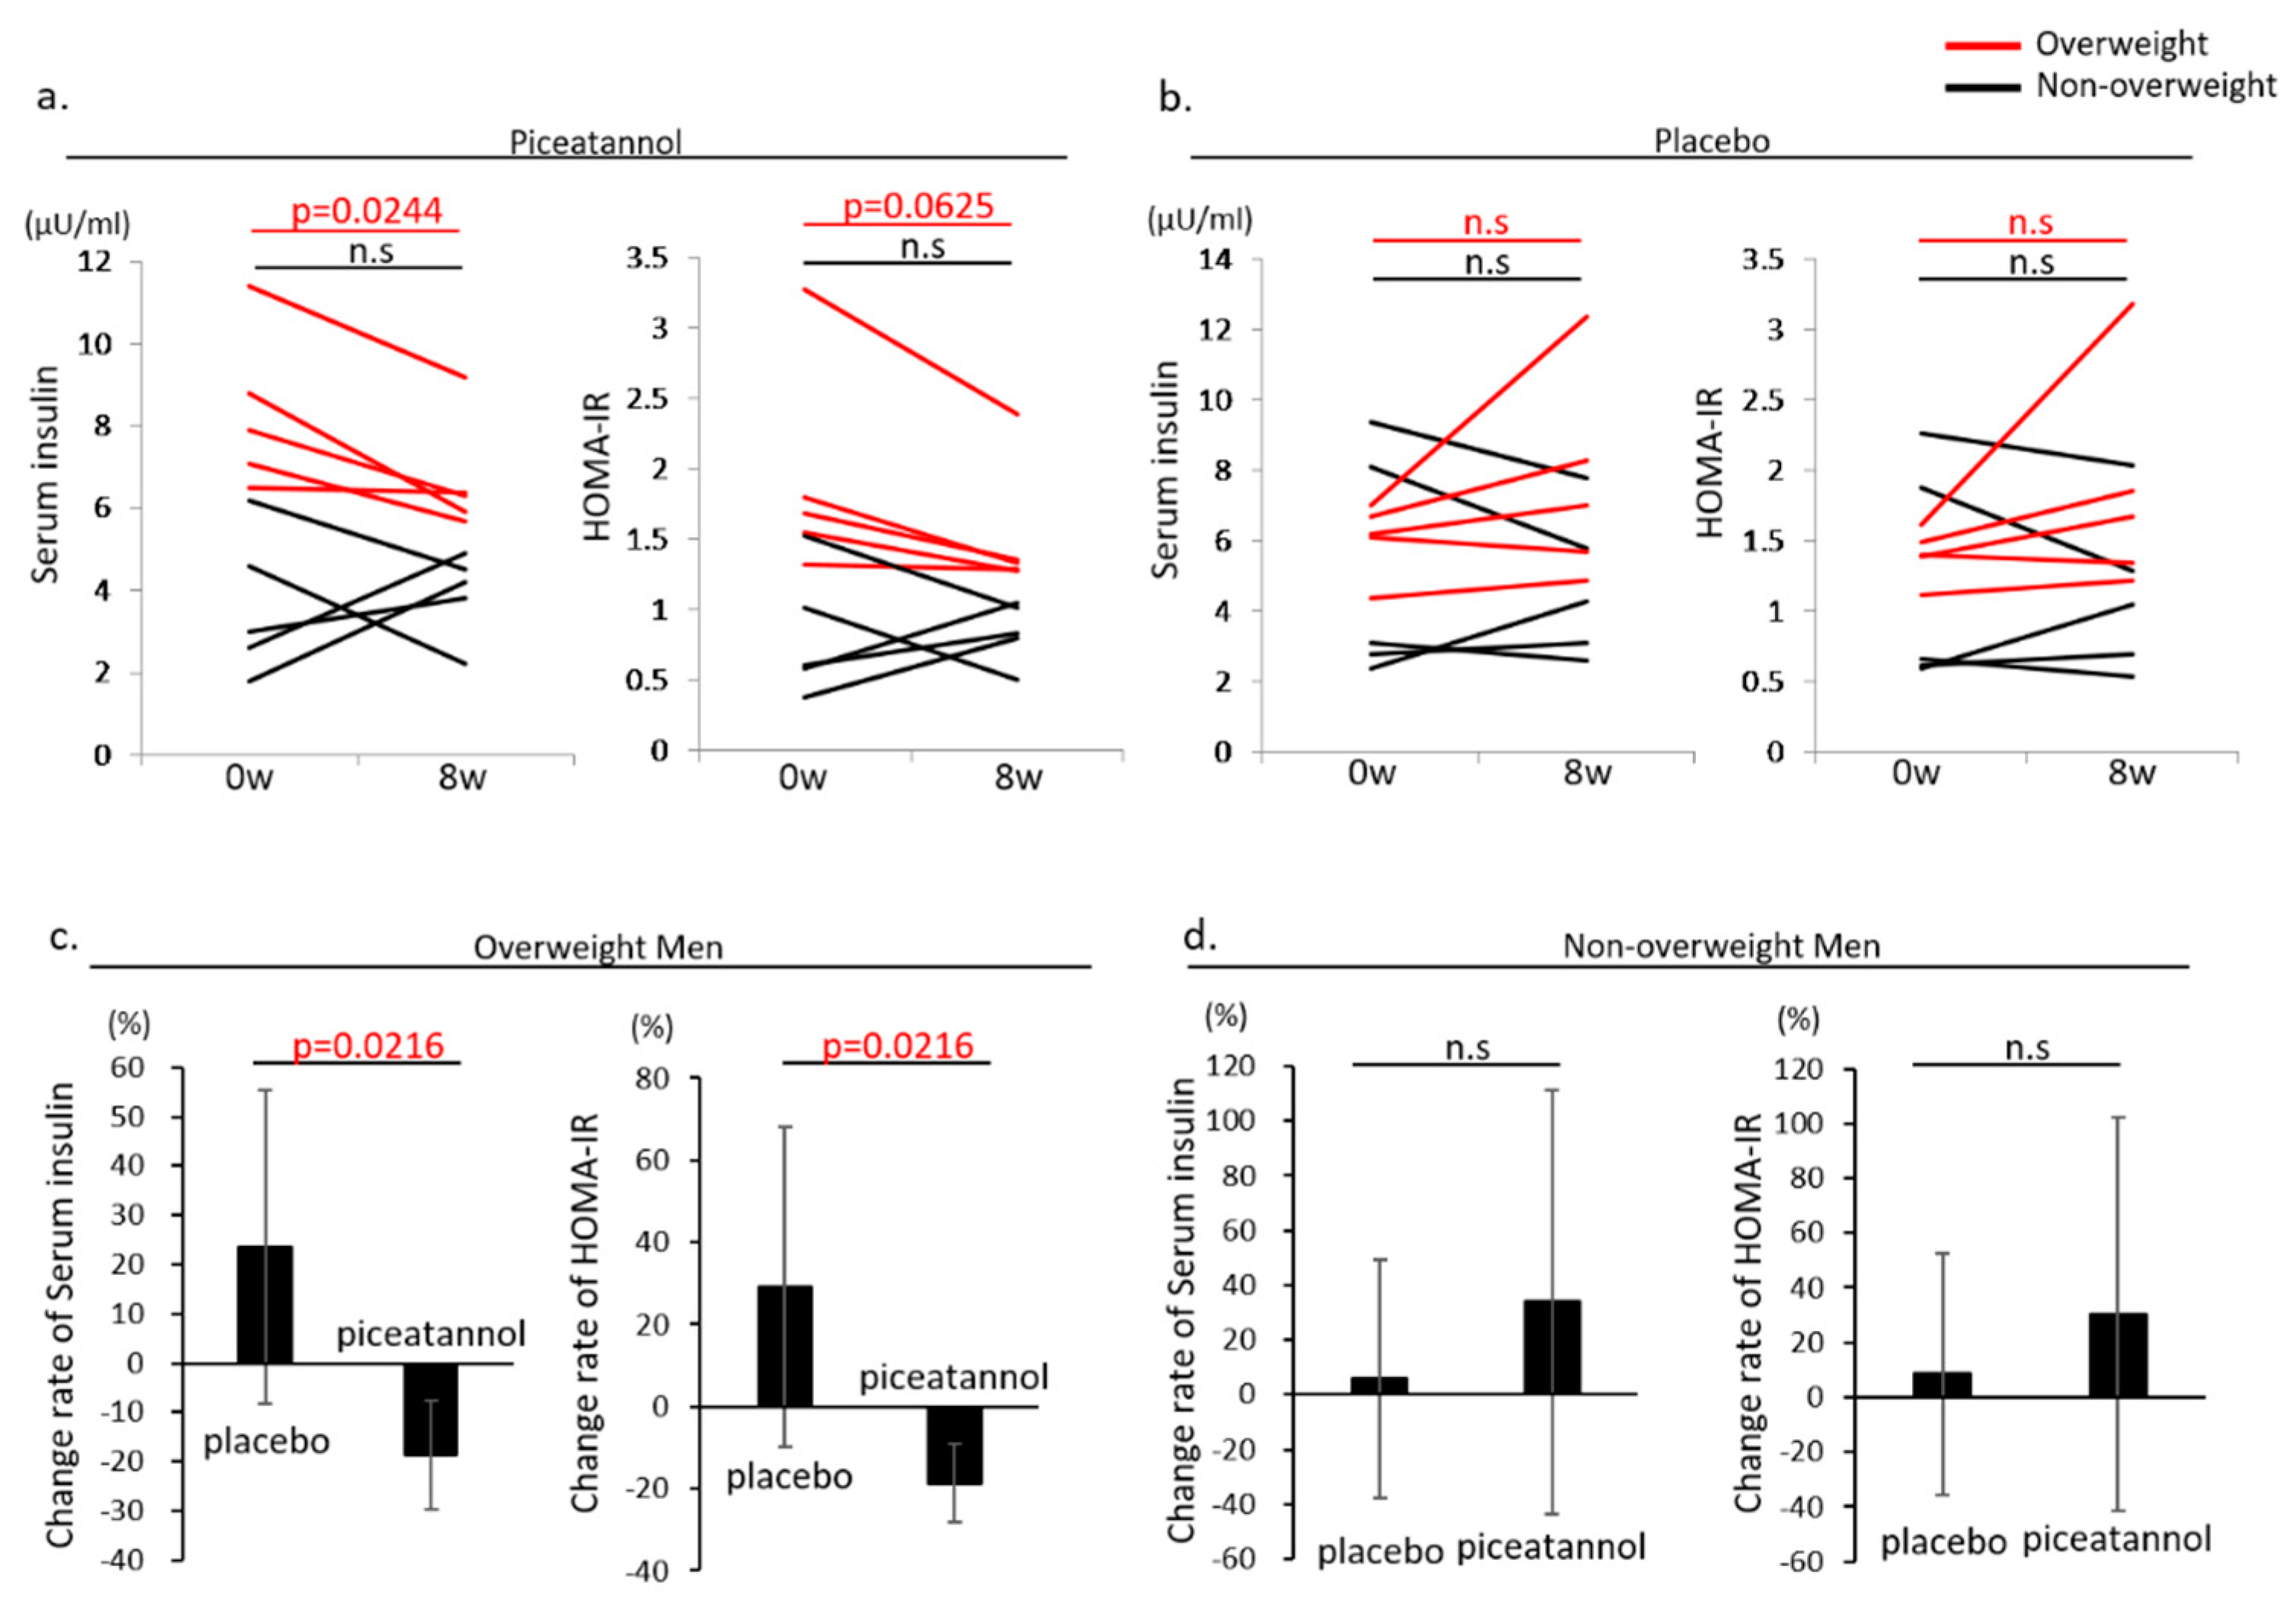
3.3. Change in Glucose Metabolism-Related Data
3.4. Changes in Liver and Renal Function Tests and Lipid Data
3.5. Changes in Endothelial Function, Inflammation and Oxidative Stress
3.6. Changes in Sirt1 and p-AMPK Expression in Isolated PBMNCs
3.7. Changes in Mood Status
3.8. Safety and Adverse Events
4. Discussion
5. Conclusions
Supplementary Materials
Acknowledgments
Author Contributions
Conflicts of Interest
Funding
References
- Matsuzawa, Y.; Funahashi, T.; Nakamura, T. The concept of metabolic syndrome: Contribution of visceral fat accumulation and its molecular mechanism. J. Atheroscler. Thromb. 2011, 18, 629–639. [Google Scholar] [CrossRef] [PubMed]
- Kirkland, J.L. Translating advances from the basic biology of aging into clinical application. Exp. Gerontol. 2013, 48, 1–5. [Google Scholar] [CrossRef] [PubMed]
- Tchkonia, T.; Morbeck, D.E.; Von Zglinicki, T.; Van Deursen, J.; Lustgarten, J.; Scrable, H.; Khosla, S.; Jensen, M.D.; Kirkland, J.L. Fat tissue, aging, and cellular senescence. Aging Cell 2010, 9, 667–684. [Google Scholar] [CrossRef] [PubMed] [Green Version]
- Garcia-Prieto, C.F.; Fernandez-Alfonso, M.S. Caloric Restriction as a Strategy to Improve Vascular Dysfunction in Metabolic Disorders. Nutrients 2016, 8, 370. [Google Scholar] [CrossRef] [PubMed]
- Larson-Meyer, D.E.; Heilbronn, L.K.; Redman, L.M.; Newcomer, B.R.; Frisard, M.I.; Anton, S.; Smith, S.R.; Alfonso, A.; Ravussin, E. Effect of calorie restriction with or without exercise on insulin sensitivity, beta-cell function, fat cell size, and ectopic lipid in overweight subjects. Diabetes Care 2006, 29, 1337–1344. [Google Scholar] [CrossRef] [PubMed]
- Baur, J.A.; Pearson, K.J.; Price, N.L.; Jamieson, H.A.; Lerin, C.; Kalra, A.; Prabhu, V.V.; Allard, J.S.; Lopez-Lluch, G.; Lewis, K.; et al. Resveratrol improves health and survival of mice on a high-calorie diet. Nature 2006, 444, 337–342. [Google Scholar] [CrossRef] [PubMed]
- Lagouge, M.; Argmann, C.; Gerhart-Hines, Z.; Meziane, H.; Lerin, C.; Daussin, F.; Messadeq, N.; Milne, J.; Lambert, P.; Elliott, P.; et al. Resveratrol improves mitochondrial function and protects against metabolic disease by activating SIRT1 and PGC-1alpha. Cell 2006, 127, 1109–1122. [Google Scholar] [CrossRef] [PubMed]
- Pearson, K.J.; Baur, J.A.; Lewis, K.N.; Peshkin, L.; Price, N.L.; Labinskyy, N.; Swindell, W.R.; Kamara, D.; Minor, R.K.; Perez, E.; et al. Resveratrol delays age-related deterioration and mimics transcriptional aspects of dietary restriction without extending life span. Cell Metab. 2008, 8, 157–168. [Google Scholar] [CrossRef] [PubMed] [Green Version]
- Sun, C.; Zhang, F.; Ge, X.; Yan, T.; Chen, X.; Shi, X.; Zhai, Q. SIRT1 improves insulin sensitivity under insulin-resistant conditions by repressing PTP1B. Cell Metab. 2007, 6, 307–319. [Google Scholar] [CrossRef] [PubMed]
- Szkudelski, T.; Szkudelska, K. Resveratrol and diabetes: From animal to human studies. Biochim. Biophys. Acta 2015, 1852, 1145–1154. [Google Scholar] [CrossRef] [PubMed]
- Timmers, S.; Konings, E.; Bilet, L.; Houtkooper, R.H.; van de Weijer, T.; Goossens, G.H.; Hoeks, J.; van der Krieken, S.; Ryu, D.; Kersten, S.; et al. Calorie restriction-like effects of 30 days of resveratrol supplementation on energy metabolism and metabolic profile in obese humans. Cell Metab. 2011, 14, 612–622. [Google Scholar] [CrossRef] [PubMed]
- Kershaw, J.; Kim, K.H. The Therapeutic Potential of Piceatannol, a Natural Stilbene, in Metabolic Diseases: A Review. J. Med. Food 2017, 20, 427–438. [Google Scholar] [CrossRef] [PubMed]
- Rodríguez-Cabo, T.; Rodríguez, I.; López, P.; Ramil, M.; Cela, R. Investigation of liquid chromatography quadrupole time-of-flight mass spectrometry performance for identification and determination of hydroxylated stilbene antioxidants in wine. J. Chromatogr. A 2014, 1337, 162–170. [Google Scholar] [CrossRef] [PubMed]
- Matsui, Y.; Sugiyama, K.; Kamei, M.; Takahashi, T.; Suzuki, T.; Katagata, Y.; Ito, T. Extract of passion fruit (Passiflora edulis) seed containing high amounts of piceatannol inhibits melanogenesis and promotes collagen synthesis. J. Agric. Food Chem. 2010, 58, 11112–11118. [Google Scholar] [CrossRef] [PubMed]
- Kawakami, S.; Kinoshita, Y.; Maruki-Uchida, H.; Yanae, K.; Sai, M.; Ito, T. Piceatannol and its metabolite, isorhapontigenin, induce SIRT1 expression in THP-1 human monocytic cell line. Nutrients 2014, 6, 4794–4804. [Google Scholar] [CrossRef] [PubMed]
- Sano, S.; Sugiyama, K.; Ito, T.; Katano, Y.; Ishihata, A. Identification of the strong vasorelaxing substance scirpusin B, a dimer of piceatannol, from passion fruit (Passiflora edulis) seeds. J. Agric. Food Chem. 2011, 59, 6209–6213. [Google Scholar] [CrossRef] [PubMed]
- Kinoshita, Y.; Kawakami, S.; Yanae, K.; Sano, S.; Uchida, H.; Inagaki, H.; Ito, T. Effect of long-term piceatannol treatment on eNOS levels in cultured endothelial cells. Biochem. Biophys. Res. Commun. 2013, 430, 1164–1168. [Google Scholar] [CrossRef] [PubMed]
- Maruki-Uchida, H.; Kurita, I.; Sugiyama, K.; Sai, M.; Maeda, K.; Ito, T. The protective effects of piceatannol from passion fruit (Passiflora edulis) seeds in UVB-irradiated keratinocytes. Biol. Pharm. Bull. 2013, 36, 845–849. [Google Scholar] [CrossRef] [PubMed]
- Matsuo, S.; Imai, E.; Horio, M.; Yasuda, Y.; Tomita, K.; Nitta, K.; Yamagata, K.; Tomino, Y.; Yokoyama, H.; Hishida, A.; et al. Revised equations for estimated GFR from serum creatinine in Japan. J. Natl. Kidney Found 2009, 53, 982–992. [Google Scholar] [CrossRef] [PubMed] [Green Version]
- Imatoh, T.; Kamimura, S.; Tanihara, S. Moderate oxidative stress and high antioxidative activity are associated with steatosis in Japanese males. Clin. Transl. Sci. 2013, 6, 45–49. [Google Scholar] [CrossRef] [PubMed]
- Corretti, M.C.; Anderson, T.J.; Benjamin, E.J.; Celermajer, D.; Charbonneau, F.; Creager, M.A.; Deanfield, J.; Drexler, H.; Gerhard-Herman, M.; Herrington, D.; et al. Guidelines for the ultrasound assessment of endothelial-dependent flow-mediated vasodilation of the brachial artery: A report of the International Brachial Artery Reactivity Task Force. J. Am. Coll. Cardiol. 2002, 39, 257–265. [Google Scholar] [CrossRef]
- Shigiyama, F.; Kumashiro, N.; Miyagi, M.; Ikehara, K.; Kanda, E.; Uchino, H.; Hirose, T. Effectiveness of dapagliflozin on vascular endothelial function and glycemic control in patients with early-stage type 2 diabetes mellitus: DEFENCE study. Cardiovasc. Diabetol. 2017, 16, 84. [Google Scholar] [CrossRef] [PubMed]
- Kitada, M.; Kume, S.; Takeda-Watanabe, A.; Tsuda, S.; Kanasaki, K.; Koya, D. Calorie restriction in overweight males ameliorates obesity-related metabolic alterations and cellular adaptations through anti-aging effects, possibly including AMPK and SIRT1 activation. Biochim. Biophys. Acta 2013, 1830, 4820–4827. [Google Scholar] [CrossRef] [PubMed]
- Matsumoto, T.; Asakura, H.; Hayashi, T. Does lavender aromatherapy alleviate premenstrual emotional symptoms?: A randomized crossover trial. BioPsychoSoc. Med. 2013, 7. [Google Scholar] [CrossRef] [PubMed]
- Yokoyama, K. POMS Shortened Version; Kaneko Shobo: Tokyo, Japan, 2015. (In Japanese) [Google Scholar]
- Price, D.D.; Bush, F.M.; Long, S.; Harkins, S.W. A comparison of pain measurement characteristics of mechanical visual analogue and simple numerical rating scales. Pain 1994, 56, 217–226. [Google Scholar] [CrossRef]
- Uchida-Maruki, H.; Inagaki, H.; Ito, R.; Kurita, I.; Sai, M.; Ito, T. Piceatannol lowers the blood glucose level in diabetic mice. Biol. Pharm. Bull. 2015, 38, 629–633. [Google Scholar] [CrossRef] [PubMed]
- Minakawa, M.; Miura, Y.; Yagasaki, K. Piceatannol, a resveratrol derivative, promotes glucose uptake through glucose transporter 4 translocation to plasma membrane in L6 myocytes and suppresses blood glucose levels in type 2 diabetic model db/db mice. Biochem. Biophys. Res. Commun. 2012, 422, 469–475. [Google Scholar] [CrossRef] [PubMed]
- Zhang, A.J.; Rimando, A.M.; Mizuno, C.S.; Mathews, S.T. alpha-Glucosidase inhibitory effect of resveratrol and piceatannol. J. Nutr. Biochem. 2017, 47, 86–93. [Google Scholar] [CrossRef] [PubMed]
- Tang, Y.L.; Chan, S.W. A review of the pharmacological effects of piceatannol on cardiovascular diseases. Phytother. Res. 2014, 28, 1581–1588. [Google Scholar] [CrossRef] [PubMed]
- Yamamoto, T.; Li, Y.; Hanafusa, Y.; Yeh, Y.S.; Maruki-Uchida, H.; Kawakami, S.; Sai, M.; Goto, T.; Ito, T.; Kawada, T. Piceatannol exhibits anti-inflammatory effects on macrophages interacting with adipocytes. Food Sci. Nutr. 2017, 5, 76–85. [Google Scholar] [CrossRef] [PubMed]
- Gimbrone, M.A., Jr.; Garcia-Cardena, G. Endothelial Cell Dysfunction and the Pathobiology of Atherosclerosis. Circ. Res. 2016, 118, 620–636. [Google Scholar] [CrossRef] [PubMed]
- Frombaum, M.; Therond, P.; Djelidi, R.; Beaudeux, J.L.; Bonnefont-Rousselot, D.; Borderie, D. Piceatannol is more effective than resveratrol in restoring endothelial cell dimethylarginine dimethylaminohydrolase expression and activity after high-glucose oxidative stress. Free Radic. Res. 2011, 45, 293–302. [Google Scholar] [CrossRef] [PubMed]
- Nguyen, M.C.; Ryoo, S. Intravenous administration of piceatannol, an arginase inhibitor, improves endothelial dysfunction in aged mice. Korean J. Physiol. Pharmacol. 2017, 21, 83–90. [Google Scholar] [CrossRef] [PubMed]
- Jeong, S.O.; Son, Y.; Lee, J.H.; Cheong, Y.K.; Park, S.H.; Chung, H.T.; Pae, H.O. Resveratrol analog piceatannol restores the palmitic acid-induced impairment of insulin signaling and production of endothelial nitric oxide via activation of anti-inflammatory and antioxidative heme oxygenase-1 in human endothelial cells. Mol. Med. Rep. 2015, 12, 937–944. [Google Scholar] [CrossRef] [PubMed]
- Verberne, A.J.; Stornetta, R.L.; Guyenet, P.G. Properties of C1 and other ventrolateral medullary neurones with hypothalamic projections in the rat. J. Physiol. 1999, 517 Pt 2, 477–494. [Google Scholar] [CrossRef] [PubMed]
- Ma, H.J.; Cao, Y.K.; Liu, Y.X.; Wang, R.; Wu, Y.M. Microinjection of resveratrol into rostral ventrolateral medulla decreases sympathetic vasomotor tone through nitric oxide and intracellular Ca2+ in anesthetized male rats. Acta Pharmacol. Sin. 2008, 29, 906–912. [Google Scholar] [CrossRef] [PubMed]
- Hijona, E.; Aguirre, L.; Pérez-Matute, P.; Villanueva-Millán, M.J.; Mosqueda-Solis, A.; Hasnaoui, M.; Nepveu, F.; Senard, J.M.; Bujanda, L.; Aldámiz-Echevarría, L.; et al. Limited beneficial effects of piceatannol supplementation on obesity complications in the obese Zucker rat: Gut microbiota, metabolic, endocrine, and cardiac aspects. J. Physiol. Biochem. 2016, 72, 567–582. [Google Scholar] [CrossRef] [PubMed]
- Tung, Y.C.; Lin, Y.H.; Chen, H.J.; Chou, S.C.; Cheng, A.C.; Kalyanam, N.; Ho, C.T.; Pan, M.H. Piceatannol Exerts Anti-Obesity Effects in C57BL/6 Mice through Modulating Adipogenic Proteins and Gut Microbiota. Molecules 2016, 21, 1419. [Google Scholar] [CrossRef] [PubMed]


| Characteristics | Men | Women | ||||||||||
|---|---|---|---|---|---|---|---|---|---|---|---|---|
| Non-Overweight | Overweight | Non-Overweight | Overweight | |||||||||
| Placebo n = 5 | Piceatannol n = 5 | p value | Placebo n = 5 | Piceatannol n = 5 | p value | Placebo n = 5 | Piceatannol n = 5 | p value | Placebo n = 4 | Piceatannol n = 5 | p Value | |
| Age (year) | 38.8 ± 11.1 | 31.6 ± 4.4 | 0.3457 | 36.4 ± 5.5 | 32.0 ± 6.8 | 0.1732 | 38.0 ± 7.5 | 34.0 ± 7.6 | 0.2087 | 40.5 ± 14.5 | 39.8 ± 9.5 | 1.0000 |
| Body weight (kg) | 66.3 ± 3.4 | 64.3 ± 4.5 | 0.6761 | 79.1 ± 6.1 | 75.4 ± 4.3 | 0.2963 | 48.5 ± 4.9 | 50.4 ± 3.2 | 0.3457 | 63.6 ± 9.3 | 70.2 ± 7.0 | 0.1779 |
| Body mass index (kg/m2) | 22.2 ± 2.1 | 21.8 ± 1.6 | 1.0000 | 28.0 ± 0.9 | 26.9 ± 1.1 | 0.2087 | 20.5 ± 1.6 | 19.2 ± 1.5 | 0.1437 | 26.5 ± 2.7 | 28.0 ± 3.0 | 0.9009 |
| Systolic BP (mmHg) | 124.2 ± 11.3 | 119.8 ± 14.5 | 0.6761 | 120.6 ± 8.7 | 131.4 ± 8.9 | 0.1425 | 112.4 ± 10.7 | 112.4 ± 3.6 | 0.8237 | 121.0 ± 19.5 | 117.2 ± 22.7 | 0.8057 |
| Diastolic BP (mmHg) | 80.4 ± 12.1 | 68.8 ± 9.3 | 0.1732 | 77.0 ± 12.2 | 85.6 ± 6.5 | 0.2101 | 70.4 ± 9.8 | 72.8 ± 6.4 | 0.6723 | 75.0 ± 13.0 | 66.6 ± 9.0 | 0.3893 |
| Heart rate (/min) | 61.6 ± 12.1 | 62.0 ± 11.0 | 0.9166 | 58.0 ± 8.2 | 67.6 ± 5.3 | 0.6733 | 71.4 ± 13.4 | 73.6 ± 11.8 | 0.6004 | 66.5 ± 4.4 | 58.0 ± 10.0 | 0.1099 |
| Glucose (mg/dL) | 93.2 ± 5.6 | 88.4 ± 7.1 | 0.4005 | 94.2 ± 5.2 | 91.0 ± 14.2 | 0.1437 | 90.0 ± 6.1 | 81.6 ± 7.2 | 0.0947 | 96.0 ± 14.2 | 88.4 ± 7.7 | 0.3832 |
| Insulin (μU/mL) | 5.2 ± 3.3 | 3.6 ± 1.8 | 0.5309 | 6.1 ± 1.0 | 8.3 ± 1.9 | 0.0367 | 5.1 ± 1.7 | 5.5 ± 3.1 | 0.8345 | 7.5 ± 3.1 | 6.6 ± 2.2 | 0.7133 |
| HbA1c (%) | 5.6 ± 0.2 | 5.2 ± 0.2 | 0.0439 | 5.5 ± 0.1 | 5.4 ± 0.3 | 0.2017 | 5.4 ± 0.3 | 5.2 ± 0.6 | 1.0000 | 5.7 ± 0.4 | 5.7 ± 0.3 | 0.8049 |
| Glycated albumin (%) | 14.2 ± 0.9 | 13.7 ± 1.1 | 0.5309 | 12.9 ± 0.5 | 13.3 ± 1.9 | 0.9163 | 14.2 ± 1.2 | 14.4 ± 1.6 | 1.0000 | 13.5 ± 1.2 | 13.3 ± 0.4 | 1.0000 |
| Total cholesterol (mg/dL) | 188.8 ± 33.6 | 173.6 ± 15.1 | 0.4633 | 210.0 ± 43.8 | 243.2 ± 55.7 | 0.4034 | 181.4 ± 32.6 | 185.6 ± 31.0 | 0.6761 | 223.8 ± 26.5 | 210.8 ± 20.1 | 0.3893 |
| HDL cholesterol (mg/dL) | 59.6 ± 10.1 | 60.6 ± 16.3 | 1.0000 | 58.2 ± 14.4 | 54.4 ± 10.8 | 0.7526 | 70.6 ± 25.6 | 71.2 ± 8.9 | 0.5296 | 61.3 ± 12.9 | 54.0 ± 18.1 | 0.4606 |
| Triglyceride (mg/dL) | 85.2 ± 40.9 | 66.8 ± 37.2 | 0.4620 | 98.6 ± 42.9 | 181.0 ± 66.4 | 0.0367 | 48.8 ± 13.9 | 39.4 ± 10.7 | 0.2087 | 102.0 ± 29.0 | 92.0 ± 44.8 | 0.9025 |
| LDL cholesterol (mg/dL) | 109.8 ± 29.2 | 92.4 ± 9.4 | 0.4034 | 129.8 ± 28.8 | 151.0 ± 56.0 | 0.5309 | 93.2 ± 32.0 | 97.6 ± 20.8 | 0.8345 | 136.5 ± 22.8 | 131.2 ± 21.9 | 0.7133 |
| AST (U/L) | 22.6 ± 6.6 | 18.2 ± 2.6 | 0.2031 | 22.0 ± 6.7 | 34.4 ± 21.1 | 0.2477 | 15.4 ± 0.9 | 19.4 ± 6.7 | 0.2343 | 26.3 ± 10.4 | 17.6 ± 2.3 | 0.3873 |
| ALT (U/L) | 27.8 ± 22.2 | 16.4 ± 6.2 | 0.3443 | 31.8 ± 9.9 | 50.4 ± 31.3 | 0.2087 | 12.6 ± 2.4 | 18.8 ± 12.3 | 0.4633 | 34.5 ± 18.2 | 20.0 ± 8.2 | 0.1779 |
| γ-GTP (U/L) | 32.6 ± 14.8 | 29.4 ± 27.2 | 0.5309 | 74.6 ± 73.6 | 106.2 ± 99.6 | 0.2101 | 19.8 ± 6.8 | 17.0 ± 6.3 | 0.4578 | 38.8 ± 22.3 | 18.2 ± 6.5 | 0.1400 |
| Creatinine (mg/dL) | 0.9 ± 0.1 | 0.8 ± 0.1 | 0.3398 | 0.8 ± 0.0 | 0.8 ± 0.1 | 1.0000 | 0.6 ± 0.0 | 0.6 ± 0.0 | 1.0000 | 0.6 ± 0.1 | 0.6 ± 0.1 | 0.8057 |
| eGFR (mL/min/1.73 m2) | 77.2 ± 11.2 | 88.4 ± 11.1 | 0.2101 | 85.3 ± 6.7 | 89.8 ± 9.9 | 1.0000 | 85.2 ± 9.3 | 88.8 ± 9.7 | 0.5309 | 86.6 ± 23.9 | 88.0 ± 15.3 | 0.7133 |
| Uric acid (mg/dL) | 6.5 ± 1.8 | 6.3 ± 0.6 | 0.1719 | 6.7 ± 1.1 | 6.9 ± 0.6 | 1.0000 | 4.1 ± 0.8 | 4.3 ± 0.2 | 0.6761 | 5.1 ± 1.3 | 4.8 ± 0.4 | 0.7133 |
| a | Men | |||||||||||
| Non-overweight | Overweight | |||||||||||
| Placebo (n = 5) | Piceatannol (n = 5) | Placebo (n = 5) | Piceatannol (n = 5) | |||||||||
| 0 Week | 8 Weeks | p | 0 Week | 8 Weeks | p | 0 week | 8 Weeks | p | 0 Week | 8 Weeks | p | |
| BW (kg) | 66.3 ± 3.4 | 65.8 ± 4.1 | 0.4399 | 64.3 ± 4.5 | 64.8 ± 4.8 | 0.1872 | 79.1 ± 6.1 | 78.6 ± 5.9 | 0.3153 | 75.4 ± 4.3 | 73.9 ± 6.2 | 0.1724 |
| BMI (kg/m2) | 22.2 ± 2.1 | 22.0 ± 2.3 | 0.3380 | 21.8 ± 1.6 | 22.0 ± 1.5 | 0.2262 | 28.0 ± 0.9 | 27.8 ± 0.7 | 0.3472 | 26.9 ± 1.1 | 26.3 ± 1.6 | 0.1641 |
| Fat (%) | 18.6 ± 4.2 | 18.9 ± 4.5 | 0.4237 | 17.3 ± 2.6 | 17.6 ± 1.8 | 0.4691 | 28.8 ± 1.5 | 28.5 ± 1.7 | 0.5231 | 26.7 ± 3.7 | 26.7 ± 3.4 | 0.8915 |
| Muscle (kg) | 30.3 ± 2.5 | 29.9 ± 2.6 | 0.1250 | 29.8 ± 1.5 | 29.9 ± 1.7 | 0.8750 | 31.8 ± 3.2 | 31.7 ± 2.8 | 0.625 | 31.3 ± 3.1 | 30.8 ± 3.5 | 0.1875 |
| VFA (cm2) | 48.4 ± 12.9 | 49.2 ± 15.7 | 0.8125 | 44.1 ± 13.7 | 45.8 ± 12.6 | 0.0625 | 92.6 ± 7.1 | 91.9 ± 9.2 | 0.8125 | 81.3 ± 15.6 | 78.5 ± 16.7 | 0.3125 |
| Systolic BP (mmHg) | 124.2 ± 11.3 | 121.2 ± 4.8 | 0.4705 | 119.8 ± 14.5 | 110.8 ± 9.6 | 0.2499 | 120.6 ± 8.7 | 119.2 ± 16.2 | 0.8029 | 131.4 ± 8.9 | 120.8 ± 14.4 | 0.0279 |
| Diastolic BP (mmHg) | 80.4 ± 12.1 | 71.4 ± 9.8 | 0.0432 | 68.8 ± 9.3 | 64.6 ± 12.4 | 0.1960 | 77.0 ± 12.2 | 71.0 ± 15.8 | 0.1278 | 85.6 ± 6.5 | 77.0 ± 11.9 | 0.0304 |
| Heart rate (/min) | 61.6 ± 12.1 | 66.0 ± 11.3 | 0.1302 | 62.0 ± 11.0 | 58.0 ± 11.5 | 0.2179 | 58.0 ± 8.2 | 55.2 ± 7.7 | 0.3182 | 67.6 ± 5.3 | 59.0 ± 7.9 | 0.0360 |
| b | Women | |||||||||||
| Non-overweight | Overweight | |||||||||||
| Placebo (n = 5) | Piceatannol (n = 5) | Placebo (n = 4) | Piceatannol (n = 5) | |||||||||
| 0 Week | 8 Weeks | p | 0 Week | 8 Weeks | p | 0 Week | 8 Weeks | p | 0 Week | 8 Weeks | p | |
| BW (kg) | 48.5 ± 4.9 | 48.7 ± 5.4 | 0.7267 | 50.4 ± 3.2 | 49.9 ± 3.3 | 0.1979 | 63.6 ± 9.3 | 63.1 ± 8.7 | 0.6288 | 70.2 ± 7.0 | 70.2 ± 6.4 | 0.8806 |
| BMI (kg/m2) | 20.5 ± 1.6 | 20.6 ± 1.7 | 0.7717 | 19.2 ± 1.5 | 18.9 ± 1.4 | 0.1698 | 26.5 ± 2.7 | 26.3 ± 2.5 | 0.6430 | 28.0 ± 3.0 | 28.0 ± 2.8 | 0.6974 |
| Fat (%) | 27.0 ± 5.7 | 27.0 ± 5.3 | 1.0000 | 22.7 ± 4.4 | 21.3 ± 3.5 | 0.0791 | 37.9 ± 2.5 | 37.2 ± 3.0 | 0.1008 | 41.2 ± 2.6 | 41.4 ± 3.2 | 0.7438 |
| Muscle (kg) | 18.9 ± 1.9 | 18.9 ± 1.7 | 0.6875 | 21.0 ± 1.2 | 21.2 ± 1.3 | 0.7500 | 21.4 ± 3.6 | 21.4 ± 3.4 | 0.7500 | 22.3 ± 2.4 | 22.2 ± 2.3 | 0.6875 |
| VFA (cm2) | 57.2 ± 21.5 | 57.0 ± 22.7 | 1.0000 | 48.3 ± 11.3 | 45.0 ± 10.6 | 0.0625 | 118.7 ± 22.5 | 114.1 ± 24.7 | 0.3750 | 149.2 ± 25.8 | 149.2 ± 28.7 | 1.0000 |
| Systolic BP (mmHg) | 112.4 ± 10.7 | 113.2 ± 9.2 | 0.9156 | 112.4 ± 3.6 | 113.2 ± 8.3 | 0.8648 | 121.0 ± 19.5 | 116.8 ± 14.8 | 0.4787 | 117.2 ± 22.7 | 113.0 ± 14.9 | 0.6587 |
| Diastolic BP (mmHg) | 70.4 ± 9.8 | 70.6 ± 4.6 | 0.9686 | 72.8 ± 6.4 | 69.8 ± 8.0 | 0.4734 | 75.0 ± 13.0 | 72.8 ± 14.6 | 0.3910 | 66.6 ± 9.0 | 68.0 ± 6.7 | 0.5940 |
| Heart rate (/min) | 71.4 ± 13.4 | 69.4 ± 7.8 | 0.6046 | 73.6 ± 11.8 | 63.6 ± 3.8 | 0.1925 | 66.5 ± 4.4 | 67.0 ± 7.0 | 0.8273 | 58.0 ± 10.0 | 59.8 ± 9.0 | 0.3456 |
| a | Men | |||||||||||
| Non-Overweight | Overweight | |||||||||||
| Placebo (n = 5) | Piceatannol (n = 5) | Placebo (n = 5) | Piceatannol (n = 5) | |||||||||
| 0 Week | 8 Weeks | p | 0 Week | 8 Weeks | p | 0 Week | 8 Weeks | p | 0 Week | 8 Weeks | p | |
| Glucose (mg/dL) | 93.2 ± 5.6 | 94.0 ± 8.6 | 0.7174 | 88.4 ± 7.1 | 87.0 ± 6.0 | 0.6437 | 94.2 ± 5.2 | 97.8 ± 5.0 | 0.1561 | 91.0 ± 14.2 | 90.8 ± 8.8 | 0.9515 |
| Insulin (μU/mL) | 5.2 ± 3.3 | 4.7 ± 2.1 | 0.5821 | 3.6 ± 1.8 | 3.9 ± 1.0 | 0.7931 | 6.1 ± 1.0 | 7.7 ± 2.9 | 0.1918 | 8.3 ± 1.9 | 6.7 ± 1.4 | 0.0244 |
| HOMA-IR | 1.2 ± 0.8 | 1.1 ± 0.6 | 0.6250 | 0.8 ± 0.4 | 0.8 ± 0.2 | 1.0000 | 1.4 ± 0.2 | 1.9 ± 0.8 | 0.1250 | 1.9 ± 0.8 | 1.5 ± 0.5 | 0.0625 |
| HbA1c (%) | 5.6 ± 0.2 | 5.5 ± 0.2 | 0.1250 | 5.2 ± 0.2 | 5.2 ± 0.2 | 0.7500 | 5.5 ± 0.1 | 5.4 ± 0.1 | 0.2500 | 5.4 ± 0.3 | 5.5 ± 0.2 | 0.6250 |
| Glycated albumin (%) | 14.2 ± 0.9 | 14.1 ± 0.9 | 0.7753 | 13.7 ± 1.1 | 13.5 ± 1.0 | 0.4113 | 12.9 ± 0.5 | 12.6 ± 0.7 | 0.1404 | 13.3 ± 1.9 | 13.1 ± 2.0 | 0.2560 |
| b | Women | |||||||||||
| Non-overweight | Overweight | |||||||||||
| Placebo (n = 5) | Piceatannol (n = 5) | Placebo (n = 4) | Piceatannol (n = 5) | |||||||||
| 0 Week | 8 Weeks | p | 0 Week | 8 Weeks | p | 0 Week | 8 Weeks | p | 0 Week | 8 Weeks | p | |
| Glucose (mg/dL) | 90.0 ± 6.1 | 88.6 ± 6.2 | 0.3111 | 81.6 ± 7.2 | 82.8 ± 4.3 | 0.7624 | 96.0 ± 14.2 | 95.0 ± 12.5 | 0.4740 | 88.4 ± 7.7 | 90.2 ± 6.2 | 0.4211 |
| Insulin (μU/mL) | 5.1 ± 1.7 | 5.6 ± 1.2 | 0.5578 | 5.5 ± 3.1 | 5.7 ± 1.9 | 0.9017 | 7.5 ± 3.1 | 7.2 ± 3.0 | 0.8859 | 6.6 ± 2.2 | 7.4 ± 1.1 | 0.2789 |
| HOMA-IR | 1.1 ± 0.3 | 1.2 ± 0.3 | 1.0000 | 1.1 ± 0.5 | 1.2 ± 0.4 | 0.8750 | 1.9 ± 1.0 | 1.7 ± 0.8 | 0.8750 | 1.5 ± 0.5 | 1.7 ± 0.2 | 0.2500 |
| HbA1c (%) | 5.4 ± 0.3 | 5.6 ± 0.3 | 0.1250 | 5.2 ± 0.6 | 5.1 ± 0.6 | 0.5000 | 5.7 ± 0.4 | 5.7 ± 0.3 | 1.0000 | 5.7 ± 0.3 | 5.7 ± 0.3 | 0.7500 |
| Glycated albumin (%) | 14.2 ± 1.2 | 14.2 ± 1.5 | 0.8083 | 14.4 ± 1.6 | 13.9 ± 1.4 | 0.0118 | 13.5 ± 1.2 | 13.5 ± 1.0 | 0.6714 | 13.3 ± 0.4 | 13.3 ± 0.4 | 0.9062 |
| c | Men | |||||||||||
| Non-overweight | Overweight | |||||||||||
| Placebo (n = 5) | Piceatannol (n = 5) | p | Placebo (n = 5) | Piceatannol (n = 5) | p | |||||||
| Glucose (%) | 0.8 ± 4.8 | −1.3 ± 7.2 | 0.6761 | 3.9 ± 4.9 | 0.5 ± 6.9 | 0.5309 | ||||||
| Insulin (%) | 5.7 ± 43.5 | 33.8 ± 77.6 | 0.6761 | 23.7 ± 31.8 | −18.8 ± 11.2 | 0.0216 | ||||||
| HOMA-IR (%) | 5.4 ± 47.6 | 26.7 ± 67.3 | 0.9166 | 31.4 ± 39.7 | −17.2 ± 11.5 | 0.0160 | ||||||
| HbA1c (%) | −1.8 ± 1.2 | 1.3 ± 4.4 | 0.2031 | −1.1 ± 1.0 | 1.2 ± 3.0 | 0.2017 | ||||||
| Glycated albumin (%) | −0.4 ± 3.2 | −1.6 ± 4.2 | 0.5309 | −2.5 ± 3.2 | −1.3 ± 2.3 | 0.4020 | ||||||
| a | Men | |||||||||||
| Non-Overweight | Overweight | |||||||||||
| Placebo (n = 5) | Piceatannol (n = 5) | Placebo (n = 5) | Piceatannol (n = 5) | |||||||||
| 0 Week | 8 Weeks | p | 0 Week | 8 Weeks | p | 0 Week | 8 Weeks | p | 0 Week | 8 Weeks | p | |
| AST (U/L) | 22.6 ± 6.6 | 22.2 ± 7.9 | 0.8125 | 18.2 ± 2.6 | 19.8 ± 2.8 | 0.5000 | 22.0 ± 6.7 | 19.8 ± 4.7 | 0.2500 | 34.4 ± 21.1 | 23.4 ± 2.2 | 0.3125 |
| ALT (U/L) | 27.8 ± 22.2 | 28.4 ± 25.9 | 0.8750 | 16.4 ± 6.2 | 16.4 ± 5.0 | 1.0000 | 31.8 ± 9.9 | 31.0 ± 8.6 | 1.0000 | 50.4 ± 31.3 | 38.6 ± 13.2 | 0.1875 |
| γ-GTP (U/L) | 32.6 ± 14.8 | 29.0 ± 17.3 | 0.8125 | 29.4 ± 27.2 | 26.6 ± 20.5 | 0.7500 | 74.6 ± 73.6 | 66.4 ± 54.0 | 0.4375 | 106.2 ± 99.6 | 89.2 ± 78.1 | 0.1250 |
| Cr (mg/dL) | 0.9 ± 0.1 | 0.9 ± 0.1 | 0.6503 | 0.8 ± 0.1 | 0.9 ± 0.1 | 0.5769 | 0.8 ± 0.0 | 0.8 ± 0.1 | 0.4543 | 0.8 ± 0.1 | 0.8 ± 0.1 | 0.3739 |
| eGFR (mL/min/1.73 m2) | 77.2 ± 11.2 | 75.5 ± 13.4 | 0.6176 | 88.4 ± 11.1 | 86.4 ± 8.7 | 0.6044 | 85.3 ± 6.7 | 87.1 ± 8.1 | 0.4120 | 89.8 ± 9.9 | 89.2 ± 11.5 | 0.5121 |
| UA (mg/dL) | 6.5 ± 1.8 | 6.6 ± 2.0 | 0.7349 | 6.3 ± 0.6 | 6.2 ± 0.6 | 0.9004 | 6.7 ± 1.1 | 6.9 ± 1.0 | 0.2904 | 6.9 ± 0.6 | 6.8 ± 0.6 | 0.4130 |
| TC (mg/dL) | 188.8 ± 33.6 | 188.6 ± 33.8 | 0.8750 | 173.6 ± 15.1 | 168.4 ± 20.8 | 0.6250 | 210.0 ± 43.8 | 210.8 ± 26.4 | 0.6250 | 243.2 ± 55.7 | 224.2 ± 47.9 | 0.0625 |
| HDL-C (mg/dL) | 59.6 ± 10.1 | 59.8 ± 9.0 | 0.7500 | 60.6 ± 16.3 | 58.0 ± 18.5 | 0.3750 | 58.2 ± 14.4 | 54.2 ± 9.4 | 0.3125 | 54.4 ± 10.8 | 53.4 ± 8.1 | 0.6875 |
| TG (mg/dL) | 85.2 ± 40.9 | 74.4 ± 31.5 | 0.3125 | 66.8 ± 37.2 | 61.8 ± 15.4 | 1.0000 | 98.6 ± 42.9 | 102.8 ± 40.9 | 1.0000 | 181.0 ± 66.4 | 126.4 ± 42.8 | 0.3125 |
| LDL-C (mg/dL) | 109.8 ± 29.2 | 109.6 ± 36.1 | 0.7500 | 92.4 ± 9.4 | 88.4 ± 7.3 | 0.6250 | 129.8 ± 28.8 | 133.6 ± 24.4 | 0.6250 | 151.0 ± 56.0 | 141.4 ± 39.6 | 0.3750 |
| FFA (μEq/L) | 362.4 ± 232.9 | 568.6 ± 104.6 | 0.2215 | 353.4 ± 185.1 | 436.0 ± 137.8 | 0.4916 | 474.2 ± 125.1 | 396.2 ± 130.4 | 0.1526 | 450.0 ± 103.6 | 532.2 ± 141.6 | 0.3593 |
| b | Women | |||||||||||
| Non-Overweight | Overweight | |||||||||||
| Placebo (n = 5) | Piceatannol (n = 5) | Placebo (n = 4) | Piceatannol (n = 5) | |||||||||
| 0 Week | 8 Weeks | p | 0 Week | 8 Weeks | p | 0 Week | 8 Weeks | p | 0 Week | 8 Weeks | p | |
| AST (U/L) | 15.4 ± 0.9 | 15.4 ± 2.4 | 1.0000 | 19.4 ± 6.7 | 23.6 ± 11.1 | 0.3750 | 26.3 ± 10.4 | 21.3 ± 6.3 | 0.2500 | 17.6 ± 2.3 | 19.4 ± 5.8 | 0.5000 |
| ALT (U/L) | 12.6 ± 2.4 | 13.4 ± 2.9 | 0.8125 | 18.8 ± 12.3 | 26.2 ± 24.3 | 0.8750 | 34.5 ± 18.2 | 25.5 ± 7.0 | 0.6250 | 20.0 ± 8.2 | 22.6 ± 9.7 | 0.2500 |
| γ-GTP (U/L) | 19.8 ± 6.8 | 25.6 ± 12.1 | 0.2500 | 17.0 ± 6.3 | 14.2 ± 3.6 | 0.6875 | 38.8 ± 22.3 | 35.8 ± 28.3 | 0.6250 | 18.2 ± 6.5 | 19.4 ± 5.4 | 0.3750 |
| Cr (mg/dL) | 0.6 ± 0.0 | 0.6 ± 0.0 | 0.1281 | 0.6 ± 0.0 | 0.6 ± 0.1 | 0.4530 | 0.6 ± 0.1 | 0.6 ± 0.1 | 0.4228 | 0.6 ± 0.1 | 0.6 ± 0.1 | 0.1668 |
| eGFR (mL/min/1.73 m2) | 85.2 ± 9.3 | 89.4 ± 10.4 | 0.1330 | 88.8 ± 9.7 | 93.0 ± 15.3 | 0.3403 | 86.6 ± 23.9 | 89.2 ± 28.3 | 0.3479 | 88.0 ± 15.3 | 83.1 ± 15.8 | 0.2376 |
| UA (mg/dL) | 4.1 ± 0.8 | 4.1 ± 0.5 | 0.9375 | 4.3 ± 0.2 | 3.8 ± 0.9 | 0.3665 | 5.1 ± 1.3 | 5.0 ± 1.4 | 0.6447 | 4.8 ± 0.4 | 4.8 ± 0.4 | 0.8390 |
| TC (mg/dL) | 181.4 ± 32.6 | 175.8 ± 19.1 | 0.6250 | 185.6 ± 31.0 | 187.0 ± 29.5 | 1.0000 | 223.8 ± 26.5 | 207.3 ± 17.1 | 0.3750 | 210.8 ± 20.1 | 213.4 ± 16.4 | 0.8125 |
| HDL-C (mg/dL) | 70.6 ± 25.6 | 66.0 ± 21.6 | 0.4375 | 71.2 ± 8.9 | 68.4 ± 8.3 | 0.1875 | 61.3 ± 12.9 | 54.8 ± 9.7 | 0.1250 | 54.0 ± 18.1 | 53.0 ± 13.5 | 0.7500 |
| TG (mg/dL) | 48.8 ± 13.9 | 55.6 ± 17.5 | 0.3125 | 39.4 ± 10.7 | 44.2 ± 9.5 | 0.4375 | 102.0 ± 29.0 | 102.5 ± 48.0 | 0.8750 | 92.0 ± 44.8 | 114.6 ± 66.3 | 0.1875 |
| LDL-C (mg/dL) | 93.2 ± 32.0 | 89.2 ± 30.4 | 0.6250 | 97.6 ± 20.8 | 102.6 ± 20.7 | 0.1250 | 136.5 ± 22.8 | 126.8 ± 19.2 | 0.2500 | 131.2 ± 21.9 | 131.0 ± 22.6 | 0.8125 |
| FFA (μEq/L) | 541.4 ± 142.4 | 774.6 ± 251.9 | 0.2217 | 543.2 ± 287.4 | 743.4 ± 158.1 | 0.1474 | 481.5 ± 110.6 | 588.3 ± 78.6 | 0.2474 | 485.8 ± 141.2 | 619.4 ± 147.3 | 0.2985 |
| a | Men | |||||||||||
| Non-Overweight | Overweight | |||||||||||
| Placebo (n = 5) | Piceatannol (n = 5) | Placebo (n = 5) | Piceatannol (n = 5) | |||||||||
| 0 Week | 8 Weeks | p | 0 Week | 8 Weeks | p | 0 Week | 8 Weeks | p | 0 Week | 8 Weeks | p | |
| FMD (%) | 7.0 ± 2.3 | 6.6 ± 2.1 | 0.8501 | 6.6 ± 4.8 | 8.4 ± 2.7 | 0.6037 | 7.5 ± 4.0 | 7.9 ± 3.9 | 0.7589 | 5.8 ± 3.9 | 5.1 ± 3.0 | 0.5940 |
| ADMA (nmol/mL) | 0.39 ± 0.04 | 0.40 ± 0.05 | 0.5734 | 0.37 ± 0.04 | 0.37 ± 0.03 | 0.7174 | 0.38 ± 0.04 | 0.40 ± 0.05 | 0.2205 | 0.37 ± 0.03 | 0.37 ± 0.05 | 0.7449 |
| hsCRP (ng/mL) | 597.8 ± 630.0 | 216.4 ± 141.9 | 0.4375 | 215.0 ± 105.8 | 627.8 ± 580.4 | 0.0625 | 2334.8 ± 3704.5 | 843.8 ± 459.5 | 0.6250 | 1086.4 ± 751.9 | 2255.4 ± 3869.1 | 1.0000 |
| IL-6 (pg/mL) | 1.22 ± 1.41 | 1.32 ± 1.90 | 0.8750 | 0.68 ± 0.31 | 0.90 ± 0.37 | 0.1250 | 1.76 ± 0.72 | 1.18 ± 0.38 | 0.1875 | 0.92 ± 0.08 | 0.80 ± 0.14 | 0.3125 |
| d-ROM (U. Carr) | 298.4 ± 94.5 | 266.2 ± 68.8 | 0.1546 | 275.6 ± 15.1 | 266.8 ± 60.9 | 0.7700 | 271.8 ± 66.3 | 268.4 ± 66.8 | 0.8592 | 317.8 ± 43.3 | 317.6 ± 89.0 | 0.9938 |
| BAP (pmol/L) | 2391.2 ± 317.3 | 2272.8 ± 195.8 | 0.3642 | 2250.8 ± 322.5 | 2276.6 ± 314.2 | 0.8604 | 2376.8 ± 214.5 | 2356.6 ± 238.6 | 0.8615 | 2136.2 ± 218.3 | 2385.8 ± 419.9 | 0.3506 |
| b | Women | |||||||||||
| Non-Overweight | Overweight | |||||||||||
| Placebo (n = 5) | Piceatannol (n = 5) | Placebo (n = 4) | Piceatannol (n = 5) | |||||||||
| 0 Week | 8 Weeks | p | 0 Week | 8 Weeks | p | 0 Week | 8 Weeks | p | 0 Week | 8 Week | p | |
| FMD (%) | 7.5 ± 1.6 | 7.8 ± 3.3 | 0.8795 | 8.0 ± 2.9 | 8.3 ± 3.6 | 0.7764 | 4.8 ± 2.1 | 5.8 ± 2.8 | 0.2860 | 6.8 ± 3.5 | 9.4 ± 2.1 | 0.0921 |
| ADMA (nmol/mL) | 0.36 ± 0.04 | 0.35 ± 0.03 | 0.3739 | 0.36 ± 0.05 | 0.36 ± 0.04 | 1.0000 | 0.45 ± 0.04 | 0.43 ± 0.03 | 0.6223 | 0.40 ± 0.06 | 0.40 ± 0.07 | 0.9264 |
| hsCRP (ng/mL) | 893.0 ± 1698.3 | 746.8 ± 671.0 | 0.6250 | 212.6 ± 233.1 | 117.6 ± 56.9 | 0.1250 | 1405.0 ± 1543.2 | 955.8 ± 953.8 | 0.3750 | 709.2 ± 703.7 | 889.8 ± 604.0 | 0.1875 |
| IL-6 (pg/mL) | 0.64 ± 0.24 | 1.30 ± 1.21 | 0.2500 | 0.92 ± 0.28 | 0.94 ± 0.21 | 1.0000 | 1.68 ± 0.59 | 1.37 ± 0.69 | 0.3750 | 1.50 ± 0.41 | 1.32 ± 0.38 | 0.6250 |
| d-ROM (U. Carr) | 349.8 ± 54.7 | 338.6 ± 20.7 | 0.6233 | 354.2 ± 37.8 | 308.6 ± 30.7 | 0.1607 | 349.3 ± 51.8 | 343.5 ± 10.8 | 0.8523 | 332.4 ± 31.8 | 362.4 ± 20.1 | 0.1058 |
| BAP (pmol/L) | 2359.2 ± 287.9 | 2407.6 ± 246.9 | 0.7853 | 2486.8 ± 182.9 | 2120.0 ± 207.7 | 0.0413 | 2151.0 ± 62.8 | 2135.8 ± 293.2 | 0.9202 | 2299.2 ± 178.5 | 2378.6 ± 430.6 | 0.6406 |
© 2017 by the authors. Licensee MDPI, Basel, Switzerland. This article is an open access article distributed under the terms and conditions of the Creative Commons Attribution (CC BY) license (http://creativecommons.org/licenses/by/4.0/).
Share and Cite
Kitada, M.; Ogura, Y.; Maruki-Uchida, H.; Sai, M.; Suzuki, T.; Kanasaki, K.; Hara, Y.; Seto, H.; Kuroshima, Y.; Monno, I.; et al. The Effect of Piceatannol from Passion Fruit (Passiflora edulis) Seeds on Metabolic Health in Humans. Nutrients 2017, 9, 1142. https://doi.org/10.3390/nu9101142
Kitada M, Ogura Y, Maruki-Uchida H, Sai M, Suzuki T, Kanasaki K, Hara Y, Seto H, Kuroshima Y, Monno I, et al. The Effect of Piceatannol from Passion Fruit (Passiflora edulis) Seeds on Metabolic Health in Humans. Nutrients. 2017; 9(10):1142. https://doi.org/10.3390/nu9101142
Chicago/Turabian StyleKitada, Munehiro, Yoshio Ogura, Hiroko Maruki-Uchida, Masahiko Sai, Taeko Suzuki, Keizo Kanasaki, Yuna Hara, Hiromi Seto, Yuka Kuroshima, Itaru Monno, and et al. 2017. "The Effect of Piceatannol from Passion Fruit (Passiflora edulis) Seeds on Metabolic Health in Humans" Nutrients 9, no. 10: 1142. https://doi.org/10.3390/nu9101142
APA StyleKitada, M., Ogura, Y., Maruki-Uchida, H., Sai, M., Suzuki, T., Kanasaki, K., Hara, Y., Seto, H., Kuroshima, Y., Monno, I., & Koya, D. (2017). The Effect of Piceatannol from Passion Fruit (Passiflora edulis) Seeds on Metabolic Health in Humans. Nutrients, 9(10), 1142. https://doi.org/10.3390/nu9101142