
Stability Study of Multi-Level Grayscales Based on Driving Waveforms for Electrowetting Displays


 ,
,
Abstract
:
1. Introduction
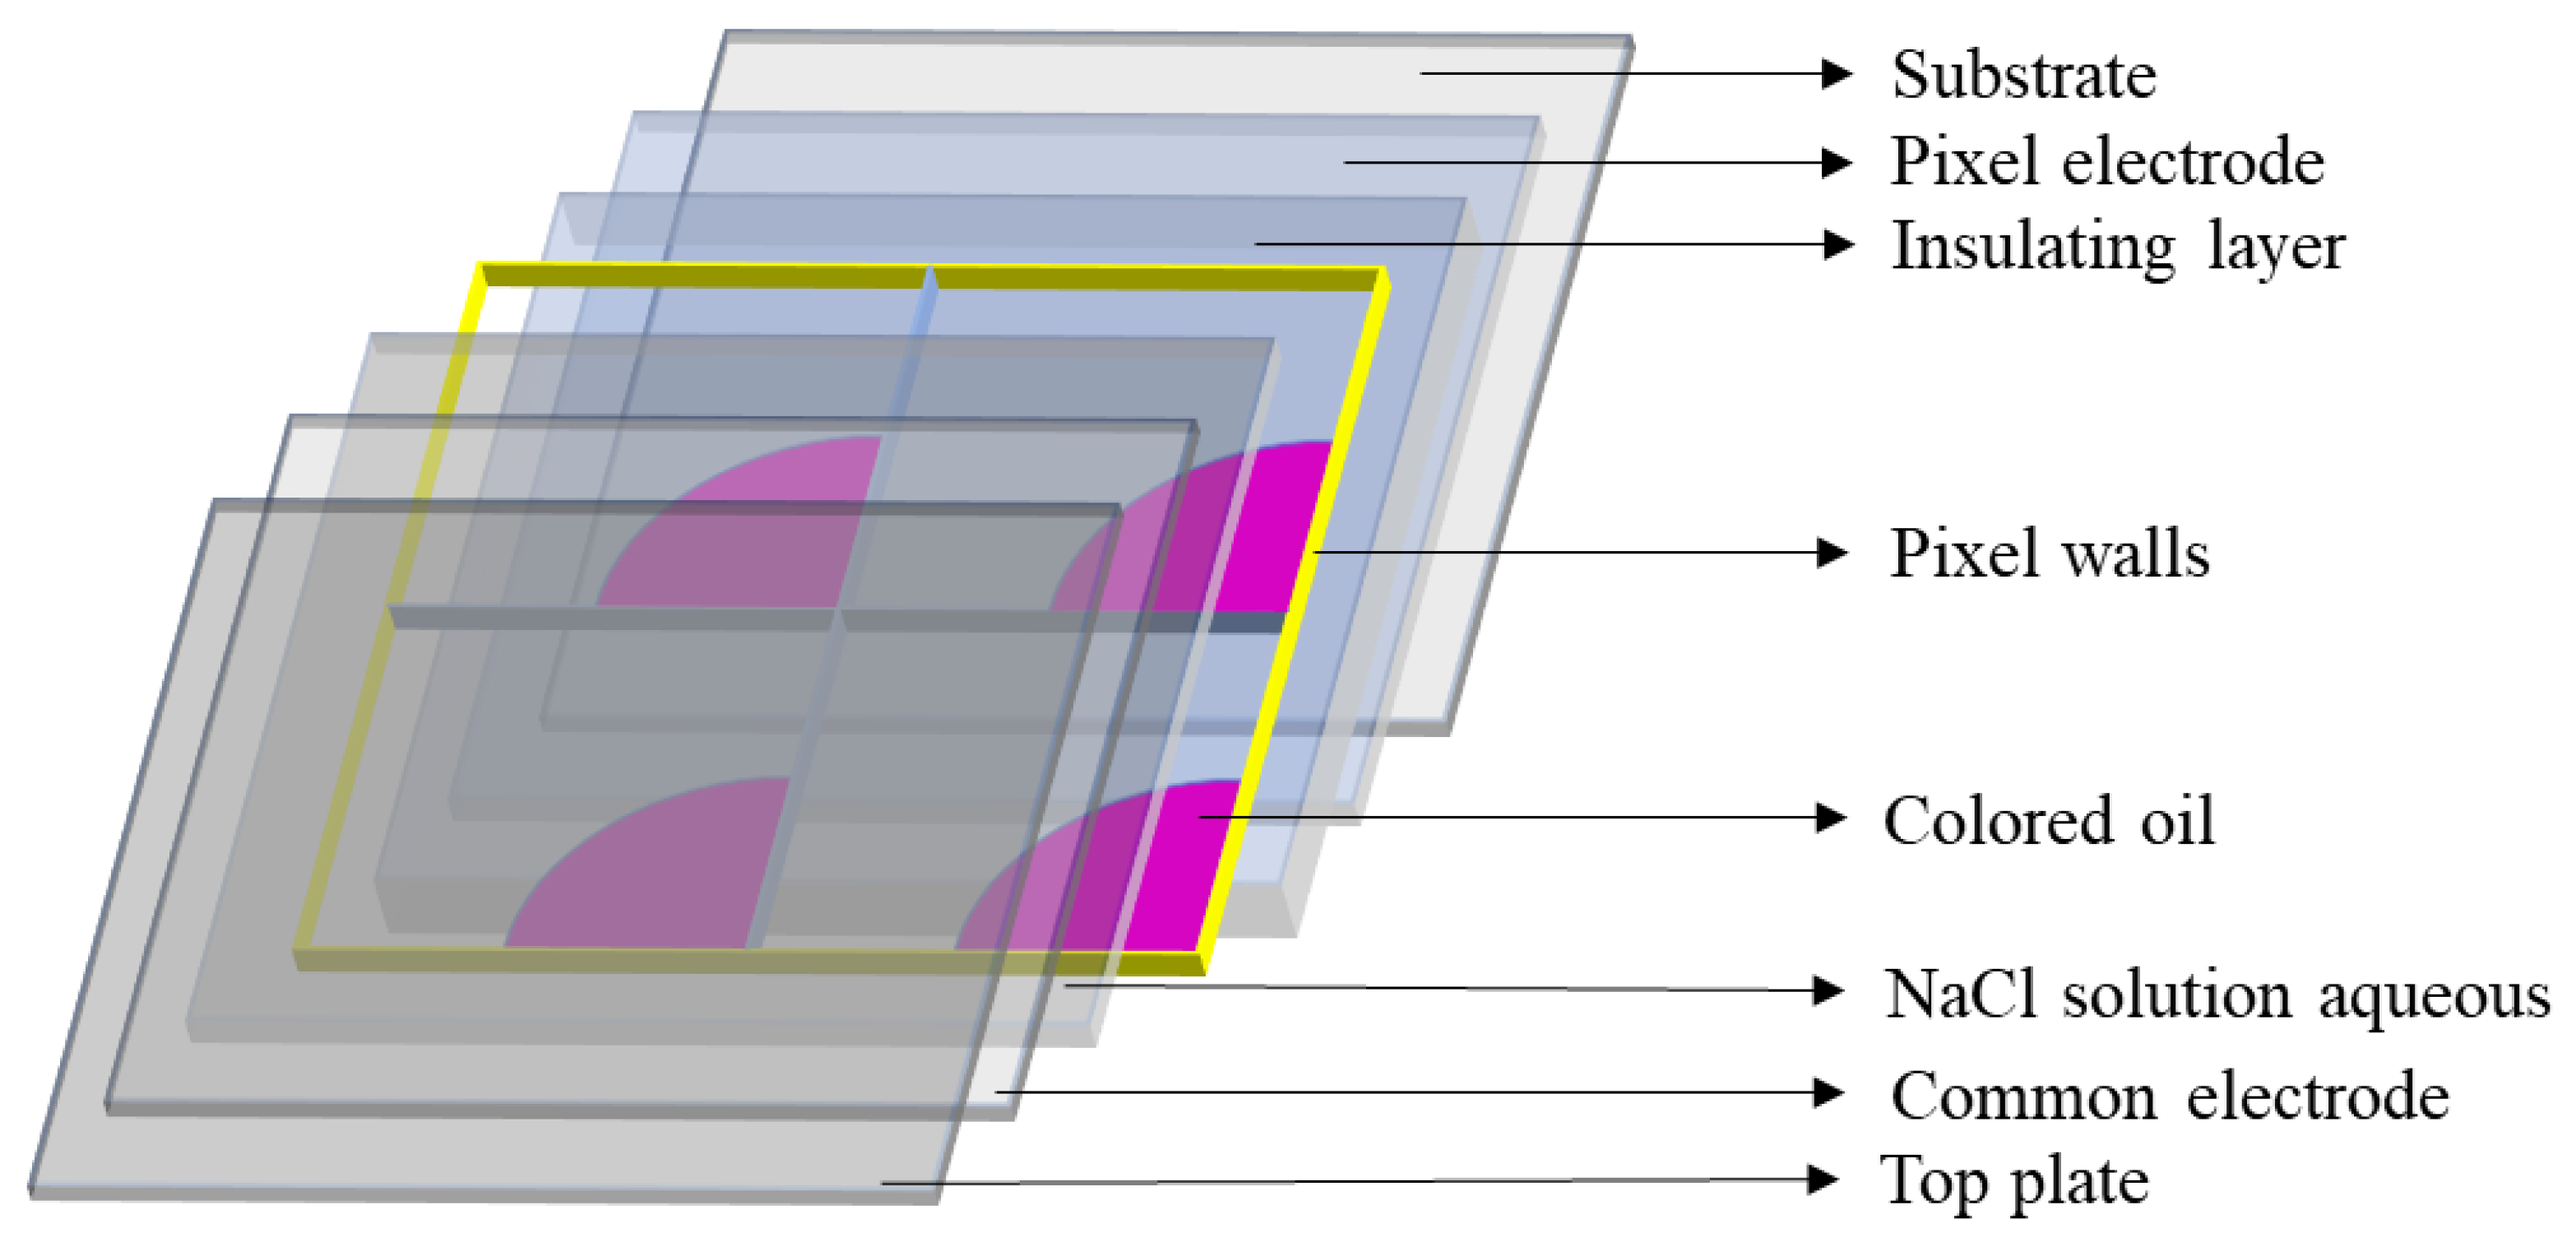
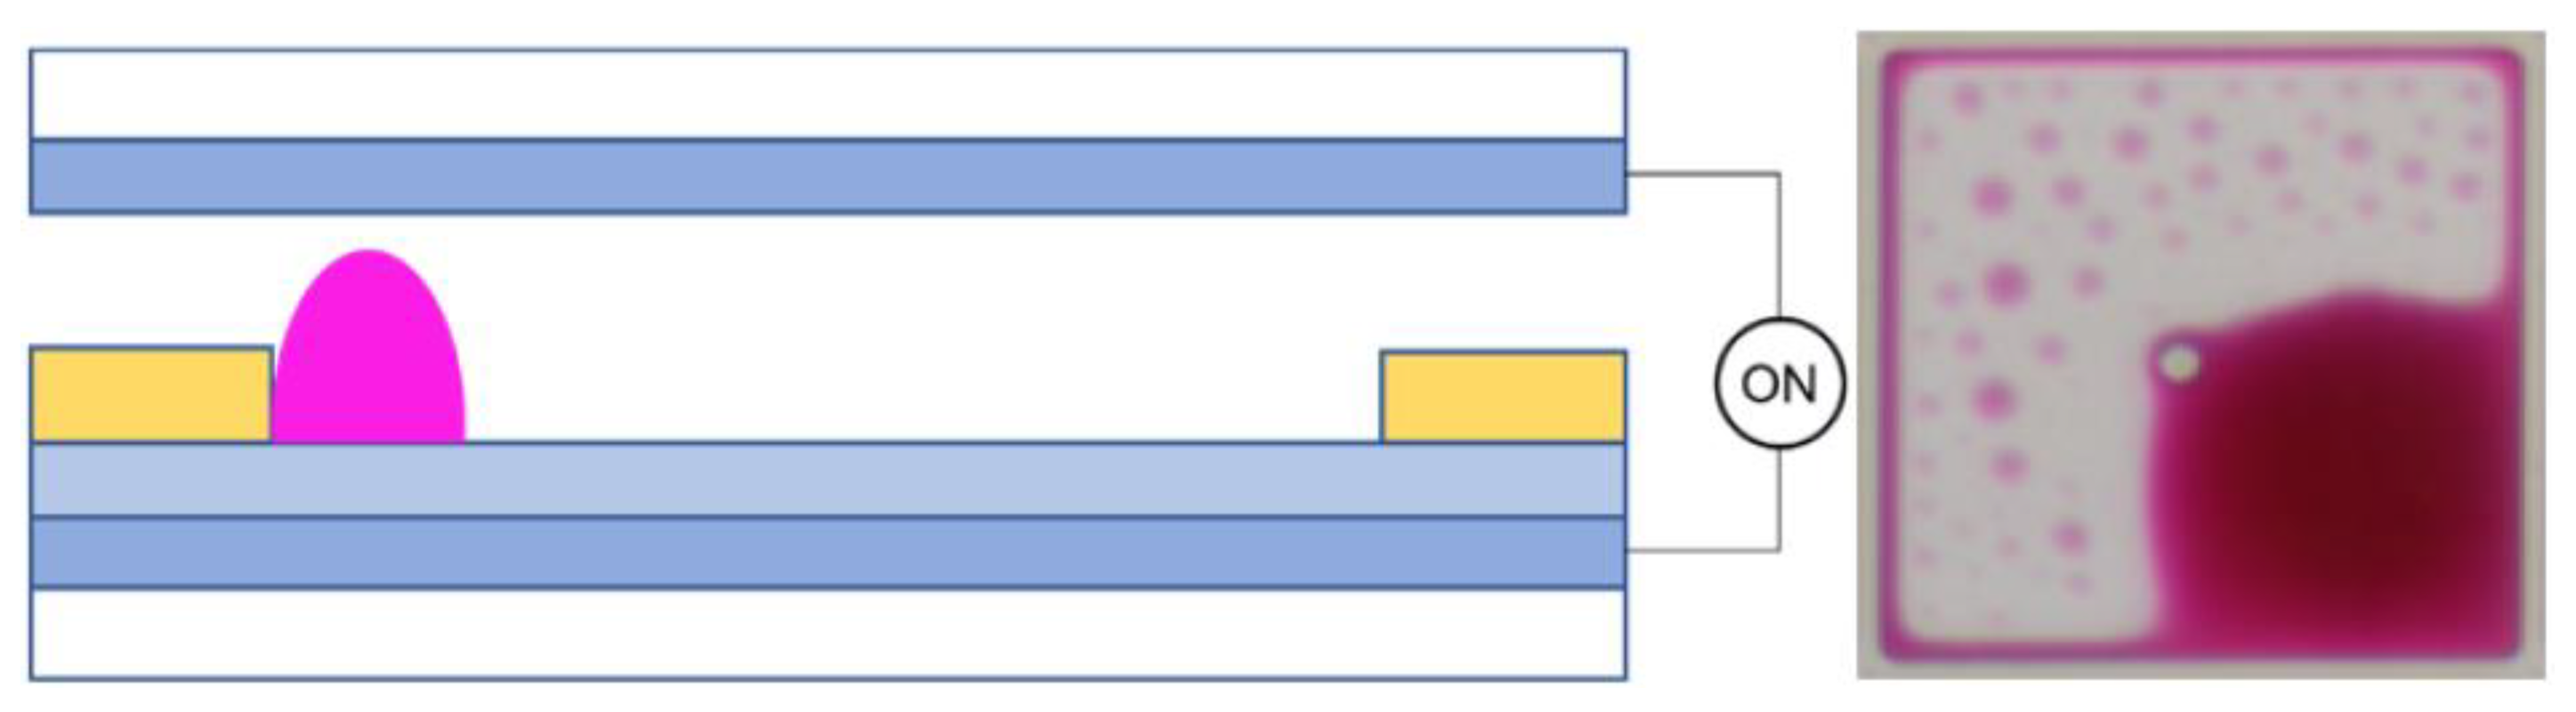
2. Driving Principle of EWDs
3. Experimental Results and Discussion
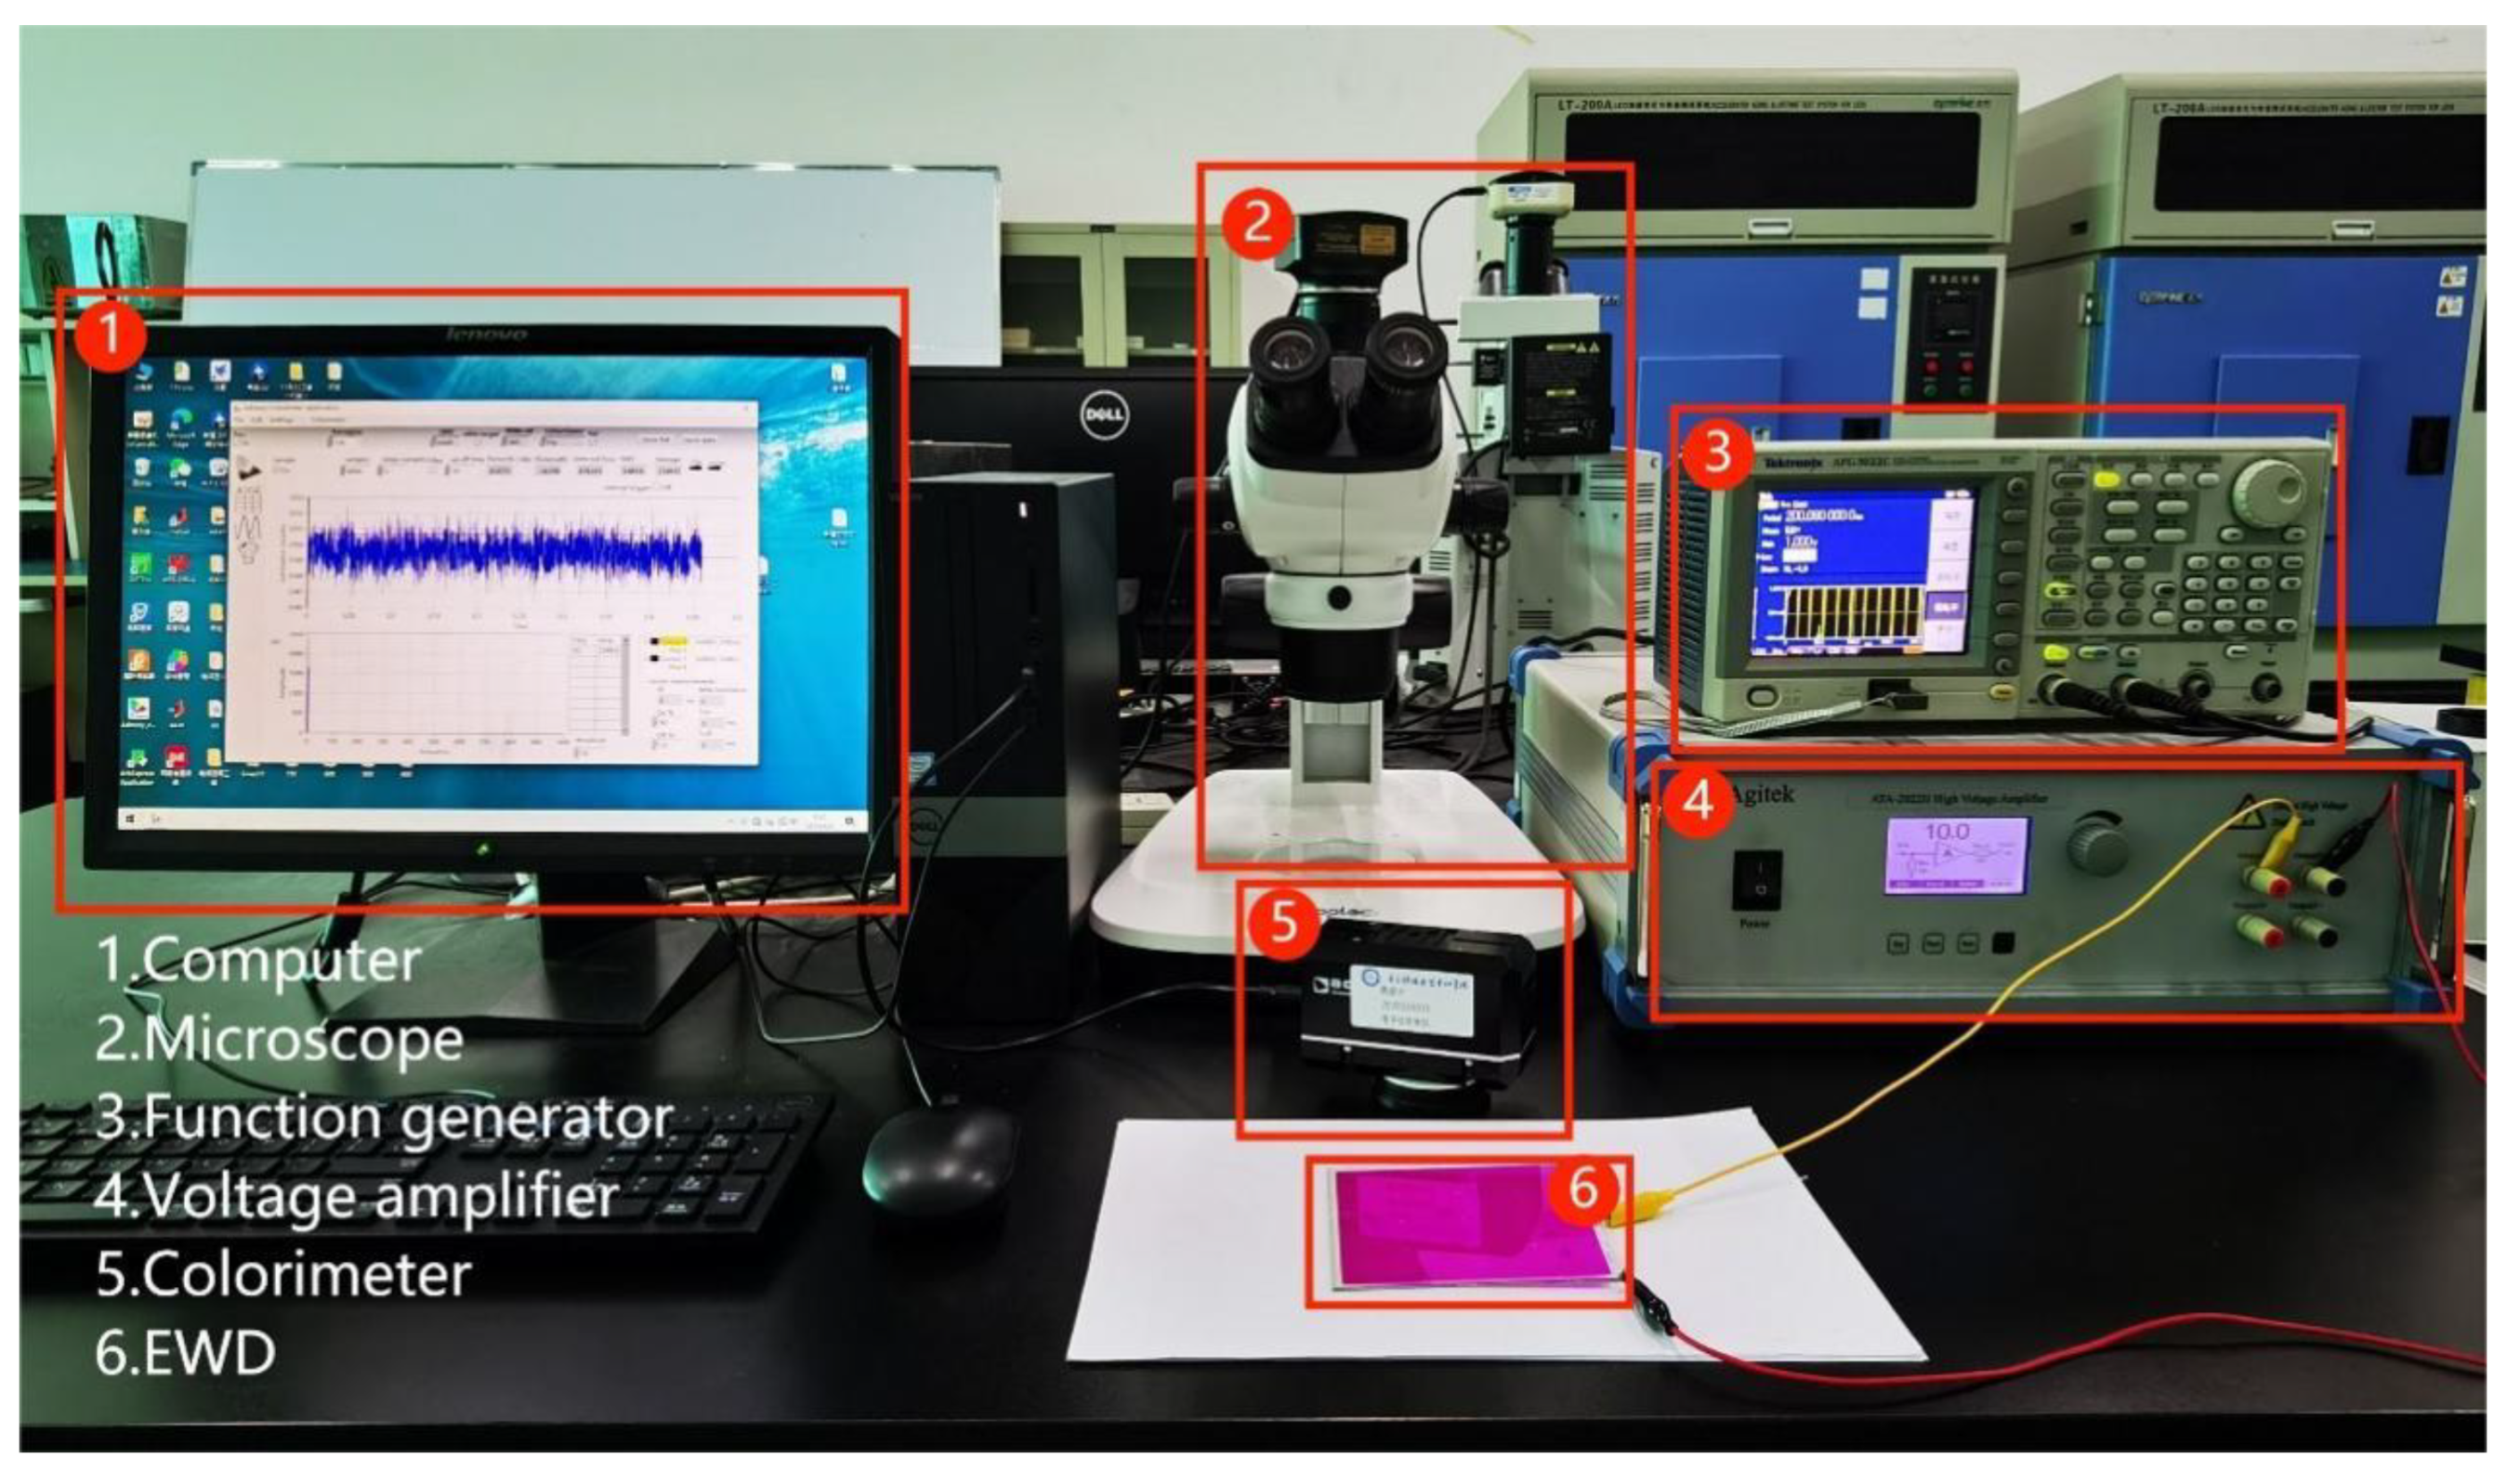
3.1. Experimental Platform
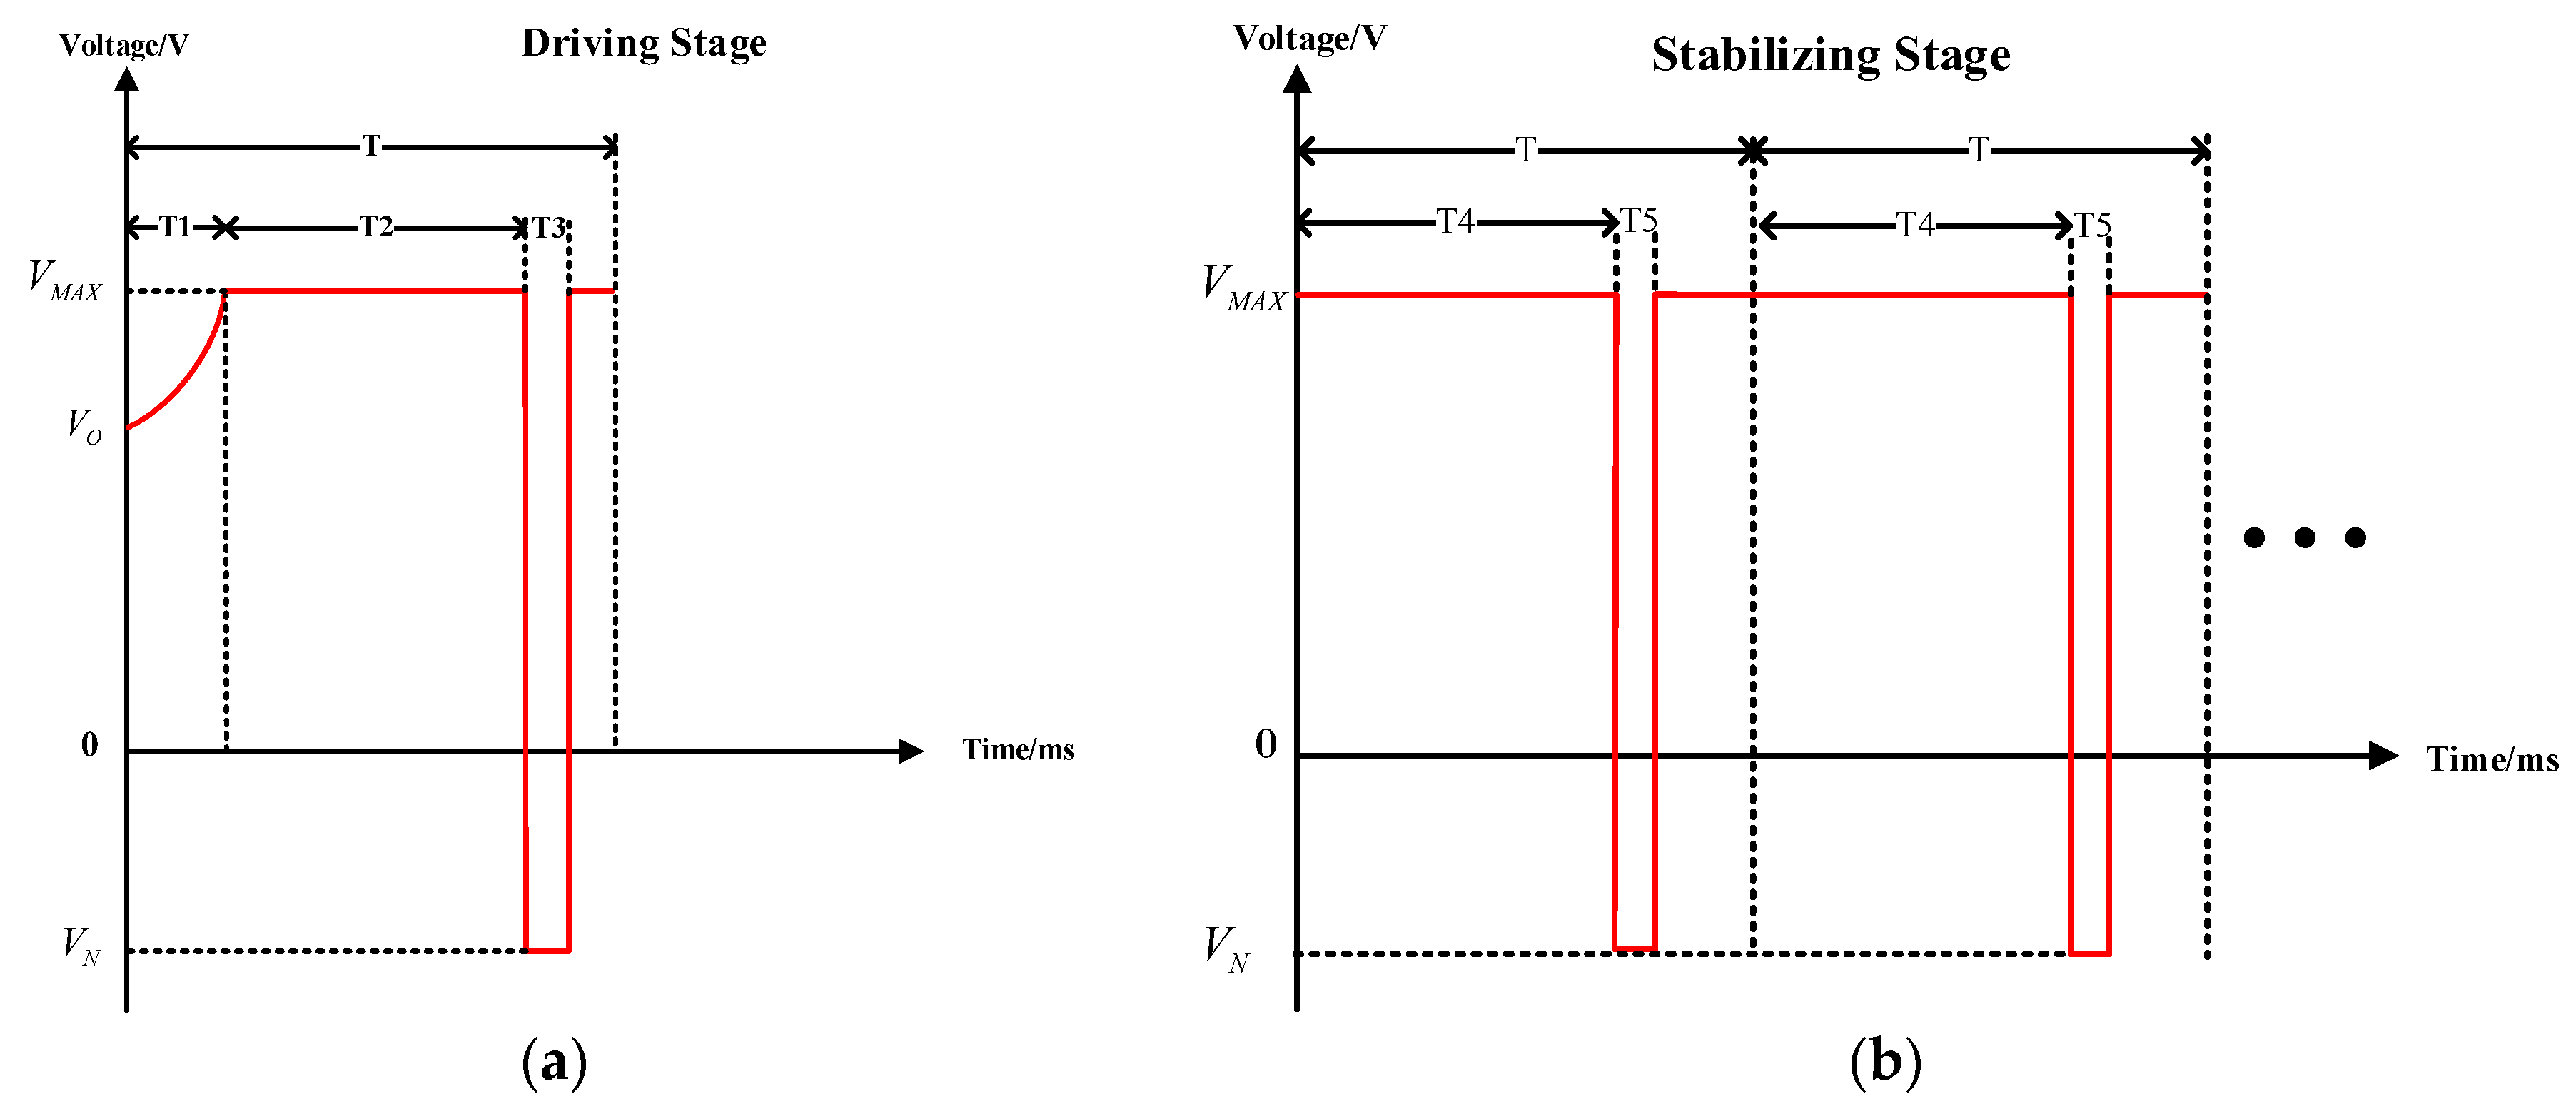
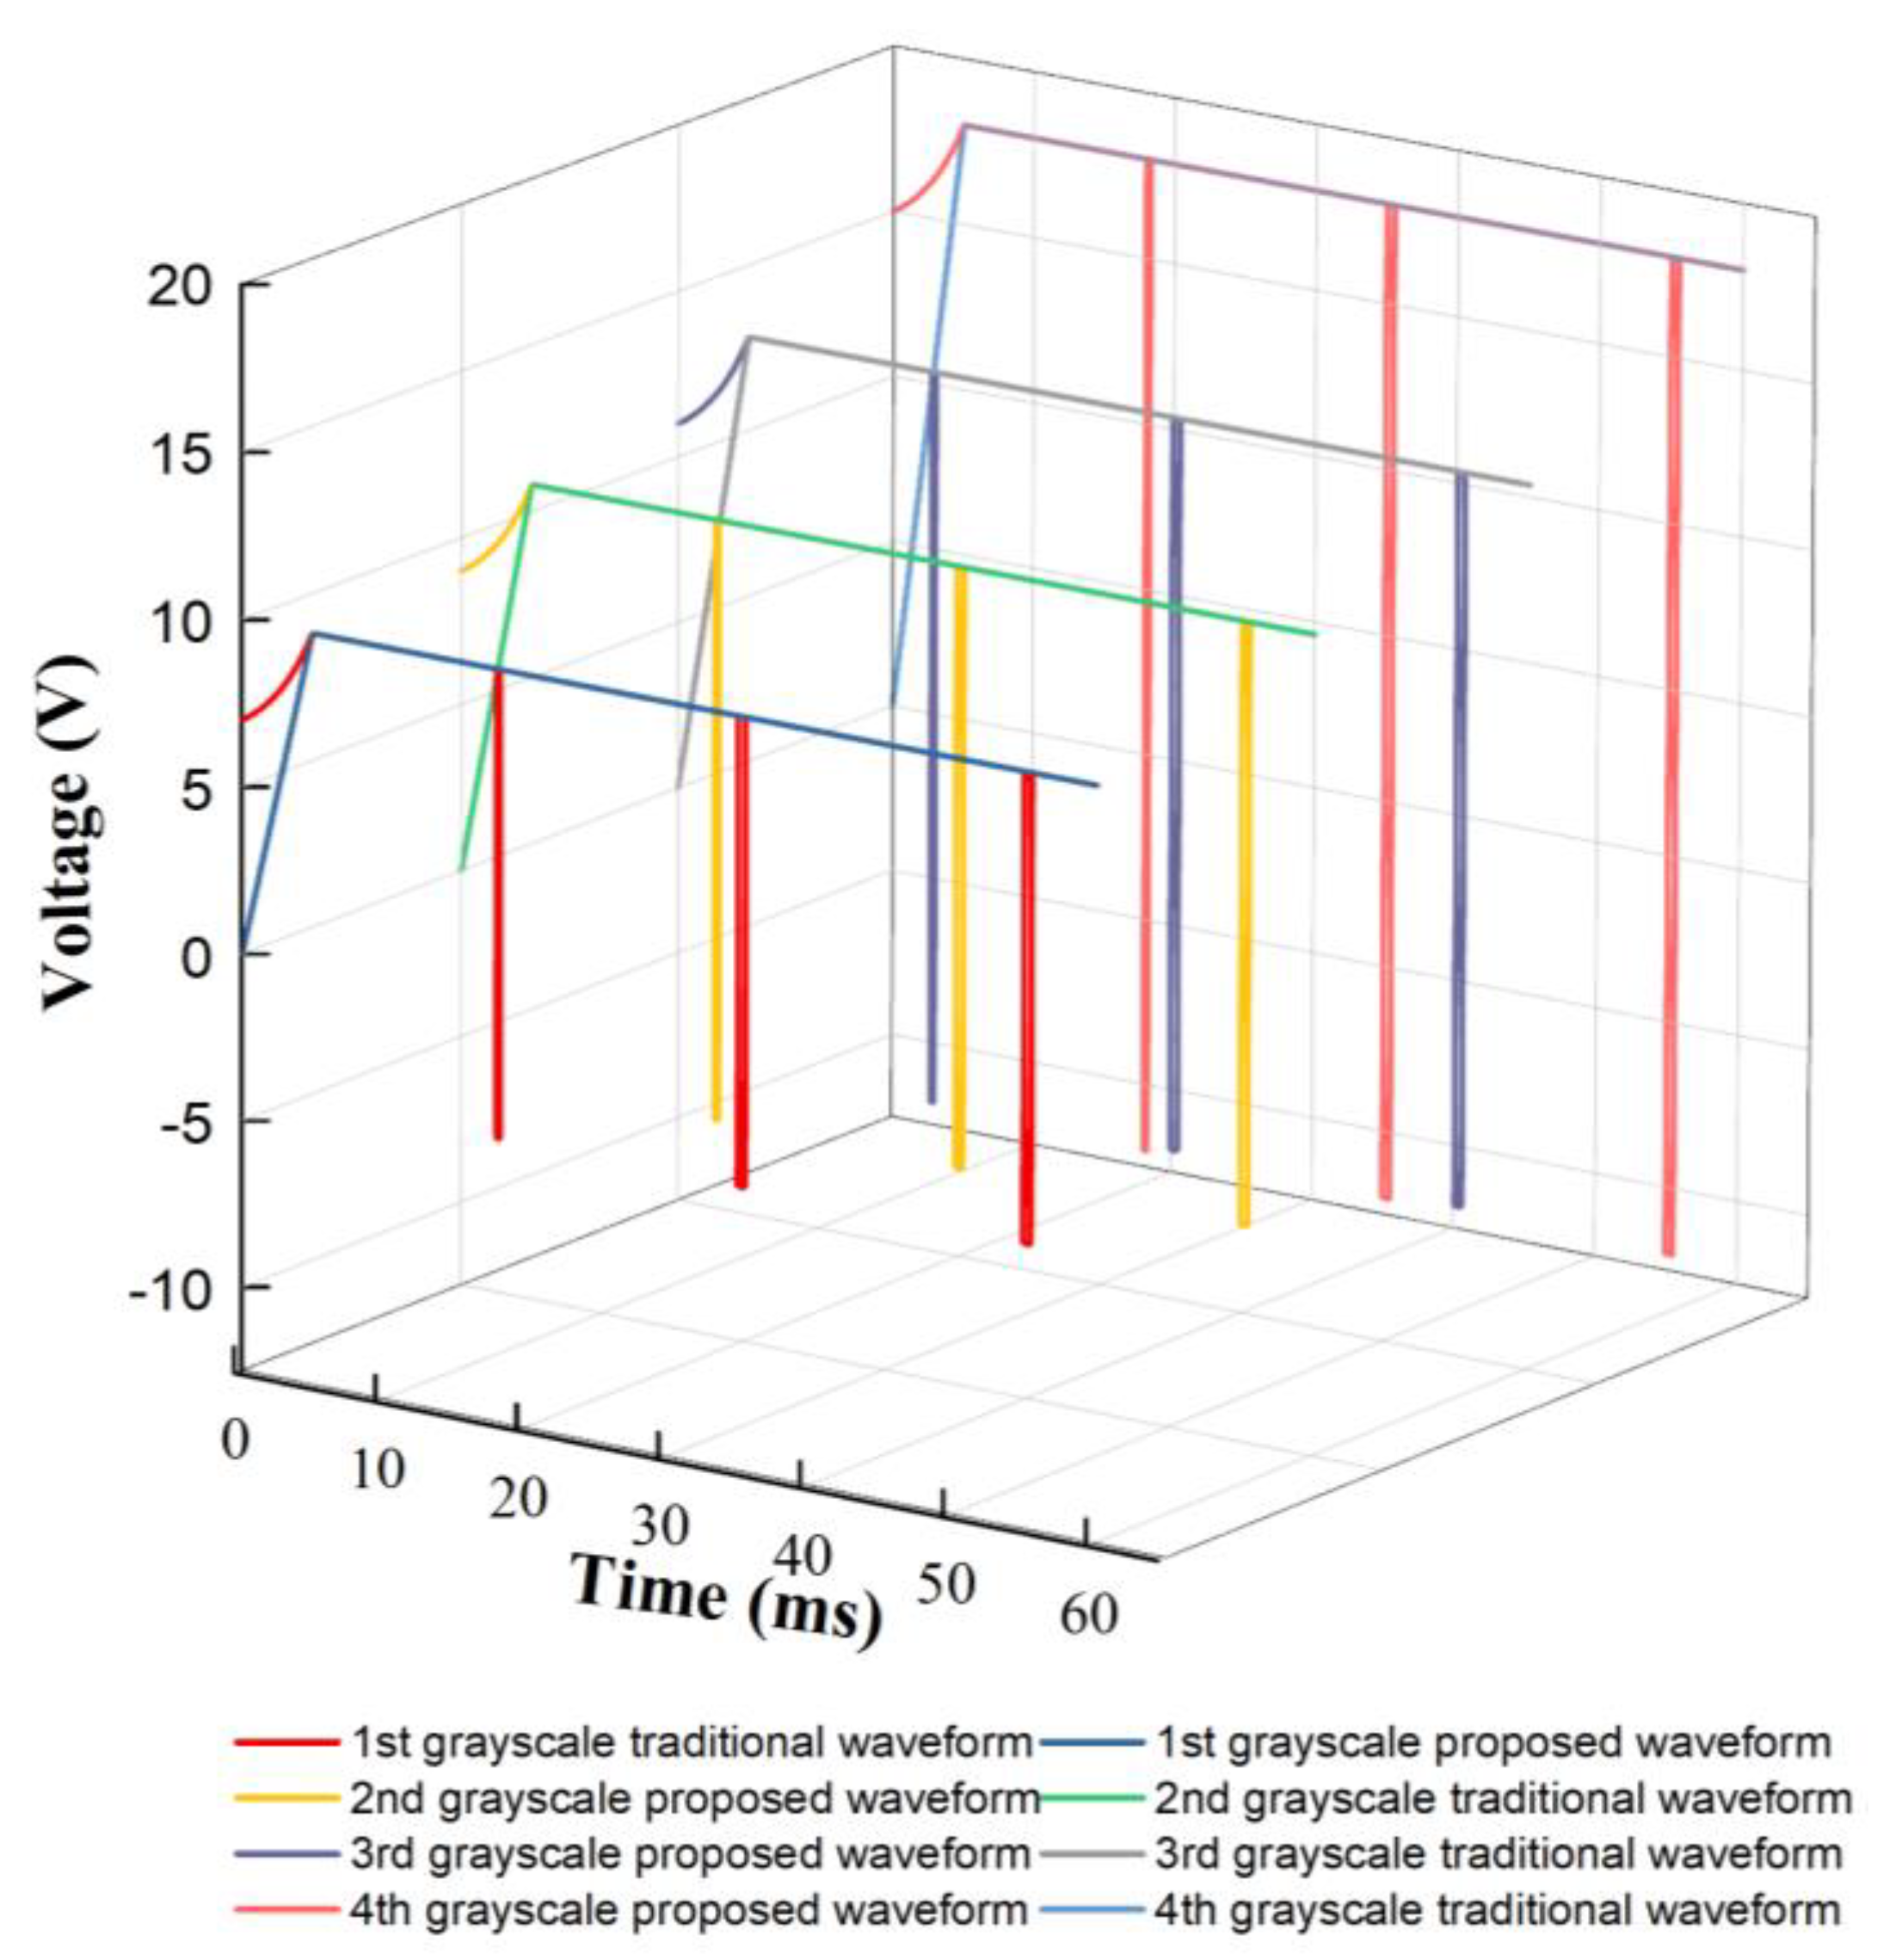
3.2. Proposed Driving Waveforms
3.3. Parameter Optimization of the Driving Stage
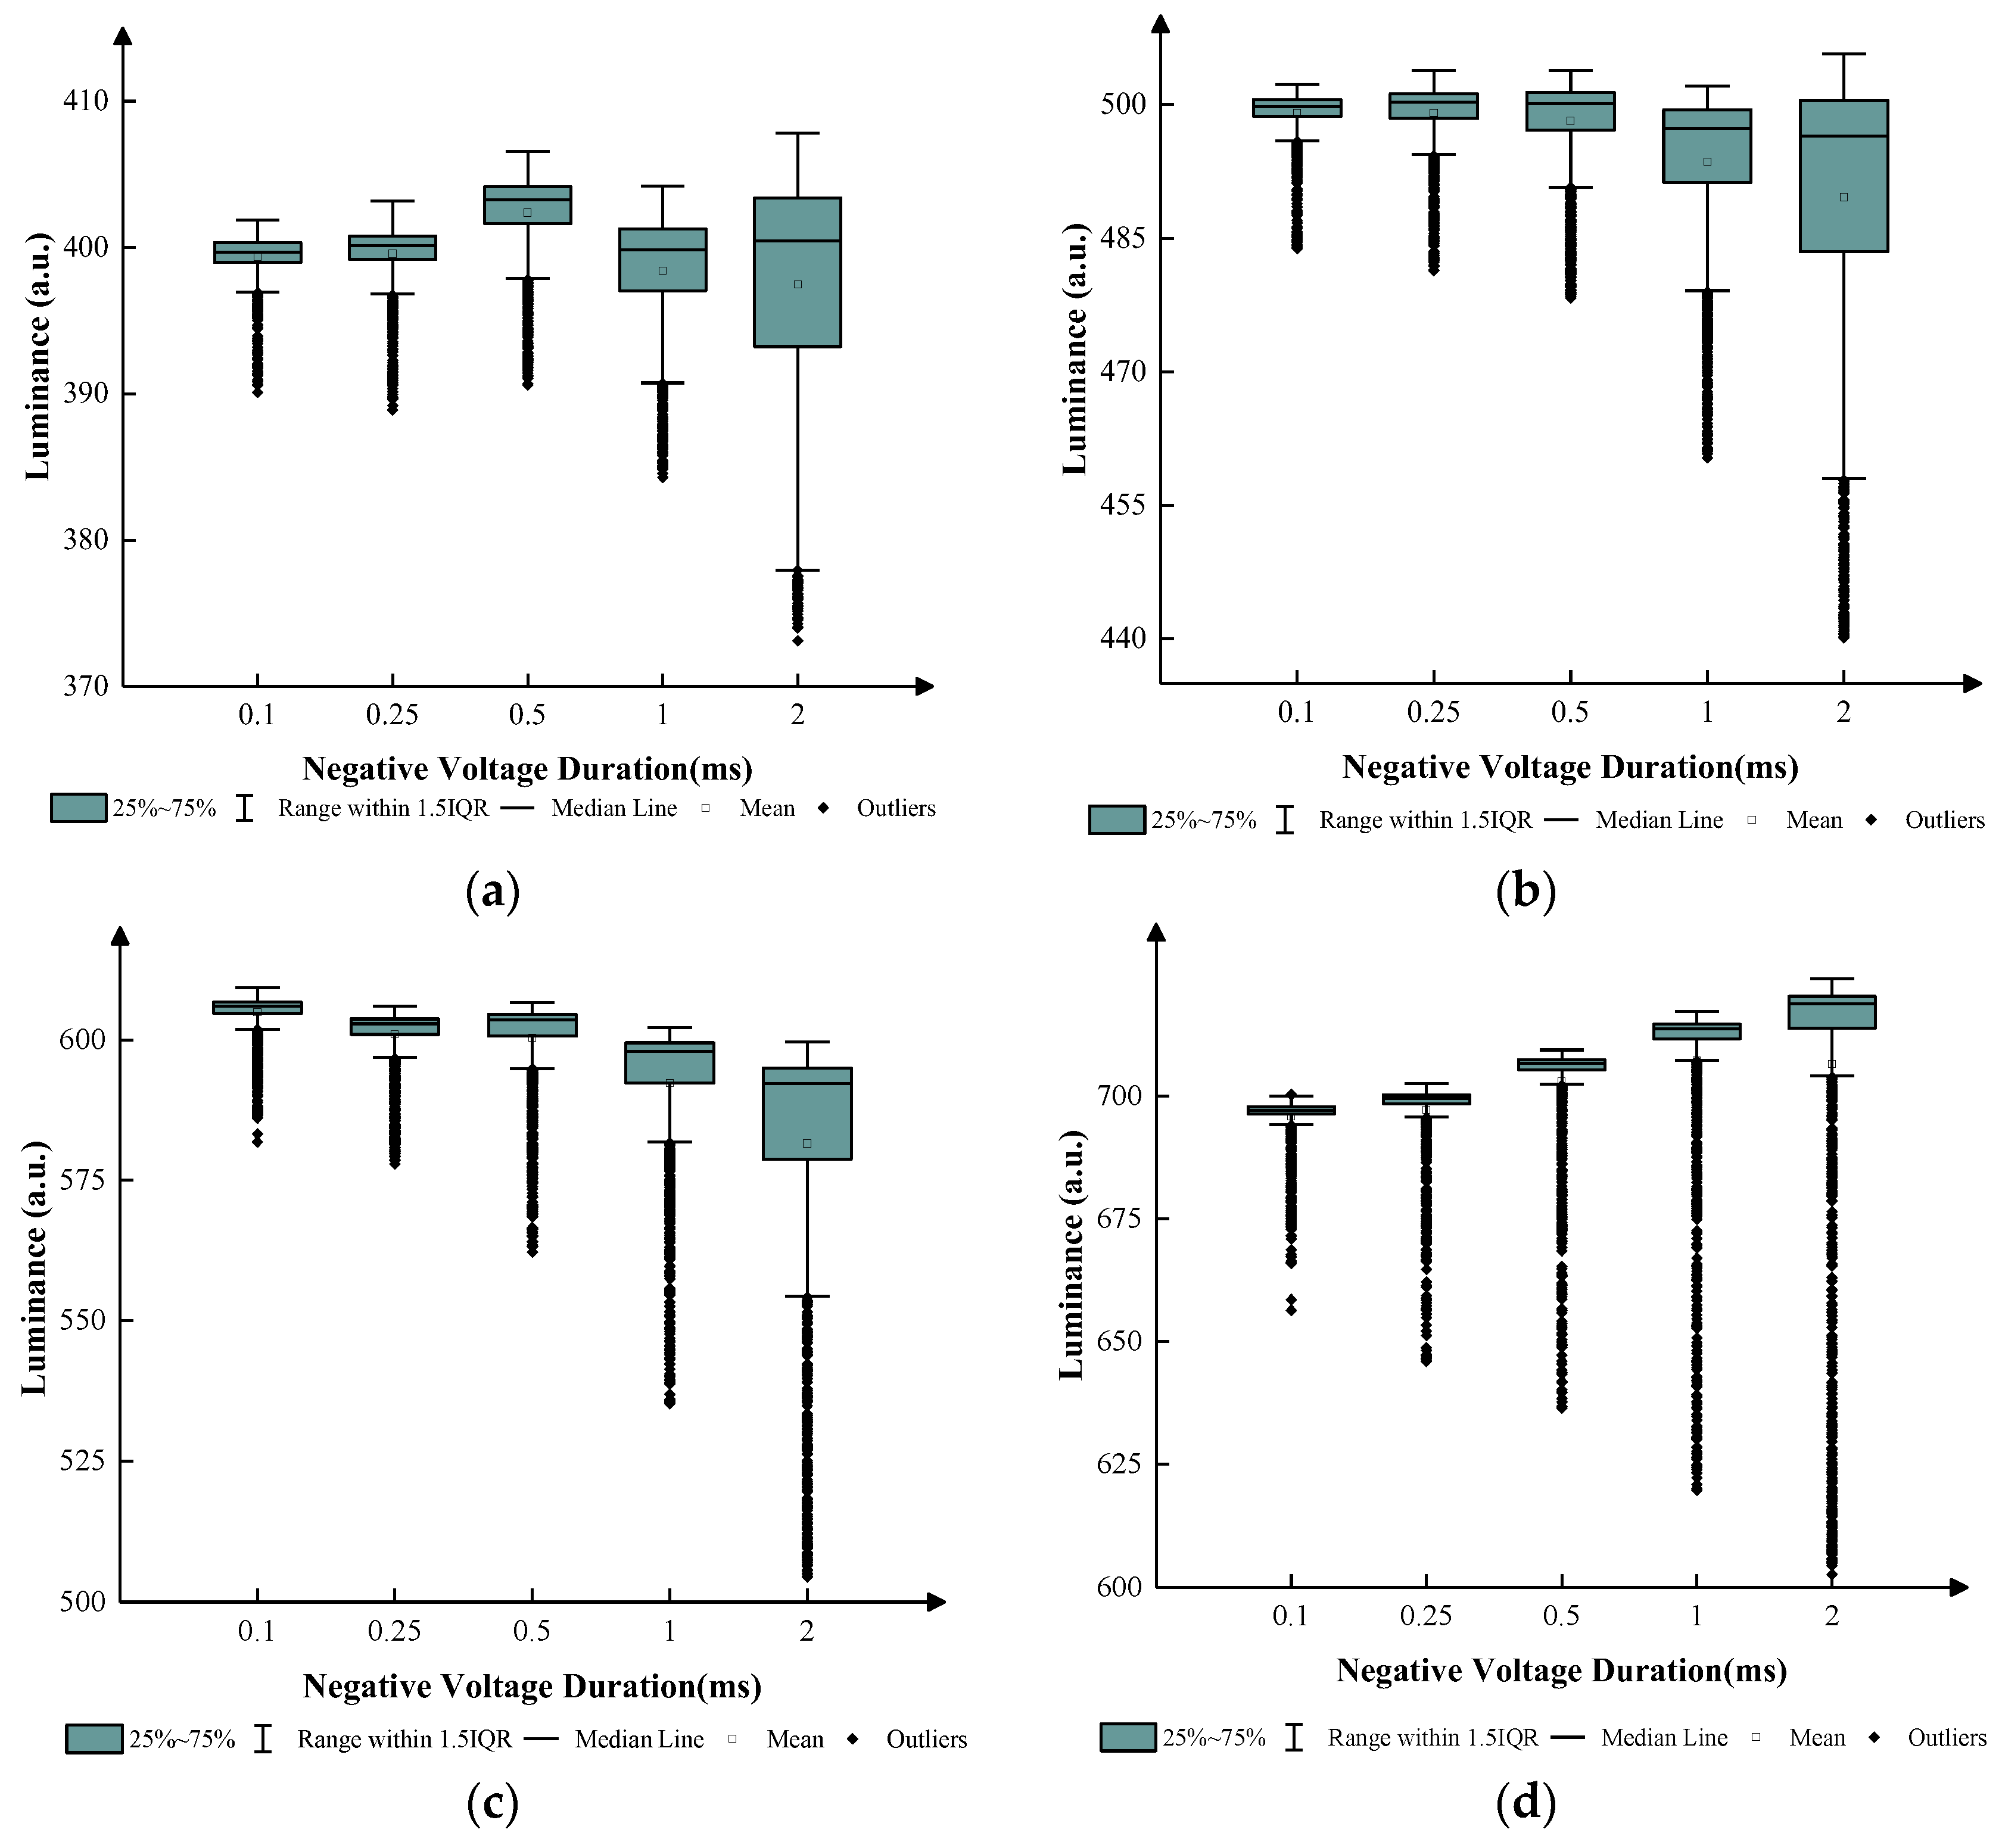
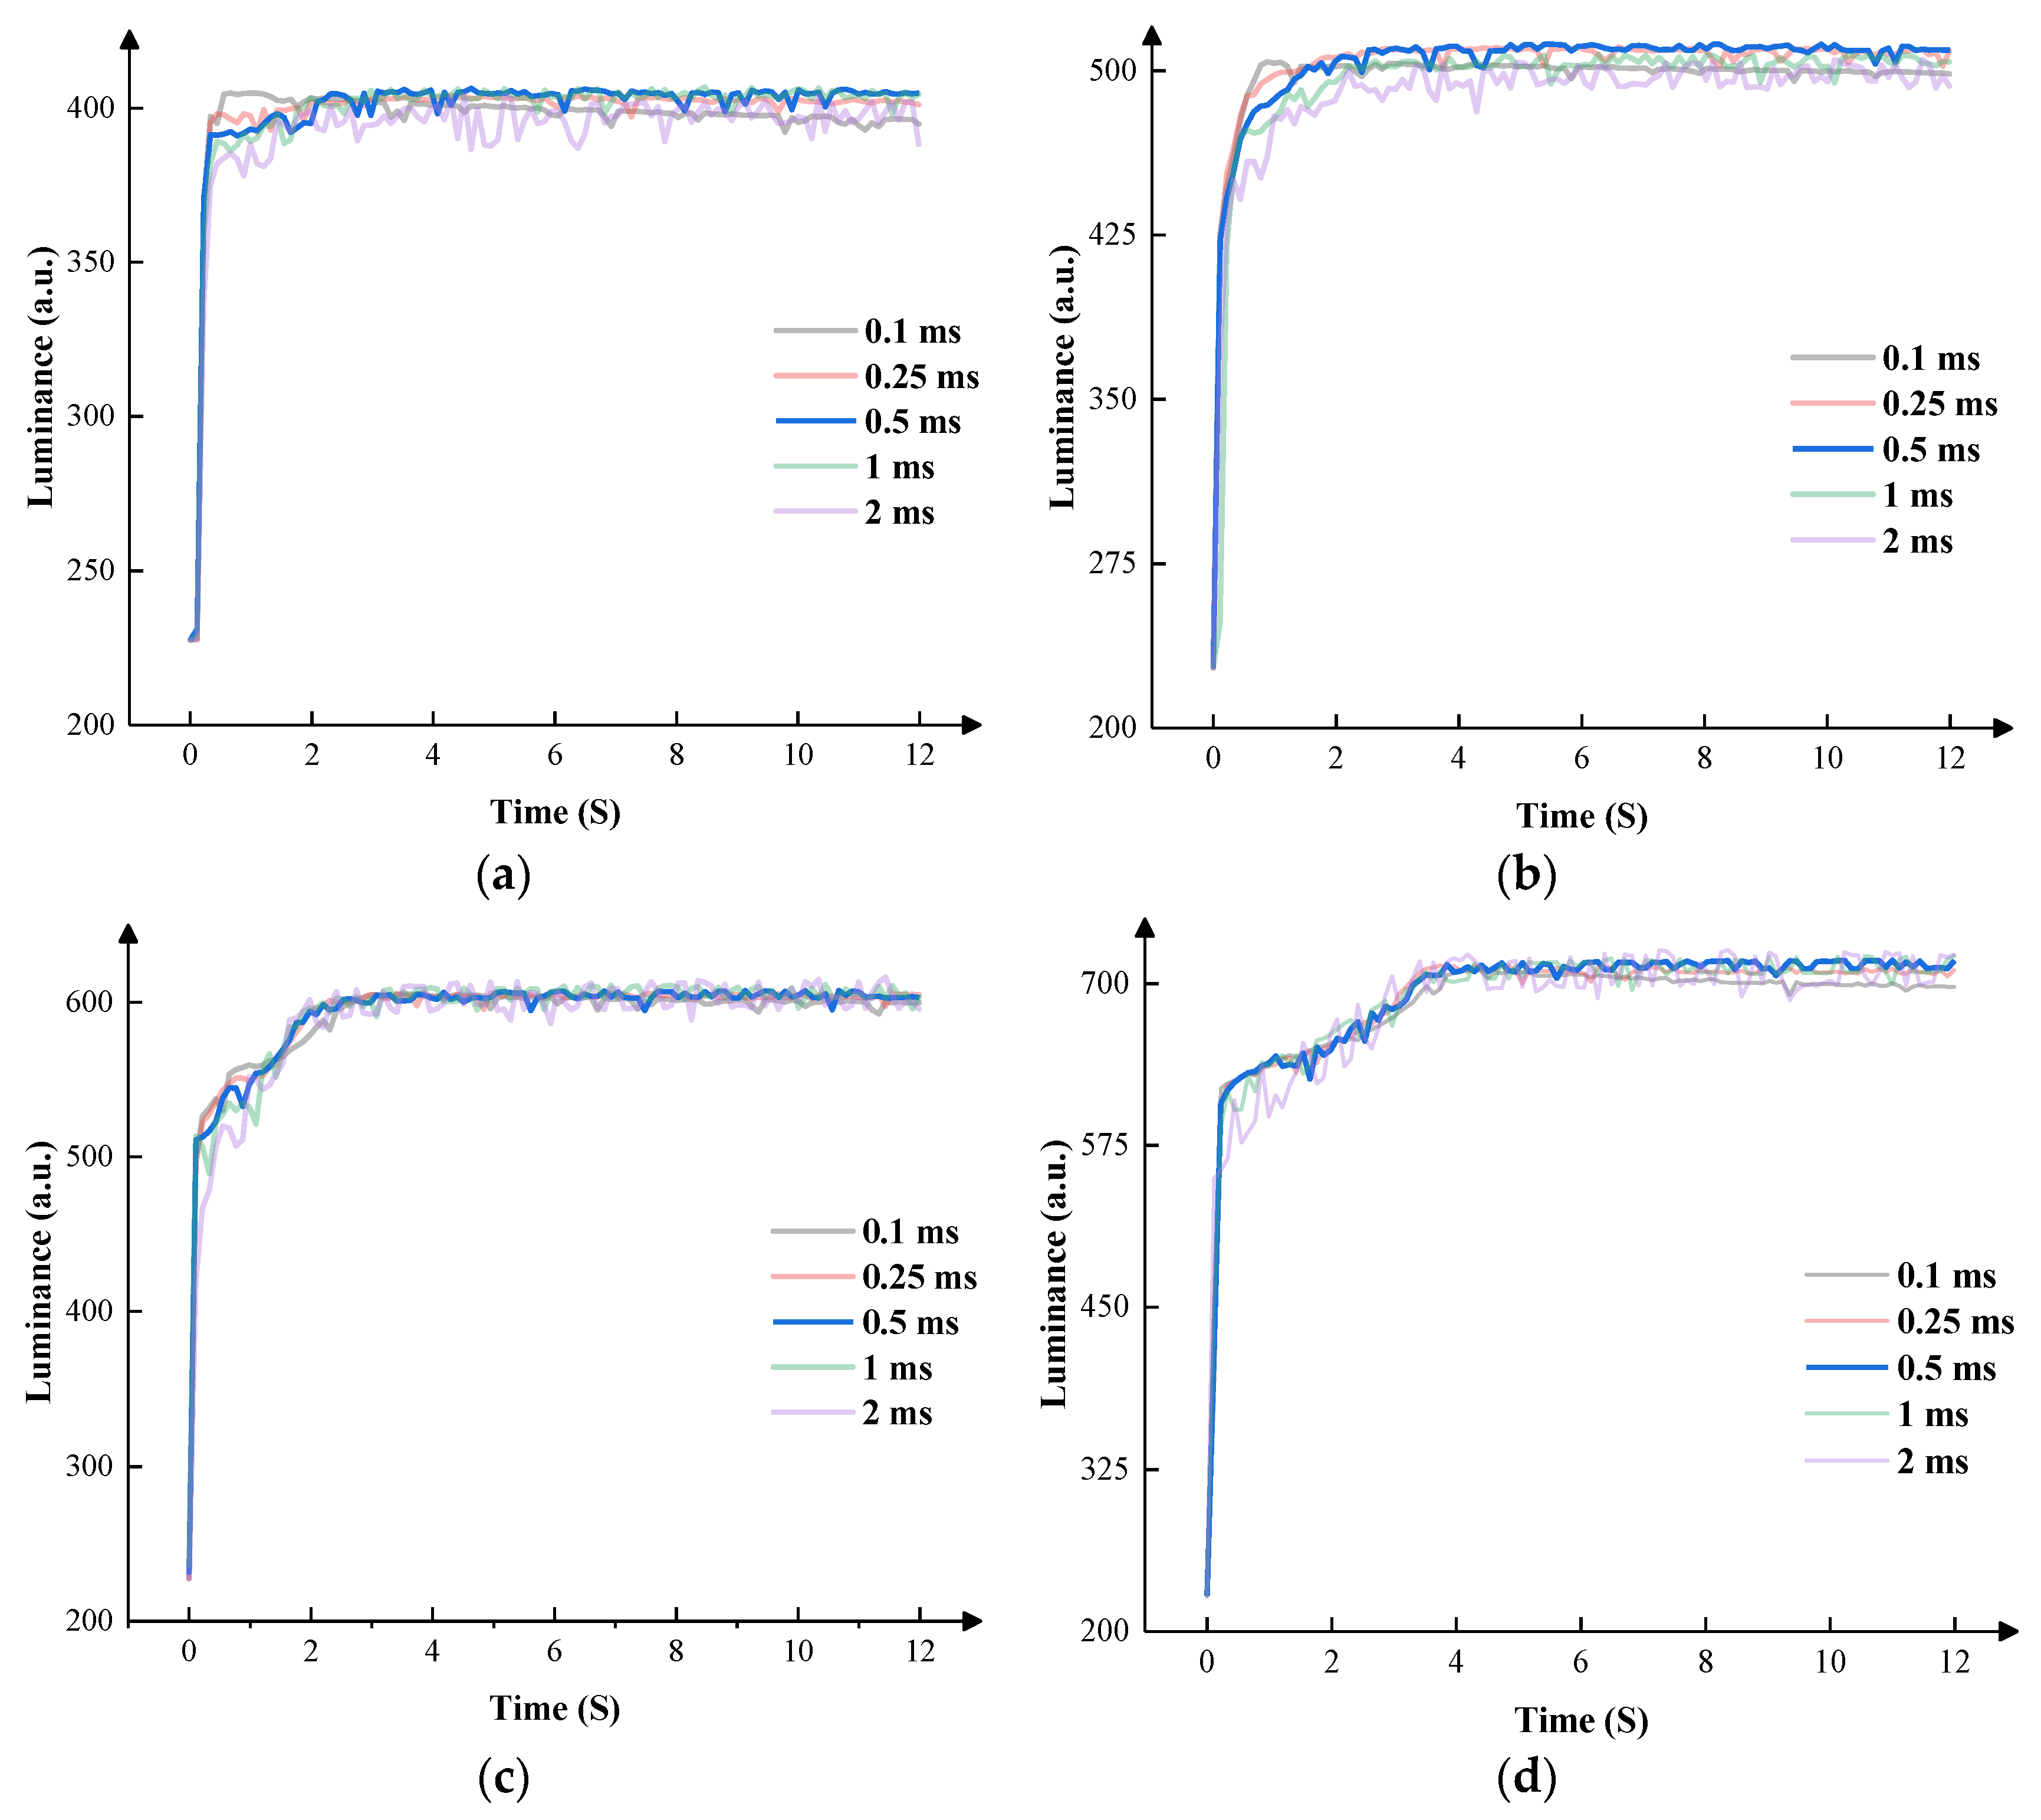
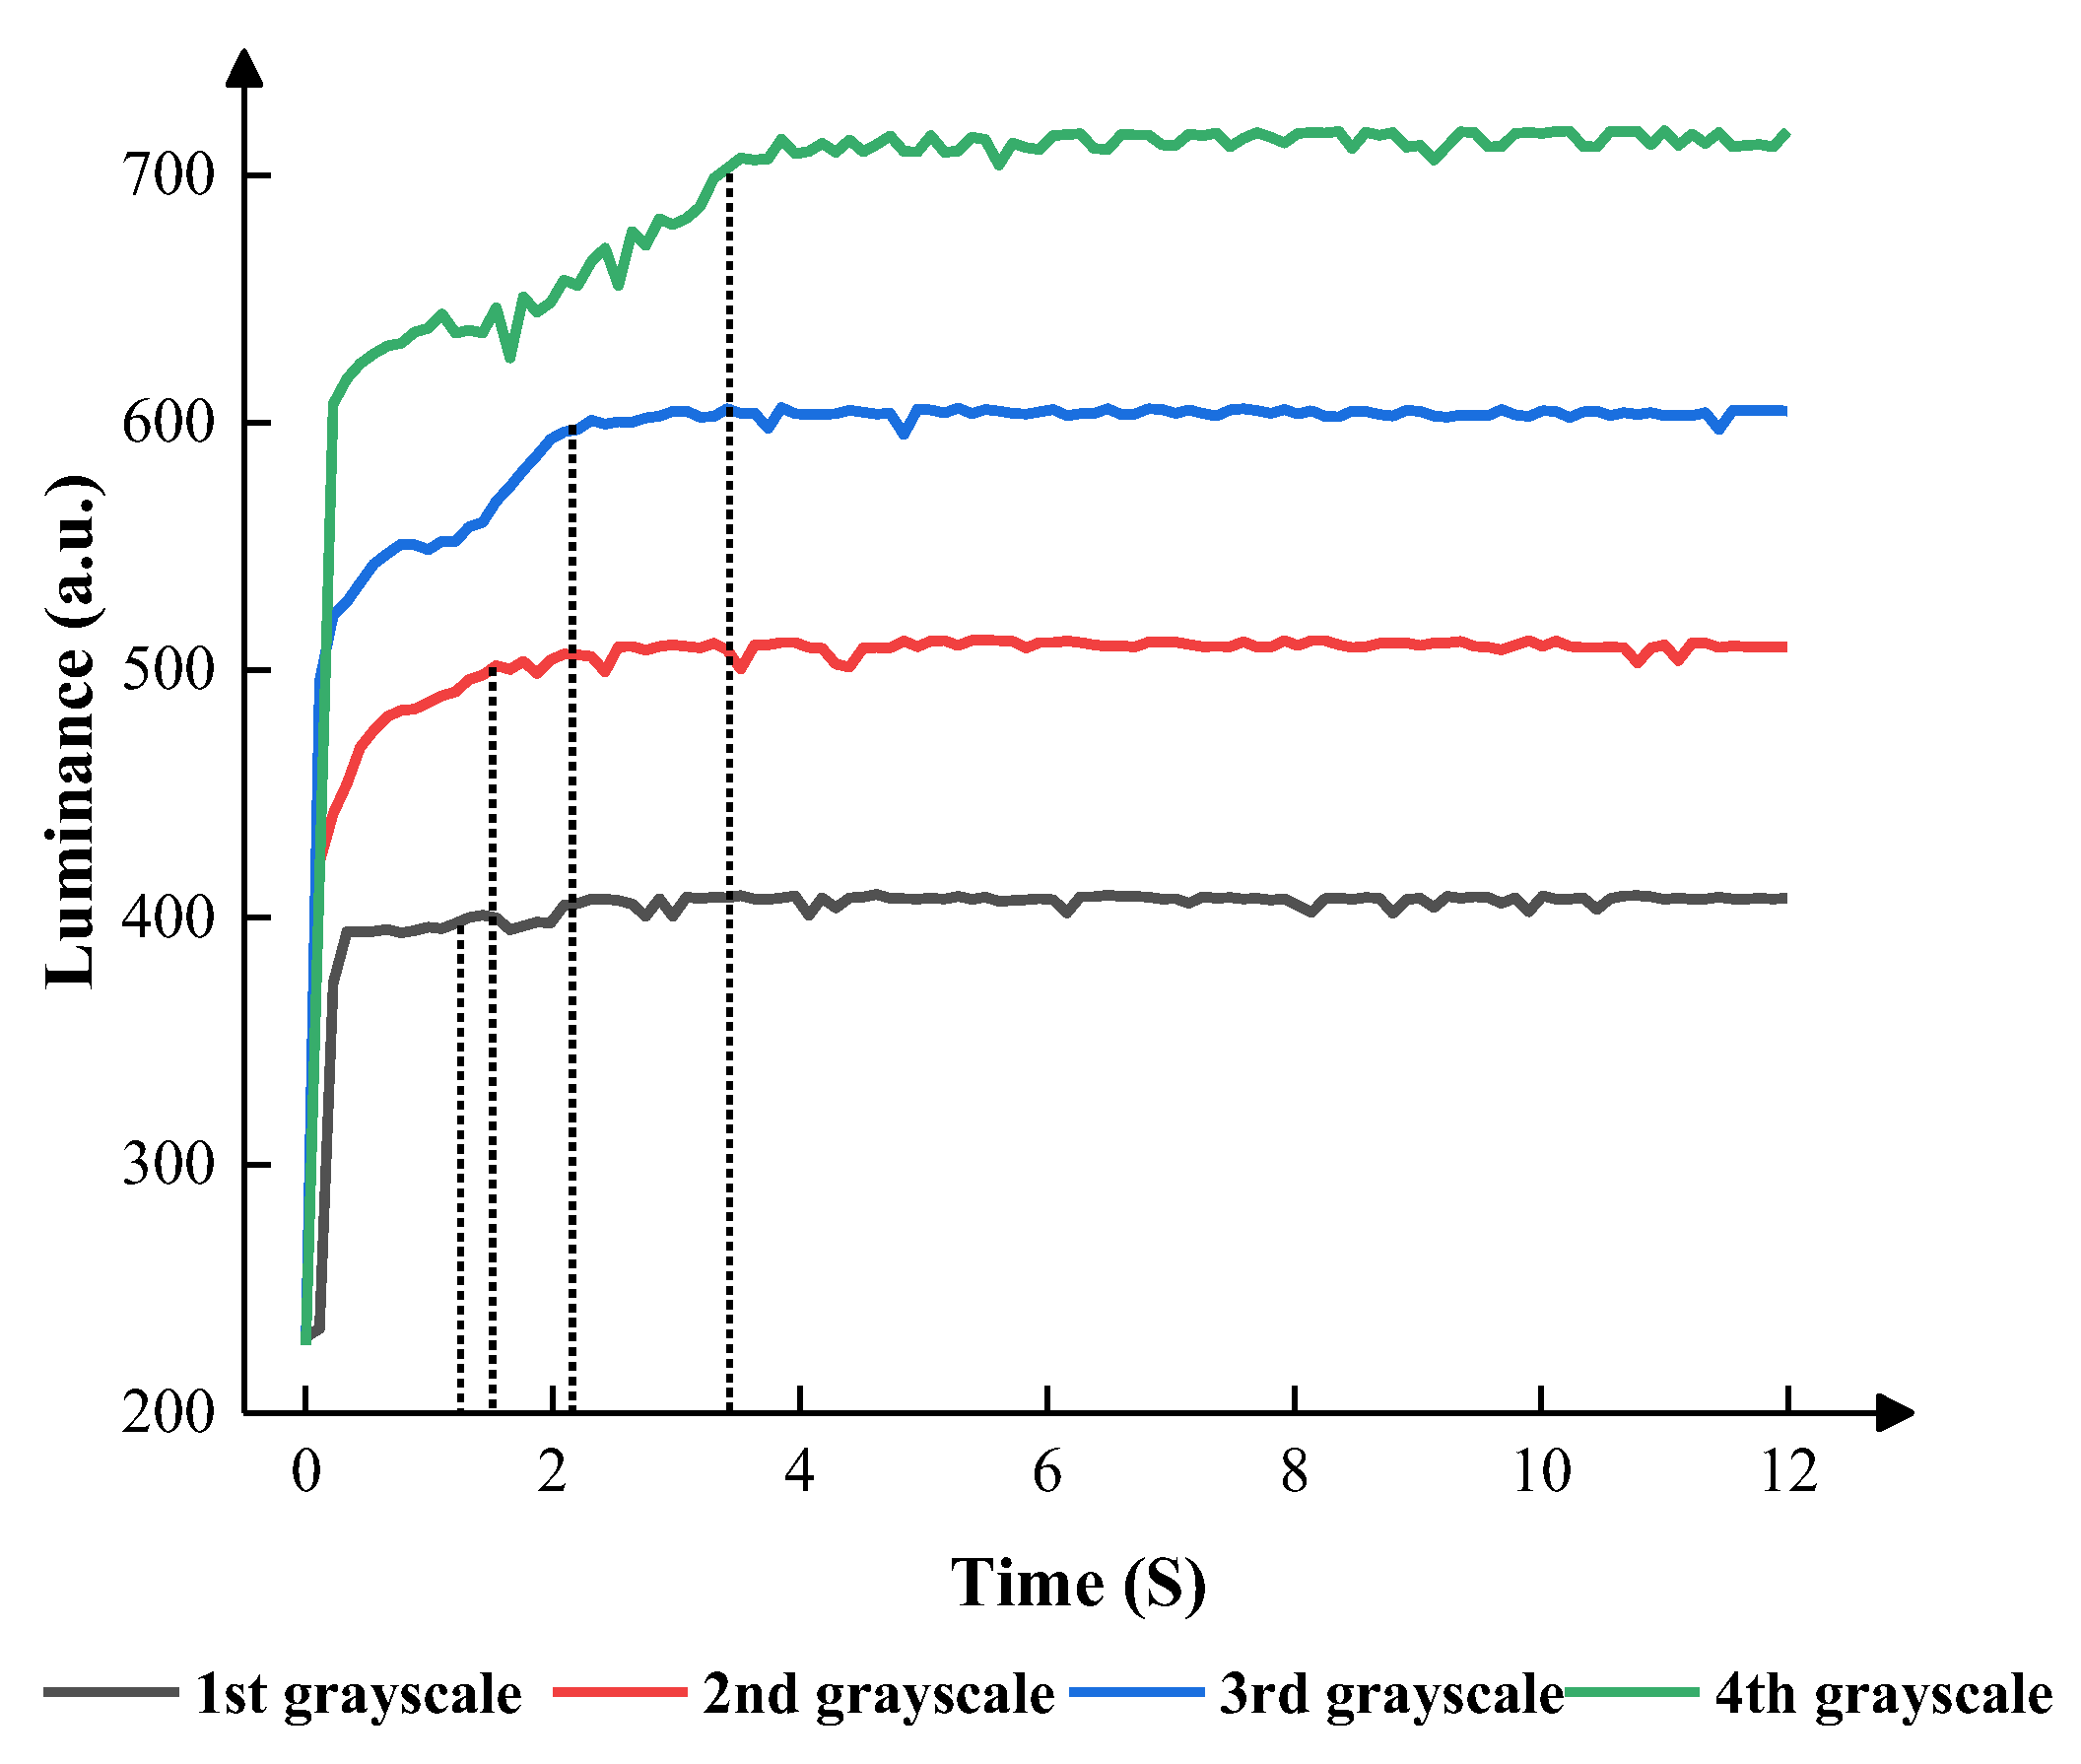
3.4. Testing of the Stabilizing Stage
3.5. Performance of the Proposed Waveform
4. Conclusions
Author Contributions
Funding
Data Availability Statement
Conflicts of Interest
References
- You, H.; Steckl, A.J. Three-color electrowetting display device for electronic paper. Appl. Phys. Lett. 2010, 97, 023514. [Google Scholar] [CrossRef]
- Jin, M.; Shen, S.; Yi, Z.; Zhou, G.; Shui, L. Optofluid-based reflective displays. Micromachines 2018, 9, 159. [Google Scholar] [CrossRef] [PubMed]
- Luo, Z.; Fan, J.; Xu, J.; Zhou, G.; Liu, S. A novel driving scheme for oil-splitting suppression in electrowetting display. Opt. Rev. 2020, 27, 339–345. [Google Scholar] [CrossRef]
- Shui, L.; Hayes, R.A.; Jin, M.; Zhang, X.; Bai, P.; van den Berg, A.; Zhou, G. Microfluidics for electronic paper-like displays. Lab Chip 2014, 14, 2374–2384. [Google Scholar] [CrossRef] [PubMed]
- Yi, Z.; Zeng, W.; Ma, S.; Feng, H.; Zeng, W.; Shen, S.; Shui, L.; Zhou, G.; Zhang, C. Design of driving waveform based on a damping oscillation for optimizing red saturation in three-color electrophoretic displays. Micromachines 2021, 12, 162. [Google Scholar] [CrossRef]
- Luo, Z.; Luo, J.; Zhao, W.; Cao, Y.; Lin, W.; Zhou, G. A high-resolution and intelligent dead pixel detection scheme for an electrowetting display screen. Opt. Rev. 2017, 25, 18–26. [Google Scholar] [CrossRef]
- Li, W.; Wang, L.; Henzen, A. A multi waveform adaptive driving scheme for reducing hysteresis effect of electrowetting displays. Front. Phys. 2020, 8, 618811. [Google Scholar] [CrossRef]
- Sureshkumar, P.; Bhattacharyya, S.S. Display applications of electrowetting. J. Adhes. Sci. Technol. 2012, 26, 1947–1963. [Google Scholar] [CrossRef]
- Yi, Z.; Zhang, H.; Jiang, M.; Wang, J. Editorial for the special issue on advances in optoelectronic devices. Micromachines 2023, 14, 652. [Google Scholar] [CrossRef]
- Beni, G.; Hackwood, S. Electro-wetting displays. Appl. Phys. Lett. 1981, 38, 207–209. [Google Scholar] [CrossRef]
- Hayes, R.A.; Feenstra, B.J. Video-speed electronic paper based on electrowetting. Nature 2003, 425, 383–385. [Google Scholar] [CrossRef] [PubMed]
- Roques-Carmes, T.; Hayes, R.; Feenstra, B.; Schlangen, L. Liquid behavior inside a reflective display pixel based on electrowetting. J. Appl. Phys. 2004, 95, 4389–4396. [Google Scholar] [CrossRef]
- Roques-Carmes, T.; Hayes, R.; Schlangen, L. A physical model describing the electro-optic behavior of switchable optical elements based on electrowetting. J. Appl. Phys. 2004, 96, 6267–6271. [Google Scholar] [CrossRef]
- Ku, Y.; Kuo, S.; Tsai, Y.; Cheng, P.; Chen, J.; Lan, K.; Lo, K.; Lee, K.; Cheng, W. The structure and manufacturing process of large area transparent electrowetting display. SID Symp. Dig. Tech. Pap. 2012, 43, 850–852. [Google Scholar] [CrossRef]
- Tian, L.; Bai, P. A combined pulse driving waveform with rising gradient for improving the aperture ratio of electrowetting displays. Front. Phys. 2021, 9, 709151. [Google Scholar] [CrossRef]
- Li, W.; Wang, L.; Zhang, T.; Lai, S.; Liu, L.; He, W.; Zhou, G.; Yi, Z. Driving waveform design with rising gradient and sawtooth wave of electrowetting displays for ultra-low power consumption. Micromachines 2020, 11, 145. [Google Scholar] [CrossRef]
- Long, Z.; Yi, Z.; Zhang, H.; Liu, L.; Shui, L. Toward suppressing charge trapping based on a combined driving waveform with an ac reset signal for electro-fluidic displays. Membranes 2022, 12, 1072. [Google Scholar] [CrossRef]
- Chen, Y.; Chiu, Y.; Lee, W.; Liang, C. 56.3: A charge trapping suppression method for quick response electrowetting displays. SID Symp. Dig. Tech. Pap. 2010, 41, 842–845. [Google Scholar] [CrossRef]
- Gao, J.; Mendel, N.; Dey, R.; Baratian, D.; Mugele, F. Contact angle hysteresis and oil film lubrication in electrowetting with two immiscible liquids. Appl. Phys. Lett. 2018, 112, 203703. [Google Scholar] [CrossRef]
- Hsieh, W.; Lin, C.; Lo, K.; Lee, K.; Cheng, W.; Chen, K. 3d electrohydrodynamic simulation of electrowetting displays. J. Micromechanics Microengineering 2014, 24, 125024. [Google Scholar] [CrossRef]
- Yi, Z.; Zhang, H.; Zeng, W.J.; Feng, H.Q.; Long, Z.X.; Liu, L.M.; Hu, Y.F.; Zhou, X.C.; Zhang, C.F. Review of driving waveform for electrowetting displays. Front. Phys. 2021, 9, 728804. [Google Scholar] [CrossRef]
- Roques-Carmes, T.; Palmier, S.; Hayes, R.A.; Schlangen, L.J.M. The effect of the oil/water interfacial tension on electrowetting driven fluid motion. Colloids Surf. A Physicochem. Eng. Asp. 2005, 267, 56–63. [Google Scholar] [CrossRef]
- Sureshkumar, P.; Kim, M.; Song, E.; Lim, Y.J.; Lee, S.H. Effect of surface roughness on the fabrication of electrowetting display cells and its electro-optic switching behavior. Surf. Rev. Lett. 2009, 16, 23–28. [Google Scholar] [CrossRef]
- Yi, Z.; Liu, L.; Wang, L.; Li, W.; Shui, L.; Zhou, G. A driving system for fast and precise gray-scale response based on amplitude–frequency mixed modulation in tft electrowetting displays. Micromachines 2019, 10, 732. [Google Scholar] [CrossRef]
- Chiu, Y.; Liang, C.; Chen, Y.; Lee, W.; Chen, H.; Wu, S. Accurate-gray-level and quick-response driving methods for high-performance electrowetting displays. J. Soc. Inf. Disp. 2011, 19, 741–748. [Google Scholar] [CrossRef]
- Yi, Z.; Shui, L.; Wang, L.; Jin, M.; Hayes, R.A.; Zhou, G. A novel driver for active matrix electrowetting displays. Displays 2015, 37, 86–93. [Google Scholar] [CrossRef]
- Zhang, H.; Yi, Z.; Lv, J.; Liu, L.; Chi, F.; Zhang, C. Improvement of aperture ratio and grayscale stability of electrowetting displays by designing a combined driving waveform of an exponential function and ac voltage. Displays 2022, 74, 102288. [Google Scholar] [CrossRef]
- Yi, Z.; Feng, W.; Wang, L.; Liu, L.; Lin, Y.; He, W.; Shui, L.; Zhang, C.; Zhang, Z.; Zhou, G. Aperture ratio improvement by optimizing the voltage slope and reverse pulse in the driving waveform for electrowetting displays. Micromachines 2019, 10, 862. [Google Scholar] [CrossRef]
- Giraldo, A.; Vermeulen, P.; Figura, D.; Spreafico, M.; Meeusen, J.; Hampton, M.; Novoselov, P. Improved oil motion control and hysteresis-free pixel switching of electrowetting displays. SID Symp. Dig. Tech. Pap. 2012, 43, 625–628. [Google Scholar] [CrossRef]
- He, T.; Jin, M.; Eijkel, J.C.; Zhou, G.; Shui, L. Two-phase microfluidics in electrowetting displays and its effect on optical performance. Biomicrofluidics 2016, 10, 011908. [Google Scholar] [CrossRef]
- Lu, Y.; Tang, B.; Yang, G.; Guo, Y.; Liu, L.; Henzen, A. Progress in advanced properties of electrowetting displays. Micromachines 2021, 12, 206. [Google Scholar] [CrossRef] [PubMed]
- Yi, Z.; Huang, Z.; Lai, S.; He, W.; Wang, L.; Chi, F.; Zhang, C.; Shui, L.; Zhou, G. Driving waveform design of electrowetting displays based on an exponential function for a stable grayscale and a short driving time. Micromachines 2020, 11, 313. [Google Scholar] [CrossRef] [PubMed]
- Zhang, T.; Deng, Y. Driving waveform design of electrowetting displays based on a reset signal for suppressing charge trapping effect. Front. Phys. 2021, 9, 672541. [Google Scholar] [CrossRef]
- Liu, L.; Bai, P.; Yi, Z.; Zhou, G. A separated reset waveform design for suppressing oil backflow in active matrix electrowetting displays. Micromachines 2021, 12, 491. [Google Scholar] [CrossRef]
- Li, F.; Mugele, F. How to make sticky surfaces slippery: Contact angle hysteresis in electrowetting with alternating voltage. Appl. Phys. Lett. 2008, 92, 244108. [Google Scholar] [CrossRef]
- Papaderakis, A.; Dryfe, R. The renaissance of electrowetting. Curr. Opin. Electrochem. 2023, 38, 101245. [Google Scholar] [CrossRef]
- Peykov, V.; Quinn, A.; Ralston, J. Electrowetting: A model for contact-angle saturation. Colloid Polym. Sci. 2000, 278, 789–793. [Google Scholar] [CrossRef]
- Wu, H.; Hayes, R.; Li, F.; Henzen, A.; Shui, L.; Zhou, G. Influence of fluoropolymer surface wettability on electrowetting display performance. Displays 2018, 53, 47–53. [Google Scholar] [CrossRef]
- Patel, M.; Kim, S.; Nguyen, T.; Kim, J.; Wong, C. Transparent sustainable energy platform: Closed-loop energy chain of solar-electric-hydrogen by transparent photovoltaics, photo-electro-chemical cells and fuel system. Nano Energy 2021, 90, 106496. [Google Scholar] [CrossRef]
- Liu, L.; Wu, Z.; Wang, L.; Zhang, T.; Li, W.; Lai, S.; Bai, P. Design of an ac driving waveform based on characteristics of electrowetting stability for electrowetting displays. Front. Phys. 2020, 8, 618752. [Google Scholar] [CrossRef]
- Patel, M.; Seo, J.H.; Nguyen, T.T.; Kim, J. Active energy-controlling windows incorporating transparent photovoltaics and an integrated transparent heater. Cell Rep. Phys. Sci. 2021, 2, 100591. [Google Scholar] [CrossRef]
- Mugele, F.; Baret, J.-C. Electrowetting: From basics to applications. J. Phys. Condens. Matter 2005, 17, R705. [Google Scholar] [CrossRef]


| Name | Model | Manufacturers | Region | Region |
|---|---|---|---|---|
| Computer | H430 | Lenovo | Beijing | China |
| Function generator | AFG3022C | Tektronix | Beaverton | USA |
| Voltage amplifier | ATA-2022H | Agitek | Xian | China |
| Microscope Colorimeter | SZ680 Arges-45 | Cnoptec Admesy | Chongqing Ittervoort | China Netherlands |
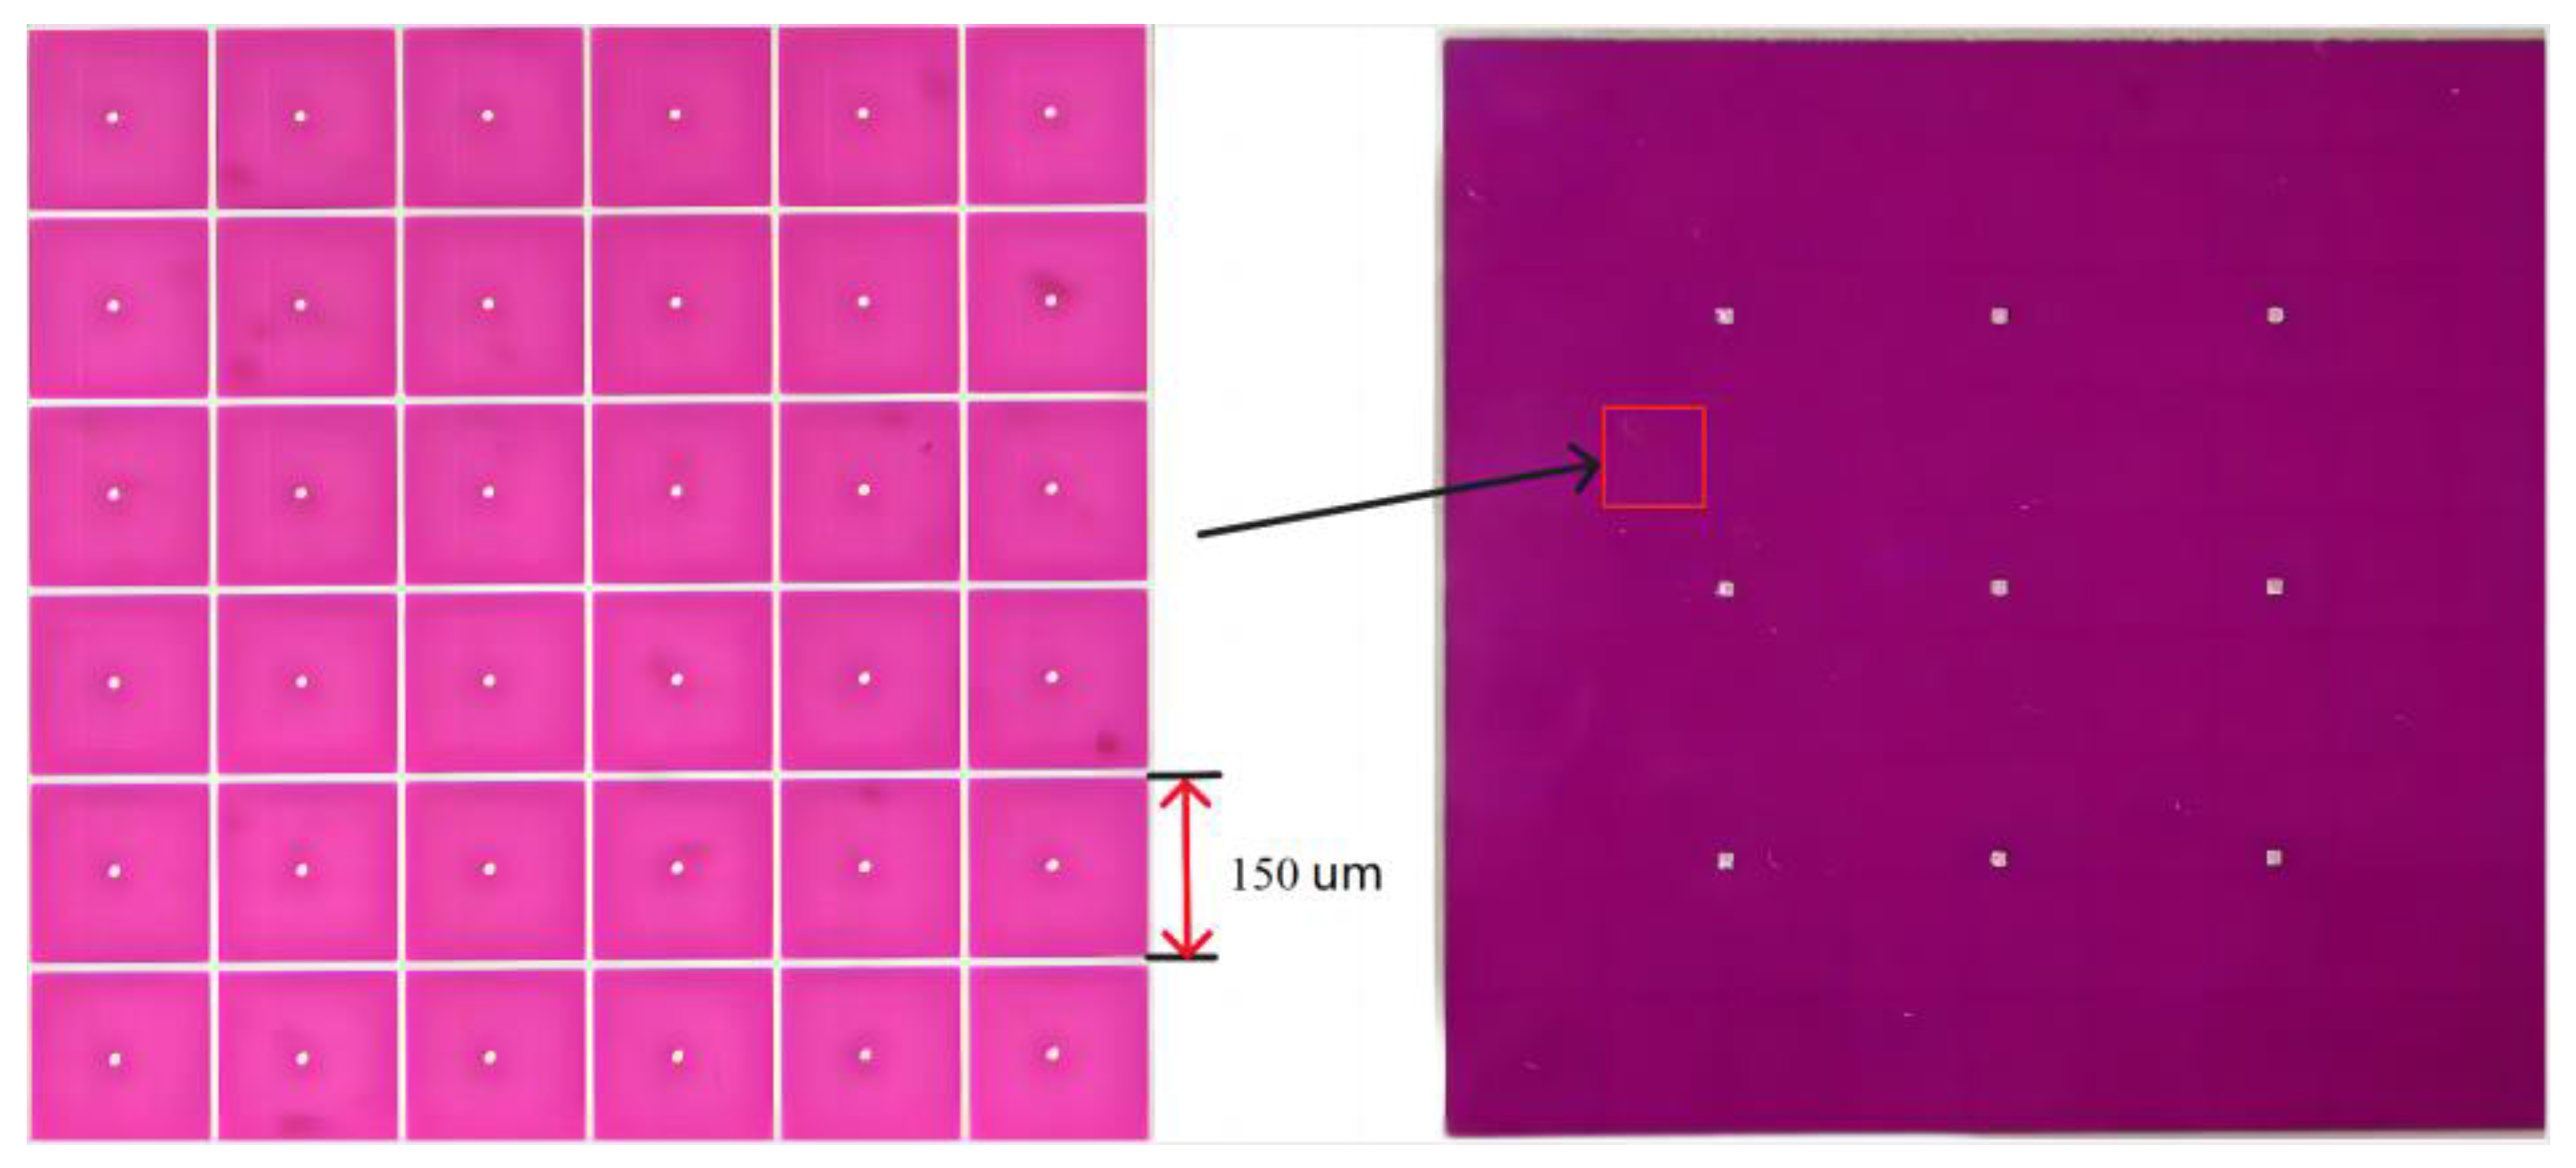
| Panel Size | Oil Color | Resolution | Pixel Size | Pixel Wall Hight | Insulating Layer Thickness | Electrode Plates Thickness |
|---|---|---|---|---|---|---|
| 10 × 10 cm | magenta | 320 × 240 | 150 × 150 μm | 18 μm | 1 nm | 2.5 nm |
Disclaimer/Publisher’s Note: The statements, opinions and data contained in all publications are solely those of the individual author(s) and contributor(s) and not of MDPI and/or the editor(s). MDPI and/or the editor(s) disclaim responsibility for any injury to people or property resulting from any ideas, methods, instructions or products referred to in the content. |
© 2023 by the authors. Licensee MDPI, Basel, Switzerland. This article is an open access article distributed under the terms and conditions of the Creative Commons Attribution (CC BY) license (https://creativecommons.org/licenses/by/4.0/).
Share and Cite
Xu, W.; Yi, Z.; Long, Z.; Zhang, H.; Jiang, J.; Liu, L.; Chi, F.; Tan, D.; Wang, H. Stability Study of Multi-Level Grayscales Based on Driving Waveforms for Electrowetting Displays. Micromachines 2023, 14, 1123. https://doi.org/10.3390/mi14061123
Xu W, Yi Z, Long Z, Zhang H, Jiang J, Liu L, Chi F, Tan D, Wang H. Stability Study of Multi-Level Grayscales Based on Driving Waveforms for Electrowetting Displays. Micromachines. 2023; 14(6):1123. https://doi.org/10.3390/mi14061123
Chicago/Turabian StyleXu, Wanzhen, Zichuan Yi, Zhengxing Long, Hu Zhang, Jiaquan Jiang, Liming Liu, Feng Chi, Ding Tan, and Huan Wang. 2023. "Stability Study of Multi-Level Grayscales Based on Driving Waveforms for Electrowetting Displays" Micromachines 14, no. 6: 1123. https://doi.org/10.3390/mi14061123