Article

Optimizing Optical Dielectrophoretic (ODEP) Performance: Position- and Size-Dependent Droplet Manipulation in an Open-Chamber Oil Medium

Department of Mechanical Engineering, San Diego State University, San Diego, CA 92182-1323, USA
*
Author to whom correspondence should be addressed.
Micromachines 2024, 15(1), 119; https://doi.org/10.3390/mi15010119
Submission received: 21 December 2023 / Revised: 5 January 2024 / Accepted: 9 January 2024 / Published: 11 January 2024
(This article belongs to the Special Issue Advances in Electrowetting Devices, Volume II)

Abstract

:
An optimization study is presented to enhance optical dielectrophoretic (ODEP) performance for effective manipulation of an oil-immersed droplet in the floating electrode optoelectronic tweezers (FEOET) device. This study focuses on understanding how the droplet’s position and size, relative to light illumination, affect the maximum ODEP force. Numerical simulations identified the characteristic length (Lc) of the electric field as a pivotal factor, representing the location of peak field strength. Utilizing 3D finite element simulations, the ODEP force is calculated through the Maxwell stress tensor by integrating the electric field strength over the droplet’s surface and then analyzed as a function of the droplet’s position and size normalized to Lc. Our findings reveal that the optimal position is xopt = Lc + r, (with r being the droplet radius), while the optimal droplet size is ropt = 5Lc, maximizing light-induced field perturbation around the droplet. Experimental validations involving the tracking of droplet dynamics corroborated these findings. Especially, a droplet sized at r = 5Lc demonstrated the greatest optical actuation by performing the longest travel distance of 13.5 mm with its highest moving speed of 6.15 mm/s, when it was initially positioned at x0 = Lc + r = 6Lc from the light’s center. These results align well with our simulations, confirming the criticality of both the position (xopt) and size (ropt) for maximizing ODEP force. This study not only provides a deeper understanding of the position- and size-dependent parameters for effective droplet manipulation in FEOET systems, but also advances the development of low-cost, disposable, lab-on-a-chip (LOC) devices for multiplexed biological and biochemical analyses.

1. Introduction

Droplet-based microfluidic systems have drawn great interest for various lab-on-a-chip (LOC) applications [1,2,3,4]. Various chemical or biological compounds are encapsulated in discrete droplets to facilitate numerous independent reactions at an accelerated rate while minimizing the total reagent volume required [5,6,7]. Compared to traditional single-phase flow techniques [8,9], droplet-based systems offer several advantages, including rapid mixing, efficient reagent transport without dispersion, and a reduction in cross-contamination between droplets, owing to their discrete flow in an immiscible phase [10,11,12,13]. These benefits have catalyzed the development of diverse applications on droplet-based microfluidic devices, such as enzyme kinetic assays [14,15,16], polymerase chain reaction (PCR) for DNA amplification [17,18,19], and the synthesis of organic molecules or nanoparticles [20,21,22]. However, droplet-based microfluidics have difficulty, particularly in the manipulation of individual droplets driven by continuous oil flows confined in microfluidic channels. To address this, various active droplet manipulation mechanisms have been developed, including thermocapillary force [23,24,25], electrowetting on dielectric (EWOD) [26,27,28], dielectrophoresis (DEP) [29,30,31], acoustofluidic force [32,33,34], and contact charge electrophoresis (CCEP) [35,36]. Among these, DEP is notable for its low-cost, label-free approach, enabling particle manipulation through electric field non-uniformity without surface contact, thereby minimizing potential droplet–electrode contamination [37,38,39]. Various control parameters, such as the particle’s shape and size, the electrical properties of the particle and suspending medium, and the electric field frequency, allow for DEP manipulation with high flexibility and selectivity. However, DEP-based microfluidic devices often face challenges, including costly and time-consuming microfabrication processes, as well as complexities in wiring and electrode interconnection for large-scale, parallel manipulation [38,40].
In recent years, optical methods have gained prominence as cost-effective solutions to overcome challenges in wiring and interconnection in various microfluidic systems [41,42,43,44,45]. A notable example is optoelectronic tweezers (OET), which facilitate massively parallel manipulation of microscopic particles [43]. OET employ direct optical images to pattern DEP forces on a featureless photoconductive surface, enabling the manipulation of up to 15,000 particles within a 1.3 × 1.0 mm2 area, circumventing complex wiring issues. However, the OET application in droplet-based microfluidics encounters limitations due to impedance mismatch between the oil and photoconductive layers, restricting electric field modulation in an insulating oil medium commonly used in these systems [46,47]. To overcome this, Park et al. introduced the floating electrode optoelectronic tweezers (FEOET) mechanism [48]. By locally modifying a laterally applied electric field, the FEOET achieved optical DEP manipulation of a water droplet in an open-chamber oil medium with a remarkably low light intensity at 4.08 μW/mm2. This is significantly lower than traditional OET methods (four orders lower light intensity requirement), facilitating parallel manipulation of numerous droplets on cost-effective LOC chips. This FEOET technology was further advanced by using paired-diamond-shaped optical projections, demonstrating two-dimensional (2D) parallel manipulation of sixteen droplets on the FEOET’s photoconductive surface [49]. The unique configuration of the FEOET in a single-sided, open-chamber device allows seamless integration with other microfluidic components, such as micropipettes, arrayed microwells, and microchannel-based droplet generators. This integration enhances the versatility and functionality of the device for multiplexed biochemical analyses. Utilizing the FEOET principle, various microfluidic functions including droplet transport, mixing, merging, and parallel processing have been successfully demonstrated, emphasizing the simplicity and functionality of the device [49]. A later FEOET study introduced a plasmonic light scattering technique to greatly enhance optical DEP performance [50]. By incorporating metal nanoparticles, plasmonic field enhancement significantly increased the light absorption of low-quality photoconductive materials, leading to highly enhanced DEP forces for effective manipulation of oil-immersed aqueous droplets. Despite these advancements and advantages of the FEOET device, including simplicity, flexibility, and cost-effectiveness, there still remains a need for a deeper understanding of the optimal conditions that can maximize DEP forces. This understanding is crucial to fully leverage the potential of the FEOET in developing low-cost, disposable LOC chips for biological and biochemical analyses [51,52,53].
This article presents an optimization study for enhancing the optical dielectrophoretic (ODEP) performance to effectively manipulate an oil-immersed droplet on a single-sided photoconductive surface of the FEOET device. This study primarily focuses on the positional and size-dependent effects to maximize ODEP forces. The investigation begins with examining the conductivity switching performance induced by light in the FEOET device, determining the characteristic length (Lc) of the electric field, defined as the location of peak field strength. Utilizing 3D finite element simulations, the ODEP force exerted on a spherical droplet was computed through the Maxwell stress tensor by integrating the electric field strength over the droplet’s surface. Our findings indicate that the optimal position for maximizing ODEP force is at xopt = Lc + r, where r is the droplet radius. Additionally, the droplet size was optimized to ropt = 5Lc, enhancing the light-induced field perturbation and consequently creating the largest ODEP force. Experimental validation reinforced these simulation results. A water droplet sized at r = 5Lc achieved the greatest movement efficiency with the longest travel distance of 13.5 mm and the highest moving speed of 6.15 mm/s when it was initially positioned at x0 = Lc + r = 6Lc from the light illumination center. These experimental results confirm that optimal droplet transportation is achieved at the position of xopt = Lc + r, regardless of its size. Furthermore, a separate size-dependent investigation revealed that the maximal droplet dynamics was obtained for its optimum size of ropt = 5Lc. The study on the position- and size-dependent optimal conditions for maximizing ODEP force provides its potential applications in developing cost-effective and disposable FEOET devices for multiplexed biological and biochemical analyses.

2. An Overview of a Light-Driven DEP Droplet Manipulation Platform

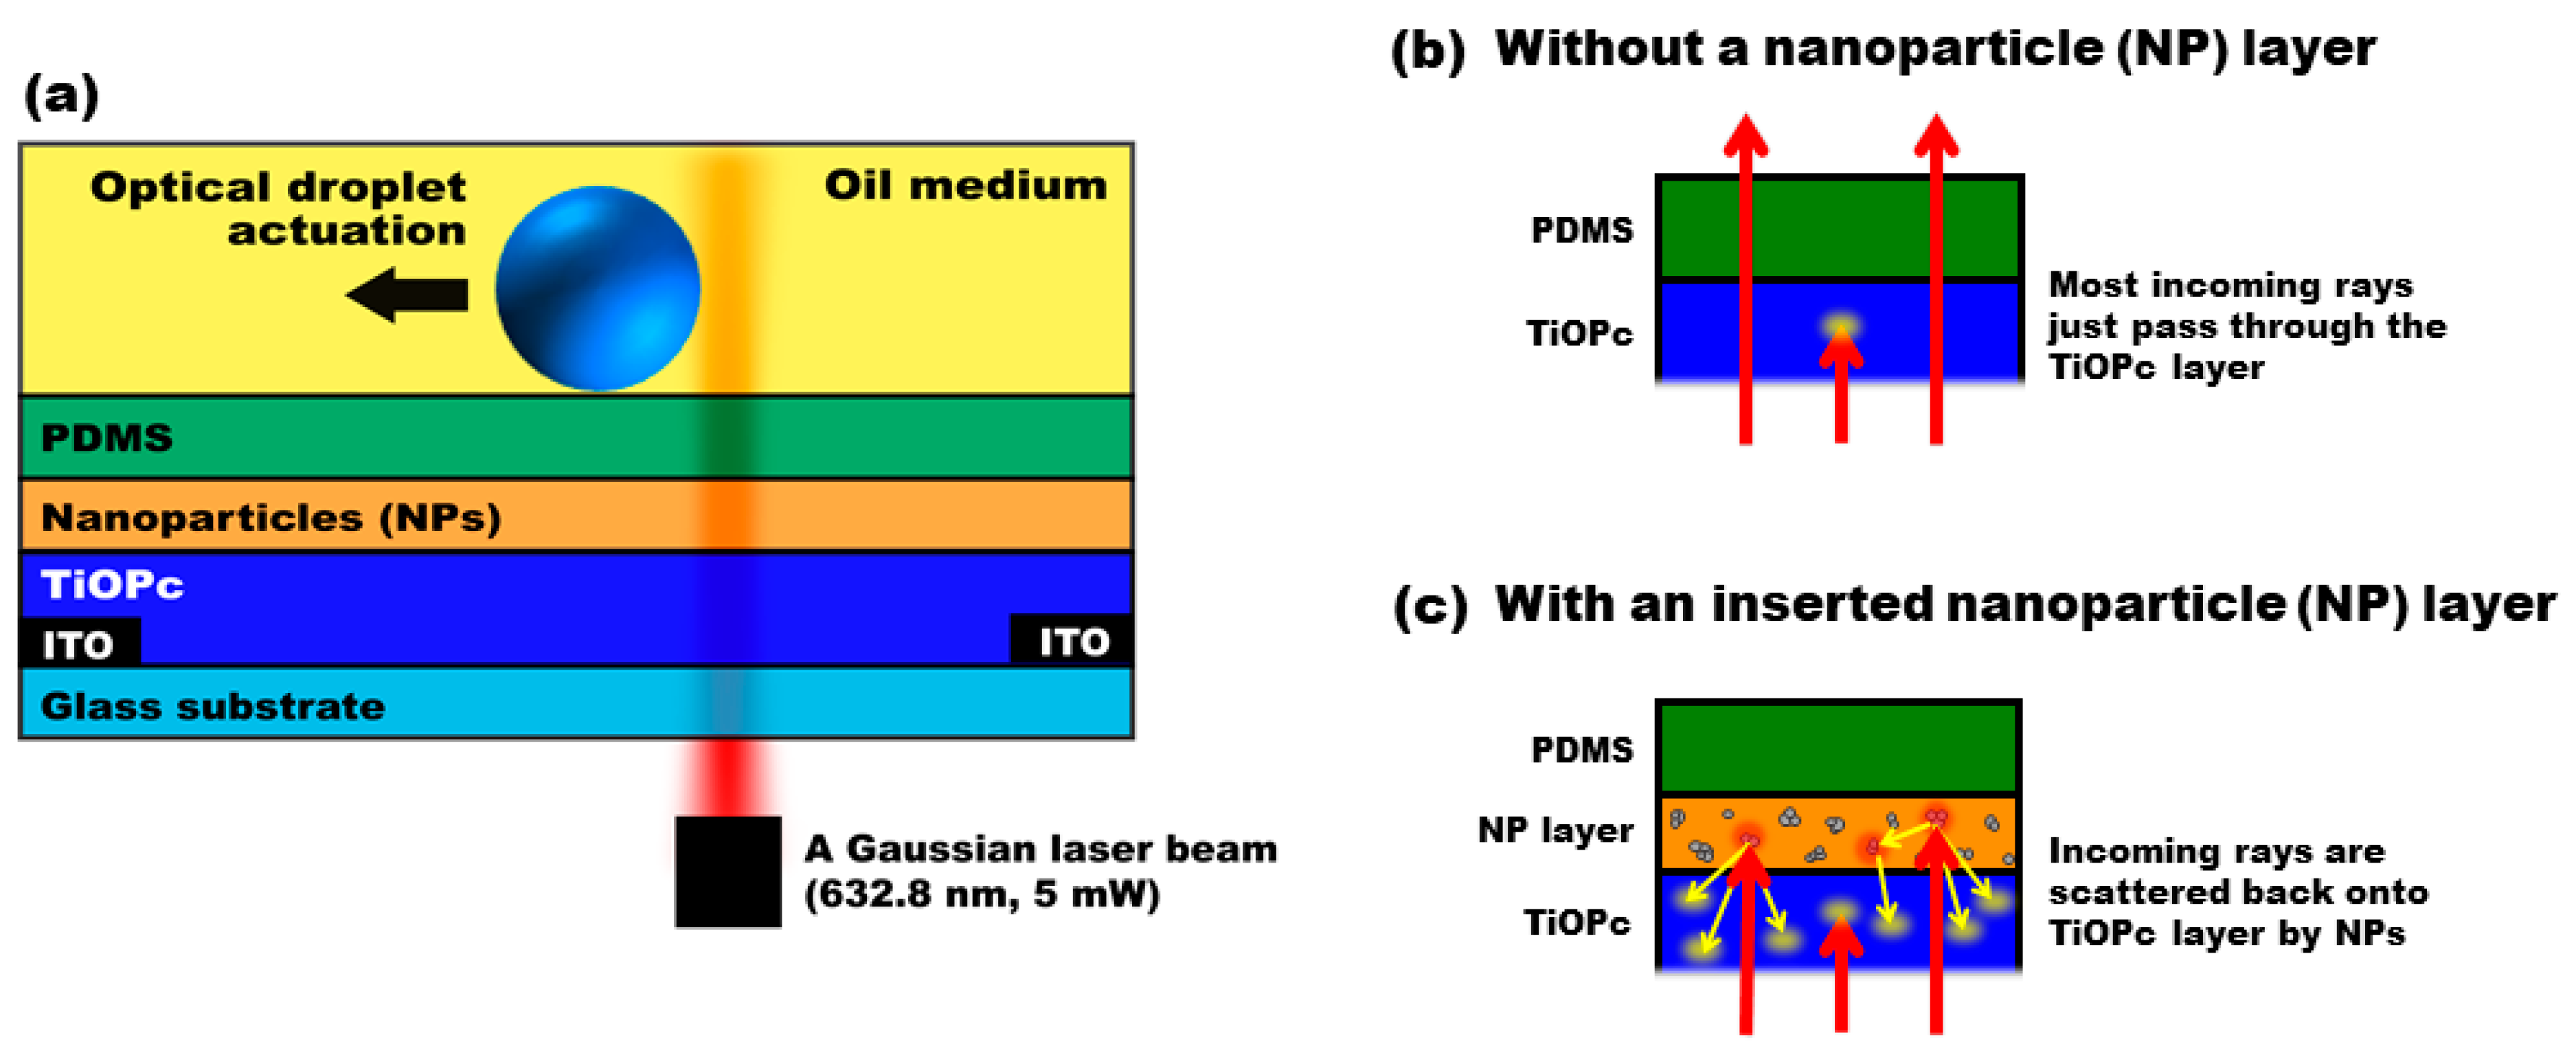
2.1. Device Structure and Its Fabrication

Figure 1a presents a schematic of the FEOET device that enables ODEP manipulation of an aqueous droplet on a single-sided photoconductive surface. The device fabrication begins with patterning two indium tin oxide (ITO) electrodes on a glass substrate using a wet-etching process, creating a 30 mm gap between them at the edges of the device. A key component in this device is the photo-responsive layer, for which we utilized a polymer-based photoconductive material, titanium oxide phthalocyanine (TiOPc) [54,55]. With this polymer-based material, its thin-film layer can be easily fabricated via an inexpensive, spin-coating fabrication step without the need for high-cost and complex facilities like chemical vapor deposition (CVD) or plasma-enhanced chemical vapor deposition (PECVD) [56,57]. A TiOPc solution was prepared by dissolving its powder (Sigma-Aldrich, St. Louis, MO, USA) in a chlorobenzene solvent (1.0 wt%) at 80 °C for 2 h. This solution was then drop-casted onto the substrate and left to dry at room temperature for an additional 2 h, resulting in a 20 µm thick TiOPc layer above the ITO electrodes. However, TiOPc’s poor light absorption capability, especially when compared with semiconductor materials like amorphous silicon (a-Si) commonly used in light-driven microfluidics [41,48,49,58,59], posed a challenge. This limitation is attributed to its restricted charge carrier mobility and low exciton diffusion length at the donor/acceptor interface [60,61,62,63]. As a result, most incoming rays pass through the TiOPc layer without significantly contributing to its photoconductivity, as depicted in Figure 1b, leading to poor ODEP performance. To address this, a plasmonic-enhanced method using metallic nanoparticles was introduced [50,64]. These nanoparticles, dispersed atop the TiOPc layer, induce plasmonic scattering over a wide angular spread, effectively increasing the optical path lengths of the light rays as shown in Figure 1c. This scattering redirects more light onto the TiOPc layer, thereby substantially improving its light absorption and photoconductive performance. This enhancement enables more effective ODEP manipulation of droplets, with a demonstrated increase in actuation speed by more than 11-fold.
In this study, we retained the previously established device structure, leveraging the improved photoconductive efficiency of the TiOPc layer augmented with plasmonic light scattering effects. To achieve this, we utilized aluminum (Al) nanoparticles approximately 50 nm in diameter. Al nanoparticle powder (0220XH, Skyspring Nanomaterials, Houston, TX, USA) in 2.0 wt% was first dissolved in a Teflon solution (AF1601, DuPont, Wilmington, DE, USA). To ensure the effective dispersion of these nanoparticles, the solution was further diluted to 3% using Fluoroinert Liquid (FC-72, 3M, Saint Paul, MN, USA). This diluted solution was then spin-coated onto the TiOPc layer and cured at 110 °C for another 2 h, obtaining a 1.8 µm thick layer of the nanoparticles. Finally, an open PDMS chamber with a 25 µm thickness was placed above the nanoparticle layer to house an aqueous droplet suspended in an oil medium.

2.2. Droplet Actuation Principle on an FEOET Device

Droplet actuation on an FEOET device is based on the electrostatic interaction of an aqueous droplet with a light-induced, non-uniform electric field pattern created on a photoconductive surface. In the absence of light illumination, a uniform electric field is established along a lateral direction when a direct current (DC) bias voltage is applied between two ITO electrodes patterned at the edges of the device. Upon illumination, the photoconductive layer generates electron–hole pairs to alter its photo-state conductivity, essentially creating a virtual electrode at the illuminated region. Consequently, the previously uniform electric field is significantly disrupted, resulting in a non-uniform electric field pattern necessary for DEP manipulation of the droplet.
An aqueous droplet is loaded atop the TiOPc layer covered with a PDMS insulation layer. In the absence of light, an electric dipole forms across the droplet’s surface due to charge accumulation along the lateral direction. This dipole distribution is symmetrical to result in the zero net DEP force. This scenario changes significantly upon light exposure. When a light beam targets an area near one edge of the droplet, it disrupts the previously balanced electric field pattern. This illumination significantly reduces the field strength at the illuminated region, leading to an asymmetrical field distribution around the droplet. This imbalance creates a net positive DEP force, compelling the droplet to move toward the region with the stronger electric field. This light-induced alteration in the field strength and distribution is the key mechanism enabling the controlled manipulation of the droplet in the FEOET device.

3. Numerical Simulation Study

In this section, three-dimensional (3D) numerical simulation results are discussed to understand the optimal position and size of the droplet that can maximize ODEP force. For this simulation study, finite element software (COMSOL Multiphysics 5.6) was employed to estimate the ODEP force electrostatically exerted on a spherical droplet placed on the photoconductive surface.

3.1. Photoconductivity Measurement of the Nanoparticle-Coated TiOPc Layer

As described in the previous section, the nanoparticles dispersed on the TiOPc layer enhance its photoconductive performance via the plasmonic light scattering effect [50]. We faced a critical question of how to accurately model this plasmonic-enhanced photoconductive layer for numerical simulations. To address this, we undertook experimental measurements of the dark- and photo-state conductivities (σdark and σphoto) of the nanoparticle-coated TiOPc layer. These measurements were pivotal in characterizing the conductivity switching performance of the TiOPc layer, which will be further used to accurately define the conductivity profile of the TiOPc layer in our subsequent simulation studies.
For the conductivity measurement study, we fabricated an identical FEOET device with the modification of excluding the open PDMS chamber. The nanoparticle-coated TiOPc layer was patterned to bridge across two electrodes at the edges of the device with L = 1 mm in length and W = 4 mm in width. To assess the photoconductivity of this layer, we employed a 632.8 nm laser (HNL050LB, Thorlabs, Newton, NJ, USA) as the light source. The laser beam was further expanded by a 5× beam expander to ensure complete coverage of the 1 × 4 mm2 active area of the TiOPc layer. The electric resistance (RTiOPc) of the nanoparticle-coated TiOPc layer, bridged between two electrodes, was measured using a high-precision electrometer (B2985A, Keysight, Santa Rosa, CA, USA), serially connected with a 1 GΩ reference load. From the measured resistance values, we calculated the electrical conductivity (σ) of the nanoparticle-coated TiOPc layer using the following equation:
σ = L R TiOPc A
where L and A are the lateral length and cross-sectional area of the TiOPc layer. Our measurements yielded specific conductivity values under different illumination conditions. Under a dark state at an illumination intensity of Idark = 3.70 µW/cm2, the dark-state conductivity was recorded as σdark = 2.63 × 10⁻⁹ S/m. Conversely, during the photo state with an intensity of Iphoto = 929.96 mW/cm2, the photo-state conductivity was measured as σphoto = 2.65 × 10⁻⁶ S/m. These measurements allow us to determine the conductivity switching performance of the nanoparticle-coated TiOPc layer, quantified as the conductivity ratio between the photo and dark states, i.e., b = σphoto/σdark = 1007. In subsequent simulation studies, these empirical data will be utilized to accurately model the Gaussian conductivity distribution of the photoconductive layer.

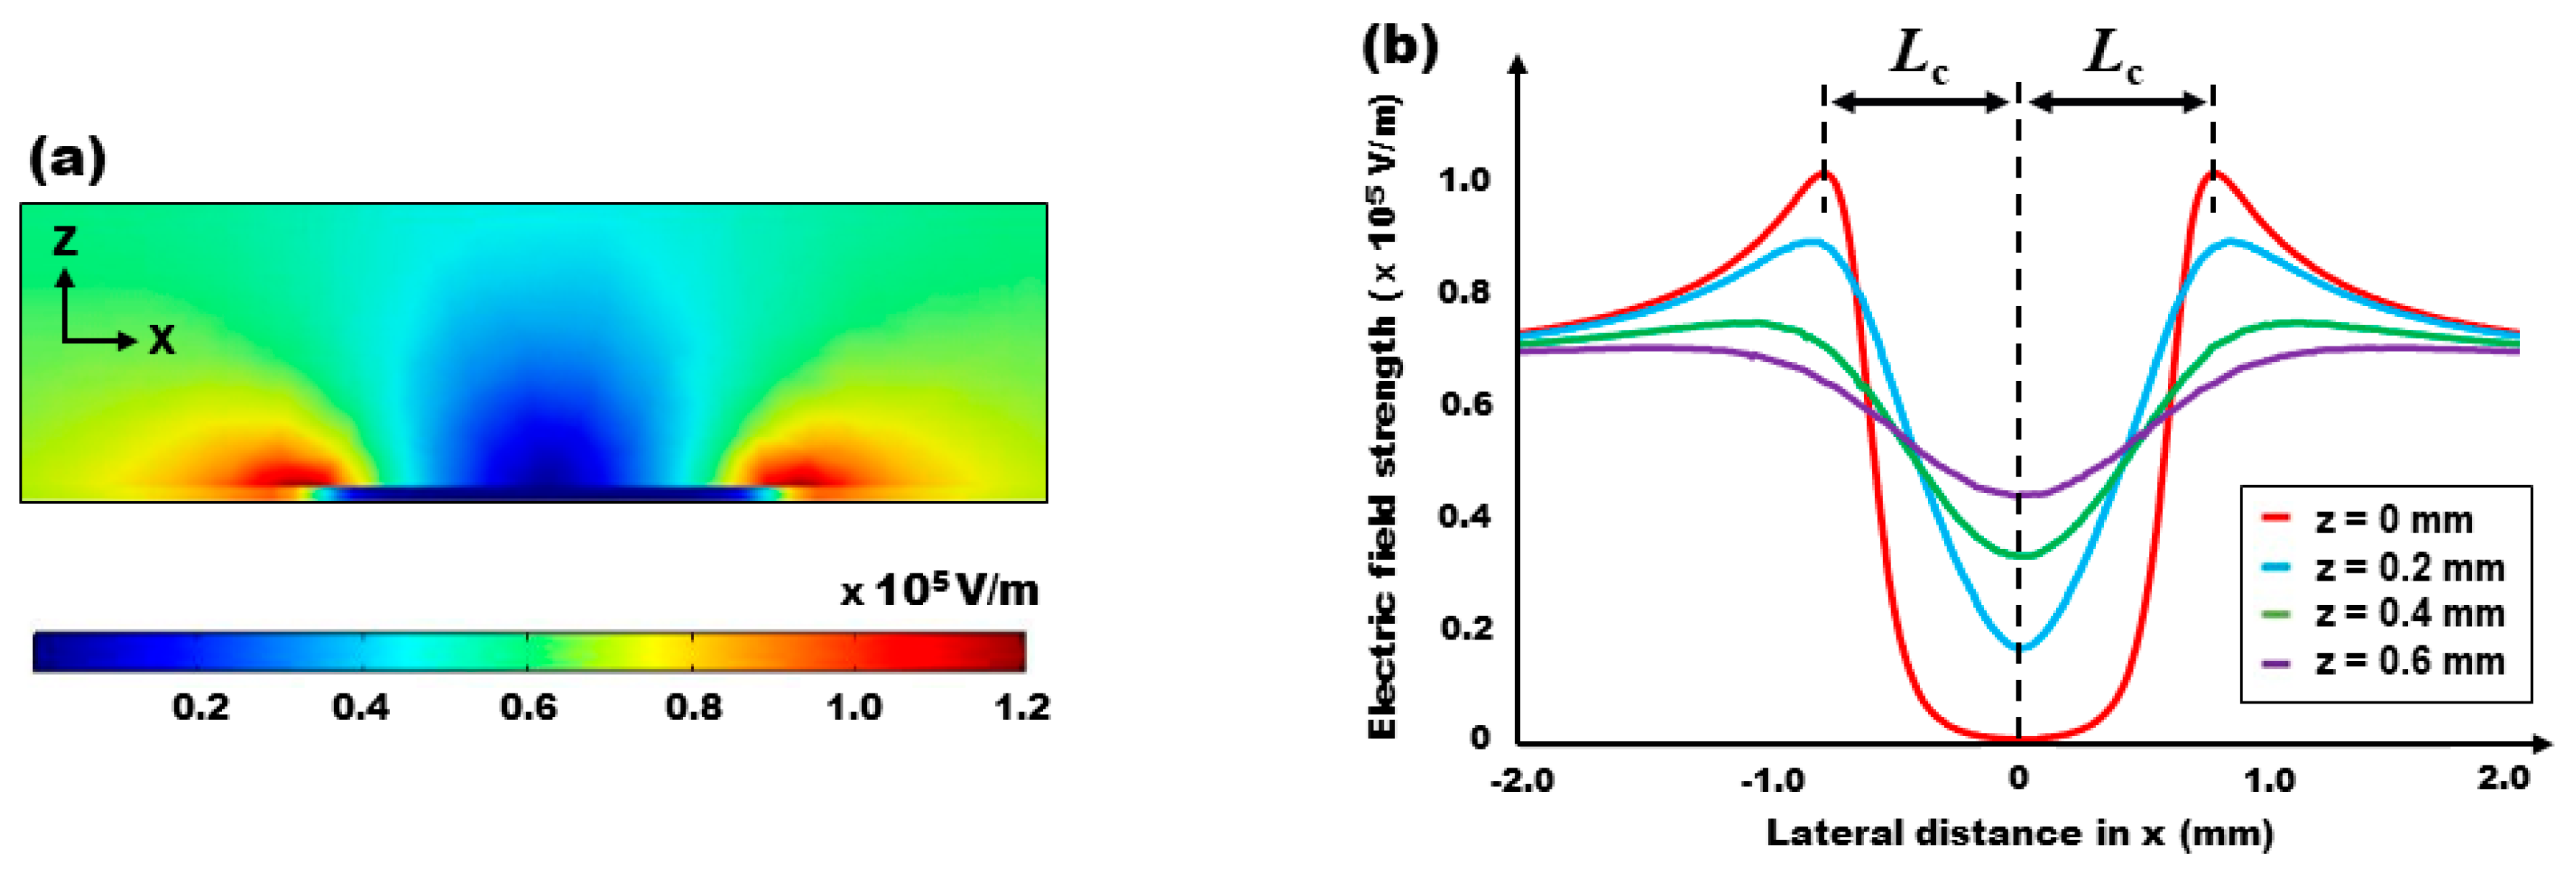
3.2. Light-Induced Electric Field Distributions

In our numerical simulations, the FEOET device was modeled to be composed of three distinct layers: a 20 µm photoconductive layer, a 25 µm PDMS layer, and a 20 mm oil medium. These dimensions are in accordance with the experimental conditions. With the presence of an electric field at 100 V/mm applied between the end planes of the device, a uniform electric field was initially created along a lateral direction. To accurately model the photoconductive layer, we made several assumptions. First, we assumed that the photoconductivity does not vary along the vertical direction. Second, the radial distribution of photoconductivity was considered to be linearly proportional to the intensity profile of a Gaussian laser beam. Based on these assumptions, the photoconductive layer was assigned a two-dimensional (2D) Gaussian conductivity distribution in the simulations. This distribution is mathematically represented as follows:
σ = σ dark + σ photo exp 2 x 2 + y 2 w 2
where w denotes a Gaussian beam radius of the laser illumination, and σdark and σphoto represent the dark- and photo-state conductivities of the photoconductive layer, which were measured from the previous experiment
Figure 2a displays a cross-sectional view of the electric field distribution when subjected to illumination by a Gaussian laser beam. The beam radius was set at w = 0.405 mm, and the photoconductive layer was modeled based on its observed conductivity switching performance, where b = σphoto/σdark = 1007. Figure 2b further illustrates the extracted electric field strength data at various locations along the z-direction. Notably, the distribution is symmetric at the center of the light illumination at x = 0. At the surface directly above the PDMS layer (i.e., z = 0), a significant decrease in field strength is observed in the middle of the illuminated area, while a pronounced enhancement is seen at the illumination’s edges. As per the Gaussian conductivity distribution detailed in Equation (2), the electric field strength reaches its peak of E = 1.04 × 10⁵ V/m at x = ±0.78 mm from the center of illumination, as shown in Figure 2b. This point of the peak field strength is identified as a characteristic length of Lc = 0.78 mm. This characteristic length of the electric field plays a pivotal role in determining the optimal position and size of the droplet for maximizing the ODEP force. The implications of this characteristic length on the droplet’s optimal conditions are extensively explored in the following sections.
Figure 3 illustrates the results of three-dimensional (3D) numerical simulations depicting the field distribution when an aqueous droplet is positioned in the 10 × 4 × 2 mm3 oil medium of the FEOET device. The droplet is modeled as a sphere with a radius equivalent to the characteristic length, r = Lc = 0.78 mm. In the absence of light illumination, as depicted in Figure 3a, an electric dipole is induced, creating a strong field pattern at both edges of the droplet along the lateral direction. However, this field pattern is symmetrically balanced around the droplet, resulting in a net zero DEP force and, consequently, no movement of the droplet. To investigate the light-induced field perturbation on the droplet’s surface, we positioned the droplet at x0 = Lc from the center of the light illumination. Upon illumination, a considerable change occurs in the field distribution: the previously strong field pattern on the left side of the droplet significantly diminishes, as shown in Figure 3b. This alteration leads to an asymmetric and unbalanced field pattern around the droplet, thereby generating a net positive DEP force. This force acts to drive the droplet away from the illuminated area. The bottom two plots in Figure 3 demonstrate the distinct differences in the field distributions on the droplet’s surface under conditions without and with the light illumination at the droplet’s left side. These results clearly indicate the influence of light-induced field perturbation on the droplet’s surface for ODEP manipulation on the FEOET device.

3.3. ODEP Force Calculation

We further focused on calculating the ODEP force exerted on the droplet. Generally, the DEP force acting on a particle can be estimated using the equation F = (p · )E, where p is the field-induced dipole moment and E is the electric field [65,66]. This approximation holds true predominantly when the particle size is substantially smaller than the characteristic length of the electric field gradient [67,68]. However, in our case, this conventional approximation cannot be satisfied for the DEP force estimation, as the size of the droplet is comparable to the scale of the light-induced electric field gradient. To circumvent this limitation and ensure precise calculation of the DEP force in our context, we employed the Maxwell stress tensor method. Due to the DC bias operation in the FEOET, the electric field strength inside the droplet effectively becomes zero. This occurs as a result of field screening, where charges accumulate on the droplet’s surface, thereby nullifying any tangential component of the electric field on the droplet’s surface. The Maxwell stress tensor can be simplified to the following form [69]:
F D E P = s u r f a c e 1 2 ε E 2 d s
where ε is the permittivity of the surrounding medium and E is the electric field strength on the droplet surface.
Using the 3D finite element simulation data, we conducted a comprehensive calculation of the electric field strength acting upon each infinitesimal area of the droplet’s surface. This intricate process involved integrating these individual field strength values over the entire surface area of the droplet, utilizing spherical coordinates for precise force calculation. This approach not only provides a qualitative understanding of the ODEP force electrostatically exerted on a spherical droplet, but also helps in determining the optimal position and size of the droplet to create the maximal ODEP force.

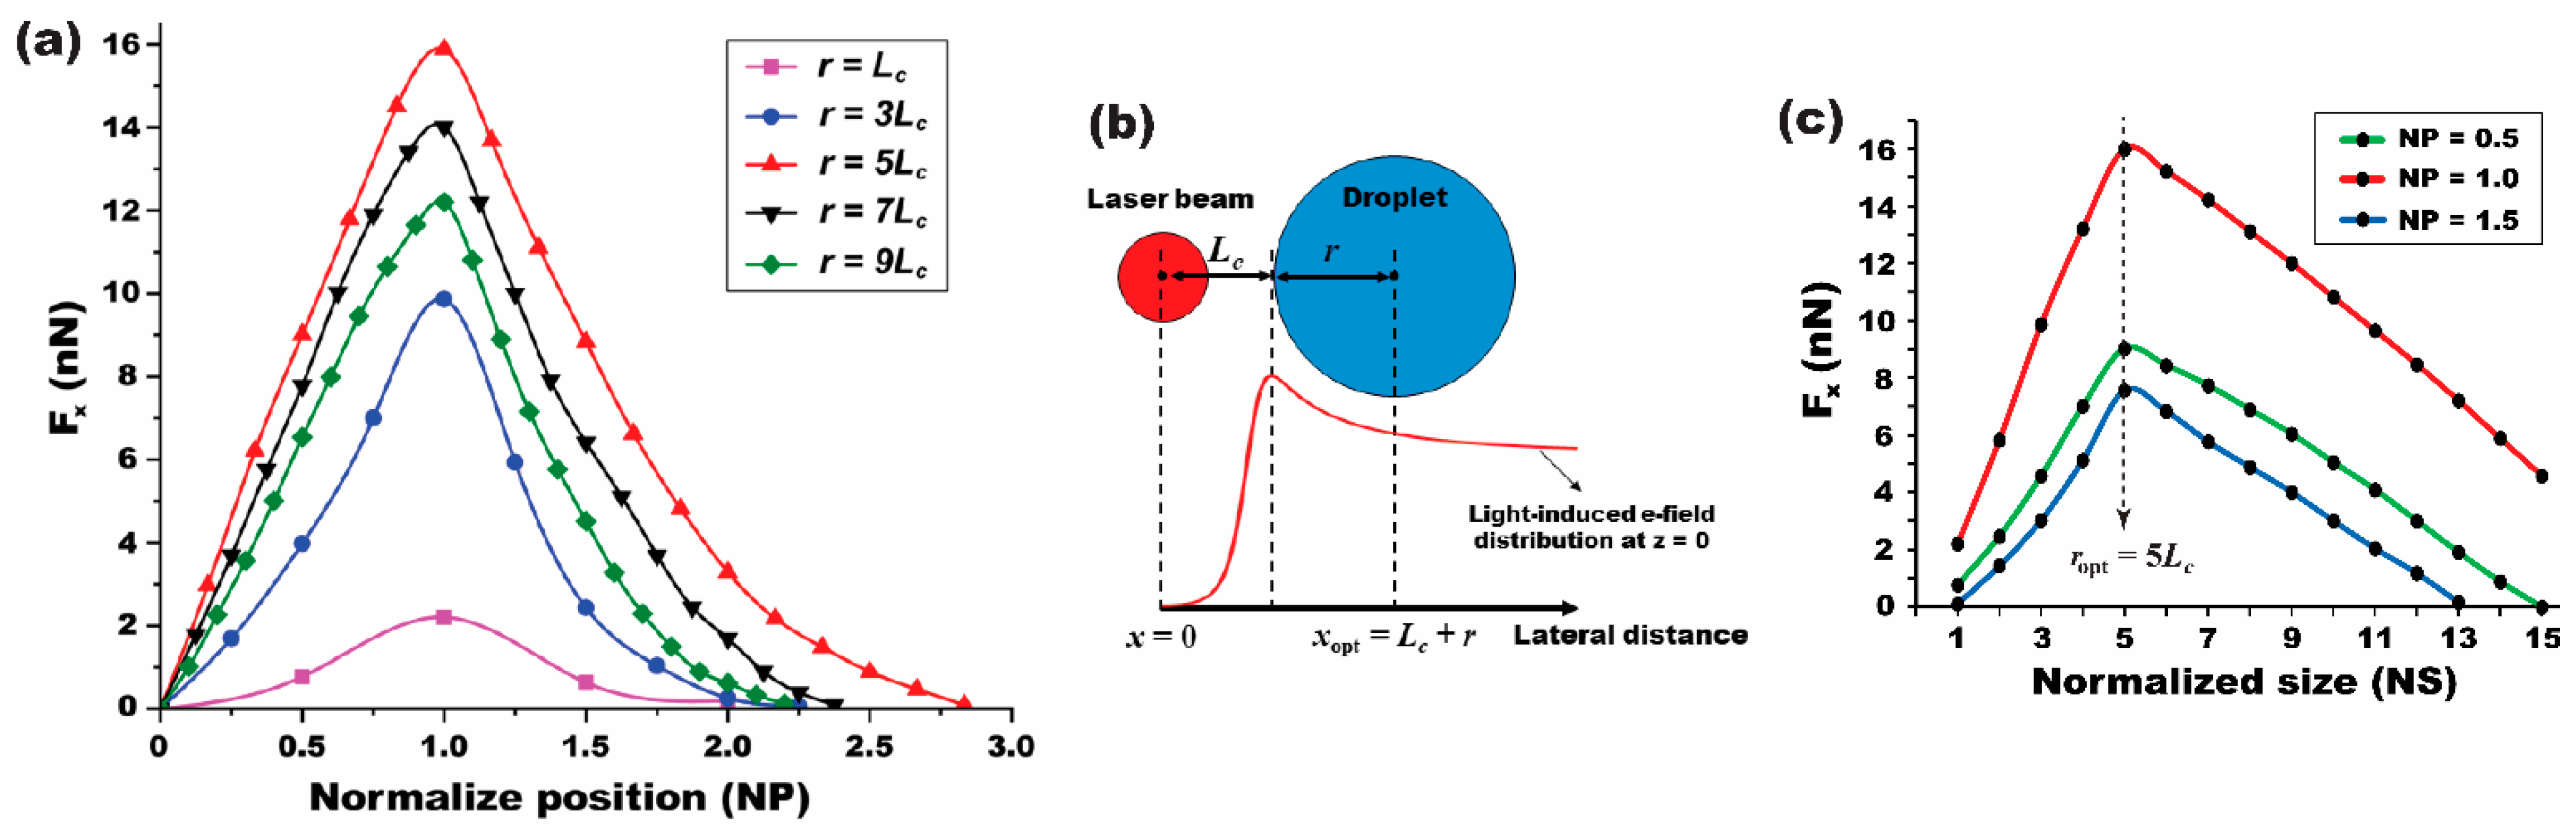
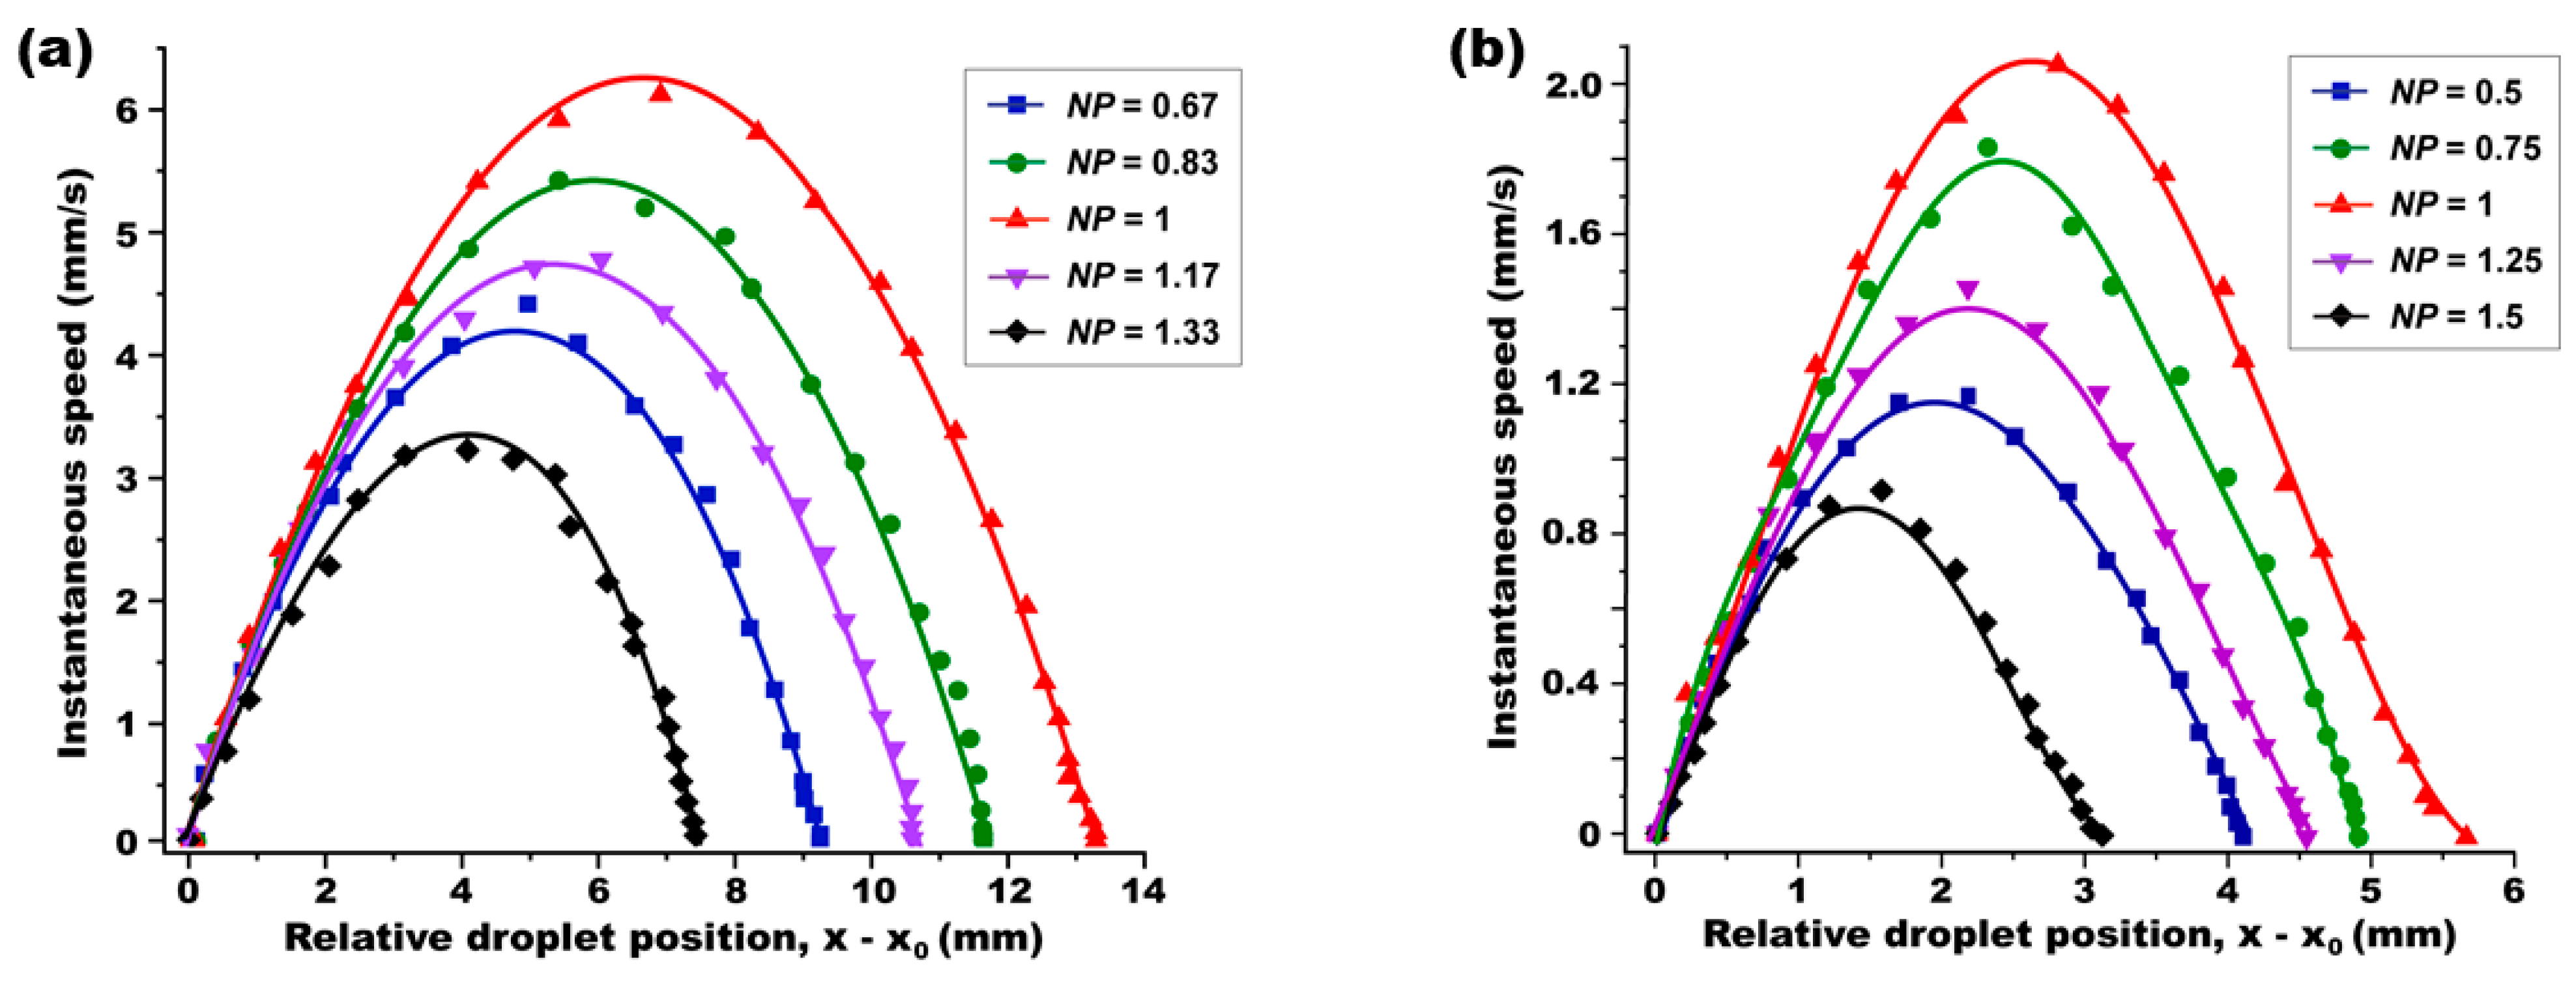
3.4. A Position-Dependent Effect

We first focused on examining how the position of the droplet affects the ODEP force. To explore this position-dependent effect, we repeated the simulation in Figure 3, keeping the droplet size constant at r = Lc = 0.78 mm and varying only its position (x0) relative to the light illumination, as depicted in the inset of Figure 4. All other simulation parameters were maintained as previously established. Using Equation (3), we calculated the x-directional ODEP force (Fx). The data plotted in Figure 4 show the variation in Fx with the droplet’s position (x0) from the center of the light illumination. When the droplet is centrally located within the illuminated area, i.e., x0 = 0, the field distribution around the droplet is symmetric and balanced, leading to a negligible DEP force (i.e., Fx ≈ 0). As the droplet is positioned away from the light illumination, we observed an increasing trend in Fx. The force reaches its peak of Fx = 2.21 nN when the droplet is positioned at x0 = (Lc + r) = 1.56 mm. At this location, the one edge of the droplet aligns with the characteristic length of Lc, where Fx is maximized. Beyond this point, as the droplet is located further away from the light illumination, Fx gradually decreases and eventually diminishes. It is worthwhile to note that, when the droplet is positioned to the left of the light illumination, it experiences the DEP force in the opposite direction, but with the same magnitude.

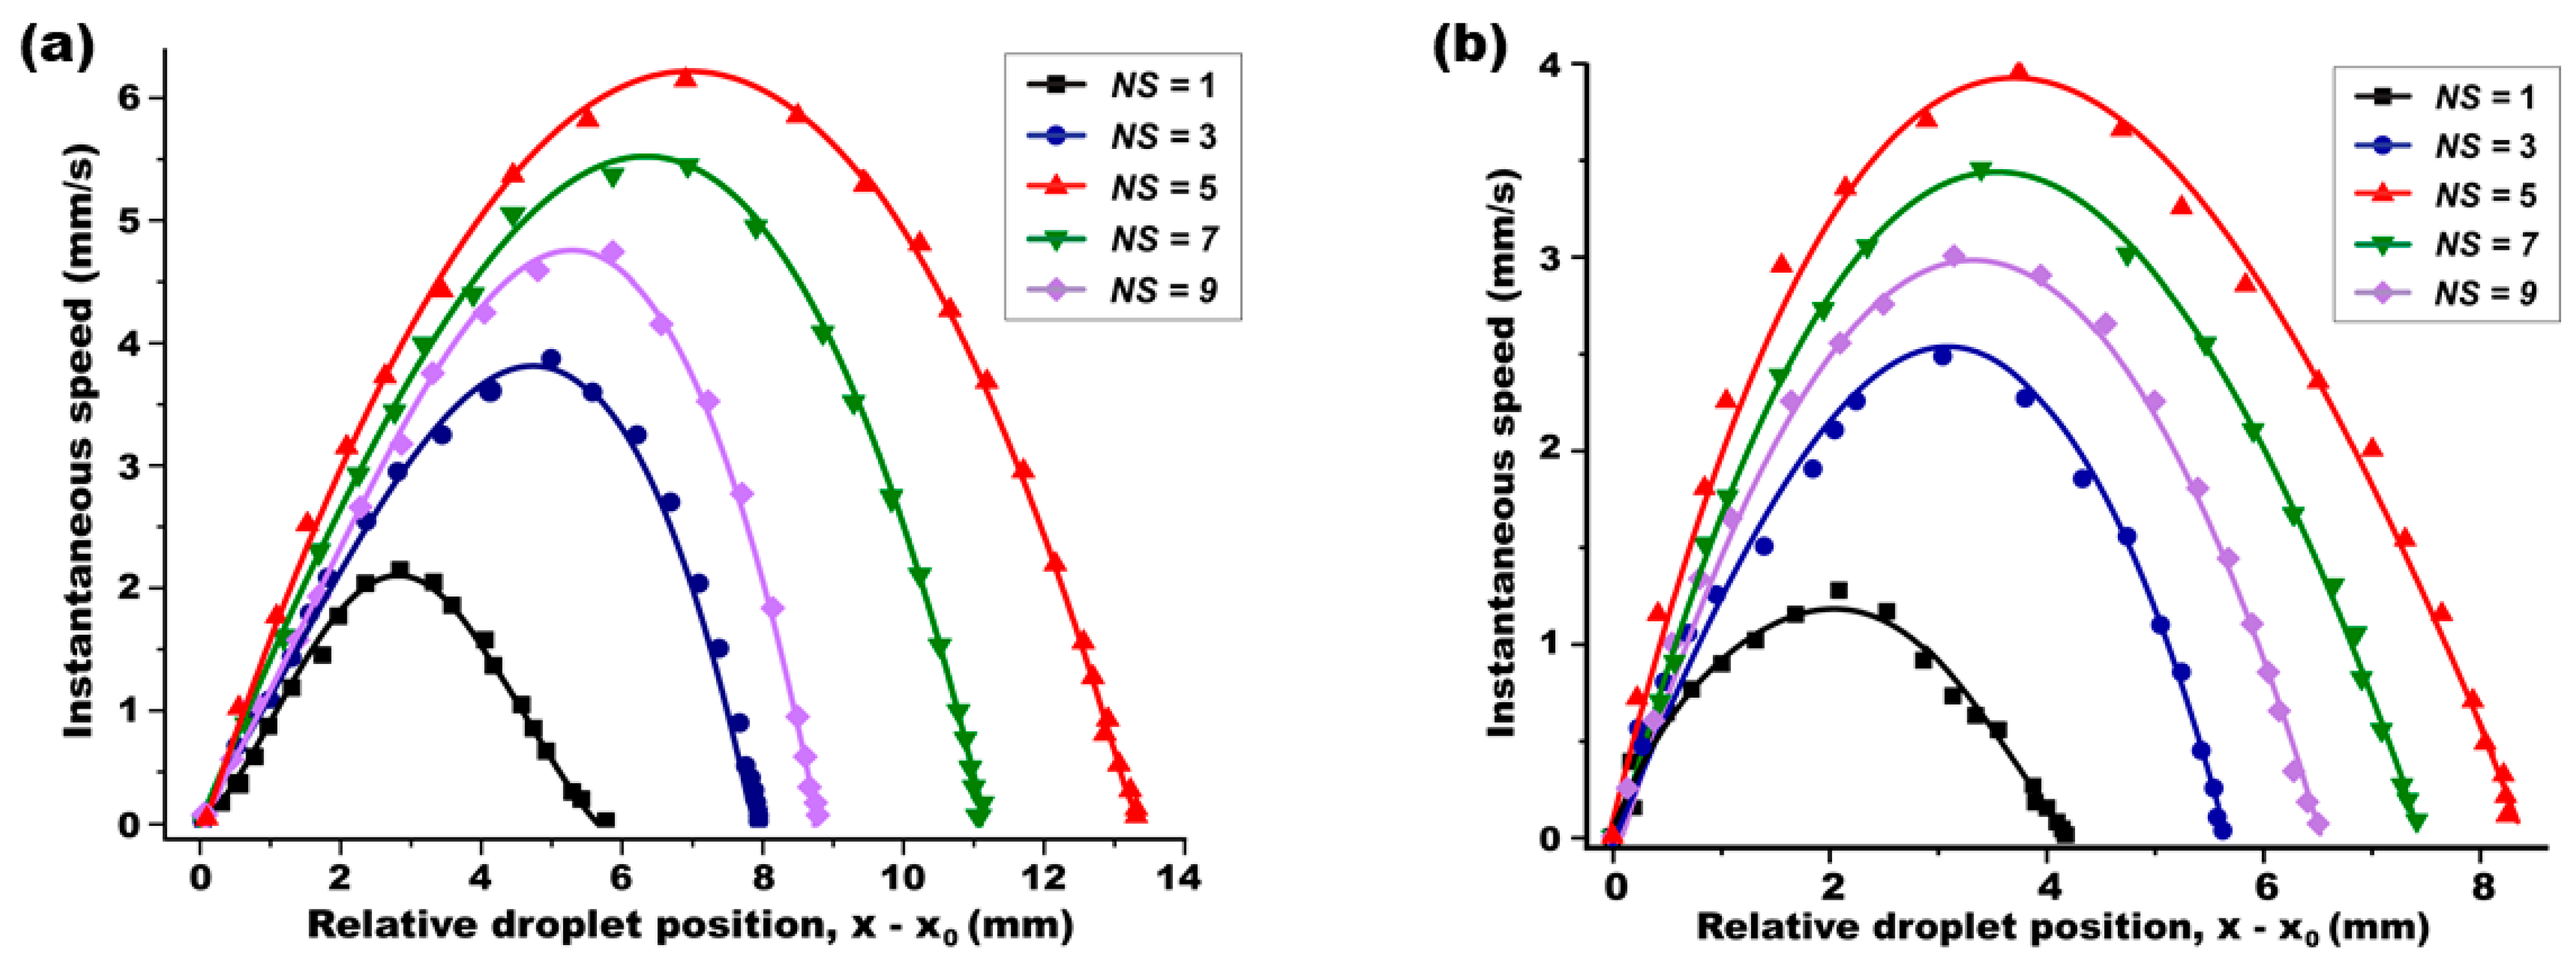
3.5. A Size-Dependent Effect

In our continued efforts to understand the influence of droplet size on the ODEP force, the simulation study was extended to include droplets with varying radii, ranging from Lcr ≤ 9Lc. The results of these simulations are depicted in Figure 5. The first notable observation is that the position-dependent Fx exhibits a consistent trend across all different droplet sizes. Regardless of its size, Fx ≈ 0 at x0 = 0. This negligible force value is attributed to the symmetric and balanced field distribution around the droplet when it is centrally located within the light illumination. As its position is away from the illumination, Fx increases, reaches its peak, and then decreases to zero.
Another intriguing finding is the identification of an optimal droplet size that maximizes Fx. The simulations revealed that a droplet with its size of r = 5Lc generates the largest DEP force, peaking at Fx = 15.89 nN when positioned at x0 = (Lc + r) = 4.68 mm, as shown by the red curve in Figure 5. For droplets either smaller or larger than r = 5Lc, the maximum value of Fx decreases. This diminishing trend in Fx is attributed to the electric field distribution, which is less effectively perturbed by the light illumination in cases where the droplet size deviates from this optimal value.

3.6. Optimal Position and Size of the Droplet

The findings from our previous simulation studies have laid the groundwork for determining the optimal position (xopt) and size (ropt) of a droplet to maximize the ODEP force in the FEOET device. For the purpose of this optimization study, we introduce a new approach to present the droplet’s position and size in normalized forms as follows:
N P = x 0 L c + r
N S = r L c
where NP and NS represent the normalized position and the normalized size of the droplet, respectively. This normalization process is a critical step in our analysis, as it allows us to systematically evaluate the impact of the droplet’s position and size in relation to the characteristic length (Lc). By expressing these two control parameters in a normalized form, we can more effectively compare and understand the influence of the droplet’s position and size on the ODEP force.
The comprehensive position- and size-dependent simulation results, initially presented in Figure 5, have been re-analyzed and re-plotted in the normalized terms. These re-plotted data are presented in Figure 6a and Figure 6c, respectively. At NP = 0, where the droplet is centrally positioned at x0 = 0 under the light illumination, the magnitude of the x-directional DEP force is negligible, i.e., Fx ≈ 0. This is attributed to the symmetric and balanced field distribution around the droplet. Another significant finding is the consistent attainment of the maximal Fx given at NP = 1 across all droplet sizes. At NP = 1, Equation (4) can be reformulated to define the optimal position of the droplet as xopt = (Lc + r). This position corresponds to the point where the light-induced field perturbation on the droplet’s surface is maximized, thereby generating the largest Fx. In other words, the results suggest that the ODEP force reaches its maximum when one edge of the droplet aligns with the characteristic length of Lc, as illustrated in Figure 6b, regardless of the droplet’s size.
To further understand the size-dependent effect on the ODEP force, we conducted simulations where the droplet’s size was varied, while its position was fixed at three different locations of NP = 0.5, 1.0, and 1.5. The study results are presented in Figure 6c, which depicts the size-dependent Fx as a function of the normalized size (NS) defined in Equation (5) as the ratio of the droplet size to the characteristic length of Lc. A critical observation from the graph is the behavior of Fx in relation to the NS value. We noted that Fx increases rapidly for values of NS < 5. A peak in Fx is achieved precisely at NS = 5 for all NP values. This peak in the graph indicates the optimal size of the droplet, ropt = 5Lc, which corresponds to the largest attainable Fx. When NS exceeds 5, a decreasing trend is interestingly observed in Fx. This reduction in force indicates that the light-induced field perturbation on the droplet’s surface becomes weakened as the droplet size grows beyond the optimal NS value. These insights into the position- and size-dependent ODEP force significantly enhance our understanding of droplet manipulation within FEOET systems.

4. Experimental Study

To experimentally validate the insights gleaned from our previous simulation studies regarding position- and size-dependent ODEP forces, we undertook a series of experimental studies. In these experiments, a deionized water droplet was placed into an oil-filled PDMS chamber. An electric field of 70 V/mm was uniformly applied across the entire device in a lateral direction. To induce the DEP force necessary for optical droplet manipulation, a Gaussian laser beam, with a beam radius of 0.405 mm and a total power output of 5 mW, was projected onto the nanoparticle-coated TiOPc layer. The movement of the droplet, triggered by the ODEP force, was meticulously recorded from its initial position until it came to a complete stop. This recording was achieved using a high-speed camera (VEO-E 340L, Phantom, Wayne, NJ, USA), allowing for detailed analysis of the droplet’s motion.
Figure 7 captures key moments in the ODEP actuation of an oil-immersed water droplet with its volume of 248.5 μL (equating to its radius of r = 5Lc = 3.9 mm) on a single-sided photoconductive surface. The droplet was initially positioned at x0 = (Lc + r) = 6Lc = 4.68 mm from the center of the light illumination, as shown in Figure 7b. Prior to the laser beam’s illumination, no movement of the droplet was observed, despite the application of a bias voltage (Figure 7a). This changed dramatically when the laser beam was introduced to illuminate the edge of the droplet. Upon illumination, the droplet was optically actuated, moving away from the illuminated region, as captured in Figure 7b. The droplet’s speed progressively increased during its movement. A significant observation was made at t = 1.8 s, where the droplet’s instantaneous speed reached its peak of 6.15 mm/s as it moved through the location at x = 12.49 mm (Figure 7c). Following this peak, the droplet’s speed gradually decreased until it eventually came to a stop at a final location of xf = 18.18 mm (Figure 7d). The total travel distance of the droplet was calculated as ∆x = (xf - x0) = 13.5 mm, completed over a duration of ∆t = 5.2s. It is worthwhile to note that we did not observe any light-induced thermal effect on droplet dynamics in the experiments.
In the following sections, we will delve into a detailed experimental study of droplet dynamics to validate the findings from our simulations on the position- and size-dependent effects on the ODEP force.

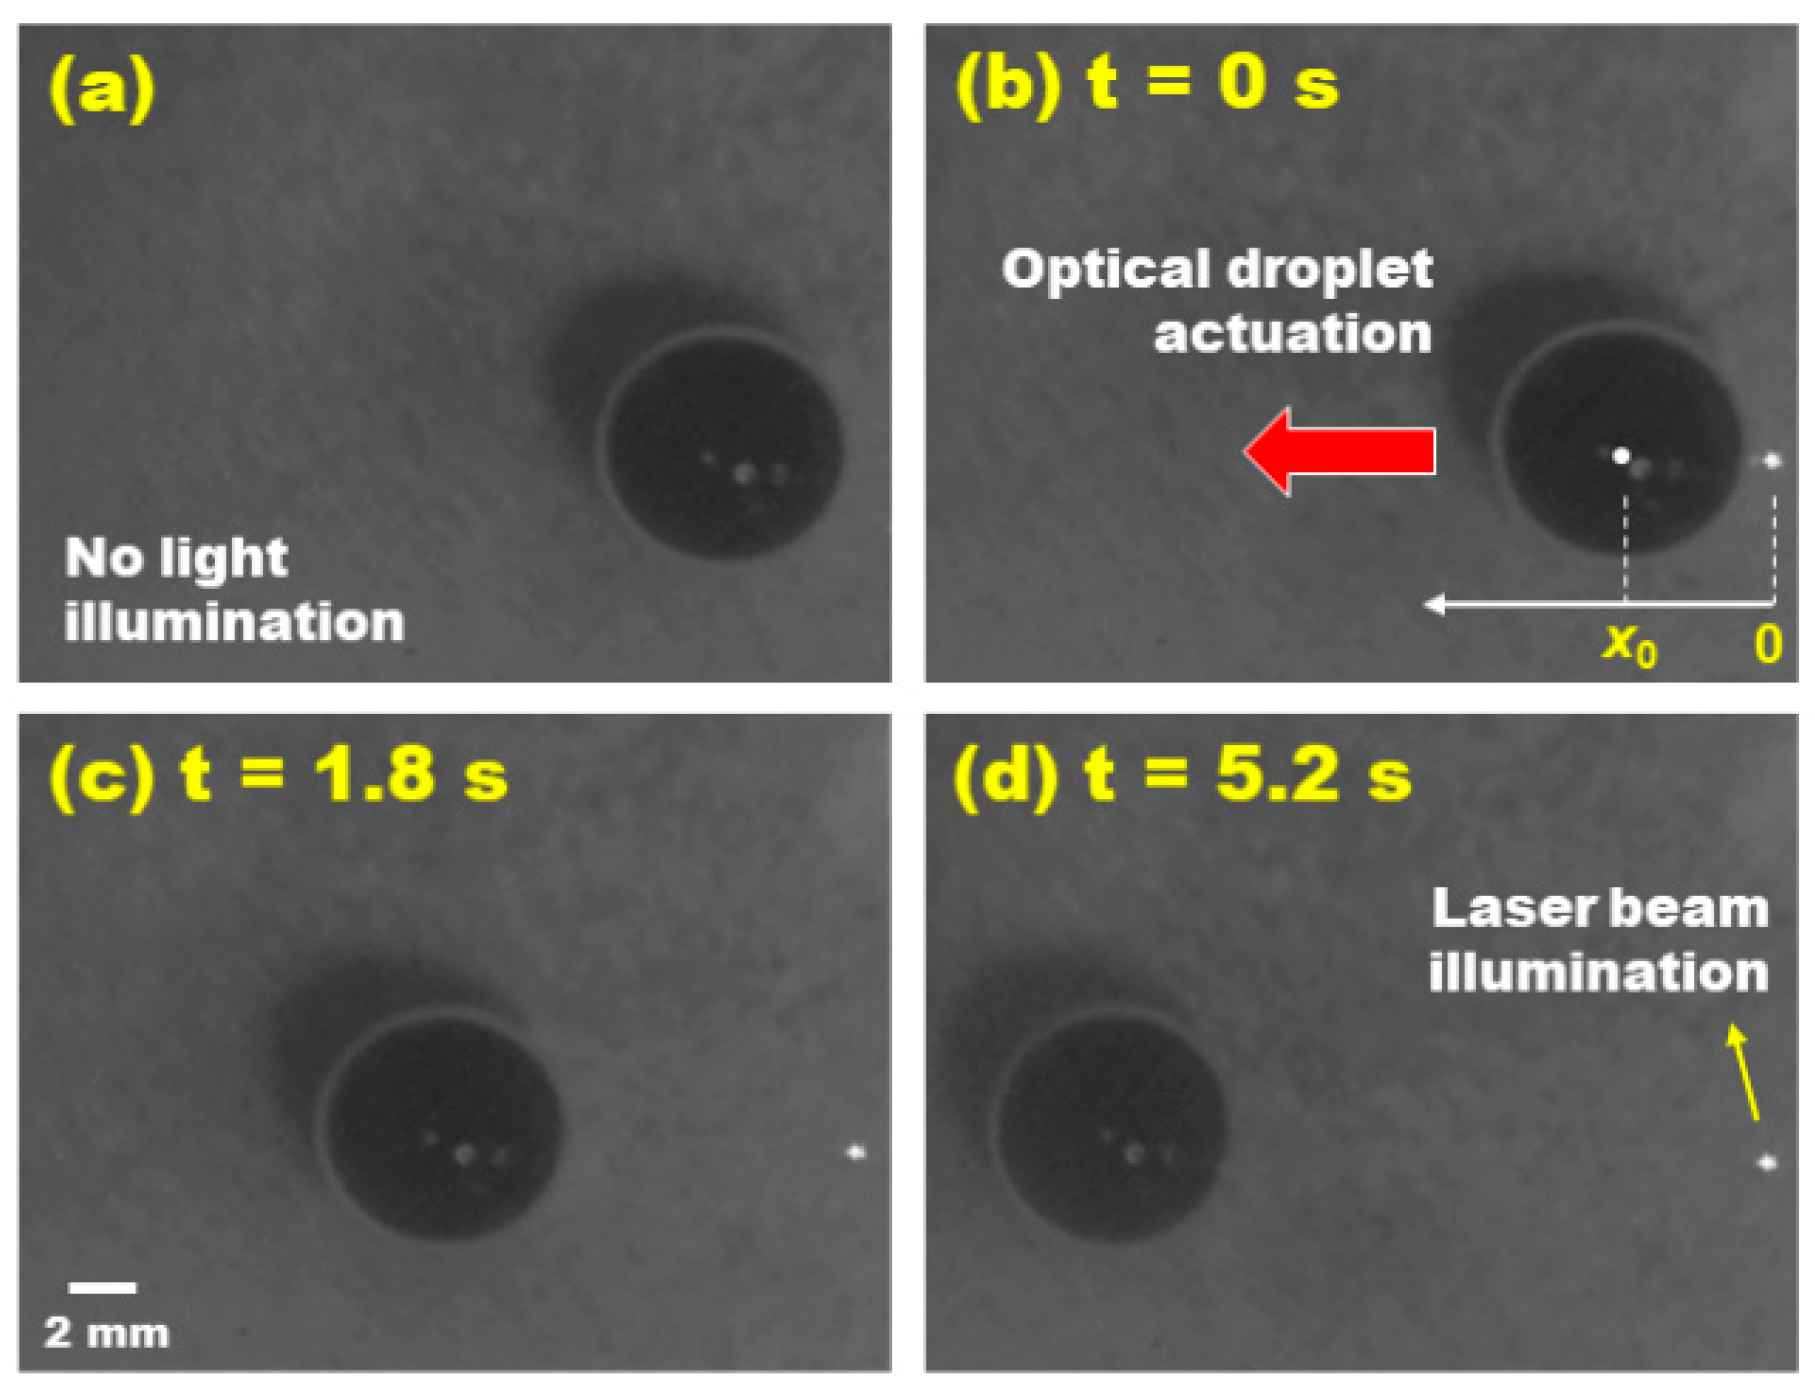
4.1. A Position-Dependent Experimental Study

Based on the previous simulation results in Figure 6a, we recognized that the largest ODEP force could be generated when a droplet is positioned at NP = 1, corresponding to the optimal position of xopt = (Lc + r) away from the light illumination. This optimal position aligns one edge of the droplet with the characteristic length of Lc, where the strongest field perturbation and, consequently, the maximum ODEP force can be generated. With this largest ODEP force, the droplet is expected to undergo the longest travel transportation with the highest speed.
To experimentally validate these findings, we conducted a droplet dynamics study with the normalized droplet size fixed at NS = 5 (i.e., r = 5Lc). The initial position of the droplet was varied in 4Lcx0 ≤ 8Lc, corresponding to 0.67 ≤ NP ≤ 1.33. Figure 8a presents the profile of the droplet’s instantaneous speed measured at various locations. For a comparative study on the position-dependent effect, the x-axis was represented as the droplet’s location relative to its initial position, i.e., (xx0). Upon illumination by a Gaussian laser beam, the droplet commenced movement, reaching its peak speed before coming to a complete stop. Notably, the longest travel distance, ∆x = (x0xf) = 13.5 mm, and the highest speed, 6.15 mm/s, were observed when the droplet was initially positioned at NP = 1. This observation aligns well with the simulation results where the optimal position was given as xopt = (Lc + r) = 6Lc for the droplet with its size of r = 5Lc, at which the largest Fx was obtained. For the droplets initially positioned away from this optimum position in either x < xopt or x > xopt, the ODEP force becomes weakened. Correspondingly, shorter transportation and a slower moving speed are observed, as shown in Figure 8a.
A subsequent experiment was repeated for a smaller droplet at NS = 1 (i.e., r = Lc). The observed speed trend—increasing, peaking, then decreasing—was consistent (as shown in Figure 8b). Even for the smaller droplet size, the longest travel distance as ∆x = (xfx0) = 5.73 mm and the highest speed as 2.05 mm/s were achieved when the droplet was initially positioned at NP = 1, confirming the optimal position of xopt = (Lc + r) = 2Lc = 1.56 mm at which the largest Fx was attained.
Considering the numerical and experimental study results we obtained, it becomes evident that the maximum ODEP force Fx is generated when a droplet is initially positioned at x0 = xopt = (Lc + r) from the light illumination. These findings not only validate our simulation predictions, but also provide crucial insights for optimizing ODEP force in FEOET devices for practical applications.

4.2. A Size-Dependent Experimental Study

In continuation of our experimental efforts, we conducted a size-dependent study to further investigate the influence of droplet size on optical DEP force. In these experiments, the droplet’s initial position was consistently set at the optimal NP = 1, i.e., x0 = xopt = (Lc + r), while varying the droplet size in the range of 1 ≤ NS ≤ 9. The instantaneous speed of the droplet was measured during its optical transportation. Figure 9a presents these speed measurements as a function of the droplet’s relative location of (xx0). Aligning with our prior simulation results in Figure 6c, the experimental data confirmed that the largest Fx is generated for a droplet at NS = 5. Consistently, the droplet with this optimal size of ropt = 5Lc = 3.9 mm achieved the longest travel distance as ∆x = (x0xf) = 13.5 mm and the highest speed as 6.15 m/s, as indicated by the red curve in Figure 9a. Droplets deviating from this optimal size, whether larger or smaller than NS = 5, exhibited shorter travel distances and decreased peak speeds. To further corroborate our findings on the optimal droplet size, the same experiment was replicated but with the droplets positioned at a non-optimal location of NP = 0.5. As illustrated in Figure 9b, even at this non-optimal position, the droplet sized at ropt = 5Lc consistently demonstrated the longest travel distance and the highest speed, validating our simulation predictions.
Our study challenges the conventional understanding that DEP force is proportional to the cube of a particle’s radius, an approximation typically valid for particles significantly smaller than the characteristic length of the electric field [70,71]. In our case, the droplet size is comparable to the characteristic length, leading to the identification of an optimal size that maximizes the DEP force. For droplets larger than 5Lc, the light-induced field perturbation becomes more localized, resulting in a diminished DEP force.

5. Conclusions

This study successfully conducted an in-depth optimization analysis to enhance the ODEP performance in the FEOET system. A critical aspect of this study was the investigation of the position- and size-dependent effects on ODEP forces, aimed at identifying the optimal conditions for effective droplet manipulation. Our initial approach involved analyzing the light-induced conductivity switching performance of the FEOET device to determine the characteristic length (Lc) of the electric field, which corresponds to the peak field strength location. Utilizing 3D finite element simulations, we were able to calculate the ODEP force using the Maxwell stress tensor. This calculation integrated electric field strength across the surface of a spherical droplet, presenting the ODEP force as a function of both the droplet’s position and size relative to the characteristic length (Lc). The findings from these simulations indicated that the optimal droplet position for maximizing ODEP force is xopt = Lc + r. Furthermore, a size-dependent study revealed that the optimal droplet size for maximizing this force is ropt = 5Lc, where the light-induced field perturbation on the droplet is at its peak. To validate the findings from these simulations, we conducted a series of droplet dynamics experiments. These experiments demonstrated that a droplet sized at r = 5Lc achieved the longest travel distance (13.5 mm) and the highest speed (6.15 mm/s) when positioned at xopt = (Lc + r) = 6Lc. These experimental findings corroborated our simulation results, confirming that the optimal positioning and sizing of droplets are critical for maximizing light-actuated droplet transportation. This optimization study not only enhances our understanding of the position- and size-dependent factors that maximize ODEP force, but also underscores the potential of these findings in developing cost-effective, disposable, lab-on-a-chip (LOC) devices. The insights gained from this study are instrumental to advancing multiplexed biological and biochemical analyses, paving the way for more efficient and precise microfluidic applications.

Author Contributions

Conceptualization, S.-Y.P.; methodology, S.-Y.P.; validation, M.A.I. and S.-Y.P.; formal analysis, S.-Y.P.; investigation, M.A.I. and S.-Y.P.; resources, S.-Y.P.; data curation, M.A.I.; writing—original draft preparation, M.A.I.; writing—review and editing, S.-Y.P.; visualization, S.-Y.P.; supervision, S.-Y.P.; project administration, S.-Y.P.; and funding acquisition, S.-Y.P. All authors have read and agreed to the published version of the manuscript.

Funding

This work was supported by the NSF CAREER Award (ECCS-2046134), USA.

Data Availability Statement

Data is contained within the article.

Conflicts of Interest

The authors declare no conflicts of interest.

References

  1. Ding, Y.; Howes, P.D.; deMello, A.J. Recent Advances in Droplet Microfluidics. Anal. Chem. 2020, 92, 132–149. [Google Scholar] [CrossRef] [PubMed]
  2. Thio, S.K.; Park, S.-Y. A review of optoelectrowetting (OEW): From fundamentals to lab-on-a-smartphone (LOS) applications to environmental sensors. Lab Chip 2022, 22, 3987–4006. [Google Scholar] [CrossRef] [PubMed]
  3. Feng, H.; Zheng, T.; Li, M.; Wu, J.; Ji, H.; Zhang, J.; Zhao, W.; Guo, J. Droplet-based microfluidics systems in biomedical applications. Electrophoresis 2019, 40, 1580–1590. [Google Scholar] [CrossRef]
  4. Yu, L.; Chen, M.C.W.; Cheung, K.C. Droplet-based microfluidic system for multicellular tumor spheroid formation and anticancer drug testing. Lab Chip 2010, 10, 2424–2432. [Google Scholar] [CrossRef]
  5. Song, H.; Chen, D.L.; Ismagilov, R.F. Reactions in droplets in microfluidic channels. Angew. Chem. Int. Ed. Engl. 2006, 45, 7336–7356. [Google Scholar] [CrossRef] [PubMed]
  6. Preetam, S.; Nahak, B.K.; Patra, S.; Toncu, D.C.; Park, S.; Syväjärvi, M.; Orive, G.; Tiwari, A. Emergence of microfluidics for next generation biomedical devices. Biosens. Bioelectron. X 2022, 10, 100106. [Google Scholar] [CrossRef]
  7. Park, S.-Y.; Wu, T.-H.; Chen, Y.; Teitell, M.A.; Chiou, P.-Y. High-speed droplet generation on demand driven by pulse laser-induced cavitation. Lab Chip 2011, 11, 1010–1012. [Google Scholar] [CrossRef] [PubMed]
  8. deMello, A.J. Control and detection of chemical reactions in microfluidic systems. Nature 2006, 442, 394–402. [Google Scholar] [CrossRef]
  9. Bilitewski, U.; Genrich, M.; Kadow, S.; Mersal, G. Biochemical analysis with microfluidic systems. Anal. Bioanal. Chem. 2003, 377, 556–569. [Google Scholar] [CrossRef]
  10. Clausell-Tormos, J.; Lieber, D.; Baret, J.-C.; El-Harrak, A.; Miller, O.J.; Frenz, L.; Blouwolff, J.; Humphry, K.J.; Köster, S.; Duan, H.; et al. Droplet-Based Microfluidic Platforms for the Encapsulation and Screening of Mammalian Cells and Multicellular Organisms. Chem. Biol. 2008, 15, 427–437. [Google Scholar] [CrossRef]
  11. Park, S.-Y.; Chiou, P.-Y. Light-Driven Droplet Manipulation Technologies for Lab-on-a-Chip Applications. Adv. OptoElectron. 2011, 2011, 909174. [Google Scholar] [CrossRef]
  12. Moragues, T.; Arguijo, D.; Beneyton, T.; Modavi, C.; Simutis, K.; Abate, A.R.; Baret, J.-C.; deMello, A.J.; Densmore, D.; Griffiths, A.D. Droplet-based microfluidics. Nat. Rev. Methods Primers 2023, 3, 32. [Google Scholar] [CrossRef]
  13. Sohrabi, S.; Kassir, N.; Keshavarz Moraveji, M. Retraction: Droplet microfluidics: Fundamentals and its advanced applications. RSC Adv. 2022, 12, 34566. [Google Scholar] [CrossRef]
  14. Brouzes, E.; Medkova, M.; Savenelli, N.; Marran, D.; Twardowski, M.; Hutchison, J.B.; Rothberg, J.M.; Link, D.R.; Perrimon, N.; Samuels, M.L. Droplet microfluidic technology for single-cell high-throughput screening. Proc. Natl. Acad. Sci. USA 2009, 106, 14195–14200. [Google Scholar] [CrossRef]
  15. Wang, J. On-chip enzymatic assays. Electrophoresis 2002, 23, 713–718. [Google Scholar] [CrossRef]
  16. Bui, M.-P.N.; Li, C.A.; Han, K.N.; Choo, J.; Lee, E.K.; Seong, G.H. Enzyme Kinetic Measurements Using a Droplet-Based Microfluidic System with a Concentration Gradient. Anal. Chem. 2011, 83, 1603–1608. [Google Scholar] [CrossRef] [PubMed]
  17. Thio, S.K.; Bae, S.W.; Park, S.-Y. Lab on a smartphone (LOS): A smartphone-integrated, plasmonic-enhanced optoelectrowetting (OEW) platform for on-chip water quality monitoring through LAMP assays. Sens. Actuators B Chem. 2022, 358, 131543. [Google Scholar] [CrossRef]
  18. Dong, X.; Liu, L.; Tu, Y.; Zhang, J.; Miao, G.; Zhang, L.; Ge, S.; Xia, N.; Yu, D.; Qiu, X. Rapid PCR powered by microfluidics: A quick review under the background of COVID-19 pandemic. Trends Anal. Chem 2021, 143, 116377. [Google Scholar] [CrossRef]
  19. Pekin, D.; Skhiri, Y.; Baret, J.-C.; Le Corre, D.; Mazutis, L.; Ben Salem, C.; Millot, F.; El Harrak, A.; Hutchison, J.B.; Larson, J.W.; et al. Quantitative and sensitive detection of rare mutations using droplet-based microfluidics. Lab Chip 2011, 11, 2156–2166. [Google Scholar] [CrossRef]
  20. Liang, H.; Song, Y. Microfluidic Synthesis of Organics. In Microfluidics: Fundamental, Devices and Applications; John Wiley & Sons, Inc.: Hoboken, NJ, USA, 2018; pp. 351–374. [Google Scholar]
  21. Jaouhari, T.; Zhang, F.; Tassaing, T.; Fery-Forgues, S.; Aymonier, C.; Marre, S.; Erriguible, A. Process intensification for the synthesis of ultra-small organic nanoparticles with supercritical CO2 in a microfluidic system. Chem. Eng. J. 2020, 397, 125333. [Google Scholar] [CrossRef]
  22. Ji, J.; Zhao, Y.; Guo, L.; Liu, B.; Ji, C.; Yang, P. Interfacial organic synthesis in a simple droplet-based microfluidic system. Lab Chip 2012, 12, 1373–1377. [Google Scholar] [CrossRef]
  23. Qin, J.; Wang, Z.; Chen, Y.; Mo, S.; Liu, J. Thermocapillary flow-induced core release from double-emulsion droplets in microchannels. Droplet 2023, 2, 54. [Google Scholar] [CrossRef]
  24. Wang, J.-X.; Zhang, F.-Y.; Li, S.-Y.; Cheng, Y.-P.; Yan, W.-C.; Wang, F.; Xu, J.-L.; Sui, Y. Numerical Studies on the Controlled Thermocapillary Migration of a Sessile Droplet. Ind. Eng. Chem. Res. 2023, 62, 18792–18799. [Google Scholar] [CrossRef]
  25. Won, B.J.; Lee, W.; Song, S. Estimation of the thermocapillary force and its applications to precise droplet control on a microfluidic chip. Sci. Rep. 2017, 7, 3062. [Google Scholar] [CrossRef] [PubMed]
  26. Thio, S.K.; Bae, S.W.; Park, S.-Y. Plasmonic nanoparticle-enhanced optoelectrowetting (OEW) for effective light-driven droplet manipulation. Sens. Actuators B Chem. 2020, 308, 127704. [Google Scholar] [CrossRef]
  27. Li, J.; Kim, C.-J.C. Current commercialization status of electrowetting-on-dielectric (EWOD) digital microfluidics. Lab Chip 2020, 20, 1705–1712. [Google Scholar] [CrossRef] [PubMed]
  28. Thio, S.K.; Jiang, D.; Park, S.-Y. Electrowetting-driven solar indoor lighting (e-SIL): An optofluidic approach towards sustainable buildings. Lab Chip 2018, 18, 1725–1735. [Google Scholar] [CrossRef] [PubMed]
  29. Li, Y.; Dalton, C.; Crabtree, H.J.; Nilsson, G.; Kaler, K.V.I.S. Continuous dielectrophoretic cell separation microfluidic device. Lab Chip 2007, 7, 239–248. [Google Scholar] [CrossRef]
  30. Zhang, Y.; Chen, X. Dielectrophoretic microfluidic device for separation of red blood cells and platelets: A model-based study. J. Braz. Soc. Mech. Sci. Eng. 2020, 42, 89. [Google Scholar] [CrossRef]
  31. Kwizera, E.A.; Sun, M.; White, A.M.; Li, J.; He, X. Methods of Generating Dielectrophoretic Force for Microfluidic Manipulation of Bioparticles. ACS Biomater. Sci. Eng. 2021, 7, 2043–2063. [Google Scholar] [CrossRef]
  32. Namgung, B.; Lee, T.; Tan, J.K.S.; Poh, D.K.H.; Park, S.; Chng, K.Z.; Agrawal, R.; Park, S.-Y.; Leo, H.L.; Kim, S. Vibration motor-integrated low-cost, miniaturized system for rapid quantification of red blood cell aggregation. Lab Chip 2020, 20, 3930–3937. [Google Scholar] [CrossRef] [PubMed]
  33. Kim, W.; Cha, B.; Jeon, J.S.; Park, J. Acoustofluidic control of chemical concentration within picoliter droplets in a disposable microfluidic chip. Sens. Actuators B Chem. 2023, 393, 134132. [Google Scholar] [CrossRef]
  34. Jung, J.H.; Destgeer, G.; Ha, B.; Park, J.; Sung, H.J. On-demand droplet splitting using surface acoustic waves. Lab Chip 2016, 16, 3235–3243. [Google Scholar] [CrossRef] [PubMed]
  35. Kim, T.; Kim, J.; Kang, J.W.; Kwon, S.B.; Hong, J. Compact Three-Dimensional Digital Microfluidic Platforms with Programmable Contact Charge Electrophoresis Actuation. Langmuir 2022, 38, 5759–5764. [Google Scholar] [CrossRef] [PubMed]
  36. Bishop, K.J.M.; Drews, A.M.; Cartier, C.A.; Pandey, S.; Dou, Y. Contact Charge Electrophoresis: Fundamentals and Microfluidic Applications. Langmuir 2018, 34, 6315–6327. [Google Scholar] [CrossRef]
  37. Chen, Q.; Yuan, Y.J. A review of polystyrene bead manipulation by dielectrophoresis. RSC Adv. 2019, 9, 4963–4981. [Google Scholar] [CrossRef]
  38. Barik, A.; Zhang, Y.; Grassi, R.; Nadappuram, B.P.; Edel, J.B.; Low, T.; Koester, S.J.; Oh, S.-H. Graphene-edge dielectrophoretic tweezers for trapping of biomolecules. Nat. Commun. 2017, 8, 1867. [Google Scholar] [CrossRef]
  39. Waheed, W.; Alazzam, A.; Al-Khateeb, A.N.; Abu-Nada, E. Multiple Particle Manipulation under Dielectrophoresis Effect: Modeling and Experiments. Langmuir 2020, 36, 3016–3028. [Google Scholar] [CrossRef]
  40. Manaresi, N.; Romani, A.; Medoro, G.; Altomare, L.; Leonardi, A.; Tartagni, M.; Guerrieri, R. A CMOS chip for individual cell manipulation and detection. IEEE J. Solid-State Circuits 2003, 38, 2297–2305. [Google Scholar] [CrossRef]
  41. Park, S.-Y.; Teitell, M.A.; Chiou, E.P.Y. Single-sided continuous optoelectrowetting (SCOEW) for droplet manipulation with light patterns. Lab Chip 2010, 10, 1655–1661. [Google Scholar] [CrossRef]
  42. Jamshidi, A.; Pauzauskie, P.J.; Schuck, P.J.; Ohta, A.T.; Chiou, P.-Y.; Chou, J.; Yang, P.; Wu, M.C. Dynamic manipulation and separation of individual semiconducting and metallic nanowires. Nat. Photonics 2008, 2, 86–89. [Google Scholar] [CrossRef]
  43. Chiou, P.Y.; Ohta, A.T.; Wu, M.C. Massively parallel manipulation of single microparticles using optical images. Nature 2005, 463, 370–372. [Google Scholar] [CrossRef]
  44. Hsu, H.-y.; Ohta, A.T.; Chiou, P.-Y.; Jamshidi, A.; Neale, S.L.; Wu, M.C. Phototransistor-based optoelectronic tweezers for dynamic cell manipulation in cell culture media. Lab Chip 2010, 10, 165–172. [Google Scholar] [CrossRef]
  45. Valley, J.K.; NingPei, S.; Jamshidi, A.; Hsu, H.-Y.; Wu, M.C. A unified platform for optoelectrowetting and optoelectronic tweezers. Lab Chip 2011, 11, 1292–1297. [Google Scholar] [CrossRef] [PubMed]
  46. Lee, S.; Thio, S.; Park, S.-Y.; Bae, S. An automated 3D-printed smartphone platform integrated with optoelectrowetting (OEW) microfluidic chip for on-chip monitoring of viable algae in water. Harmful Algae 2019, 88, 101638. [Google Scholar] [CrossRef]
  47. Baroud, C.N.; Gallaire, F.; Dangla, R. Dynamics of microfluidic droplets. Lab Chip 2010, 10, 2023–2045. [Google Scholar] [CrossRef]
  48. Park, S.-Y.; Pan, C.; Wu, T.-H.; Kloss, C.; Kalim, S.; Callahan, C.E.; Teitell, M.; Chiou, E.P.Y. Floating electrode optoelectronic tweezers: Light-driven dielectrophoretic droplet manipulation in electrically insulating oil medium. Appl. Phys. Lett. 2008, 92, 151101. [Google Scholar] [CrossRef] [PubMed]
  49. Park, S.-Y.; Kalim, S.; Callahan, C.; Teitell, M.A.; Chiou, E.P.Y. A light-induced dielectrophoretic droplet manipulation platform. Lab Chip 2009, 9, 3228–3235. [Google Scholar] [CrossRef]
  50. Thio, S.K.; Park, S.-Y. Optical Dielectrophoretic (DEP) Manipulation of Oil-Immersed Aqueous Droplets on a Plasmonic-Enhanced Photoconductive Surface. Micromachines 2022, 13, 112. [Google Scholar] [CrossRef] [PubMed]
  51. Chou, W.-P.; Wang, H.-M.; Chang, J.-H.; Chiu, T.-K.; Hsieh, C.-H.; Liao, C.-J.; Wu, M.-H. The utilization of optically-induced-dielectrophoresis (ODEP)-based virtual cell filters in a microfluidic system for continuous isolation and purification of circulating tumour cells (CTCs) based on their size characteristics. Sens. Actuators B Chem. 2017, 241, 245–254. [Google Scholar] [CrossRef]
  52. Huang, S.-B.; Chen, J.; Wang, J.; Yang, C.-L.; Wu, M.-H. A New Optically-Induced Dielectrophoretic (ODEP) Force-Based Scheme for Effective Cell Sorting. Int. J. Electrochem. Sci. 2012, 7, 12656–12667. [Google Scholar] [CrossRef]
  53. Chiu, T.-K.; Chou, W.-P.; Huang, S.-B.; Wang, H.-M.; Lin, Y.-C.; Hsieh, C.-H.; Wu, M.-H. Application of optically-induced-dielectrophoresis in microfluidic system for purification of circulating tumour cells for gene expression analysis—Cancer cell line model. Sci. Rep. 2016, 6, 32851. [Google Scholar] [CrossRef]
  54. Yang, S.-M.; Yu, T.-M.; Huang, H.-P.; Ku, M.-Y.; Tseng, S.-Y.; Tsai, C.-L.; Chen, H.-P.; Hsu, L.; Liu, C.-H. Light-driven manipulation of picobubbles on a titanium oxide phthalocyanine-based optoelectronic chip. Appl. Phys. Lett. 2011, 98, 153512. [Google Scholar] [CrossRef]
  55. Wang, W.-B.; Li, X.-g.; Wang, S.-r.; Hou, W. The preparation of high photosensitive TiOPc. Dye. Pigment. 2007, 72, 38–41. [Google Scholar] [CrossRef]
  56. Bo, Z.; Yang, Y.; Chen, J.; Yu, K.; Yan, J.; Cen, K. Plasma-enhanced chemical vapor deposition synthesis of vertically oriented graphene nanosheets. Nanoscale 2013, 5, 5180–5204. [Google Scholar] [CrossRef] [PubMed]
  57. Raiford, J.A.; Oyakhire, S.T.; Bent, S.F. Applications of atomic layer deposition and chemical vapor deposition for perovskite solar cells. Energy Environ. Sci. 2020, 13, 1997–2023. [Google Scholar] [CrossRef]
  58. Chiou, P.Y.; Park, S.-Y.; Wu, M.C. Continuous optoelectrowetting for picoliter droplet manipulation. Appl. Phys. Lett. 2008, 93, 221110. [Google Scholar] [CrossRef]
  59. Jiang, D.; Park, S.-Y. Light-driven 3D droplet manipulation on flexible optoelectrowetting devices fabricated by a simple spin-coating method. Lab Chip 2016, 16, 1831–1839. [Google Scholar] [CrossRef]
  60. Bartelt, J.A.; Beiley, Z.M.; Hoke, E.T.; Mateker, W.R.; Douglas, J.D.; Collins, B.A.; Tumbleston, J.R.; Graham, K.R.; Amassian, A.; Ade, H.; et al. The Importance of Fullerene Percolation in the Mixed Regions of Polymer–Fullerene Bulk Heterojunction Solar Cells. Adv. Energy Mater. 2013, 3, 364–374. [Google Scholar] [CrossRef]
  61. Uddin, A.; Yang, X. Surface Plasmonic Effects on Organic Solar Cells. J. Nanosci. Nanotechnol. 2014, 14, 1099–1119. [Google Scholar] [CrossRef]
  62. Afify, H.A.; El-Nahass, M.M.; Gadallah, A.S.; Atta Khedr, M. Carrier transport mechanisms and photodetector characteristics of Ag/TiOPc/p-Si/Al hybrid heterojunction. Mater. Sci. Semicond. Process. 2015, 39, 324–331. [Google Scholar] [CrossRef]
  63. Li, X.; Carey, J.E.; Sickler, J.W.; Pralle, M.U.; Palsule, C.; Vineis, C.J. Silicon photodiodes with high photoconductive gain at room temperature. Opt. Express 2012, 20, 5518–5523. [Google Scholar] [CrossRef]
  64. Wang, L.; Hasanzadeh Kafshgari, M.; Meunier, M. Optical Properties and Applications of Plasmonic-Metal Nanoparticles. Adv. Funct. Mater. 2020, 30, 2005400. [Google Scholar] [CrossRef]
  65. Pethig, R. Review article-dielectrophoresis: Status of the theory, technology, and applications. Biomicrofluidics 2010, 4, 022811. [Google Scholar] [CrossRef]
  66. Kadaksham, A.T.J.; Singh, P.; Aubry, N. Dielectrophoresis of nanoparticles. Electrophoresis 2004, 25, 3625–3632. [Google Scholar] [CrossRef]
  67. Abd Rahman, N.; Ibrahim, F.; Yafouz, B. Dielectrophoresis for Biomedical Sciences Applications: A Review. Sensors 2017, 17, 449. [Google Scholar] [CrossRef] [PubMed]
  68. Wang, X.; Wang, X.-B.; Gascoyne, P.R.C. General expressions for dielectrophoretic force and electrorotational torque derived using the Maxwell stress tensor method. J. Electrost. 1997, 39, 277–295. [Google Scholar] [CrossRef]
  69. Al-Jarro, A.; Paul, J.; Thomas, D.W.P.; Crowe, J.; Sawyer, N.; Rose, F.R.A.; Shakesheff, K.M. Direct calculation of Maxwell stress tensor for accurate trajectory prediction during DEP for 2D and 3D structures. J. Phys. D Appl. Phys. 2007, 40, 71. [Google Scholar] [CrossRef]
  70. Çetin, B.; Li, D. Dielectrophoresis in microfluidics technology. Electrophoresis 2011, 32, 2410–2427. [Google Scholar] [CrossRef] [PubMed]
  71. Lapizco-Encinas, B.H.; Rito-Palomares, M. Dielectrophoresis for the manipulation of nanobioparticles. Electrophoresis 2007, 28, 4521–4538. [Google Scholar] [CrossRef]
Figure 1. A schematic illustration of the FEOET device. (a) The device consists of a 20 µm TiOPc layer coated with a 1.8 µm nanoparticle layer, on top of which an open PDMS chamber with a 25 µm thickness is placed to house an aqueous droplet surrounded by an oil medium. (b) Due to the TiOPc’s poor photoconductive properties, only a small portion of the input rays can be absorbed in the TiOPc layer. As indicated by the arrows, most of the rays just pass through it before making a contribution to its photo-state conductivity, resulting in poor ODEP performance. (c) To enhance light absorption of the TiOPc layer, plasmonic nanoparticles were used as light scattering elements above the TiOPc layer. With the presence of metal nanoparticles, the transmitted rays (which did not previously contribute to the photo-state conductivity) underwent plasmonic light scattering. They were then re-directed onto the TiOPc layer with increased optical path lengths to effectively enlarge light absorption onto the TiOPc layer. As a result, its photo-state conductivity was greatly enhanced in the light-illuminated area, while its dark-state conductivity did not undergo much modification in the area illuminated by the dark pattern. The conductivity switching capability of the TiOPc is significantly enlarged, leading to larger ODEP forces.
Micromachines 15 00119 g001
Figure 2. 3D numerical simulation results showing (a) a cross-sectional view of the electric field distribution created by the illumination of a Gaussian laser beam and (b) the electric field strength data extracted at various z-directional locations. At the surface right above the PDMS layer (i.e., z = 0), the field strength greatly decreases in the middle of the illuminated area, while it is strongly enhanced around the edges of the illumination. The field strength peaks as E = 1.04 × 10⁵ V/m at x = ±0.78 mm away from the center of the light illumination. This location of the peaked field is defined as a characteristic length of Lc = 0.78 mm for the following optimization studies. As further increasing z-directional locations, the field gradient dramatically decreases.
Micromachines 15 00119 g002
Figure 3. 3D numerical simulation results showing cross-sectional views of the electric field distributions around an aqueous droplet suspended in an oil medium (a) without and (b) with the illumination of a Gaussian laser beam. The bottom two plots clearly show the significant difference in the field distributions created on the droplet’s surface without and with the light illumination at the left edge of the droplet.
Micromachines 15 00119 g003
Figure 4. Droplet’s position-dependent DEP force. For simulation, the droplet radius was fixed as r = Lc. An x-directional DEP force (Fx) was estimated while varying its position (x0) away from the center of the light illumination, as indicated by the arrow in an inset image. At x0 = 0, the field distribution is symmetric and balanced around the droplet, resulting in Fx = 0. As its position is away from the light illumination, the force increases and reaches its peak at Fx = 2.21 nN at x0 = (Lc + r) = 1.56 mm. Then, the force decreases to zero as the droplet is positioned far away.
Micromachines 15 00119 g004
Figure 5. Effects of the droplet’s position and size on the DEP force. An x-directional DEP force (Fx) was estimated for the droplet varied with its position and size. No matter the droplet size, a position-dependent force shows the trend increasing, being peaked, and decreasing. A size-dependent study presents the existence of the optimum droplet size as r = 5Lc for which Fx can be maximized as high as 15.89 nN. This maximum value in Fx decreases for both smaller and larger sizes of the droplet than r = 5Lc.
Micromachines 15 00119 g005
Figure 6. A light-induced DEP force presented as a function of the normalized position (NP) and the normalized size (NS) of the droplet. (a) An x-directional DEP force (Fx) presented as a function of the normalized position (NP) of the droplet. At NP = 0 (i.e., x = 0), the field distribution is symmetric and balanced around the droplet, regardless of its size, leading to Fx = 0. An increasing trend is shown for Fx with the NP. The peaked force is obtained at NP = 1. When NP > 1, a decreasing trend in Fx is observed. (b) A schematic illustration shows the optimum position of the droplet given as xopt = Lc + r when one edge of the droplet aligns with the characteristic length of Lc, leading to the largest Fx. (c) Fx was presented as a function of the normalized size (NS) of the droplet. Fx rapidly increases when NS < 5. Then, the peaked Fx was obtained at NS = 5, no matter what the NP values are. Thus, the optimum size of the droplet can be found as ropt = 5Lc for which the light-induced field perturbation can be maximized to lead to the largest Fx. For NS > 5, a decreasing trend is observed for Fx.
Micromachines 15 00119 g006
Figure 7. Video snapshots of the ODEP-driven droplet transportation. A dye-added water droplet was initially positioned at x0 = (Lc + r) = 4.68 mm away from the center of the light illumination. (a) A bias voltage was applied between two electrodes patterned on both edges of the device, but no droplet actuation was induced without the light illumination. (b) When a laser beam was projected at the edge of the droplet, it was optically actuated to move away from the light illumination as indicated by the red arrow. (c) At t = 1.8s, the droplet reaches its highest speed of 6.15 mm/s. (d) Its transportation was completed at its final position of xf = 18.18 mm.
Micromachines 15 00119 g007
Figure 8. A position-dependent experimental study for the droplet whose size was fixed as (a) r = 5Lc and (b) r = Lc. A light-actuated droplet dynamics study was carried out while its initial position (x0) was variously tuned from 4Lc to 8Lc away from the center of the light illumination. For both cases, the longest transportation distance and the highest speed were obtained for the droplet when it was initially positioned at NP = 1. This observation therefore indicates the optimal position is given as xopt = (Lc + r), at which the largest Fx can be accomplished.
Micromachines 15 00119 g008
Figure 9. A size-dependent experimental study in which the droplet is initially located at (a) the optimal position of NP = 1 and (b) the non-optimum position of NP = 0.5. A light-actuated droplet dynamics study was carried out while its normalized size (NS) was variously tuned. For both cases, the longest transportation distance and the highest speed were obtained for the droplet when it was initially positioned at NP = 1. This observation therefore indicates the optimum position is given as xopt = (Lc + r), at which the largest Fx can be accomplished.
Micromachines 15 00119 g009
Disclaimer/Publisher’s Note: The statements, opinions and data contained in all publications are solely those of the individual author(s) and contributor(s) and not of MDPI and/or the editor(s). MDPI and/or the editor(s) disclaim responsibility for any injury to people or property resulting from any ideas, methods, instructions or products referred to in the content.

