
A 3D-Printed Piezoelectric Microdevice for Human Energy Harvesting for Wearable Biosensors

Abstract
1. Introduction
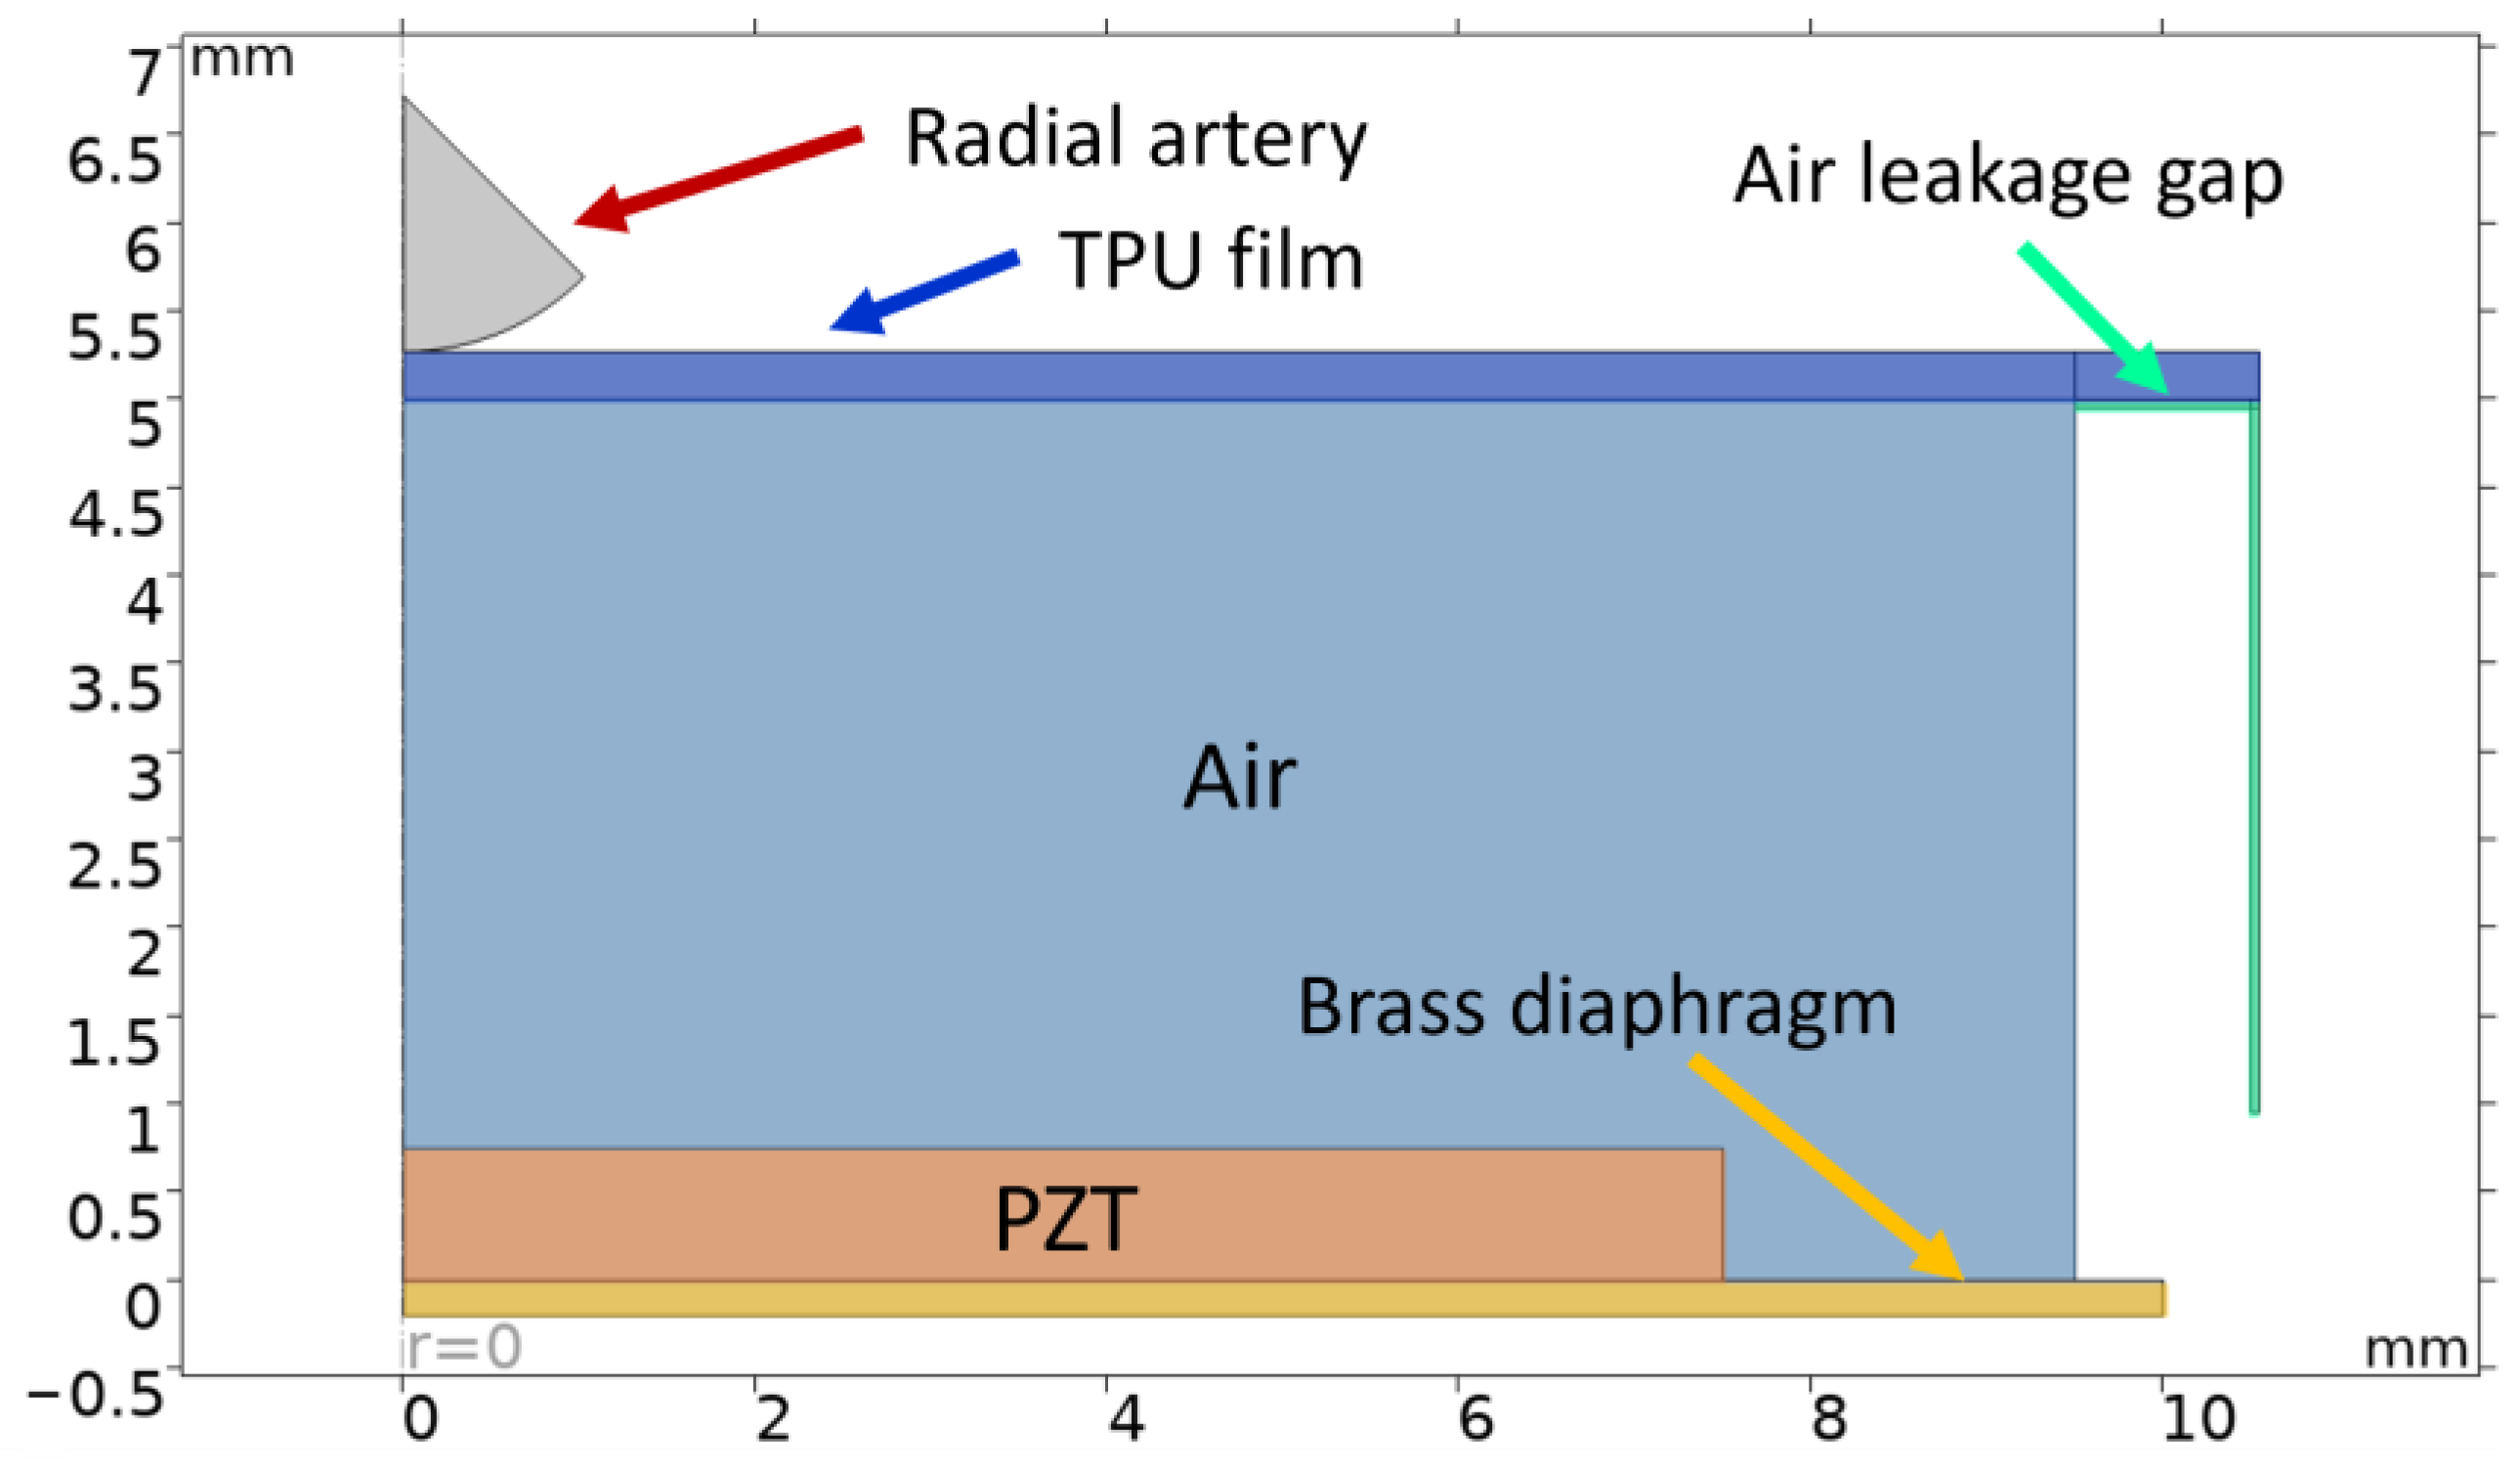
2. Simulations
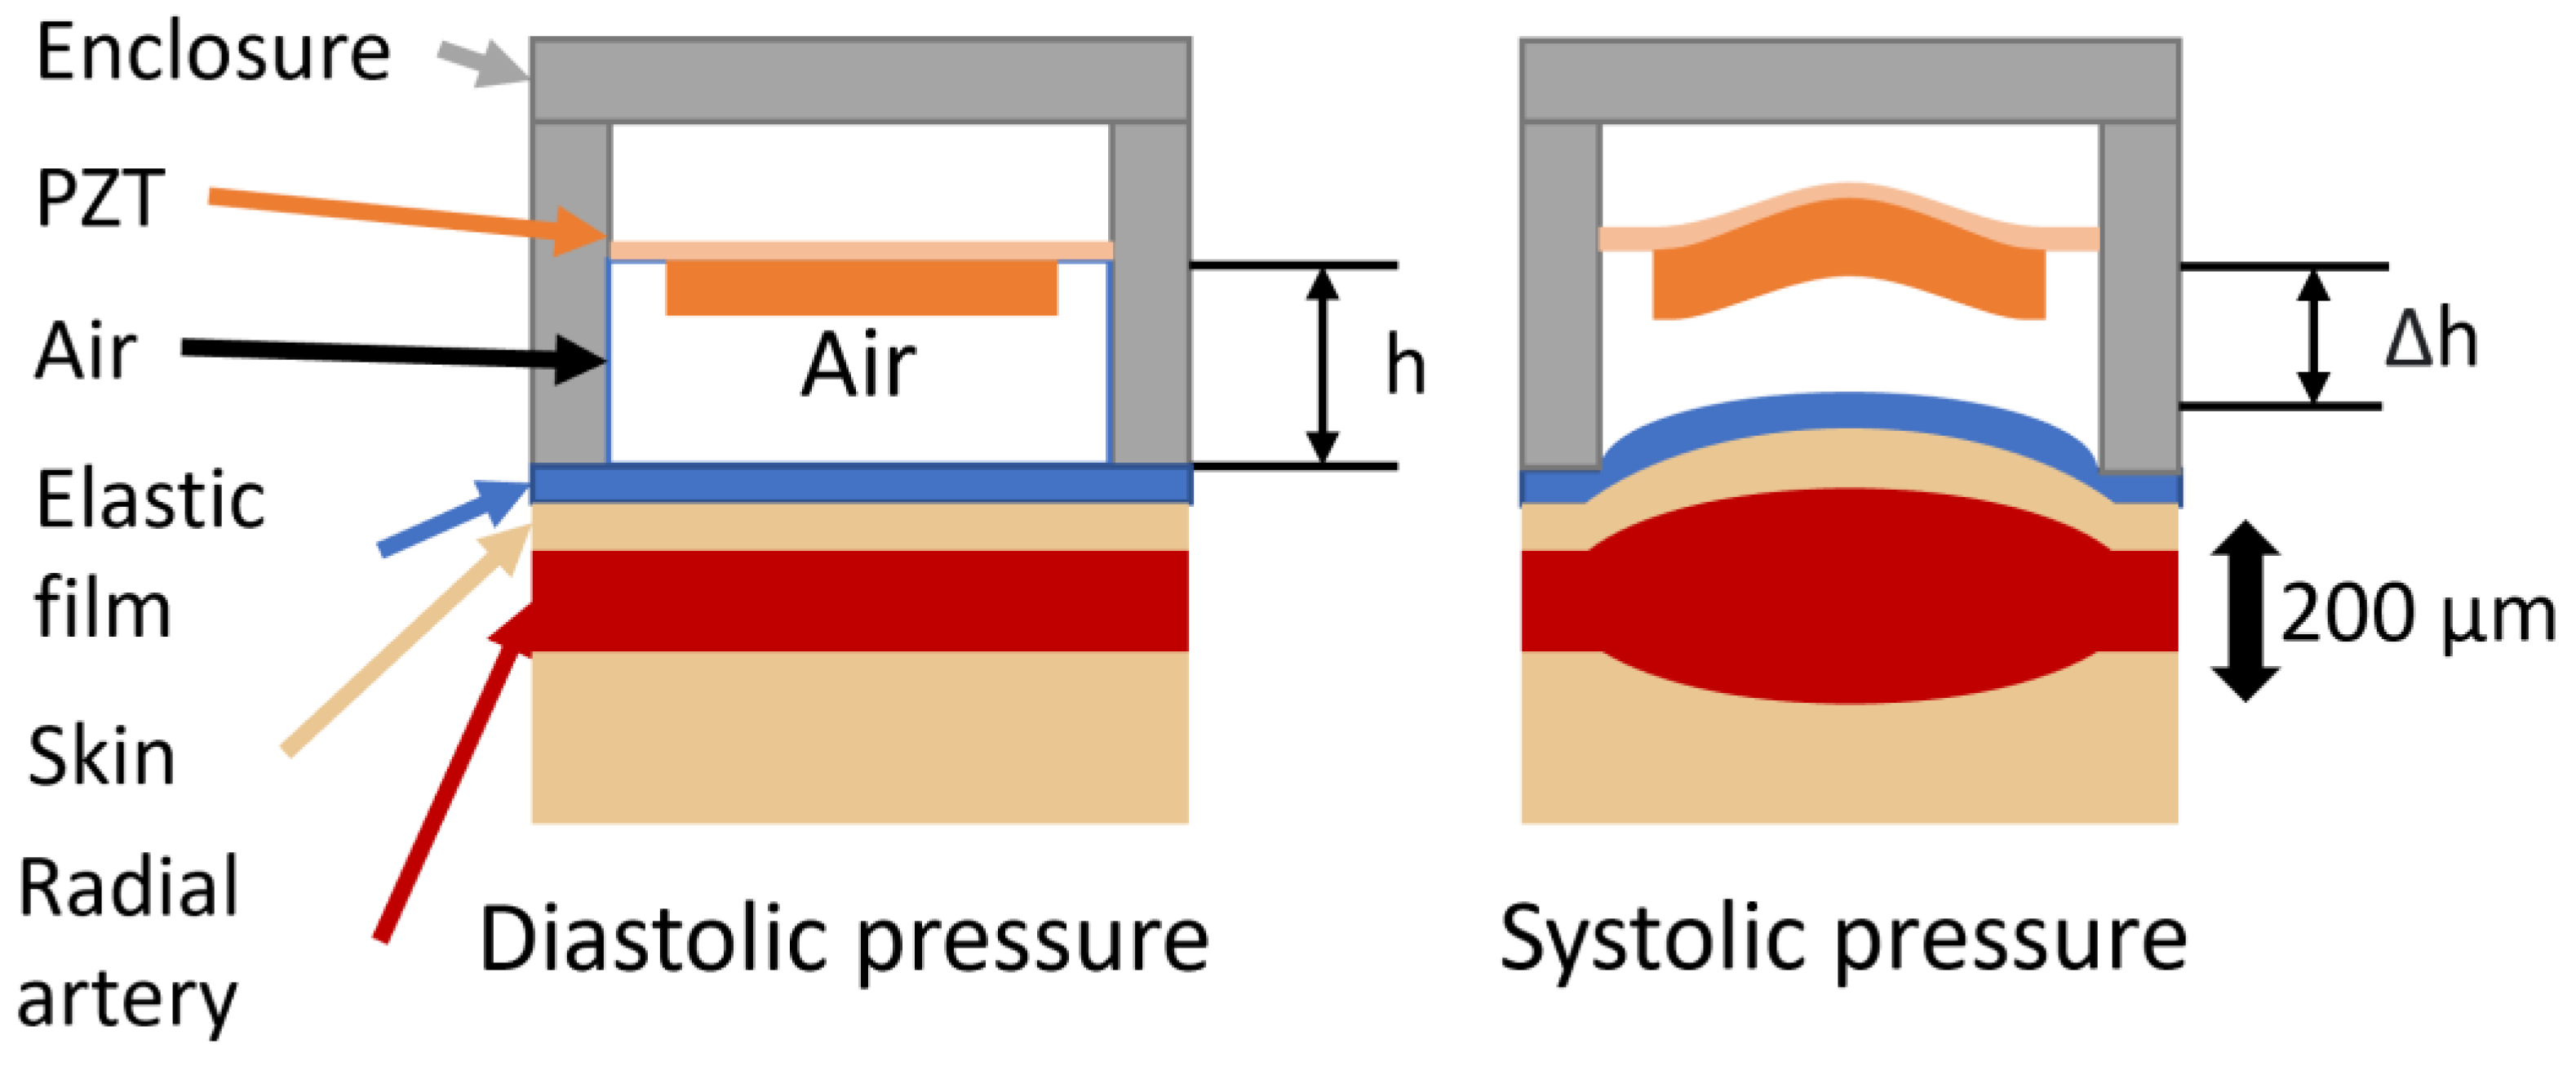
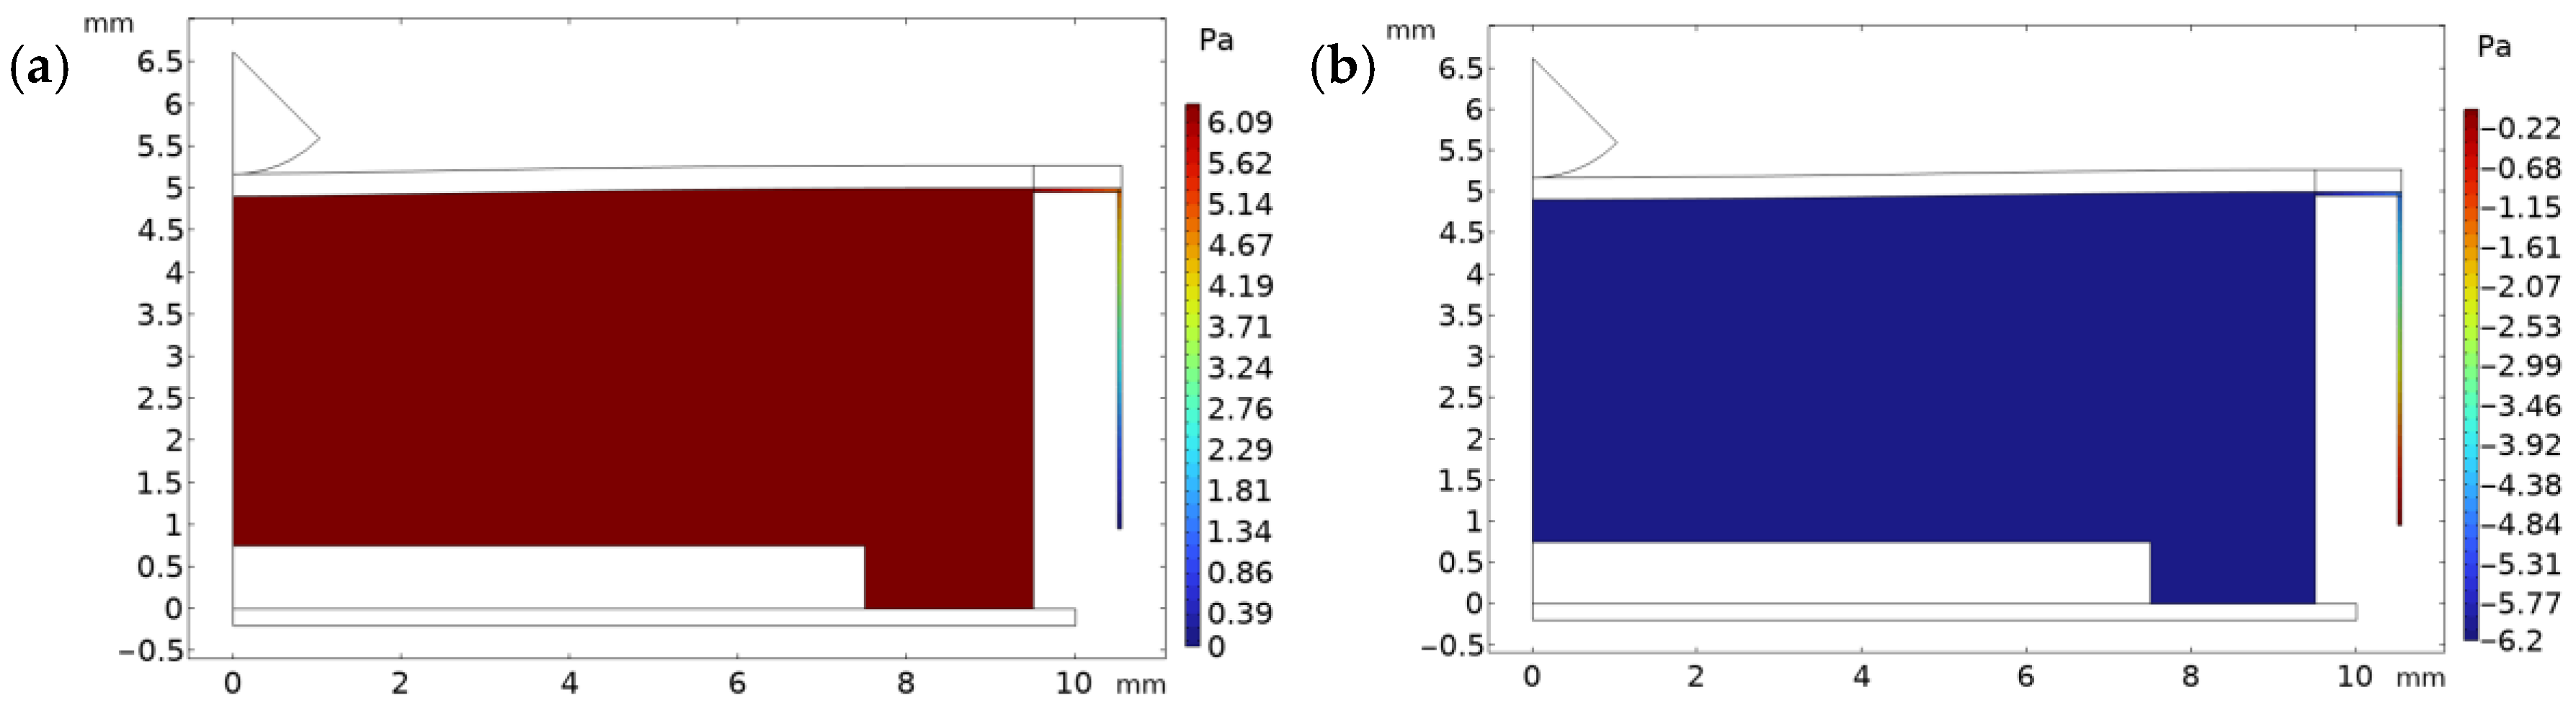
Working Principle of the Harvester
- -
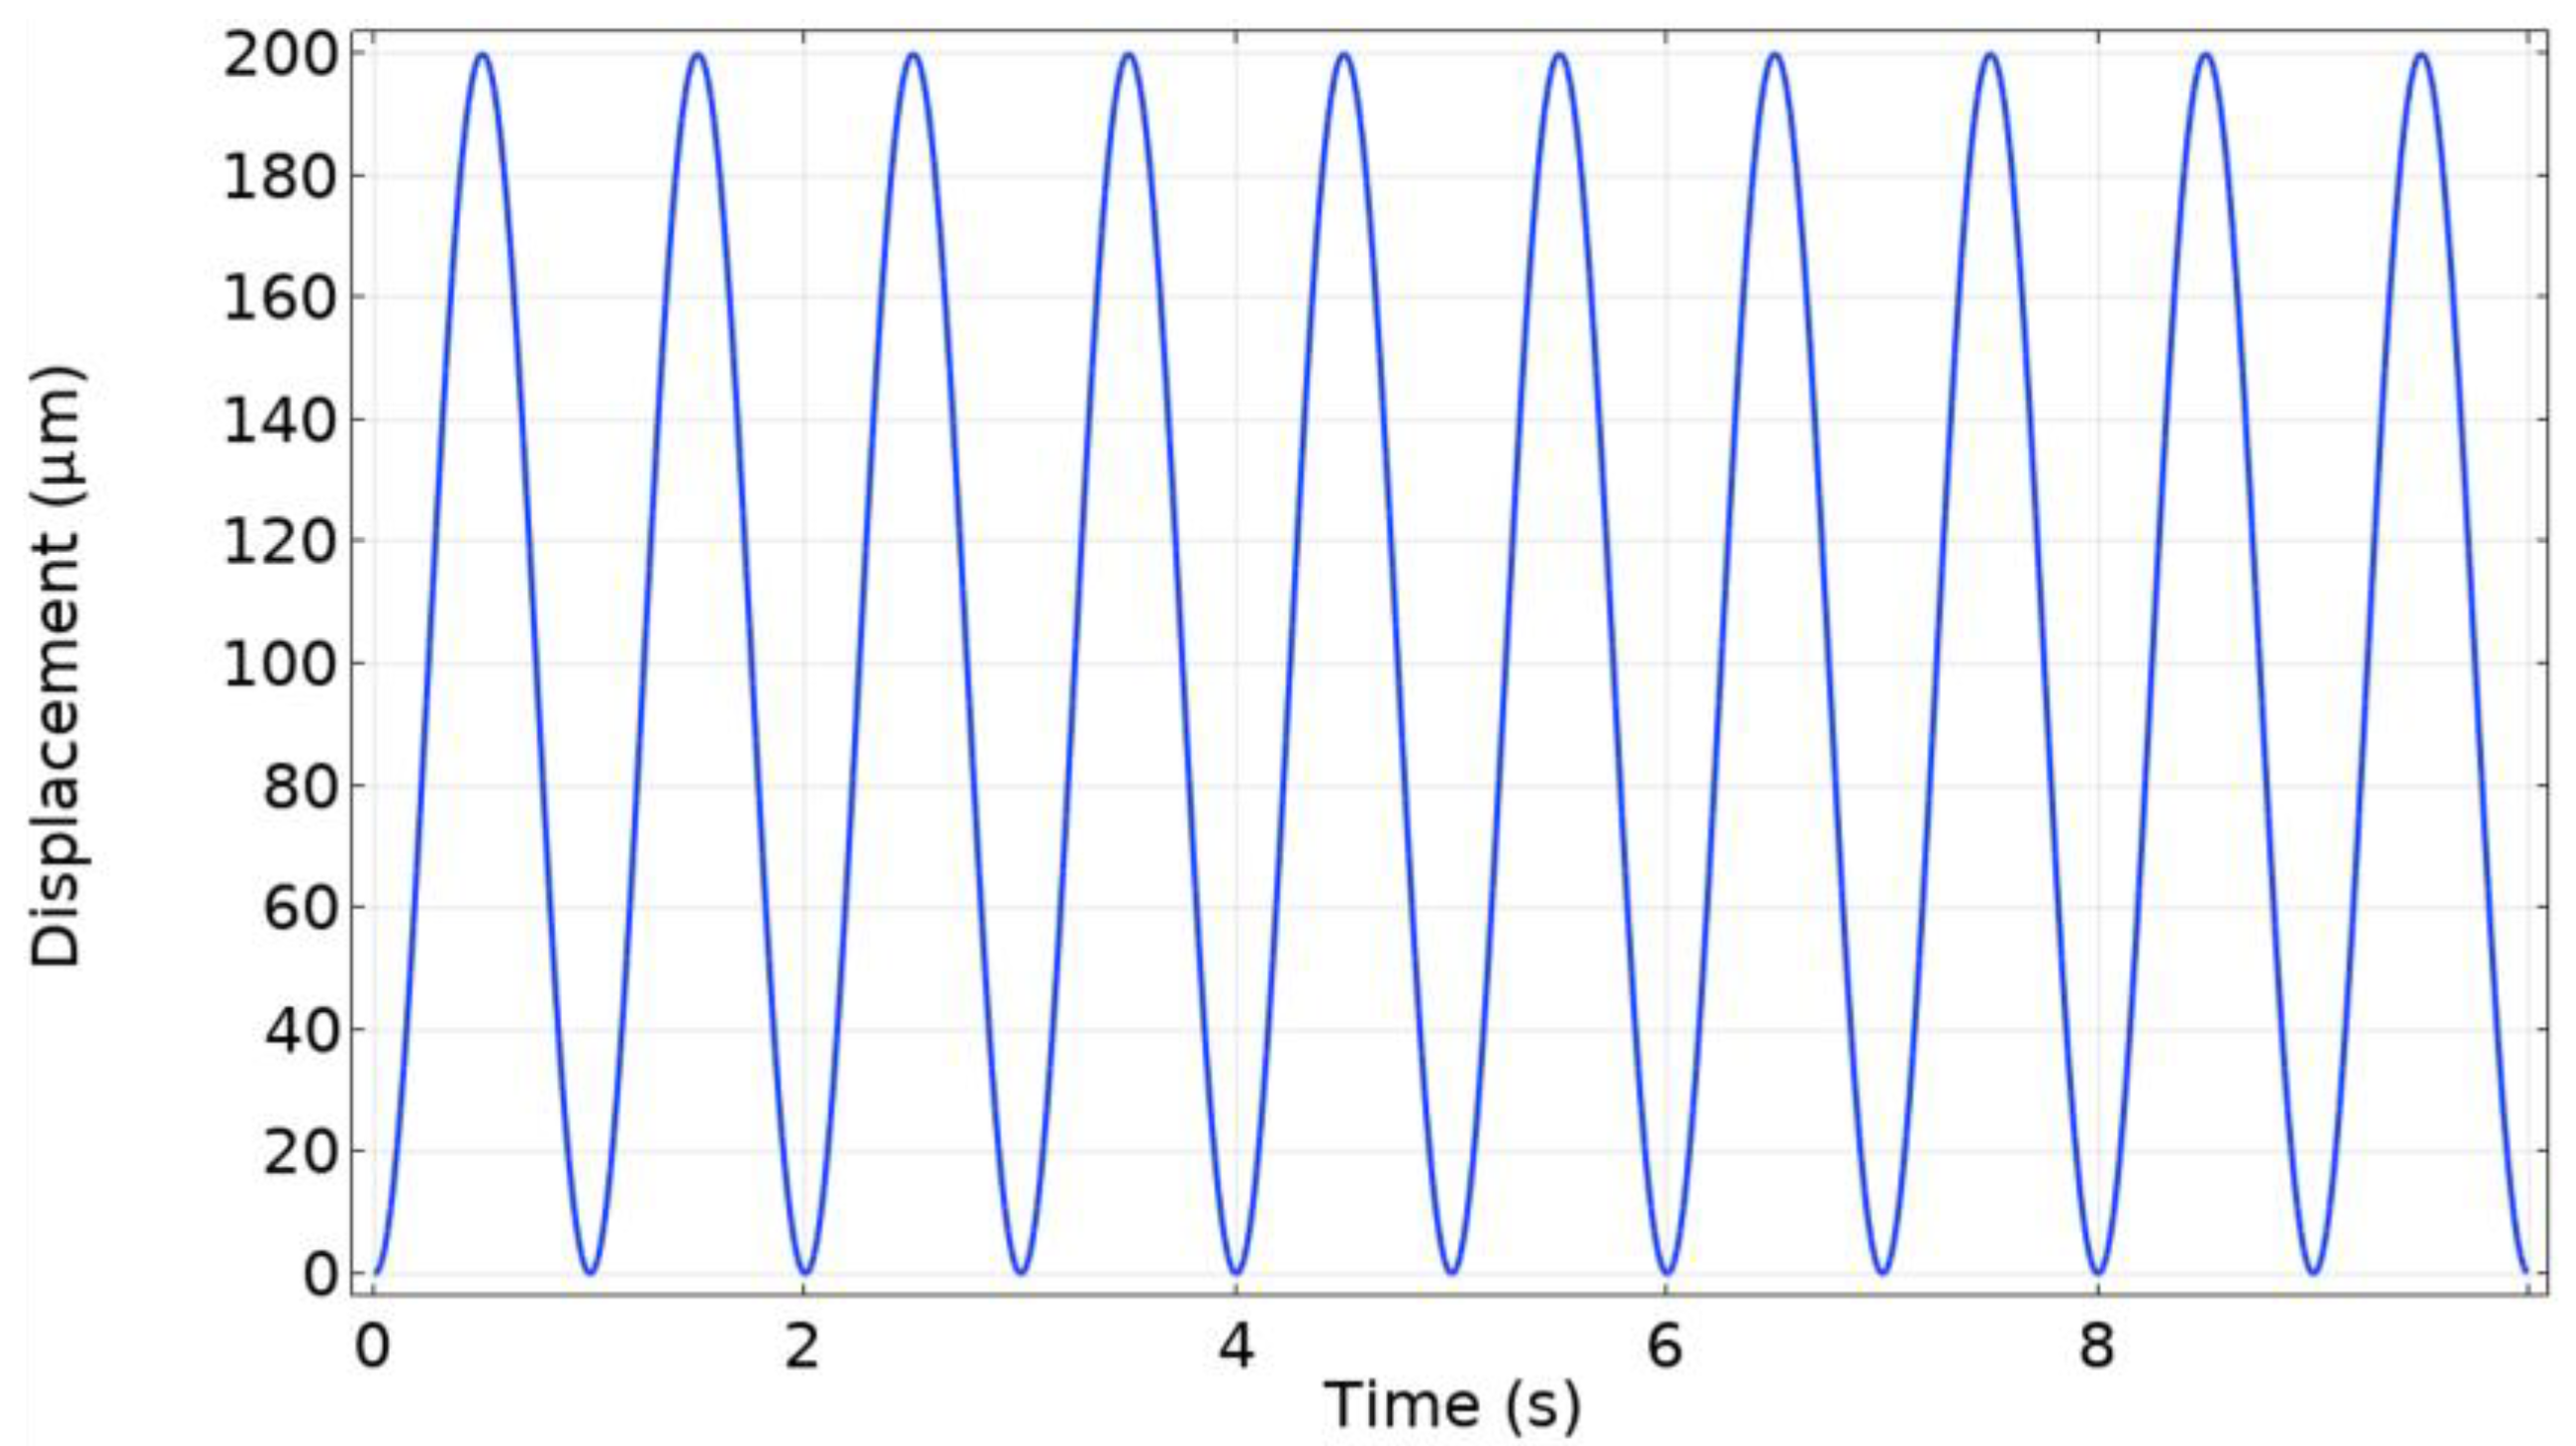
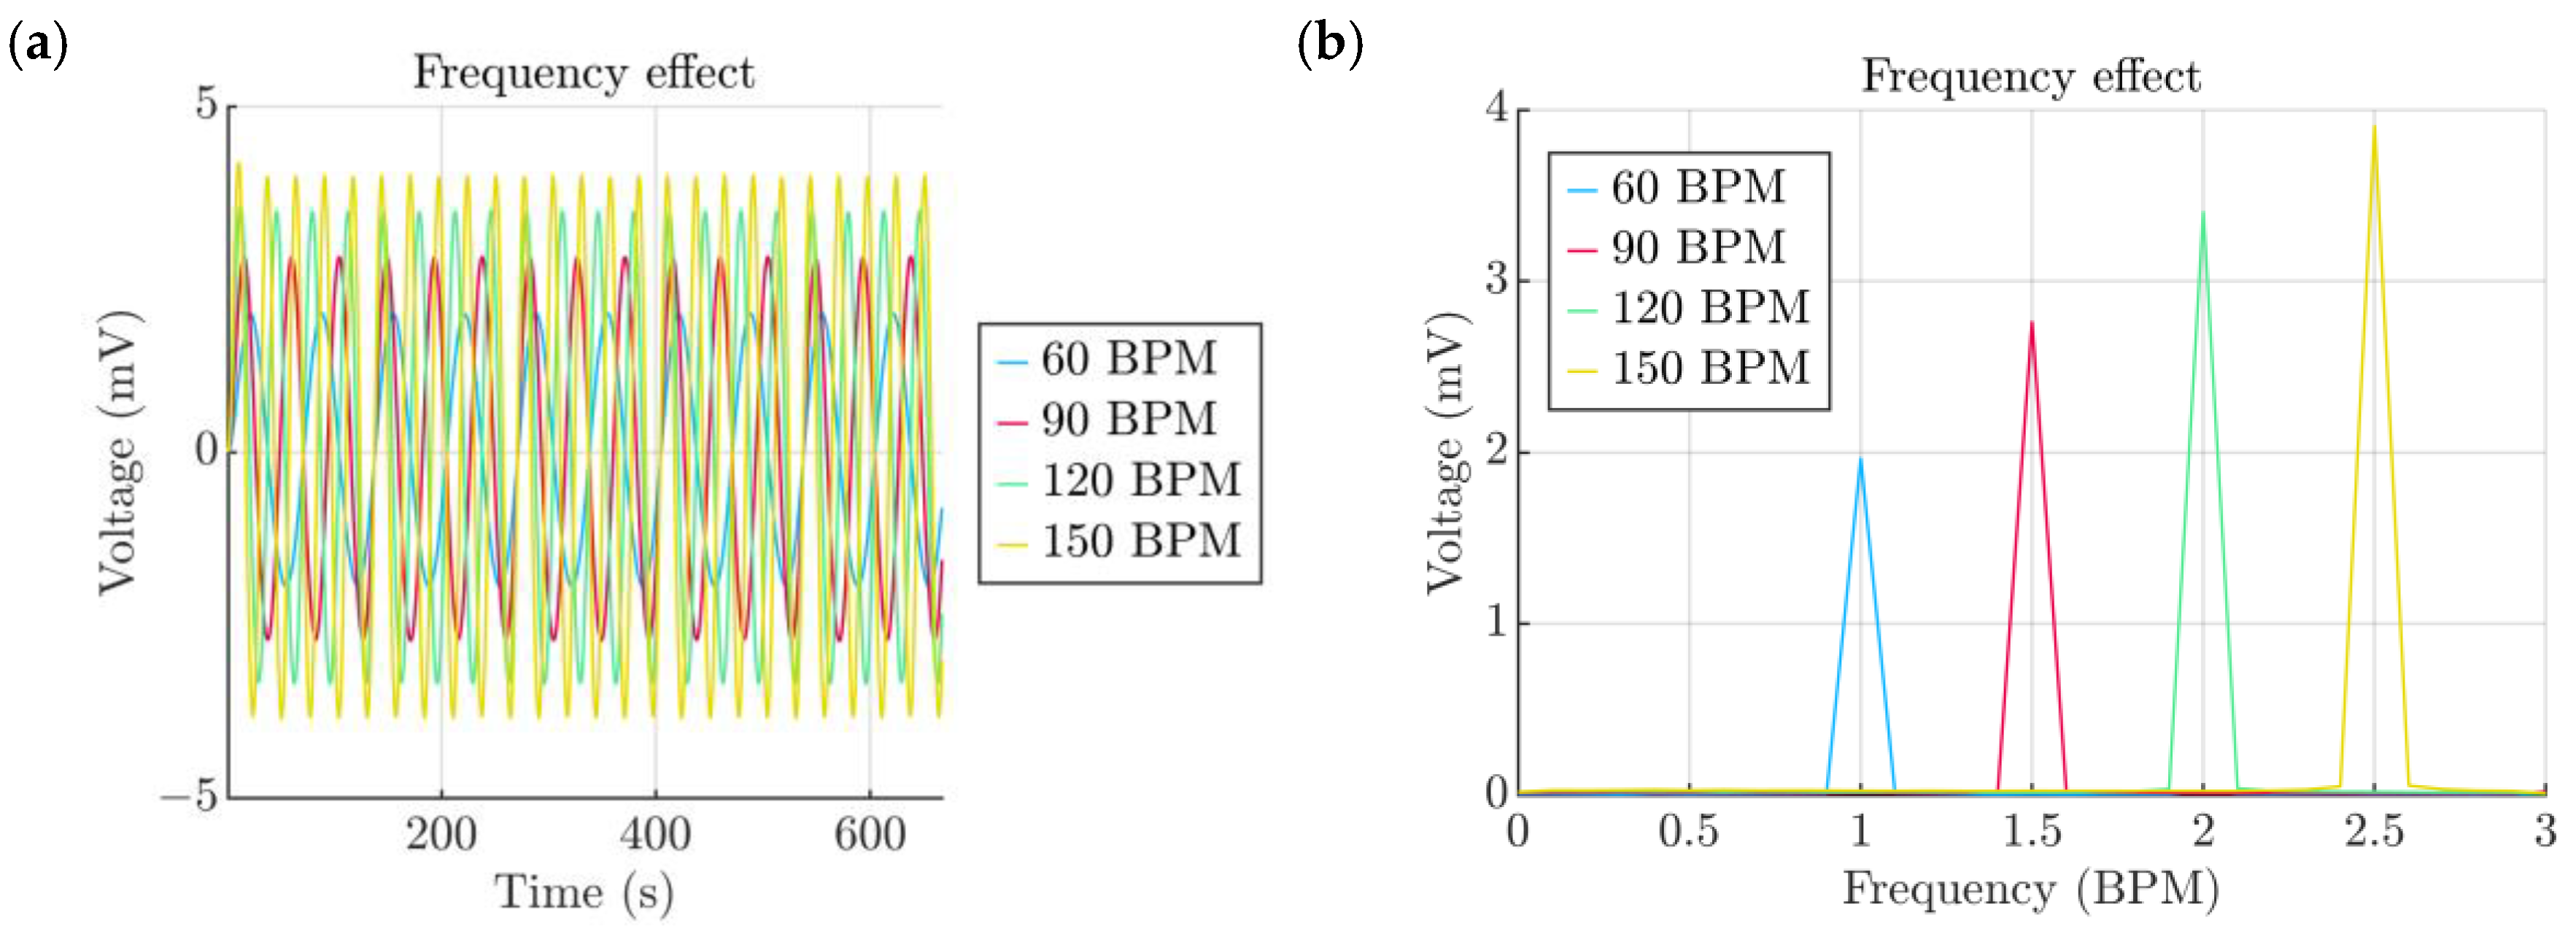
- Frequency of the pulsations
- -
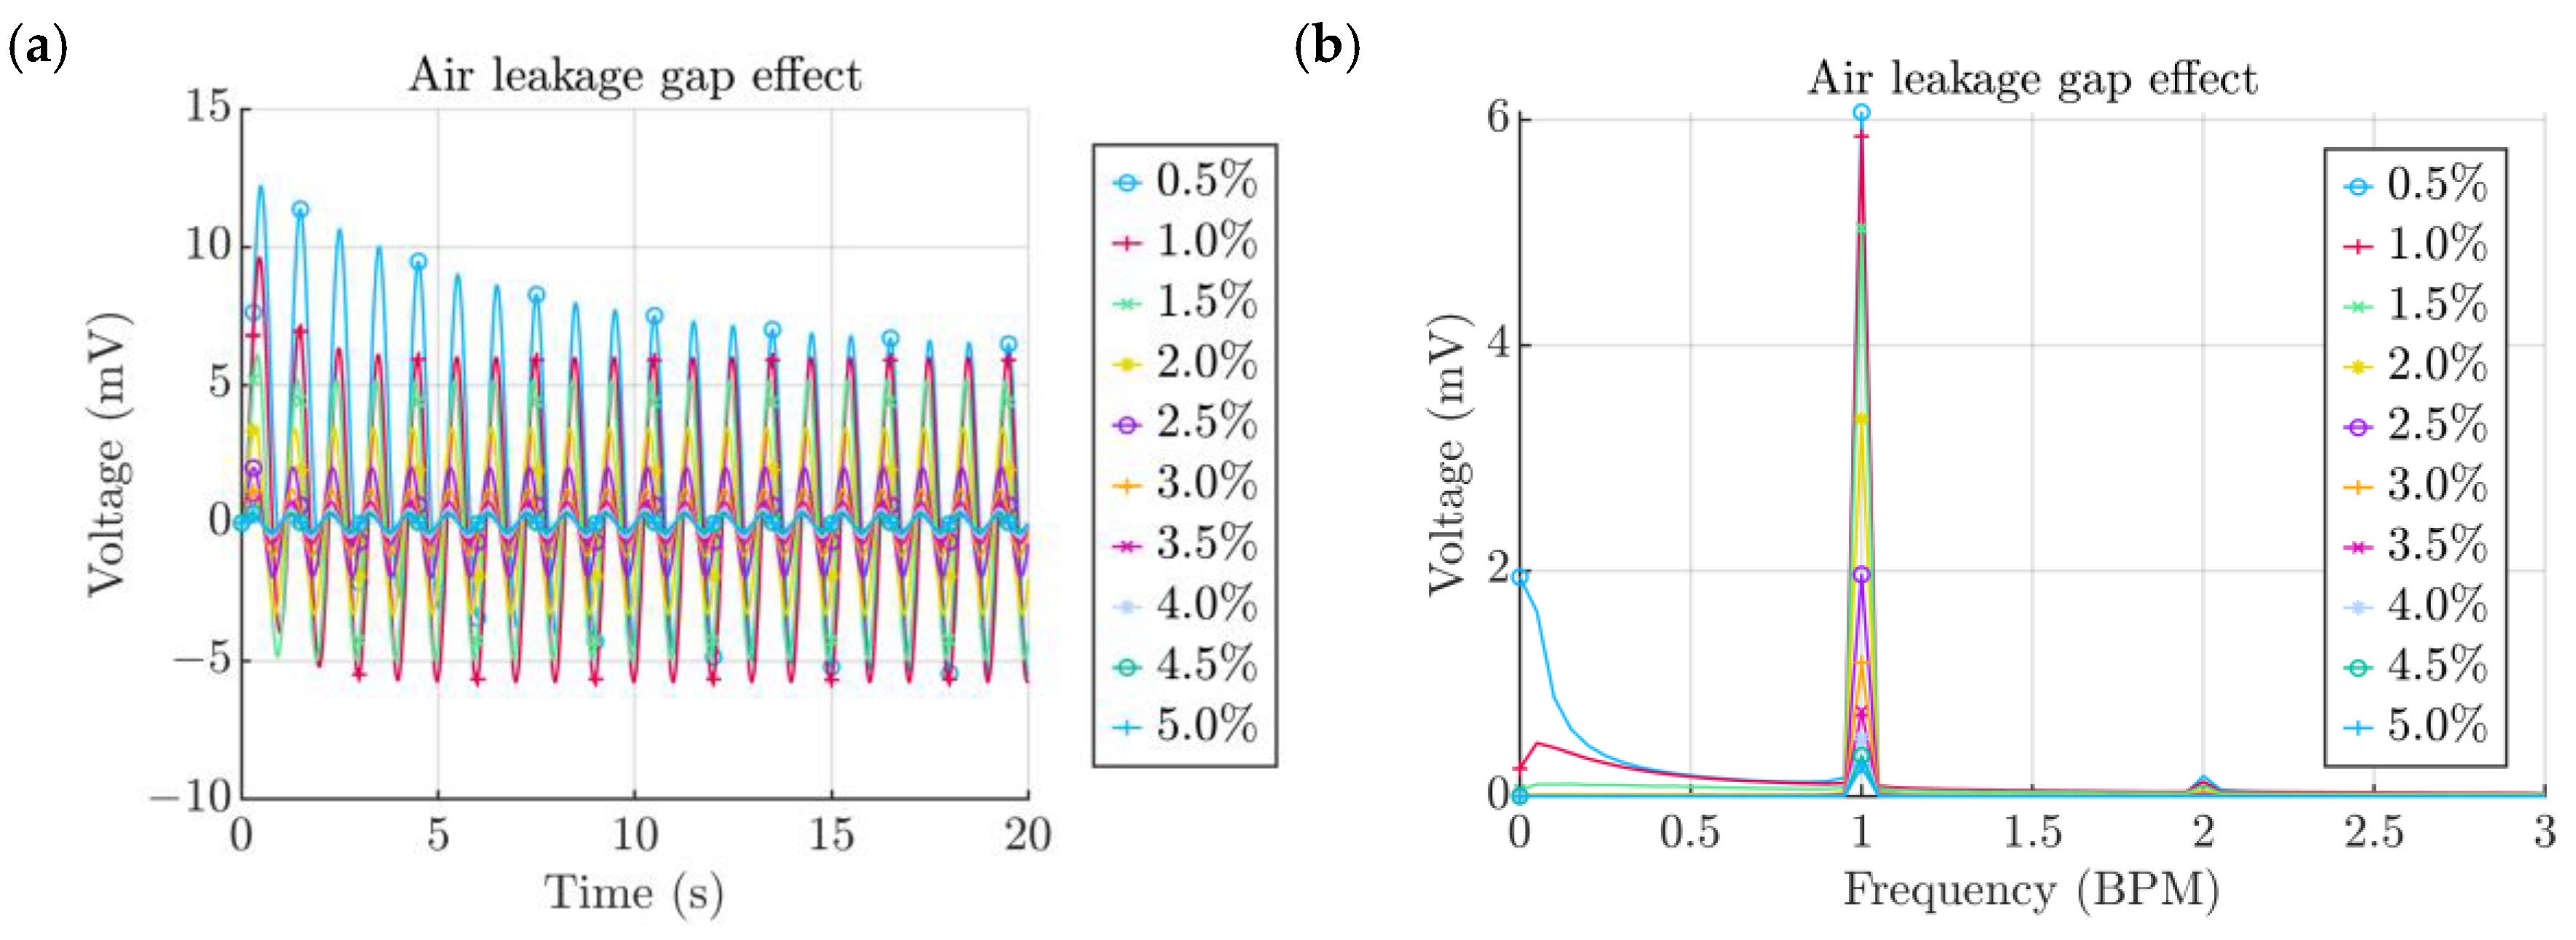
- Width of the air channel
- -
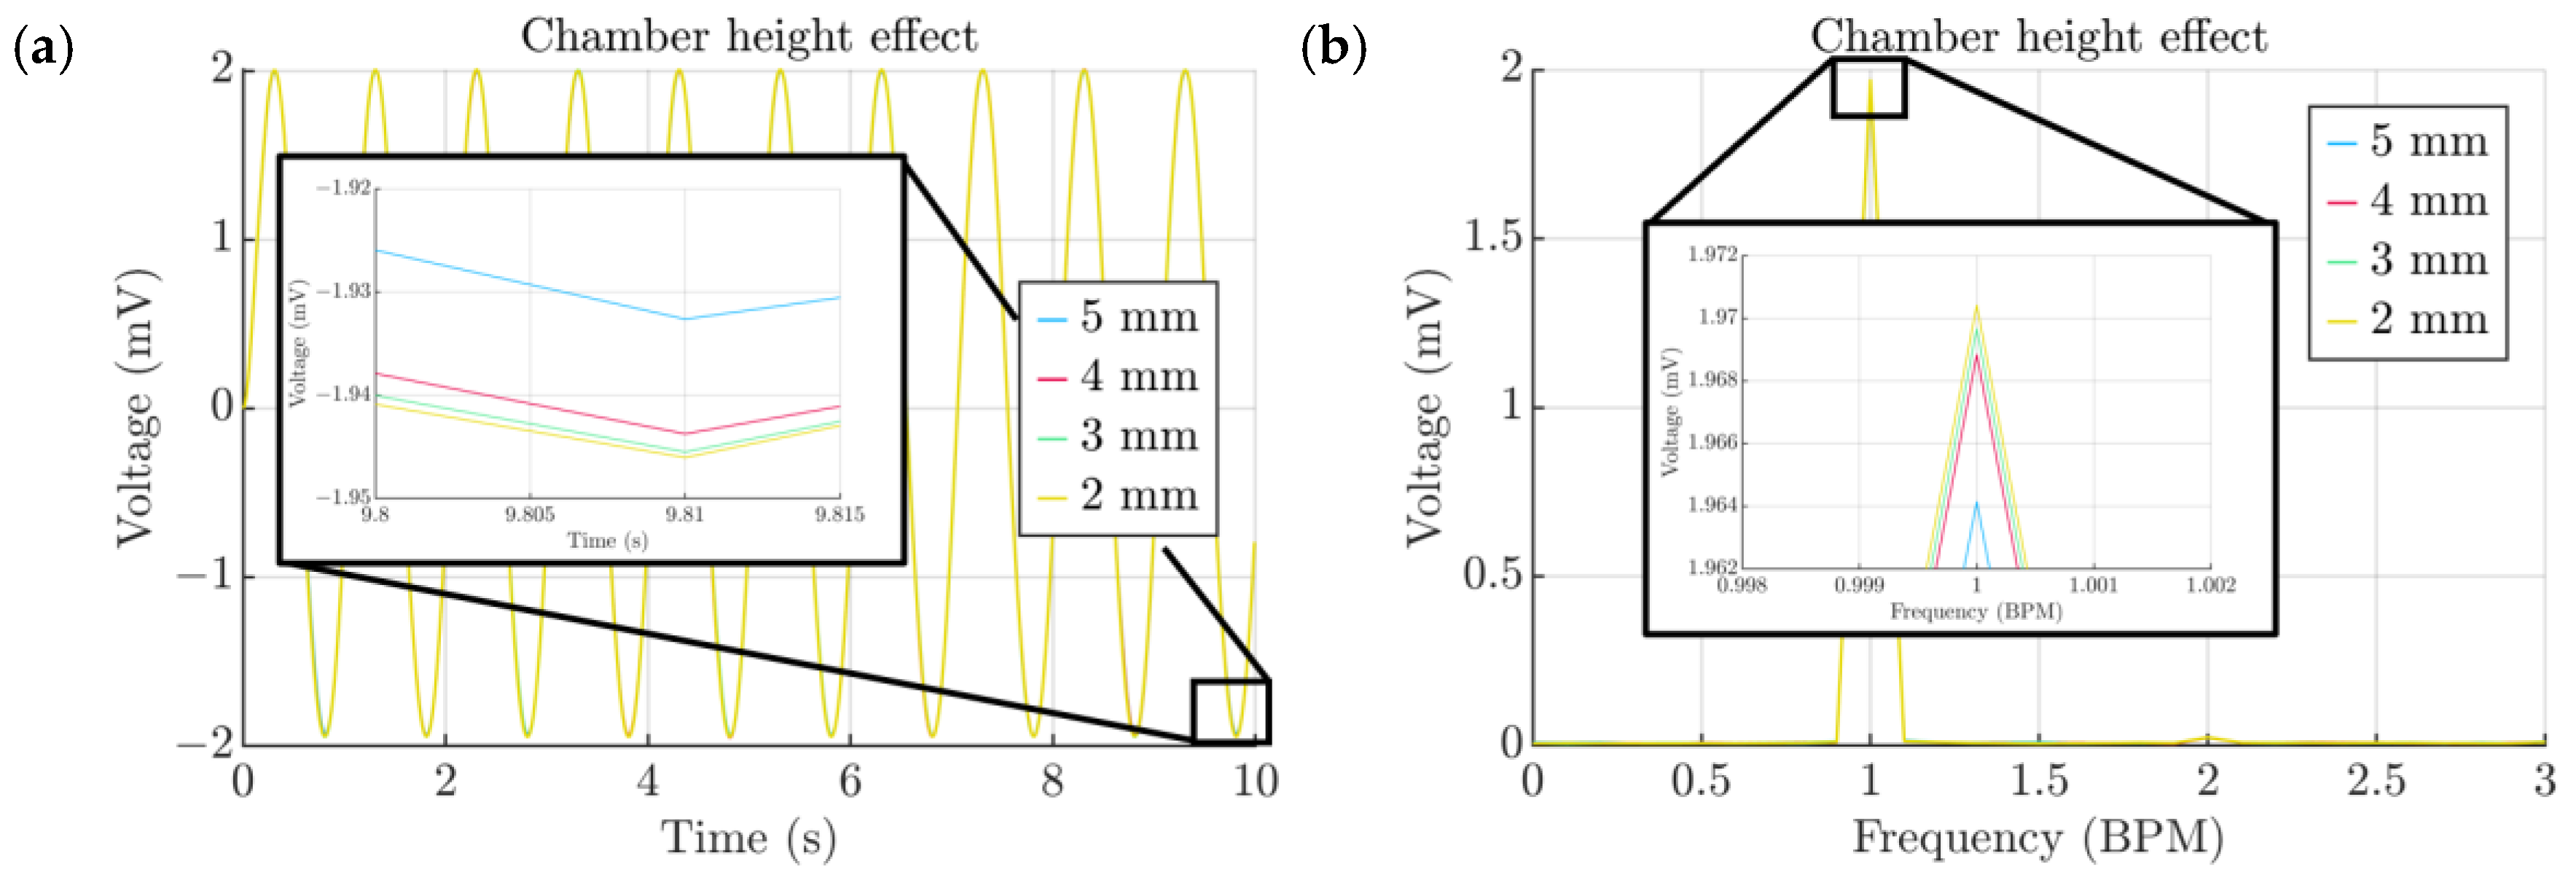
- Height of the air channel
- -
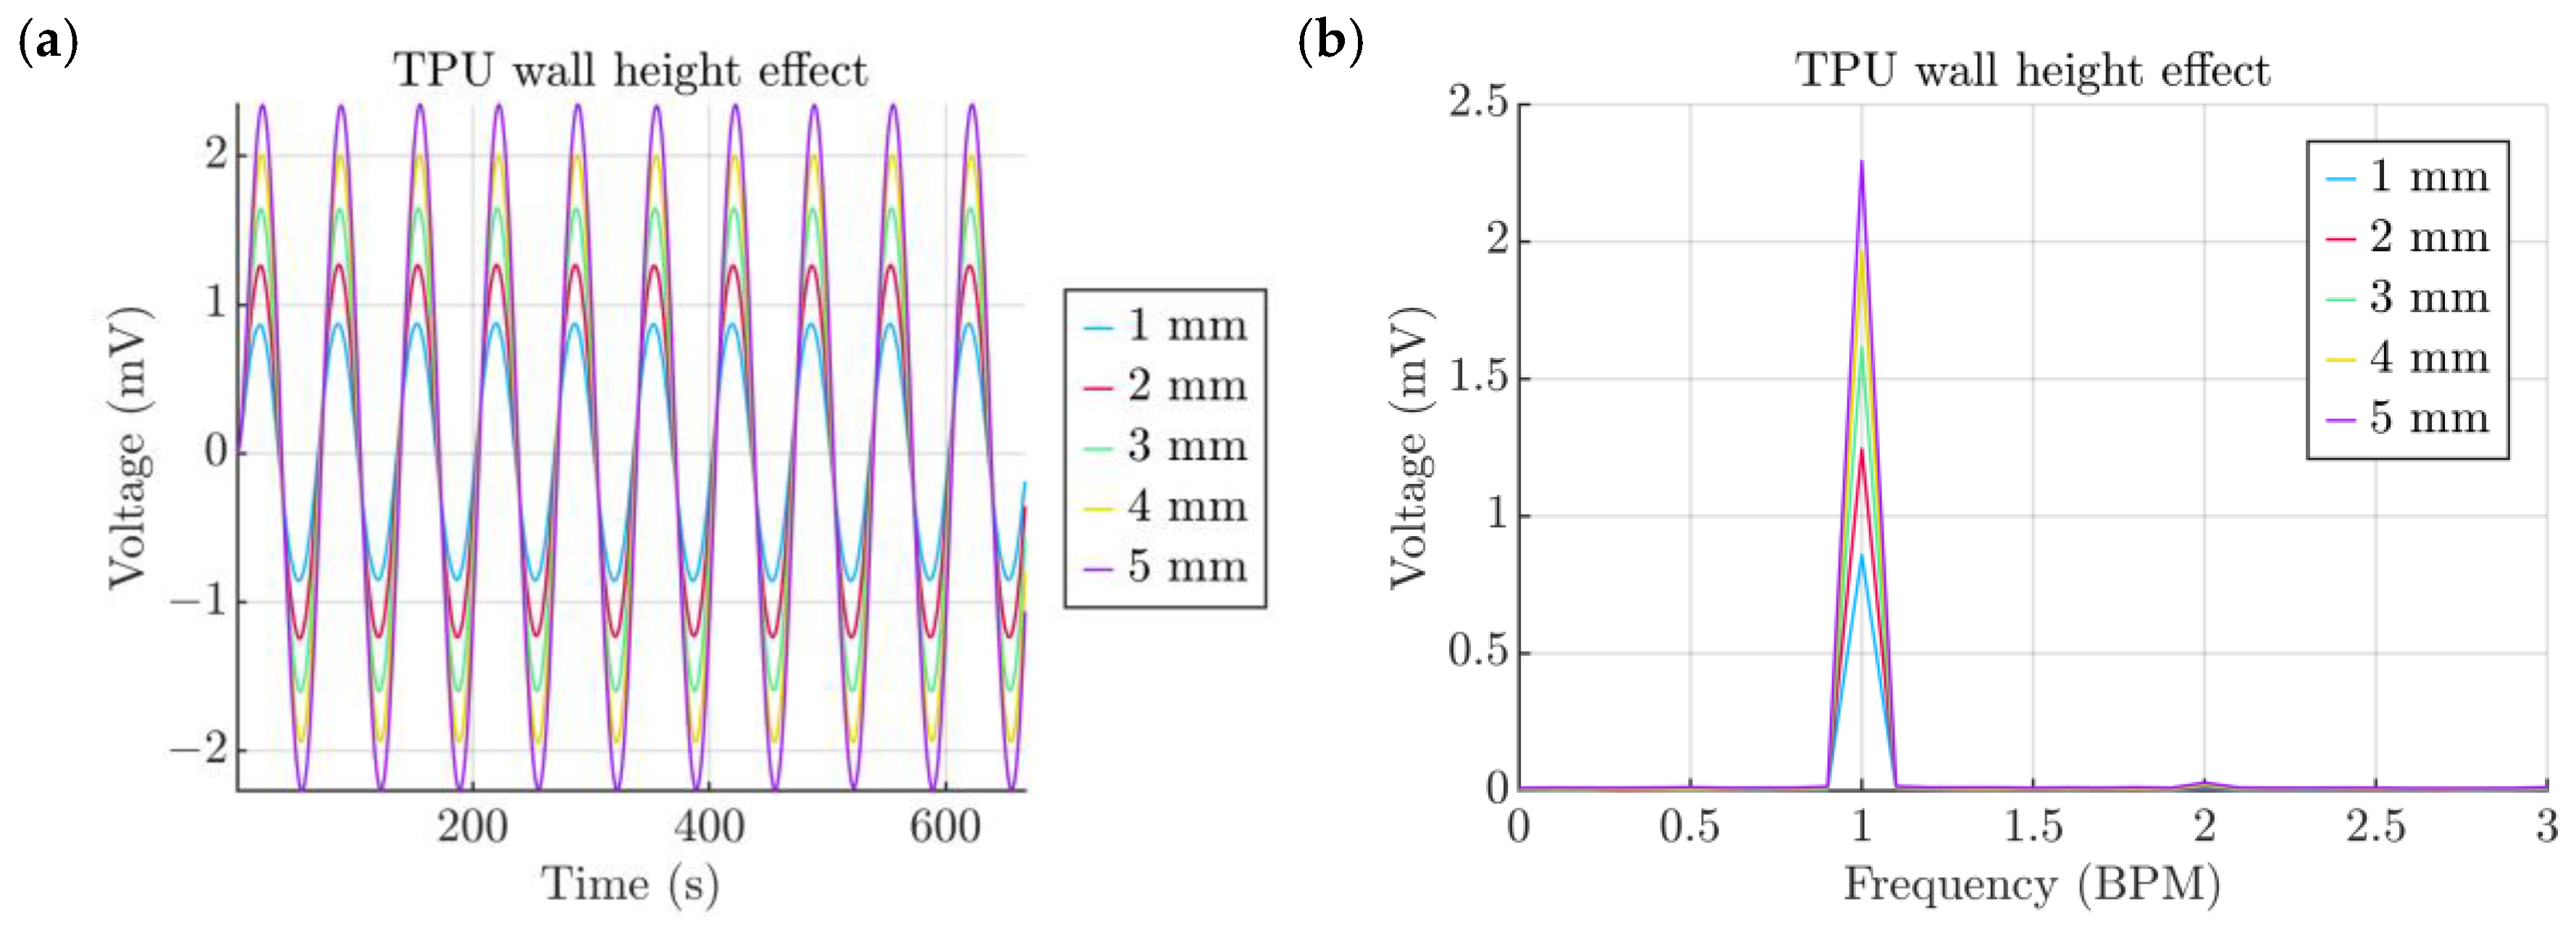
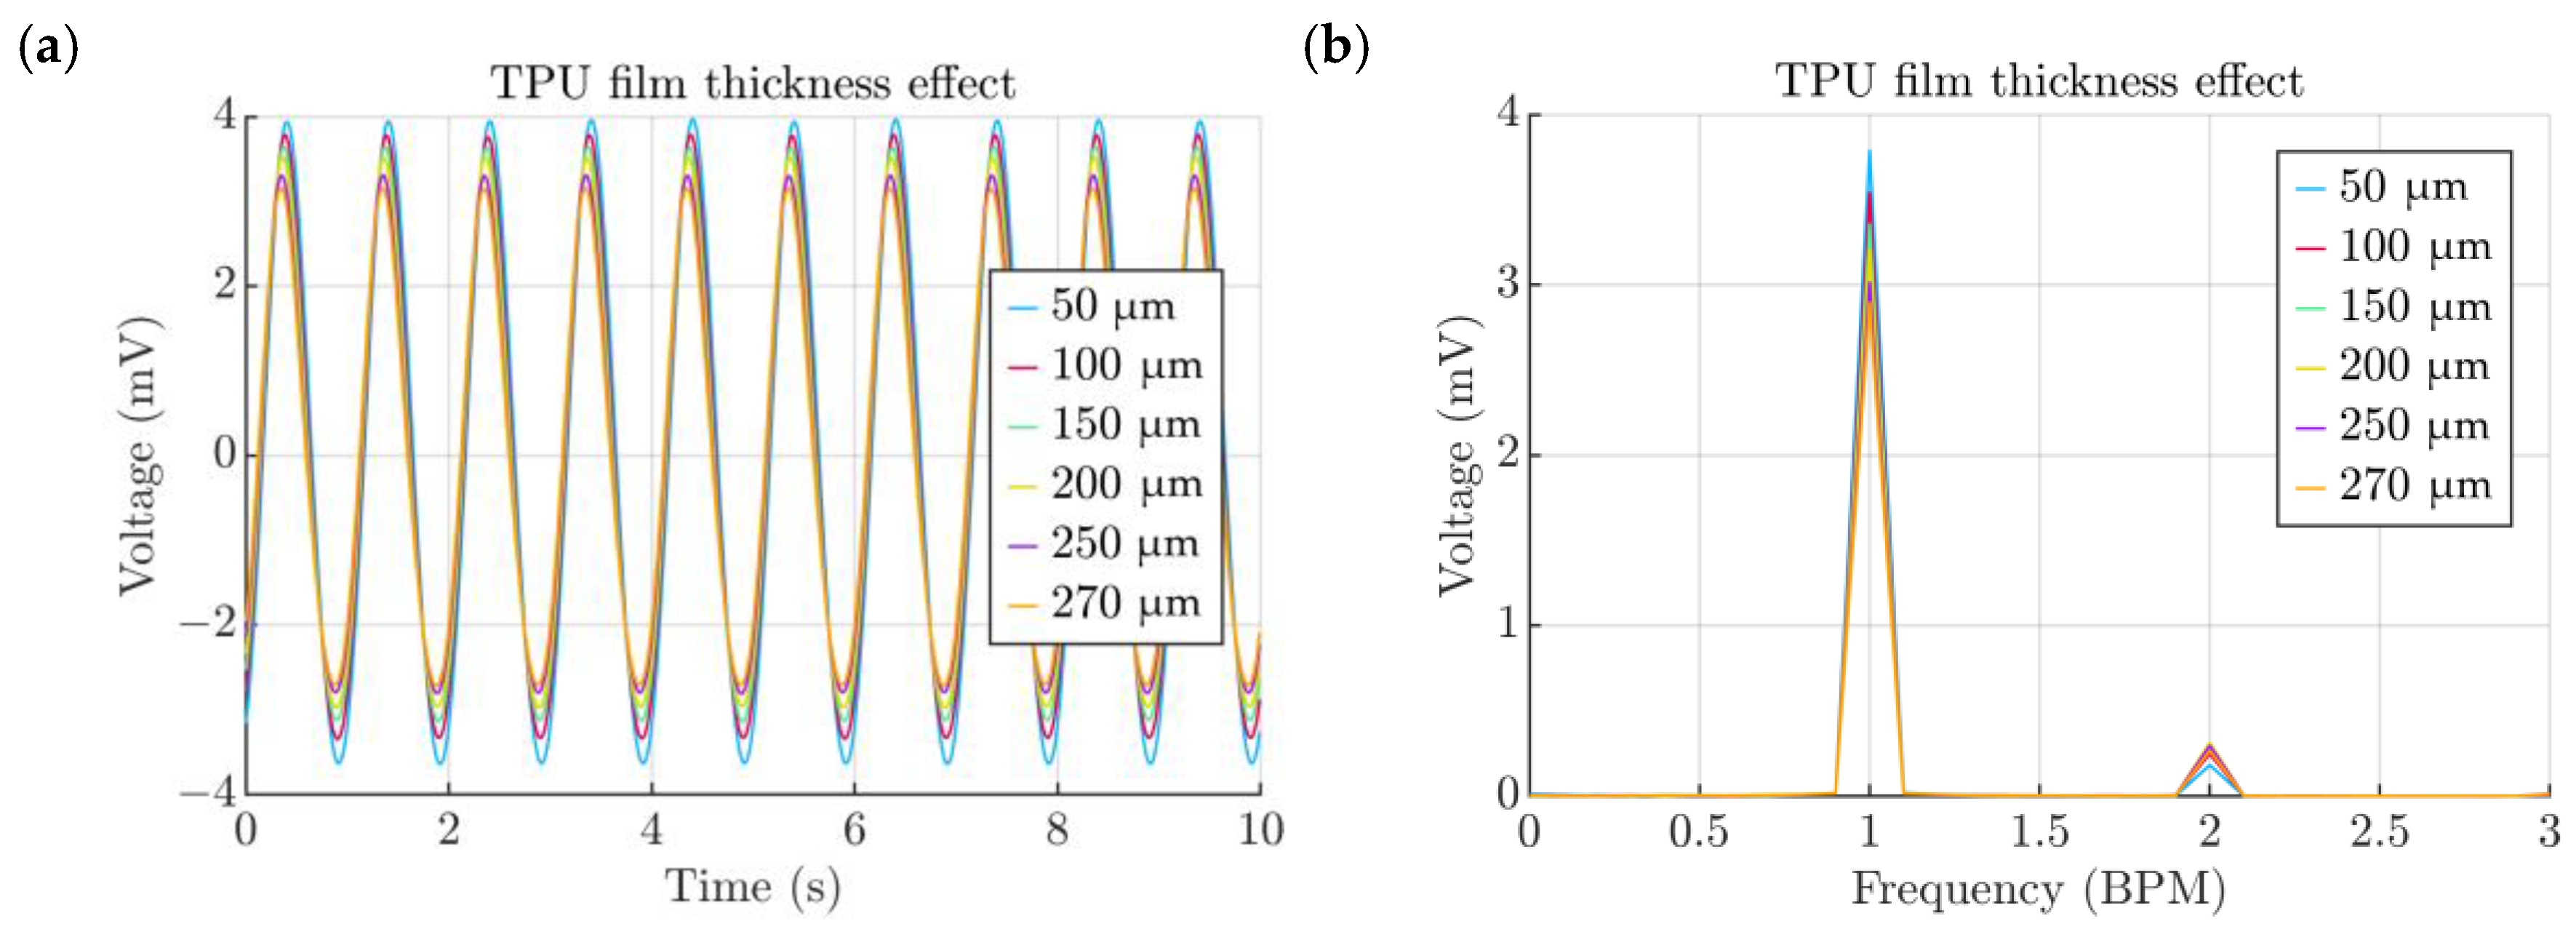
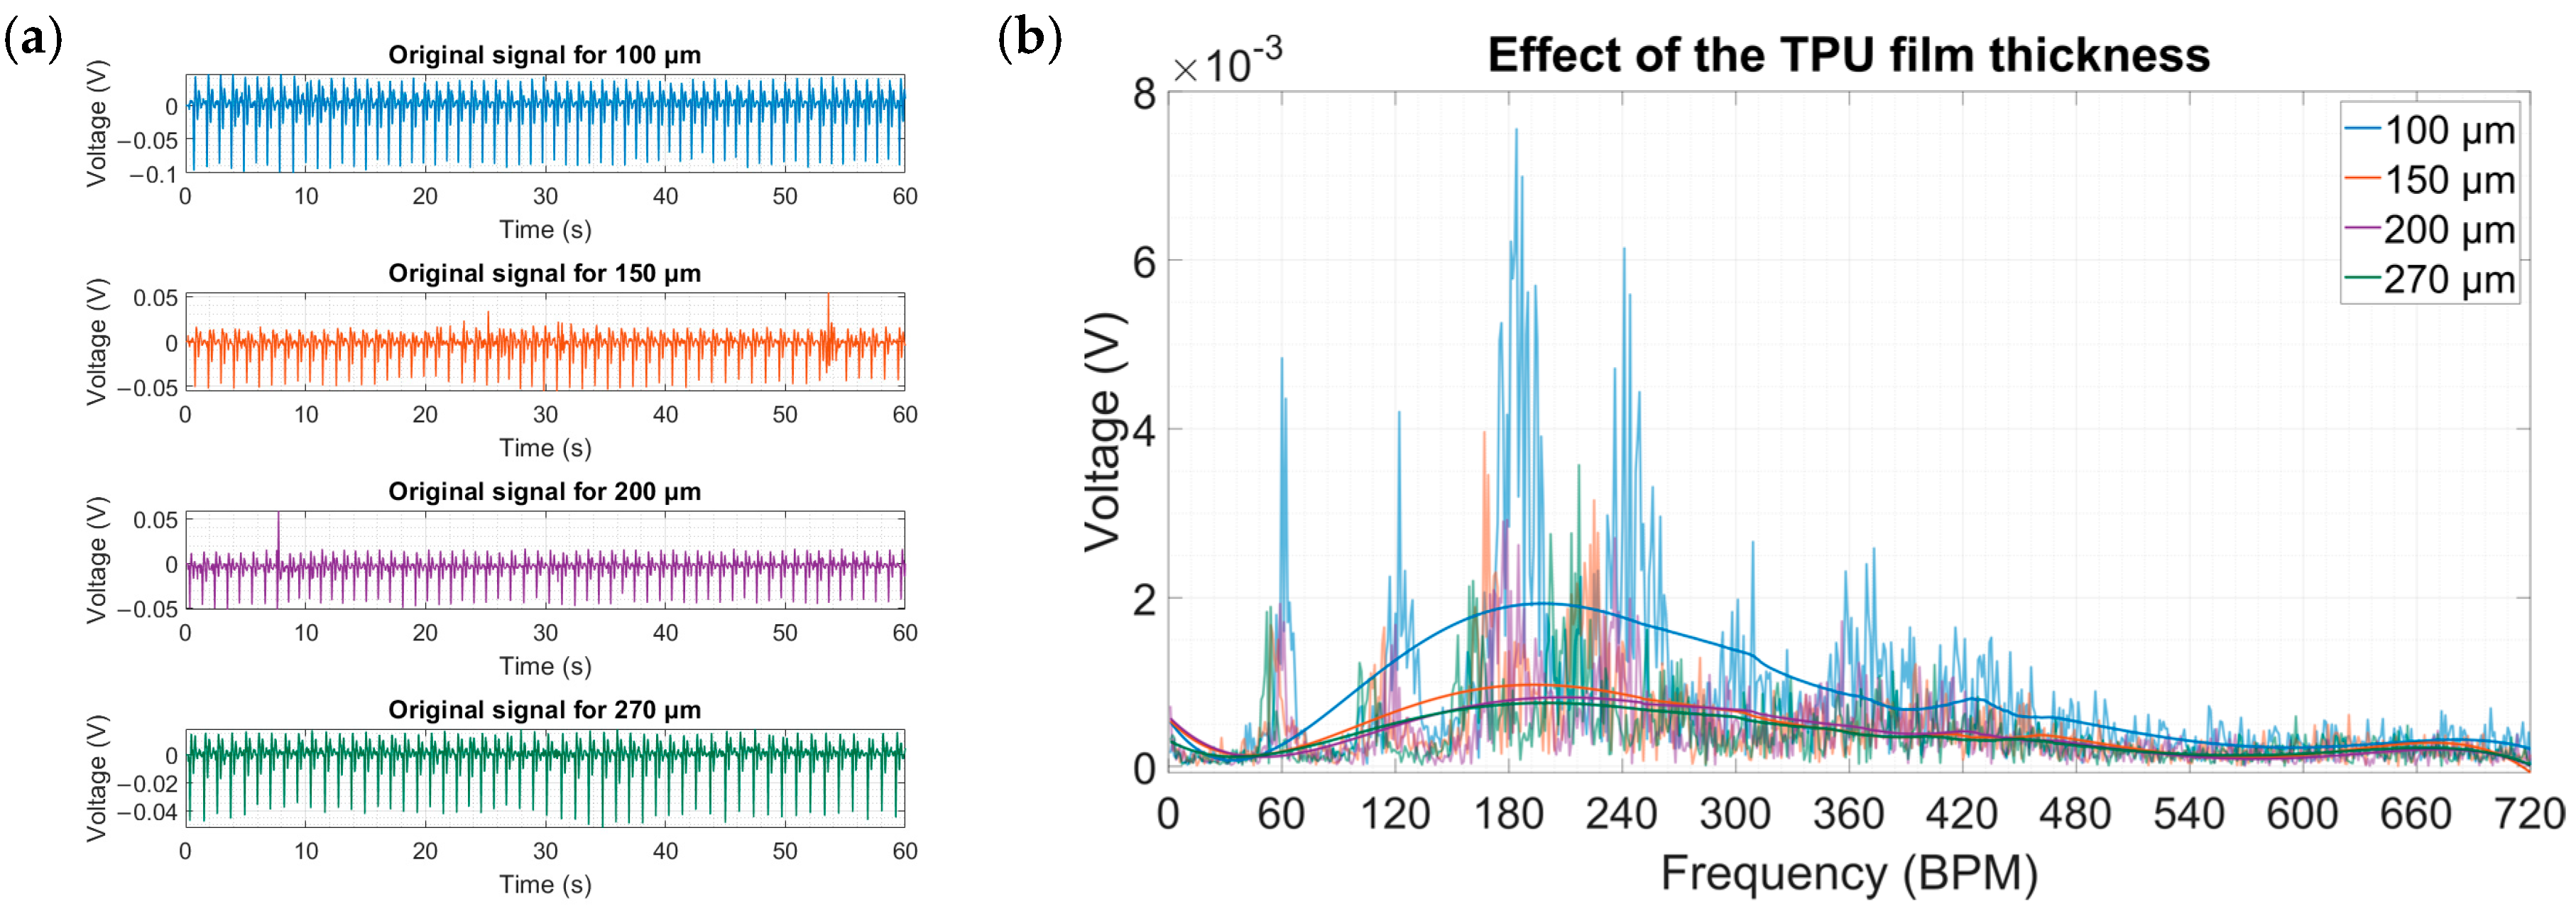
- Thickness of the TPU film
- -
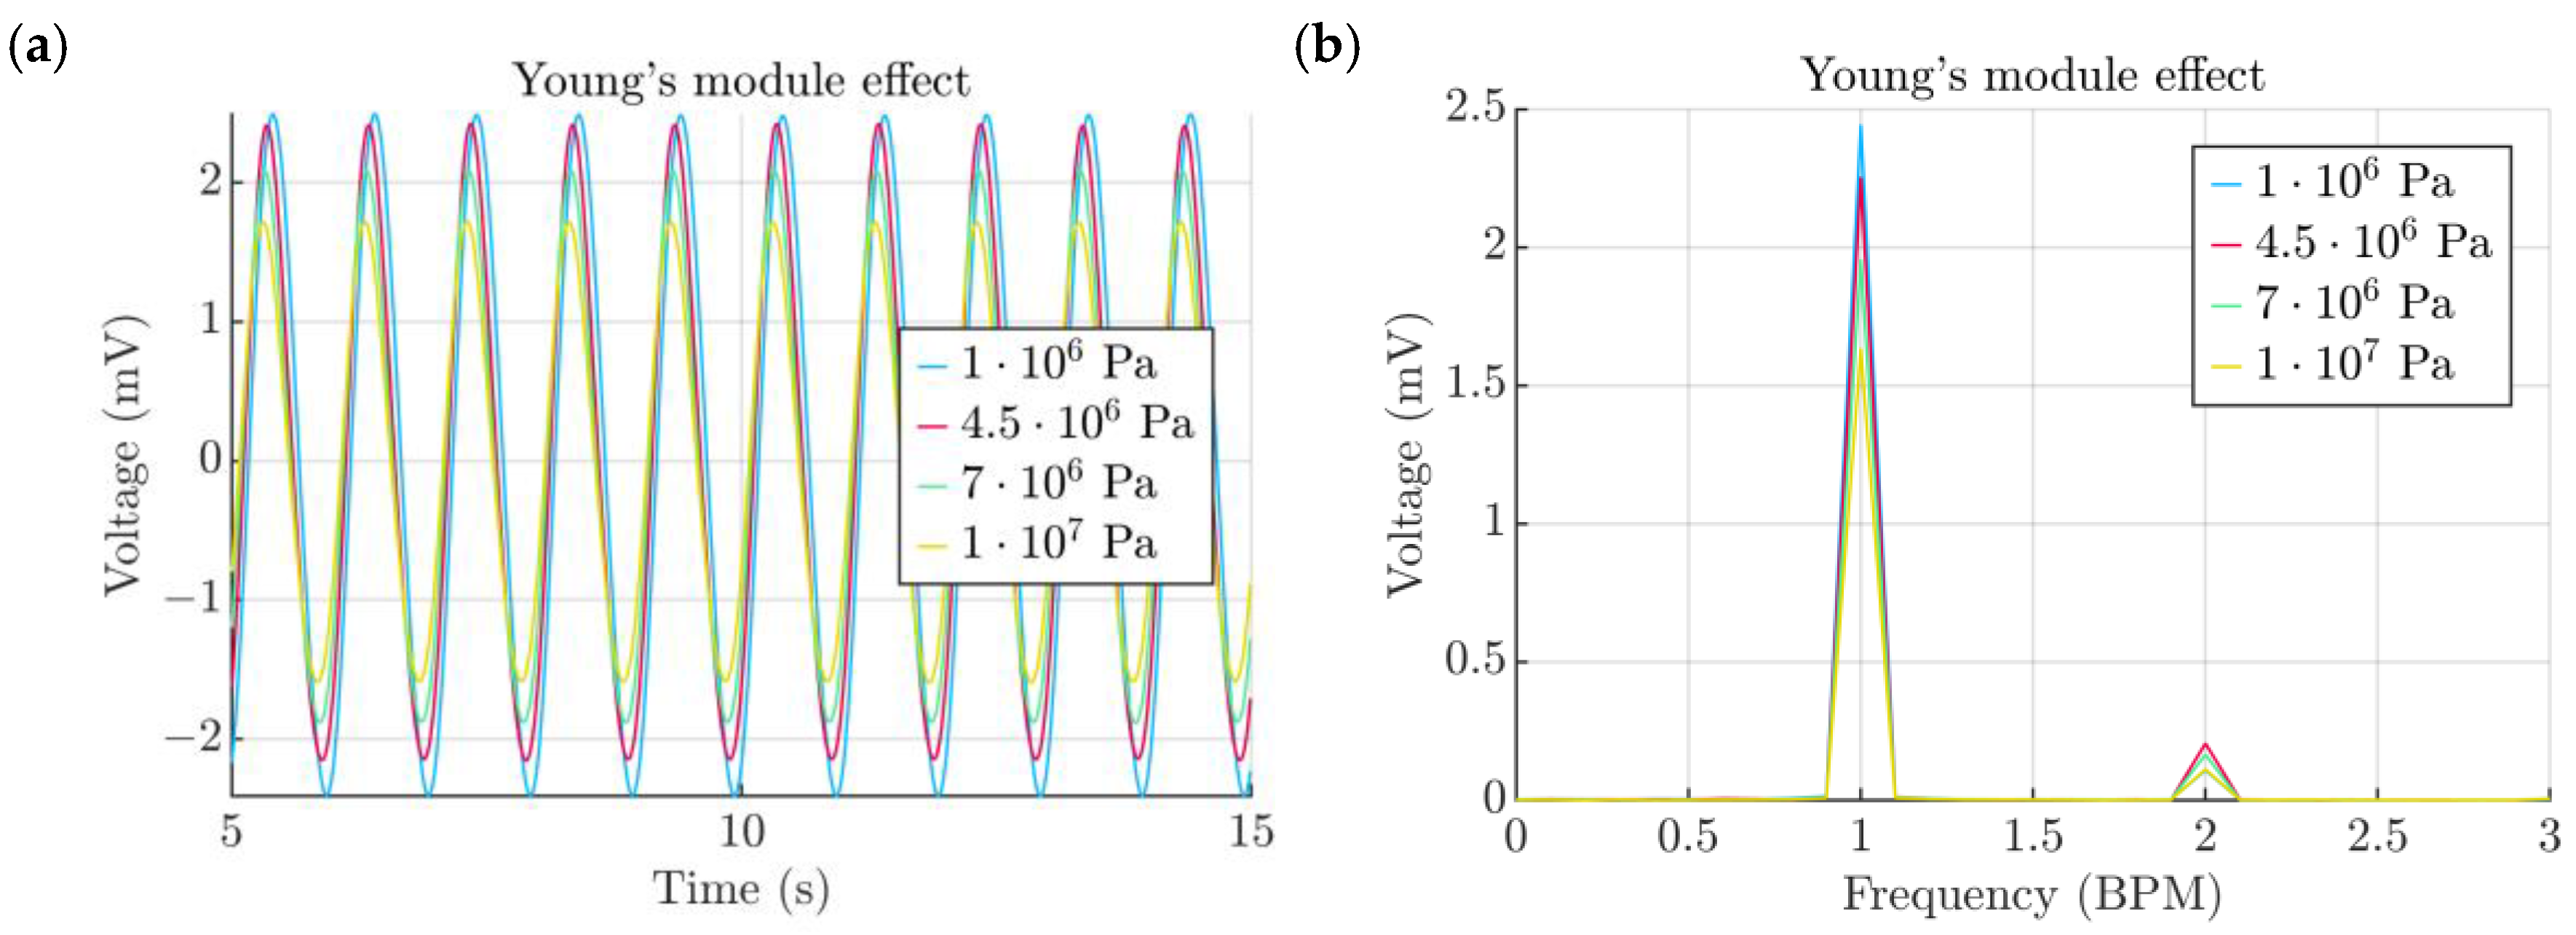
- Elastic properties of the TPU film
- -
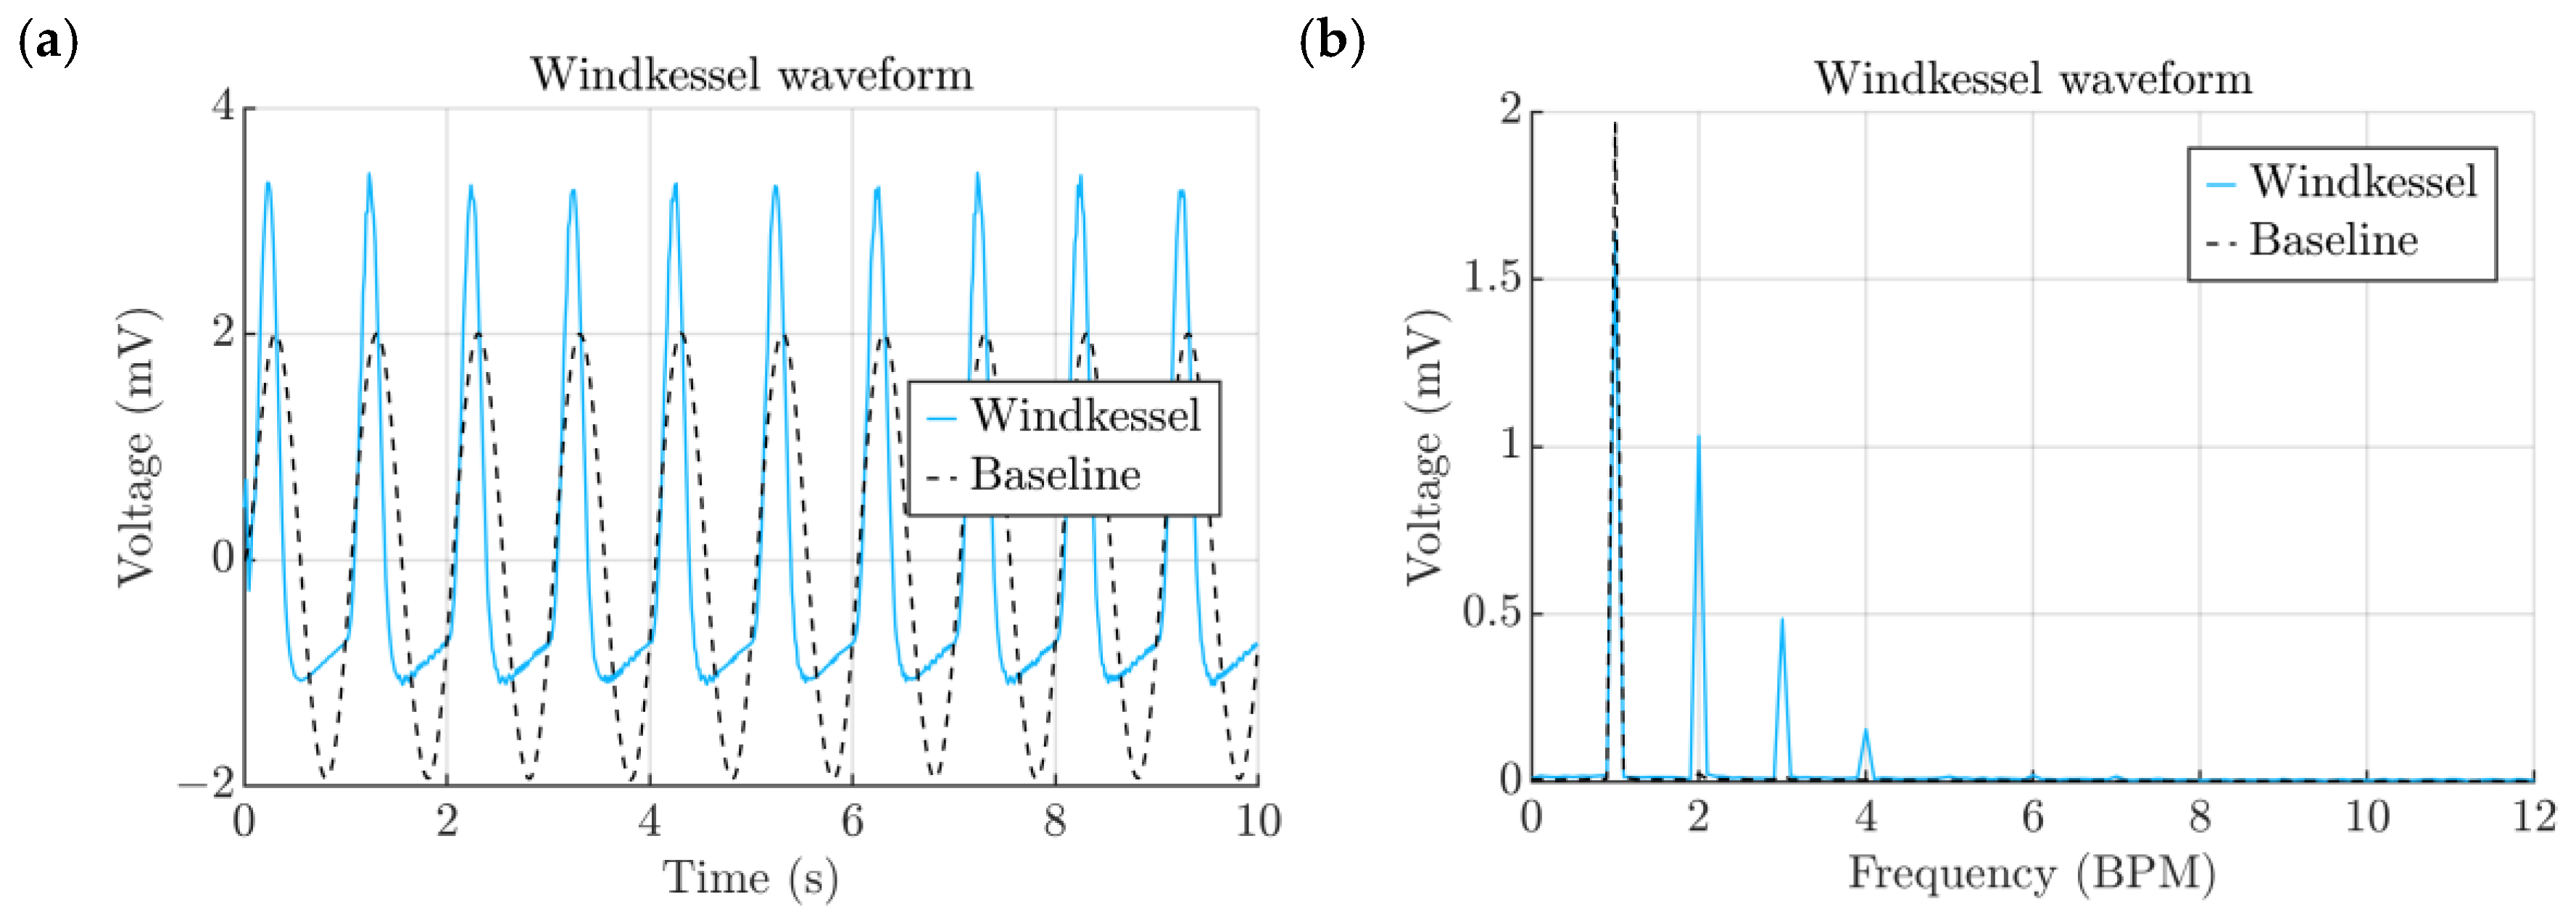
- Type of the imposed signal (Sinusoidal and Windkessel waveforms).
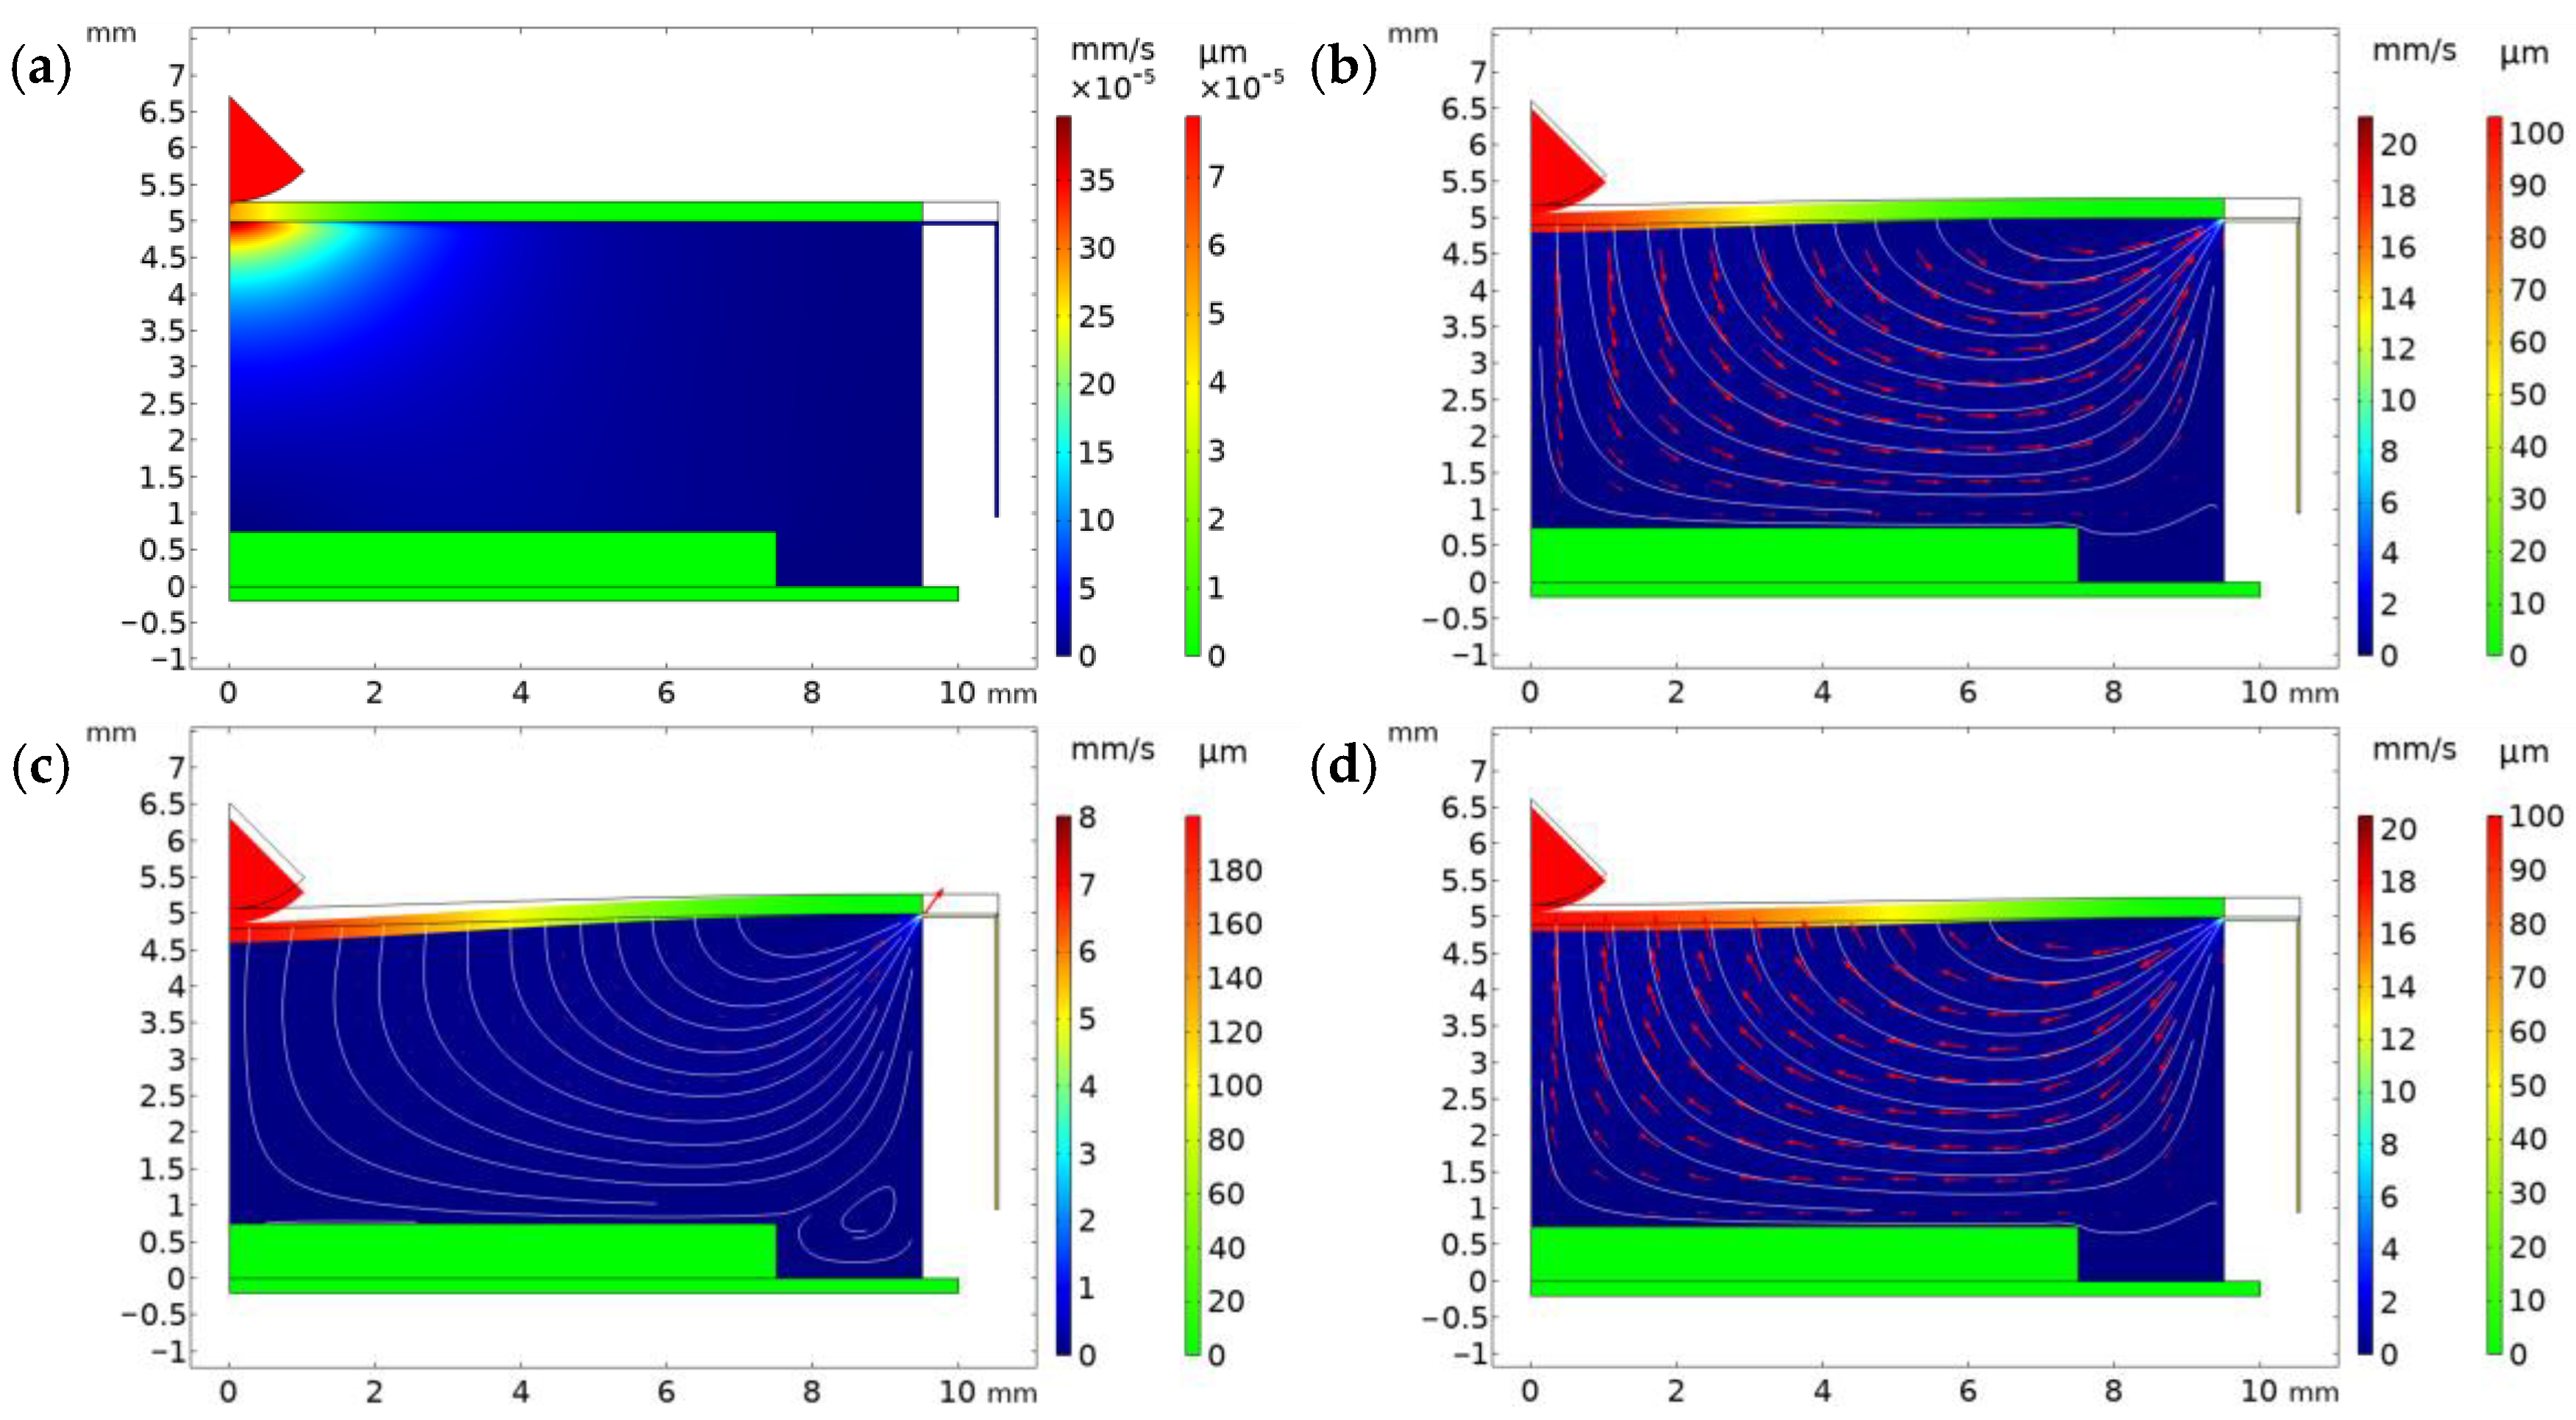
3. Results and Discussion
4. Experimental Results and Discussion
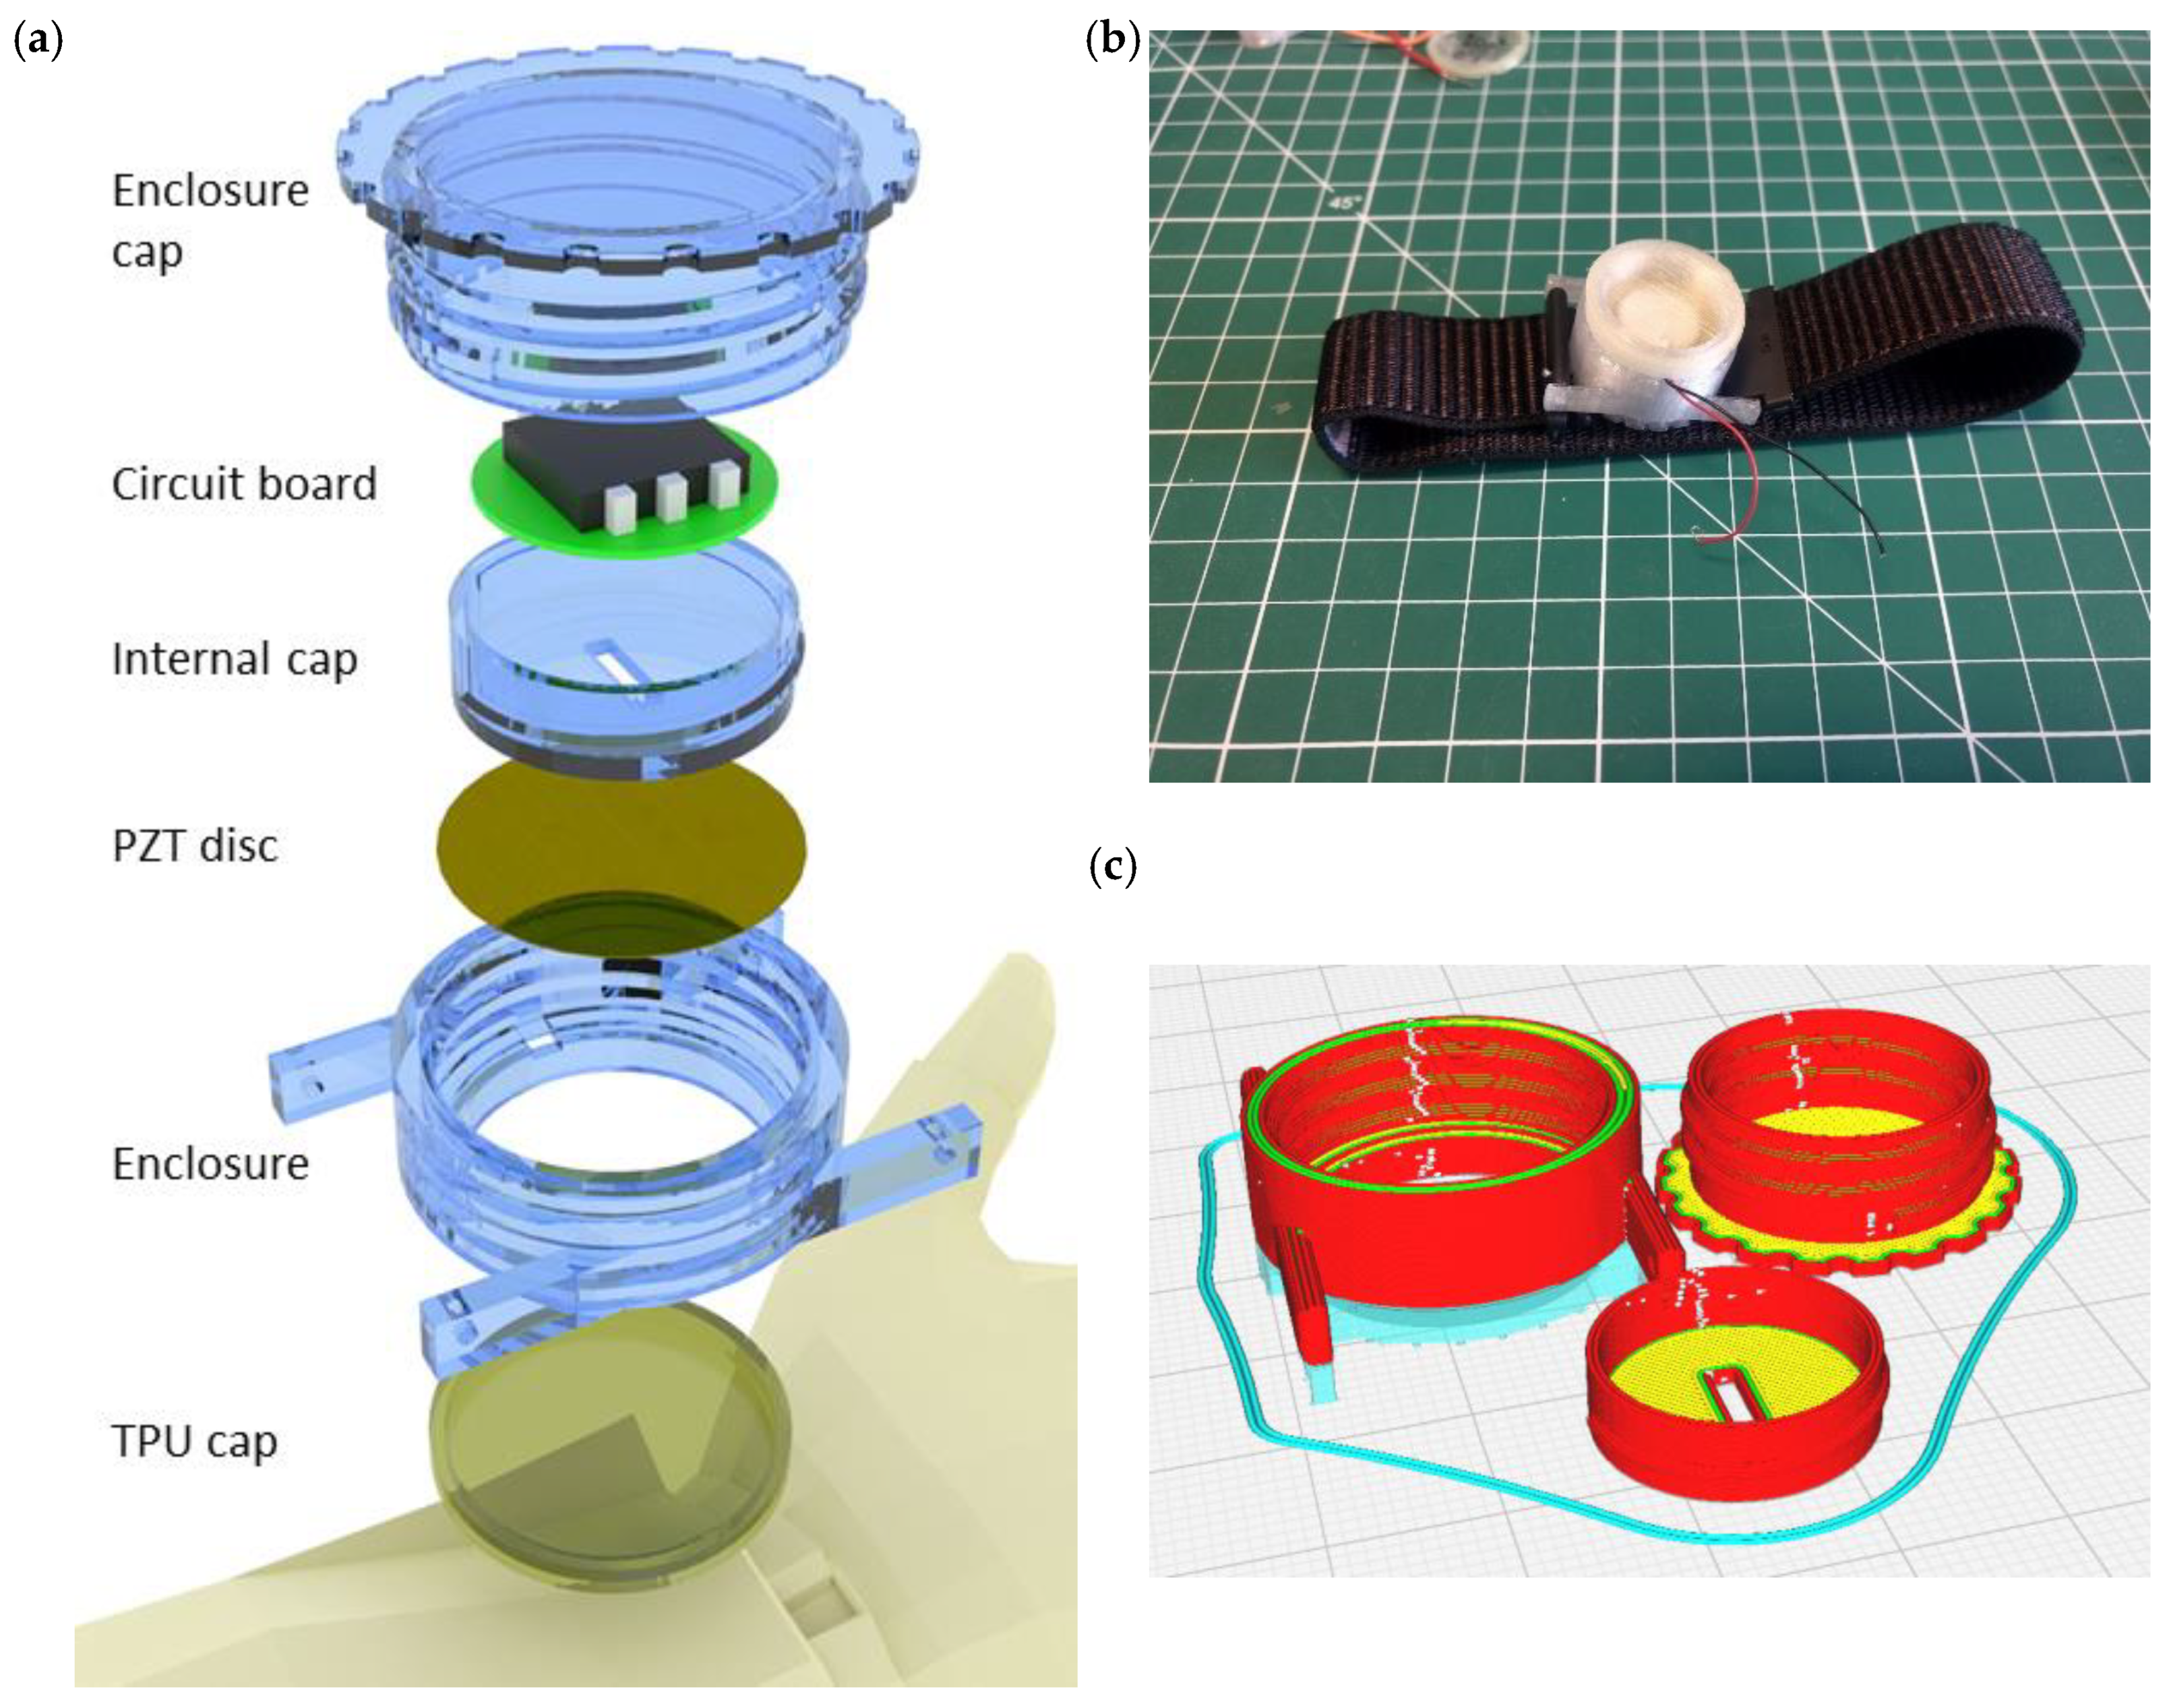
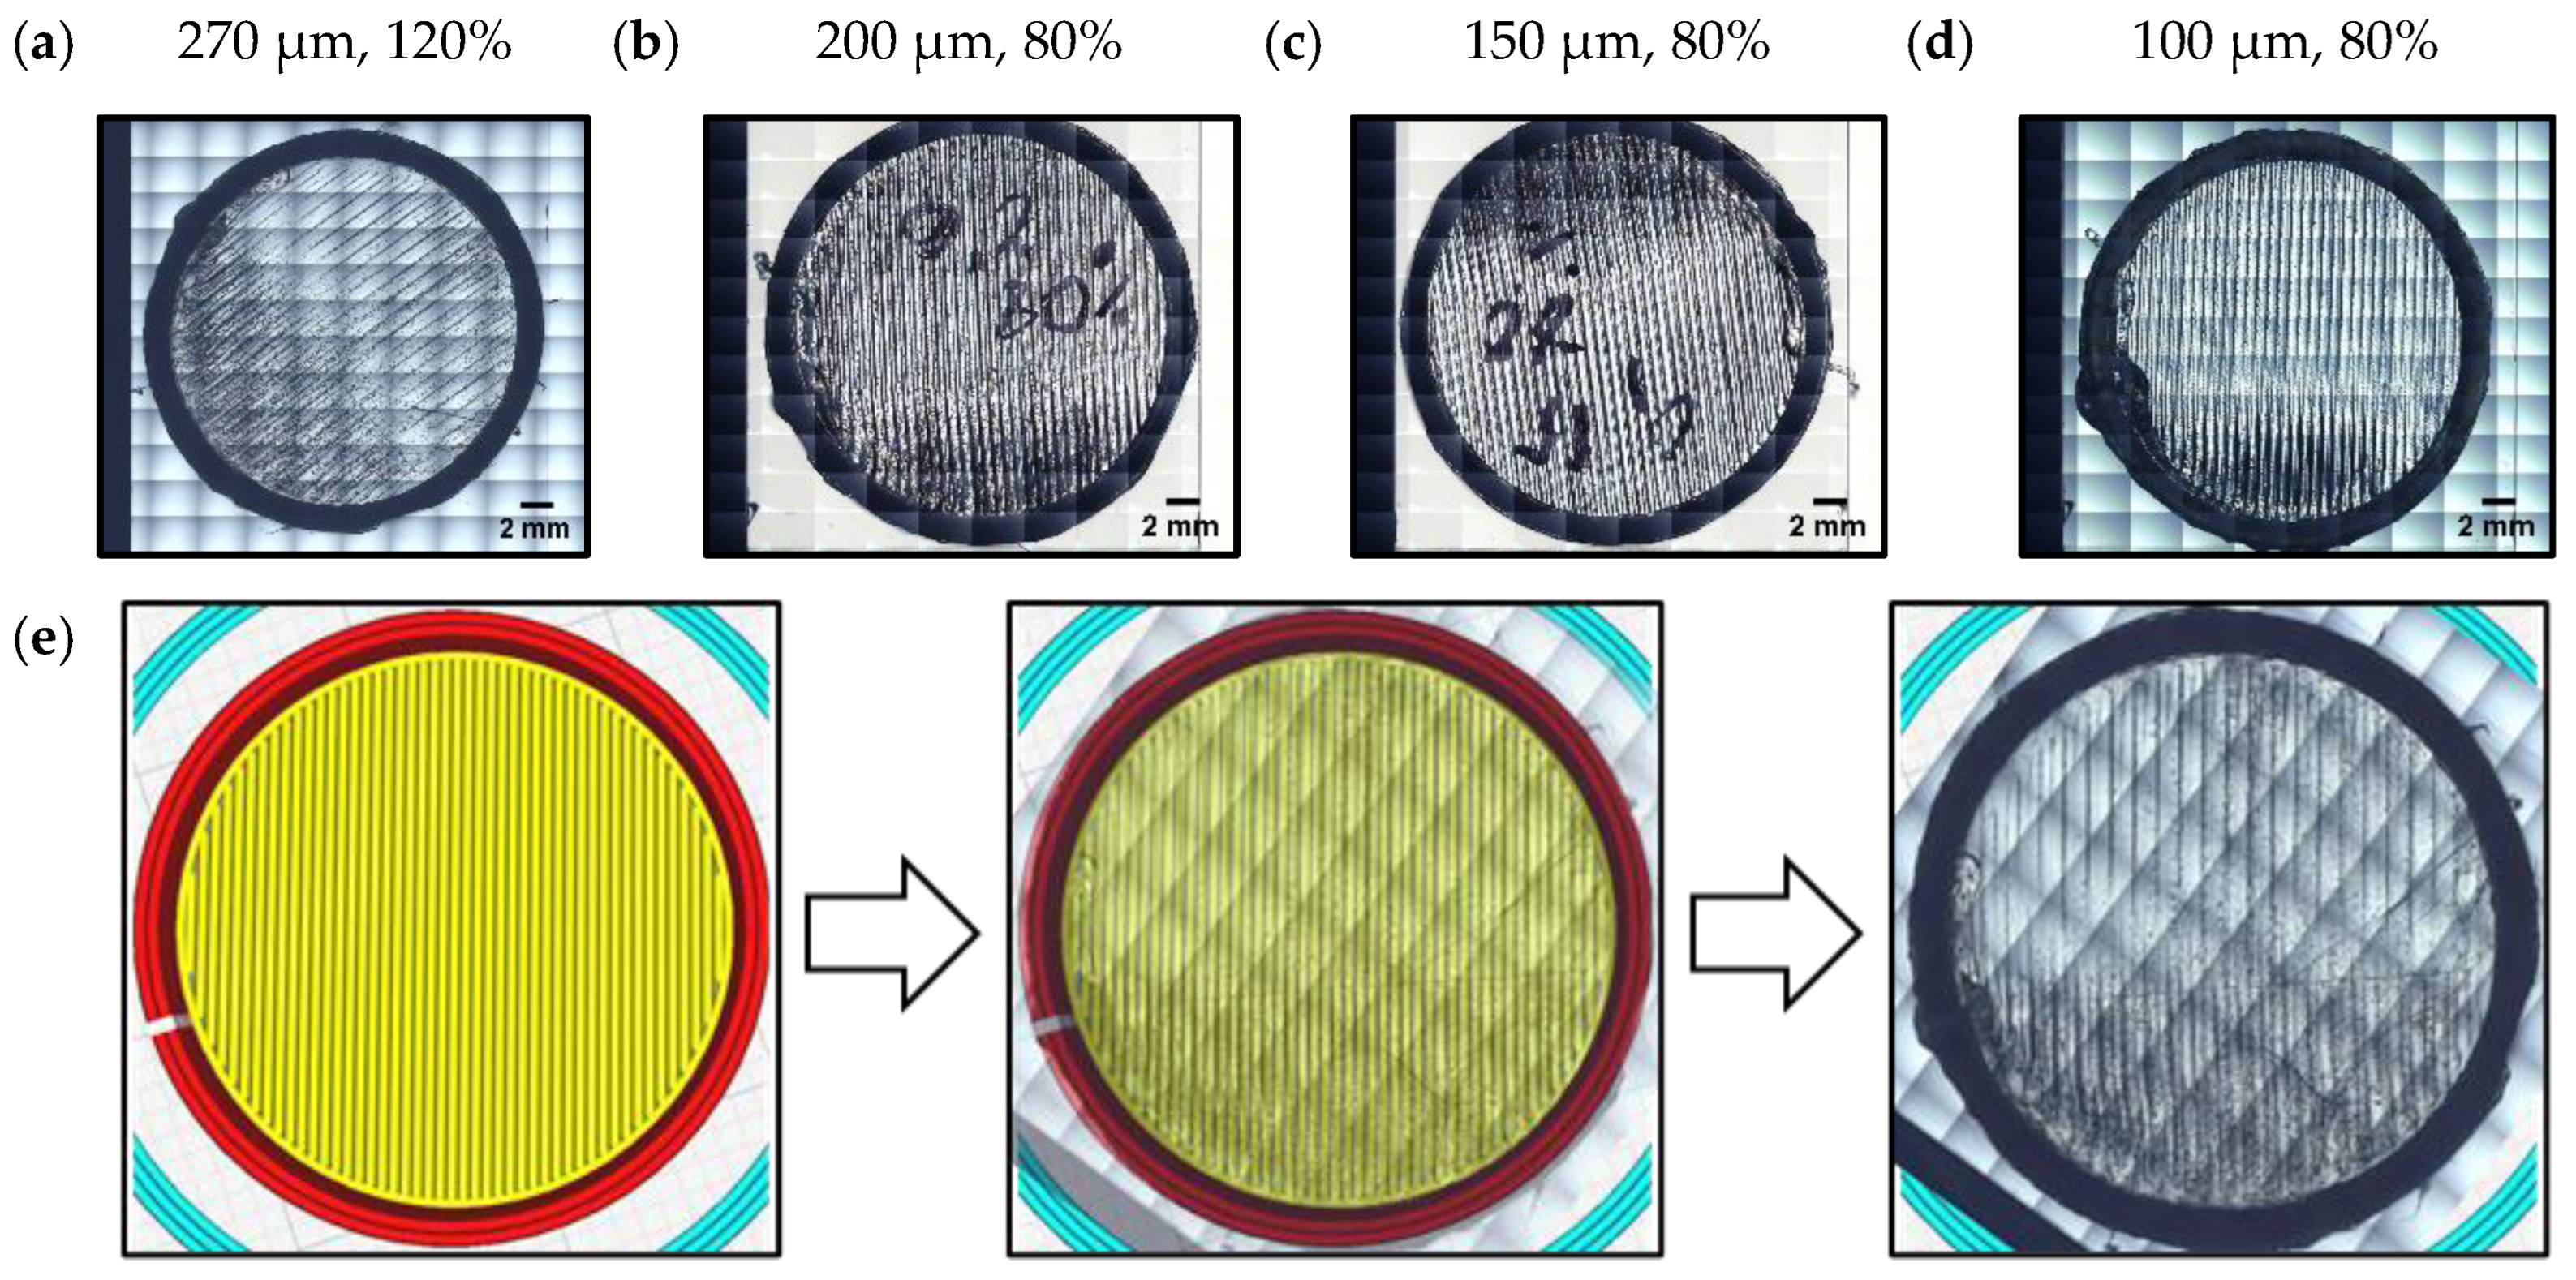
4.1. Design and Fabrication of the Harvester Enclosure
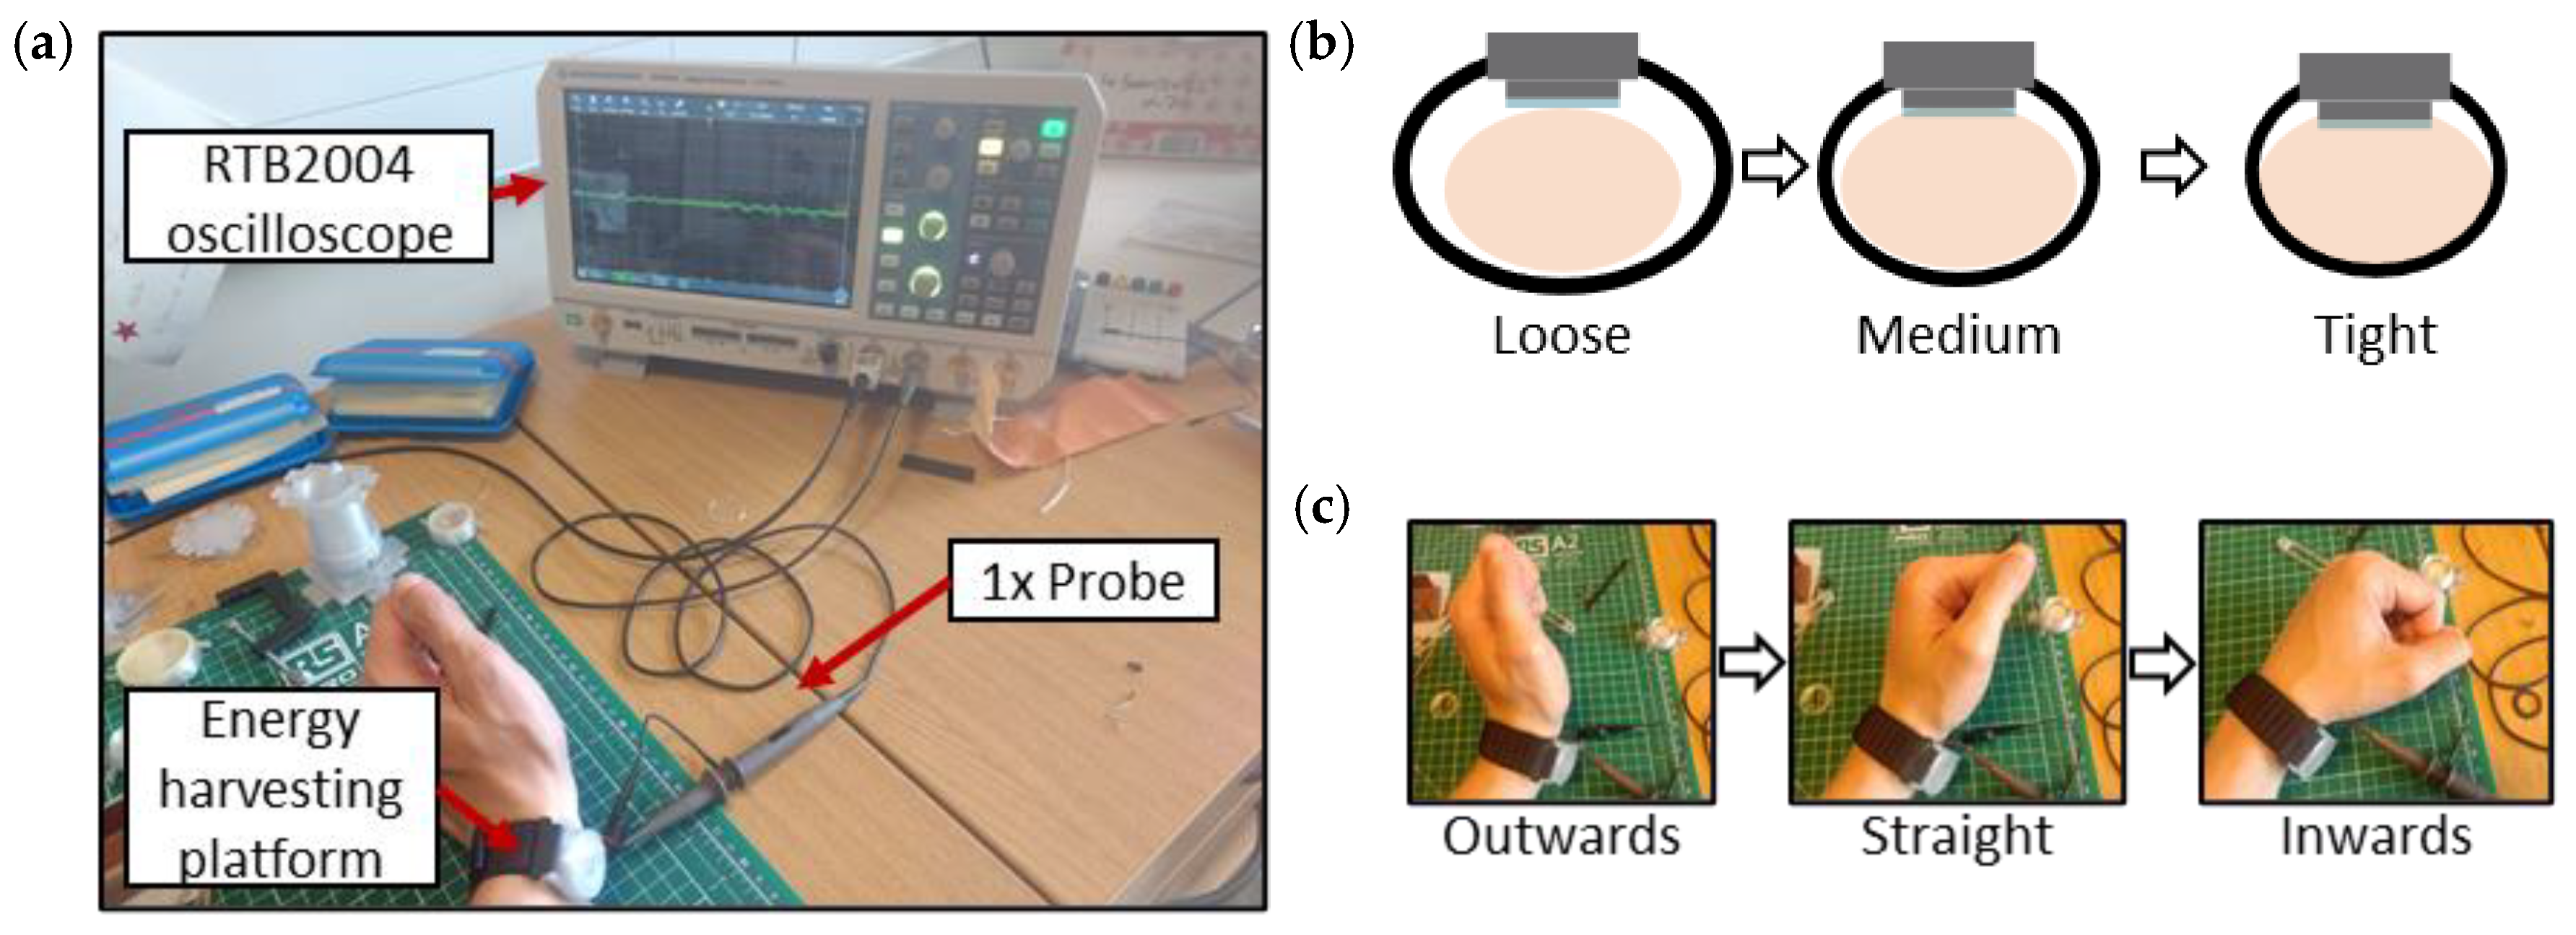
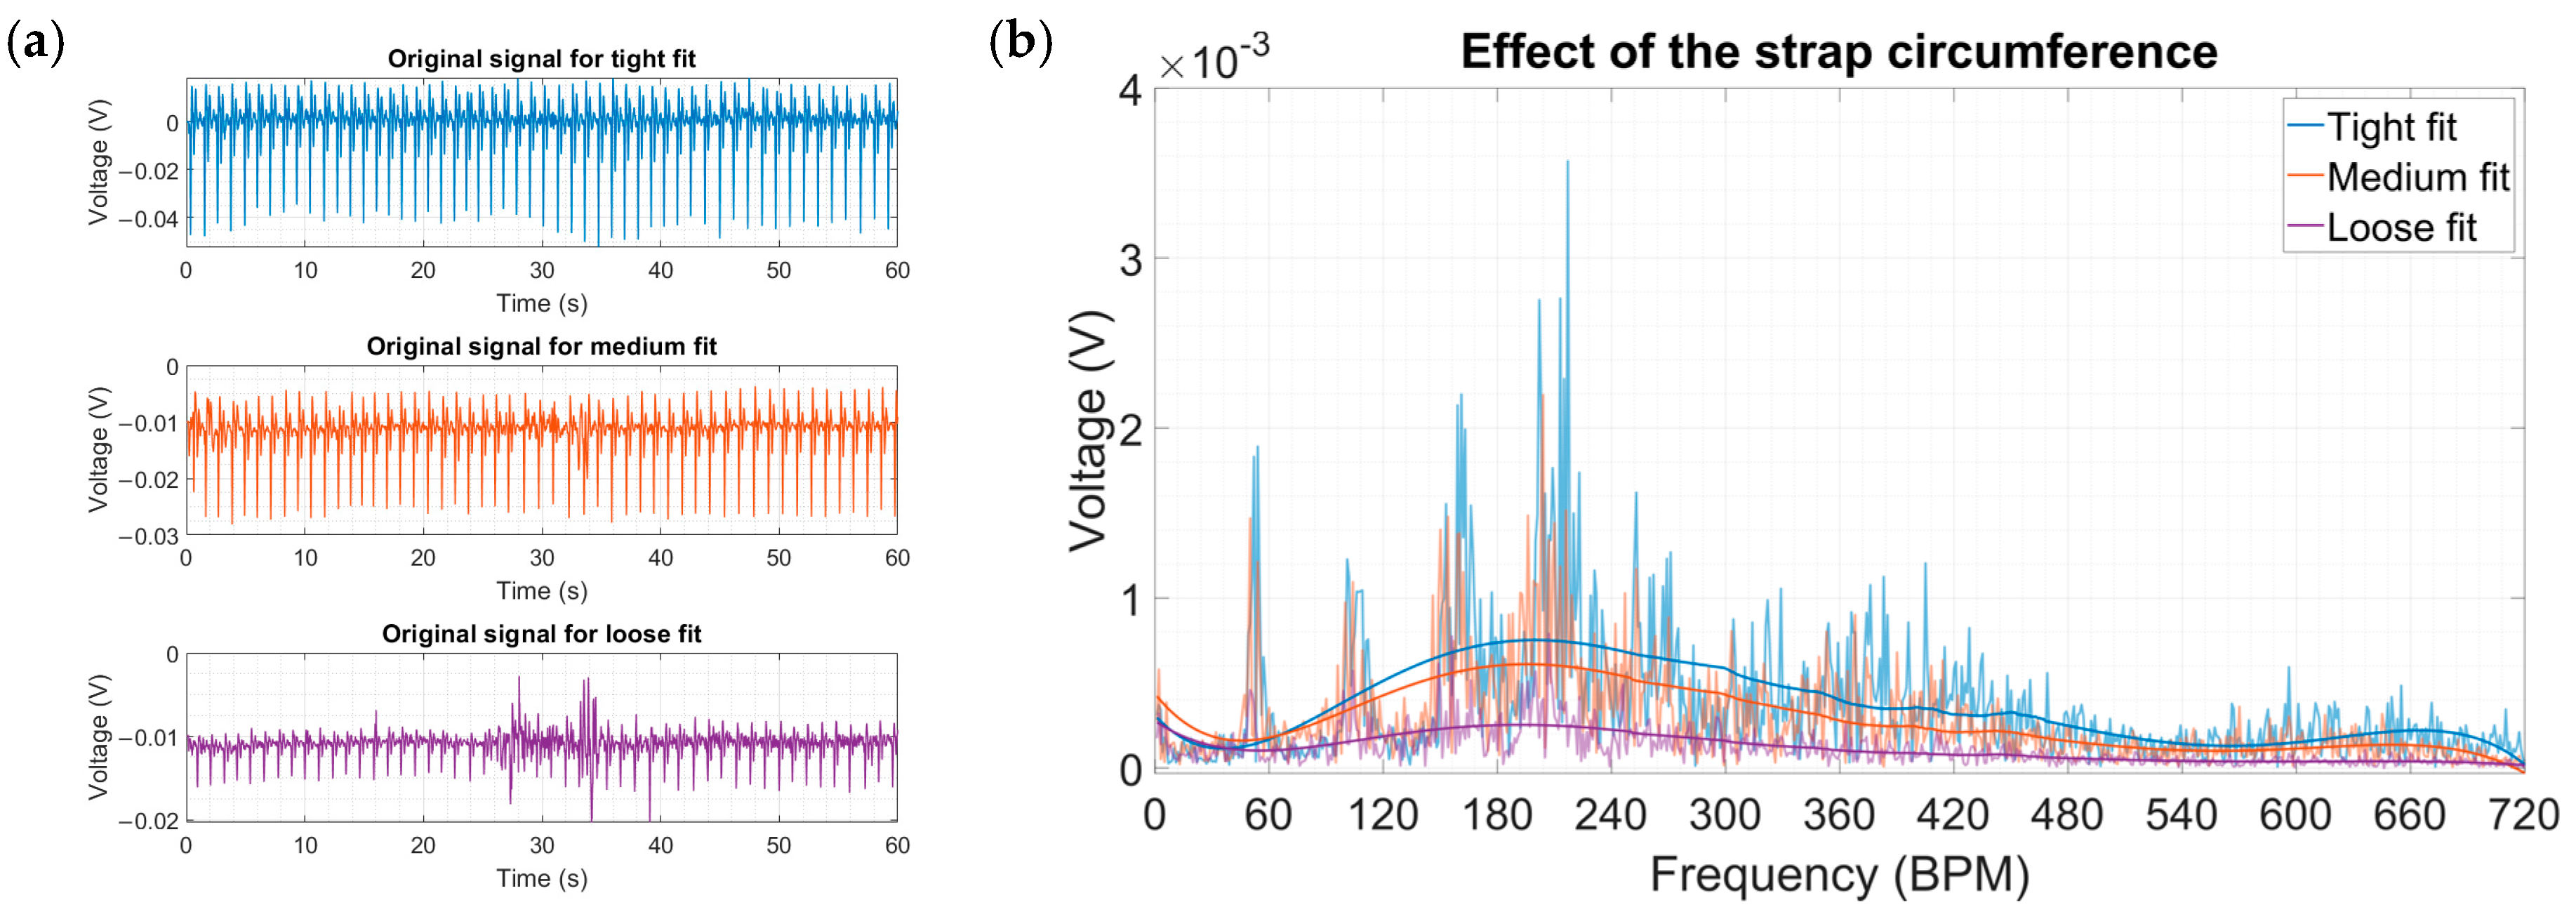
4.2. Acquisition of Physiological Data
5. Conclusions
Author Contributions
Funding
Data Availability Statement
Conflicts of Interest
References
- Song, Z.; Zhou, S.; Qin, Y.; Xia, X.; Sun, Y.; Han, G.; Shu, T.; Hu, L.; Zhang, Q. Flexible and Wearable Biosensors for Monitoring Health Conditions. Biosensors 2023, 13, 630. [Google Scholar] [CrossRef] [PubMed]
- Zhu, P.; Peng, H.; Rwei, A.Y. Flexible, wearable biosensors for digital health. Med. Nov. Technol. Devices 2022, 14, 100118. [Google Scholar] [CrossRef]
- Lazaro, A.; Villarino, R.; Lazaro, M.; Canellas, N.; Prieto-Simon, B.; Girbau, D. Recent Advances in Batteryless NFC Sensors for Chemical Sensing and Biosensing. Biosensors 2023, 13, 775. [Google Scholar] [CrossRef] [PubMed]
- Zou, Y.; Bo, L.; Li, Z. Recent progress in human body energy harvesting for smart bioelectronic system. Fundam. Res. 2021, 1, 364–382. [Google Scholar] [CrossRef]
- Zeng, X.; Peng, R.; Fan, Z.; Lin, Y. Self-powered and wearable biosensors for healthcare. Mater. Today Energy 2022, 23, 100900. [Google Scholar] [CrossRef]
- Rong, G.; Zheng, Y.; Sawan, M. Energy Solutions for Wearable Sensors: A Review. Sensors 2021, 21, 3806. [Google Scholar] [CrossRef] [PubMed]
- Sobianin, I.; Psoma, S.D.; Tourlidakis, A. Recent Advances in Energy Harvesting from the Human Body for Biomedical Applications. Energies 2022, 15, 7959. [Google Scholar] [CrossRef]
- Song, Y.; Mukasa, D.; Zhang, H.; Gao, W. Self-Powered Wearable Biosensors. Acc. Mater. Res. 2021, 2, 184–197. [Google Scholar] [CrossRef]
- Liu, M.; Qian, F.; Mi, J.; Zuo, L. Biomechanical energy harvesting for wearable and mobile devices: State-of-the-art and future directions. Appl. Energy 2022, 321, 119379. [Google Scholar] [CrossRef]
- Ali, A.; Shaukat, H.; Bibi, S.; Altabey, W.A.; Noori, M.; Kouritem, S.A. Recent progress in energy harvesting systems for wearable technology. Energy Strategy Rev. 2023, 49, 101124. [Google Scholar] [CrossRef]
- Moghadam, B.H.; Hasanzadeh, M.; Simchi, A. Self-Powered Wearable Piezoelectric Sensors Based on Polymer Nanofiber–Metal–Organic Framework Nanoparticle Composites for Arterial Pulse Monitoring. ACS Appl. Nano Mater. 2020, 3, 8742–8752. [Google Scholar] [CrossRef]
- Xu, L.; Zhang, Z.; Gao, F.; Zhao, X.; Xun, X.; Kang, Z.; Liao, Q.; Zhang, Y. Self-powered ultrasensitive pulse sensors for noninvasive multi-indicators cardiovascular monitoring. Nano Energy 2021, 81, 105614. [Google Scholar] [CrossRef]
- Yoon, S.; Cho, Y.-H. A Skin-attachable Flexible Piezoelectric Pulse Wave Energy Harvester. J. Phys. Conf. Ser. 2014, 557, 012026. [Google Scholar] [CrossRef]
- Zhu, P.; Wang, Y.; Sheng, M.; Wang, Y.; Yu, Y.; Deng, Y. A flexible active dual-parameter sensor for sensitive temperature and physiological signal monitoring via integrating thermoelectric and piezoelectric conversion. J. Mater. Chem. A 2019, 7, 8258–8267. [Google Scholar] [CrossRef]
- Li, S.; Wang, H.; Ma, W.; Qiu, L.; Xia, K.; Zhang, Y.; Lu, H.; Zhu, M.; Liang, X.; Wu, X.E.; et al. Monitoring blood pressure and cardiac function without positioning via a deep learning-assisted strain sensor array. Sci. Adv. 2023, 9, eadh0615. [Google Scholar] [CrossRef]
- Wang, Y.; Zhu, L.; Du, C. Progress in Piezoelectric Nanogenerators Based on PVDF Composite Films. Micromachines 2021, 12, 1278. [Google Scholar] [CrossRef] [PubMed]
- Shi, X.; Sun, Y.; Li, D.; Liu, H.; Xie, W.; Luo, X. Advances in wearable flexible piezoelectric energy harvesters: Materials, structures, and fabrication. J. Mater. Sci. Mater. Electron. 2023, 34, 220. [Google Scholar] [CrossRef]
- Ruiz-Gonzalez, A.; Wang, M.; Haseloff, J. Sustainable Approaches to Incorporate Plant-Based Biomaterials in Power Generation. Solids 2023, 4, 133–155. [Google Scholar] [CrossRef]
- Wang, Z.; Li, N.; Zhang, Z.; Cui, X.; Zhang, H. Hydrogel-Based Energy Harvesters and Self-Powered Sensors for Wearable Applications. Nanoenergy Adv. 2023, 3, 315–342. [Google Scholar] [CrossRef]
- Maria Joseph Raj, N.P.; Alluri, N.R.; Vivekananthan, V.; Chandrasekhar, A.; Khandelwal, G.; Kim, S.-J. Sustainable yarn type-piezoelectric energy harvester as an eco-friendly, cost-effective battery-free breath sensor. Appl. Energy 2018, 228, 1767–1776. [Google Scholar] [CrossRef]
- Sasikumar, R.; Kim, B.; Bhattarai, R.M. Dysprosium tungstate incorporated on exfoliated layered molybdenum disulfide-based a flexible and wearable piezoelectric nanogenerator for the dual purpose of self-powered energy harvesting and a smart mask for human breath monitoring. Nano Energy 2023, 118, 109024. [Google Scholar] [CrossRef]
- Liao, H.; Wang, Y.; Shi, Q.; Huang, R.; Gao, F. Optimization of a Piezoelectric Bending Beam-based Human Knee Energy Harvester. In Proceedings of the 2023 IEEE International Conference on Mechatronics and Automation (ICMA), Harbin, China, 6–9 August 2023; pp. 1478–1483. [Google Scholar]
- Zhao, B.; Qian, F.; Hatfield, A.; Zuo, L.; Xu, T.-B. A Review of Piezoelectric Footwear Energy Harvesters: Principles, Methods, and Applications. Sensors 2023, 23, 5841. [Google Scholar] [CrossRef] [PubMed]
- Rayegani, A.; Saberian, M.; Delshad, Z.; Liang, J.; Sadiq, M.; Nazar, A.M.; Mohsan, S.A.H.; Khan, M.A. Recent Advances in Self-Powered Wearable Sensors Based on Piezoelectric and Triboelectric Nanogenerators. Biosensors 2023, 13, 37. [Google Scholar] [CrossRef] [PubMed]
- Mahanty, B.; Ghosh, S.K.; Maity, K.; Roy, K.; Sarkar, S.; Mandal, D. All-fiber pyro- and piezo-electric nanogenerator for IoT based self-powered health-care monitoring. Mater. Adv. 2021, 2, 4370–4379. [Google Scholar] [CrossRef]
- Iqbal, M.; Nauman, M.M.; Khan, F.U.; Abas, P.E.; Cheok, Q.; Iqbal, A.; Aissa, B. Multimodal Hybrid Piezoelectric-Electromagnetic Insole Energy Harvester Using PVDF Generators. Electronics 2020, 9, 635. [Google Scholar] [CrossRef]
- Calvert, J.W.; Lefer, D.J. Chapter 6—Overview of Cardiac Muscle Physiology. In Muscle; Hill, J.A., Olson, E.N., Eds.; Academic Press: Boston, MA, USA; Waltham, MA, USA, 2012; pp. 57–66. [Google Scholar]
- Guo, C.-Y.; Wang, K.-J.; Hsieh, T.-L. Piezoelectric Sensor for the Monitoring of Arterial Pulse Wave: Detection of Arrhythmia Occurring in PAC/PVC Patients. Sensors 2021, 21, 6915. [Google Scholar] [CrossRef]
- Zhu, P.; Wang, Y.; Wang, Y.; Mao, H.; Zhang, Q.; Deng, Y. Flexible 3D Architectured Piezo/Thermoelectric Bimodal Tactile Sensor Array for E-Skin Application. Adv. Energy Mater. 2020, 10, 2001945. [Google Scholar] [CrossRef]
- Boonya-ananta, T.; Rodriguez, A.J.; Ajmal, A.; Du Le, V.N.; Hansen, A.K.; Hutcheson, J.D.; Ramella-Roman, J.C. Synthetic photoplethysmography (PPG) of the radial artery through parallelized Monte Carlo and its correlation to body mass index (BMI). Sci. Rep. 2021, 11, 2570. [Google Scholar] [CrossRef]
- Shi, Y.; Lawford, P.; Hose, R. Review of Zero-D and 1-D Models of Blood Flow in the Cardiovascular System. Biomed. Eng. Online 2011, 10, 33. [Google Scholar] [CrossRef]
- Hlaváč, I.M. Windkessel Model Analysis in Matlab. In Proceedings of the 10th Student Electrical Engineering, Information and Communication Technologies (EEICT) Conference, 2004; Brno University of Technology: Brno, Czechia, 2004. Available online: http://www.ecmosimulation.com/data/Hlavac.pdf (accessed on 18 November 2023).
- Sobianin, I.; Psoma, S.D.; Tourlidakis, A. A hybrid piezoelectric and electrostatic energy harvester for scavenging arterial pulsations. Mater. Today Proc. 2023, 93, 16–23. [Google Scholar] [CrossRef]
- Schneider, C.A.; Rasband, W.S.; Eliceiri, K.W. NIH Image to ImageJ: 25 years of image analysis. Nat. Methods 2012, 9, 671–675. [Google Scholar] [CrossRef] [PubMed]


| Property | Variable | Value | Unit |
|---|---|---|---|
| Density | rho | 1100 | kg/m3 |
| Young’s modulus | E | 4.5 | kPa |
| Poisson’s ratio | nu | 0.40 | 1 |
| Parameter | Value |
|---|---|
| Print core | 0.4 mm |
| Line width | 120% |
| Print temperature | 220.0 (initial layer: 215.0) °C |
| Bed temperature | 65.0 (initial layer: 70.0) °C |
| Speed | 60.0 mm/s |
| Initial layer height | 270 μm |
| Parameter | Default Value | Optimized Value |
|---|---|---|
| Print core | 0.4 mm | 0.4 mm |
| Initial layer line width | 120% | 80% |
| Print temperature | 235 (initial layer: 233.0) °C | 243.0 (initial layer: 235.0) °C |
| Build plate temperature | 60.0 (initial layer: 55.0) °C | 70.0 (initial layer: 65.0) °C |
| Print speed | 25.0 mm/s | 25.0 mm/s |
| Initial layer height | 270 μm | 100 μm |
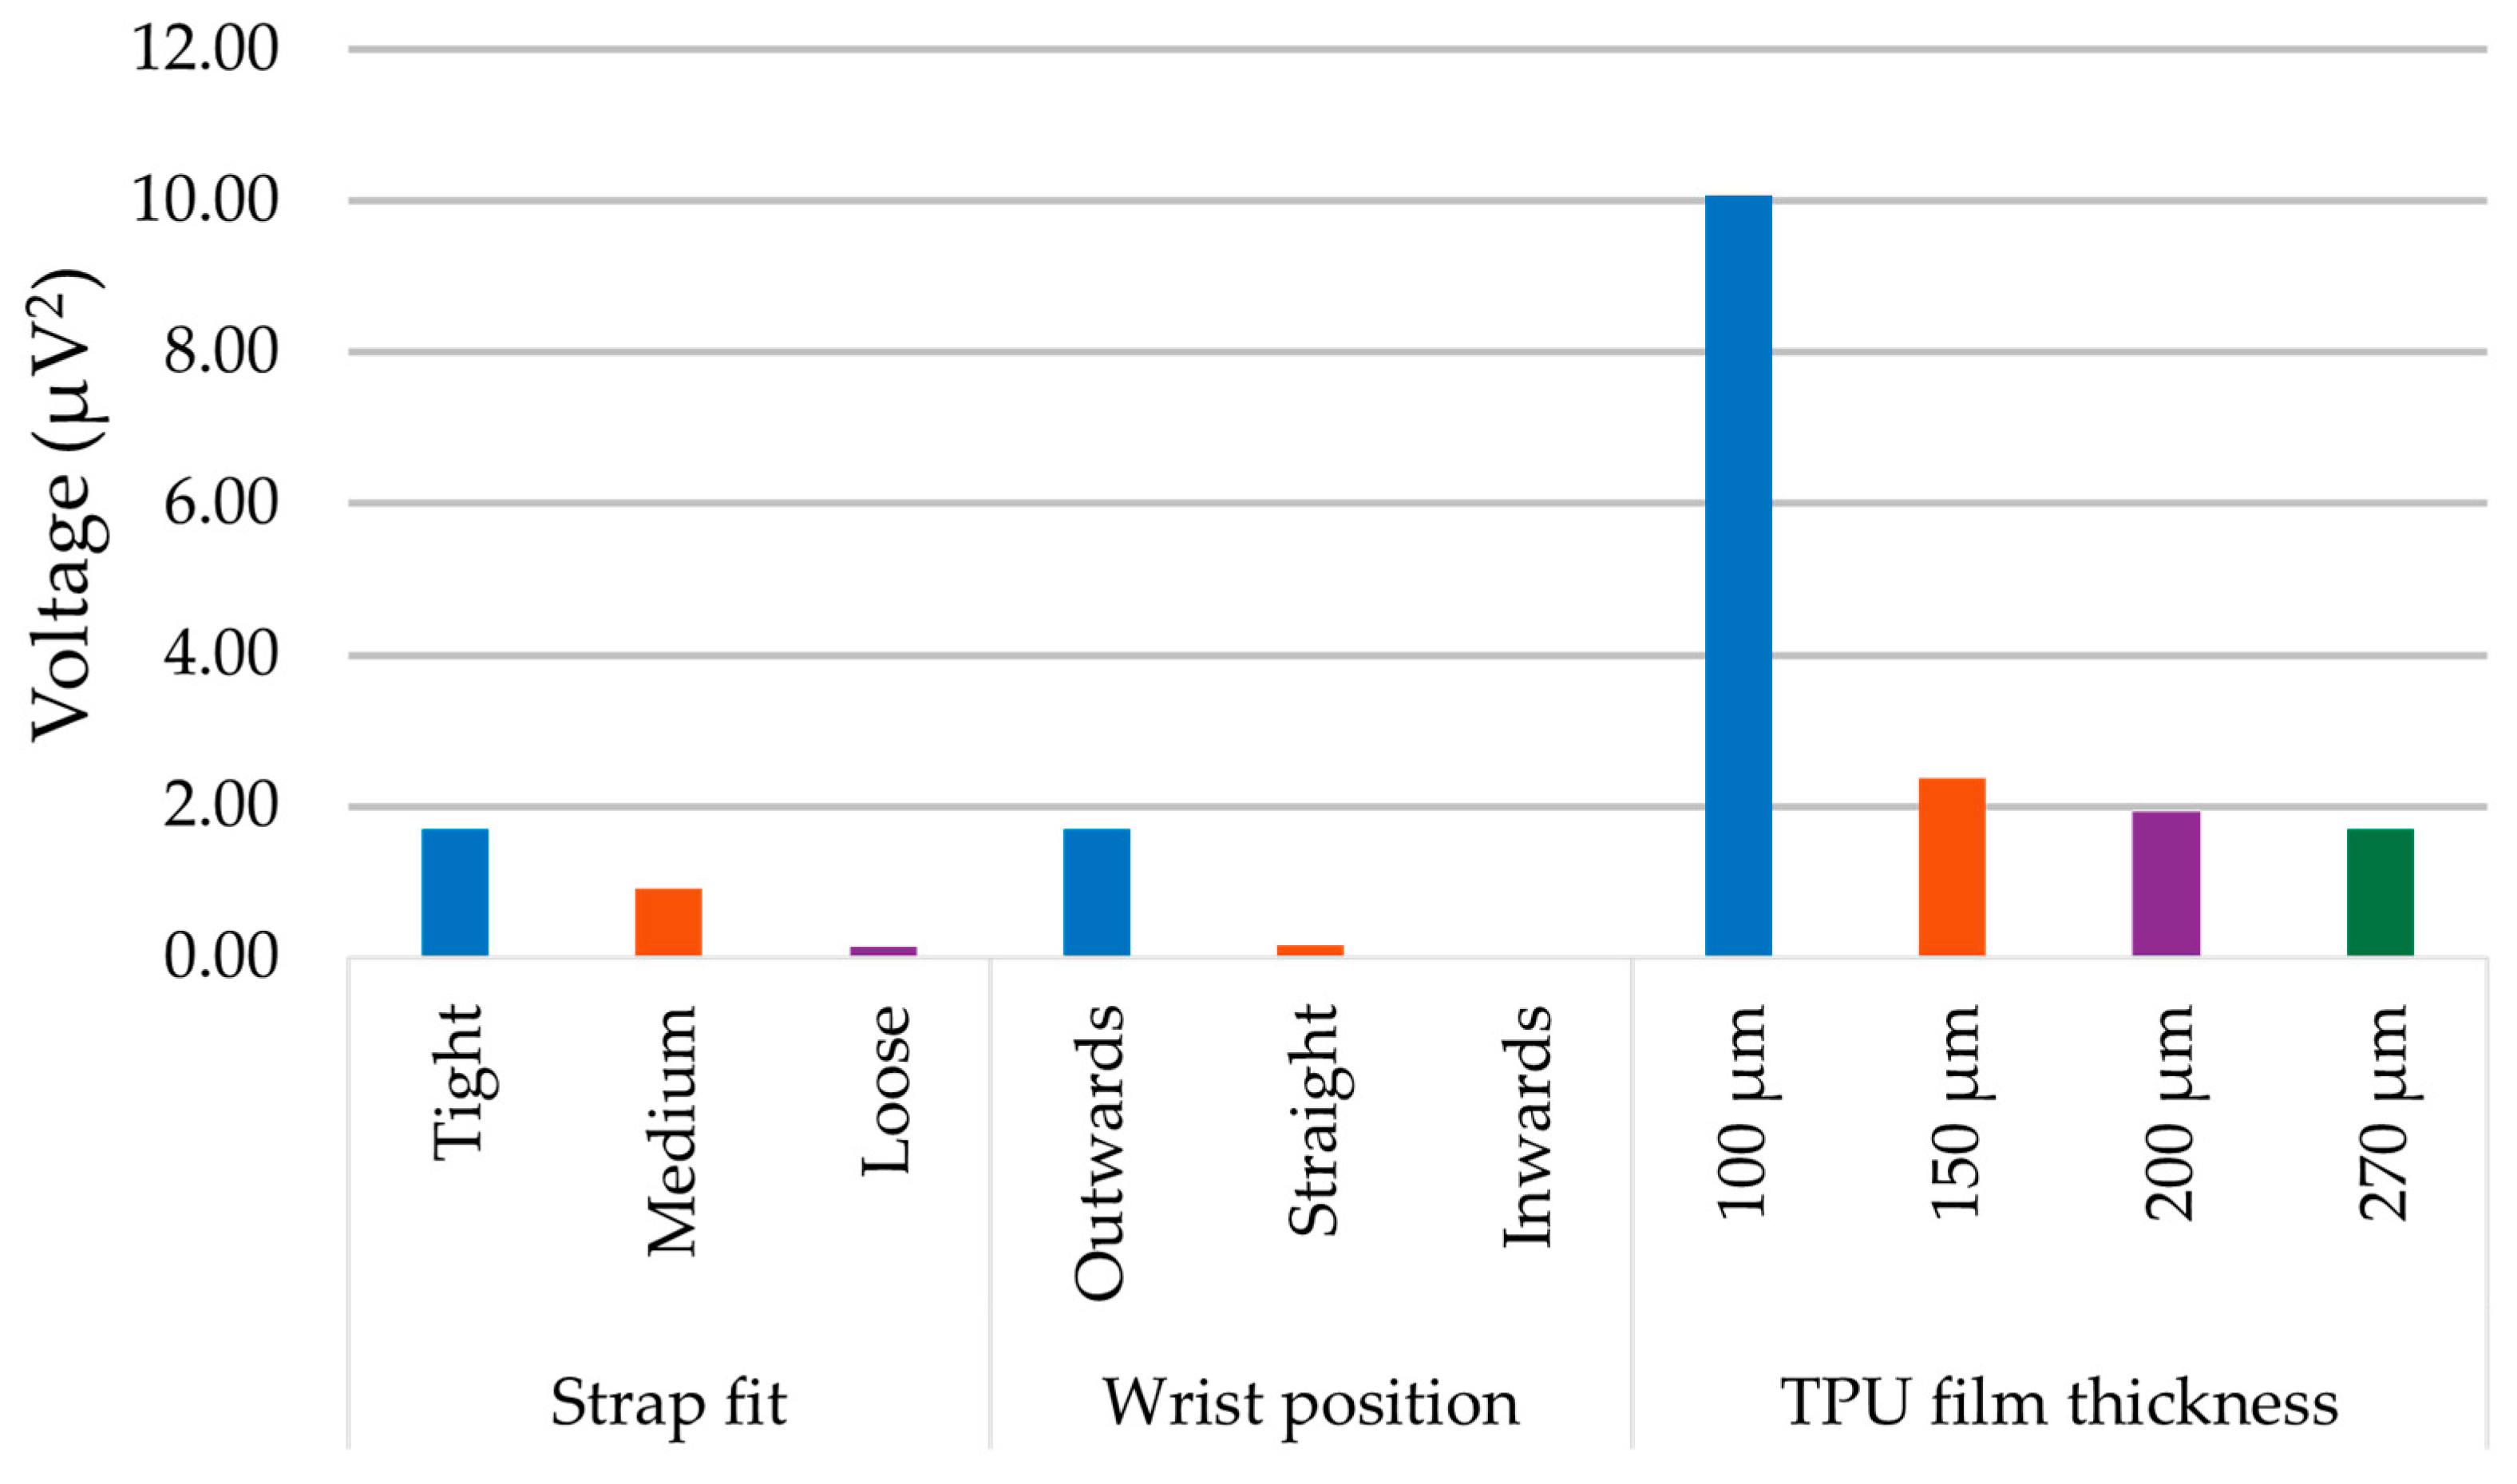
| “Loose” | the harvester was gently pressed against the skin with quite significant play in between the strap and the wrist |
| “Medium” | a comfortable fit that fixed the harvester in place yet allowed it to have some movement, akin to how a watch or a fitness tracker would be worn |
| “Tight” | the harvester did not have any play and was firmly pressed against the wrist, a borderline fit which did not induce pain |
Disclaimer/Publisher’s Note: The statements, opinions and data contained in all publications are solely those of the individual author(s) and contributor(s) and not of MDPI and/or the editor(s). MDPI and/or the editor(s) disclaim responsibility for any injury to people or property resulting from any ideas, methods, instructions or products referred to in the content. |
© 2024 by the authors. Licensee MDPI, Basel, Switzerland. This article is an open access article distributed under the terms and conditions of the Creative Commons Attribution (CC BY) license (https://creativecommons.org/licenses/by/4.0/).
Share and Cite
Sobianin, I.; Psoma, S.D.; Tourlidakis, A. A 3D-Printed Piezoelectric Microdevice for Human Energy Harvesting for Wearable Biosensors. Micromachines 2024, 15, 118. https://doi.org/10.3390/mi15010118
Sobianin I, Psoma SD, Tourlidakis A. A 3D-Printed Piezoelectric Microdevice for Human Energy Harvesting for Wearable Biosensors. Micromachines. 2024; 15(1):118. https://doi.org/10.3390/mi15010118
Chicago/Turabian StyleSobianin, Ihor, Sotiria D. Psoma, and Antonios Tourlidakis. 2024. "A 3D-Printed Piezoelectric Microdevice for Human Energy Harvesting for Wearable Biosensors" Micromachines 15, no. 1: 118. https://doi.org/10.3390/mi15010118
APA StyleSobianin, I., Psoma, S. D., & Tourlidakis, A. (2024). A 3D-Printed Piezoelectric Microdevice for Human Energy Harvesting for Wearable Biosensors. Micromachines, 15(1), 118. https://doi.org/10.3390/mi15010118