Multi-Features Classification of Prostate Carcinoma Observed in Histological Sections: Analysis of Wavelet-Based Texture and Colour Features

 ,
, 
 ,
,
Abstract
:
1. Introduction
2. Materials and Methods
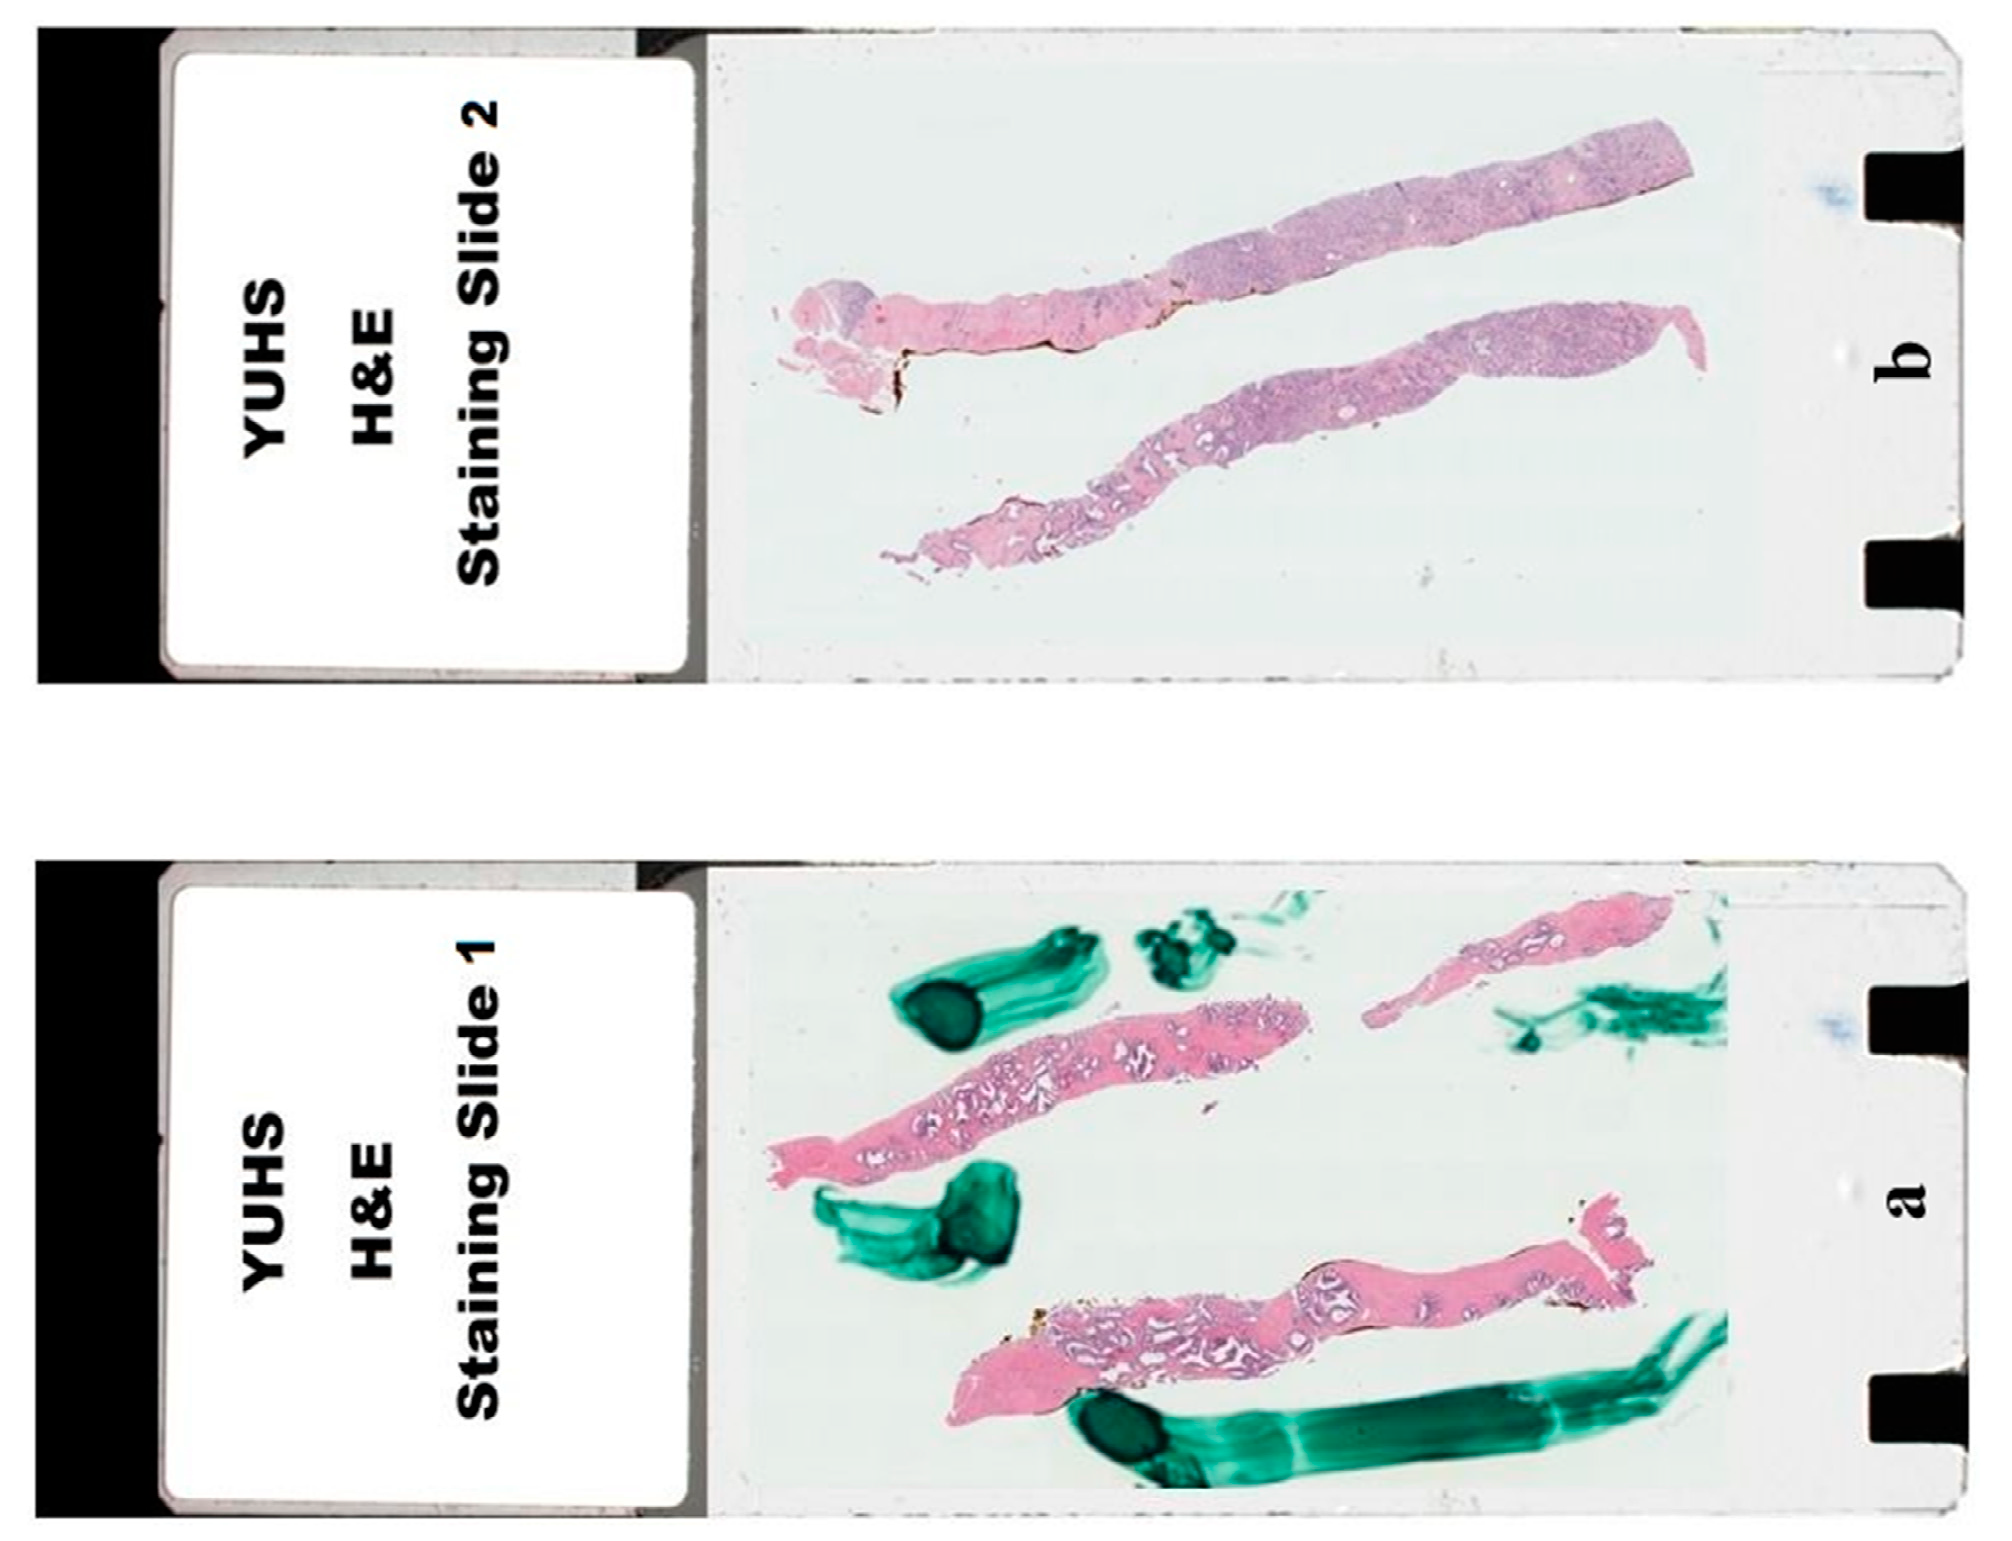
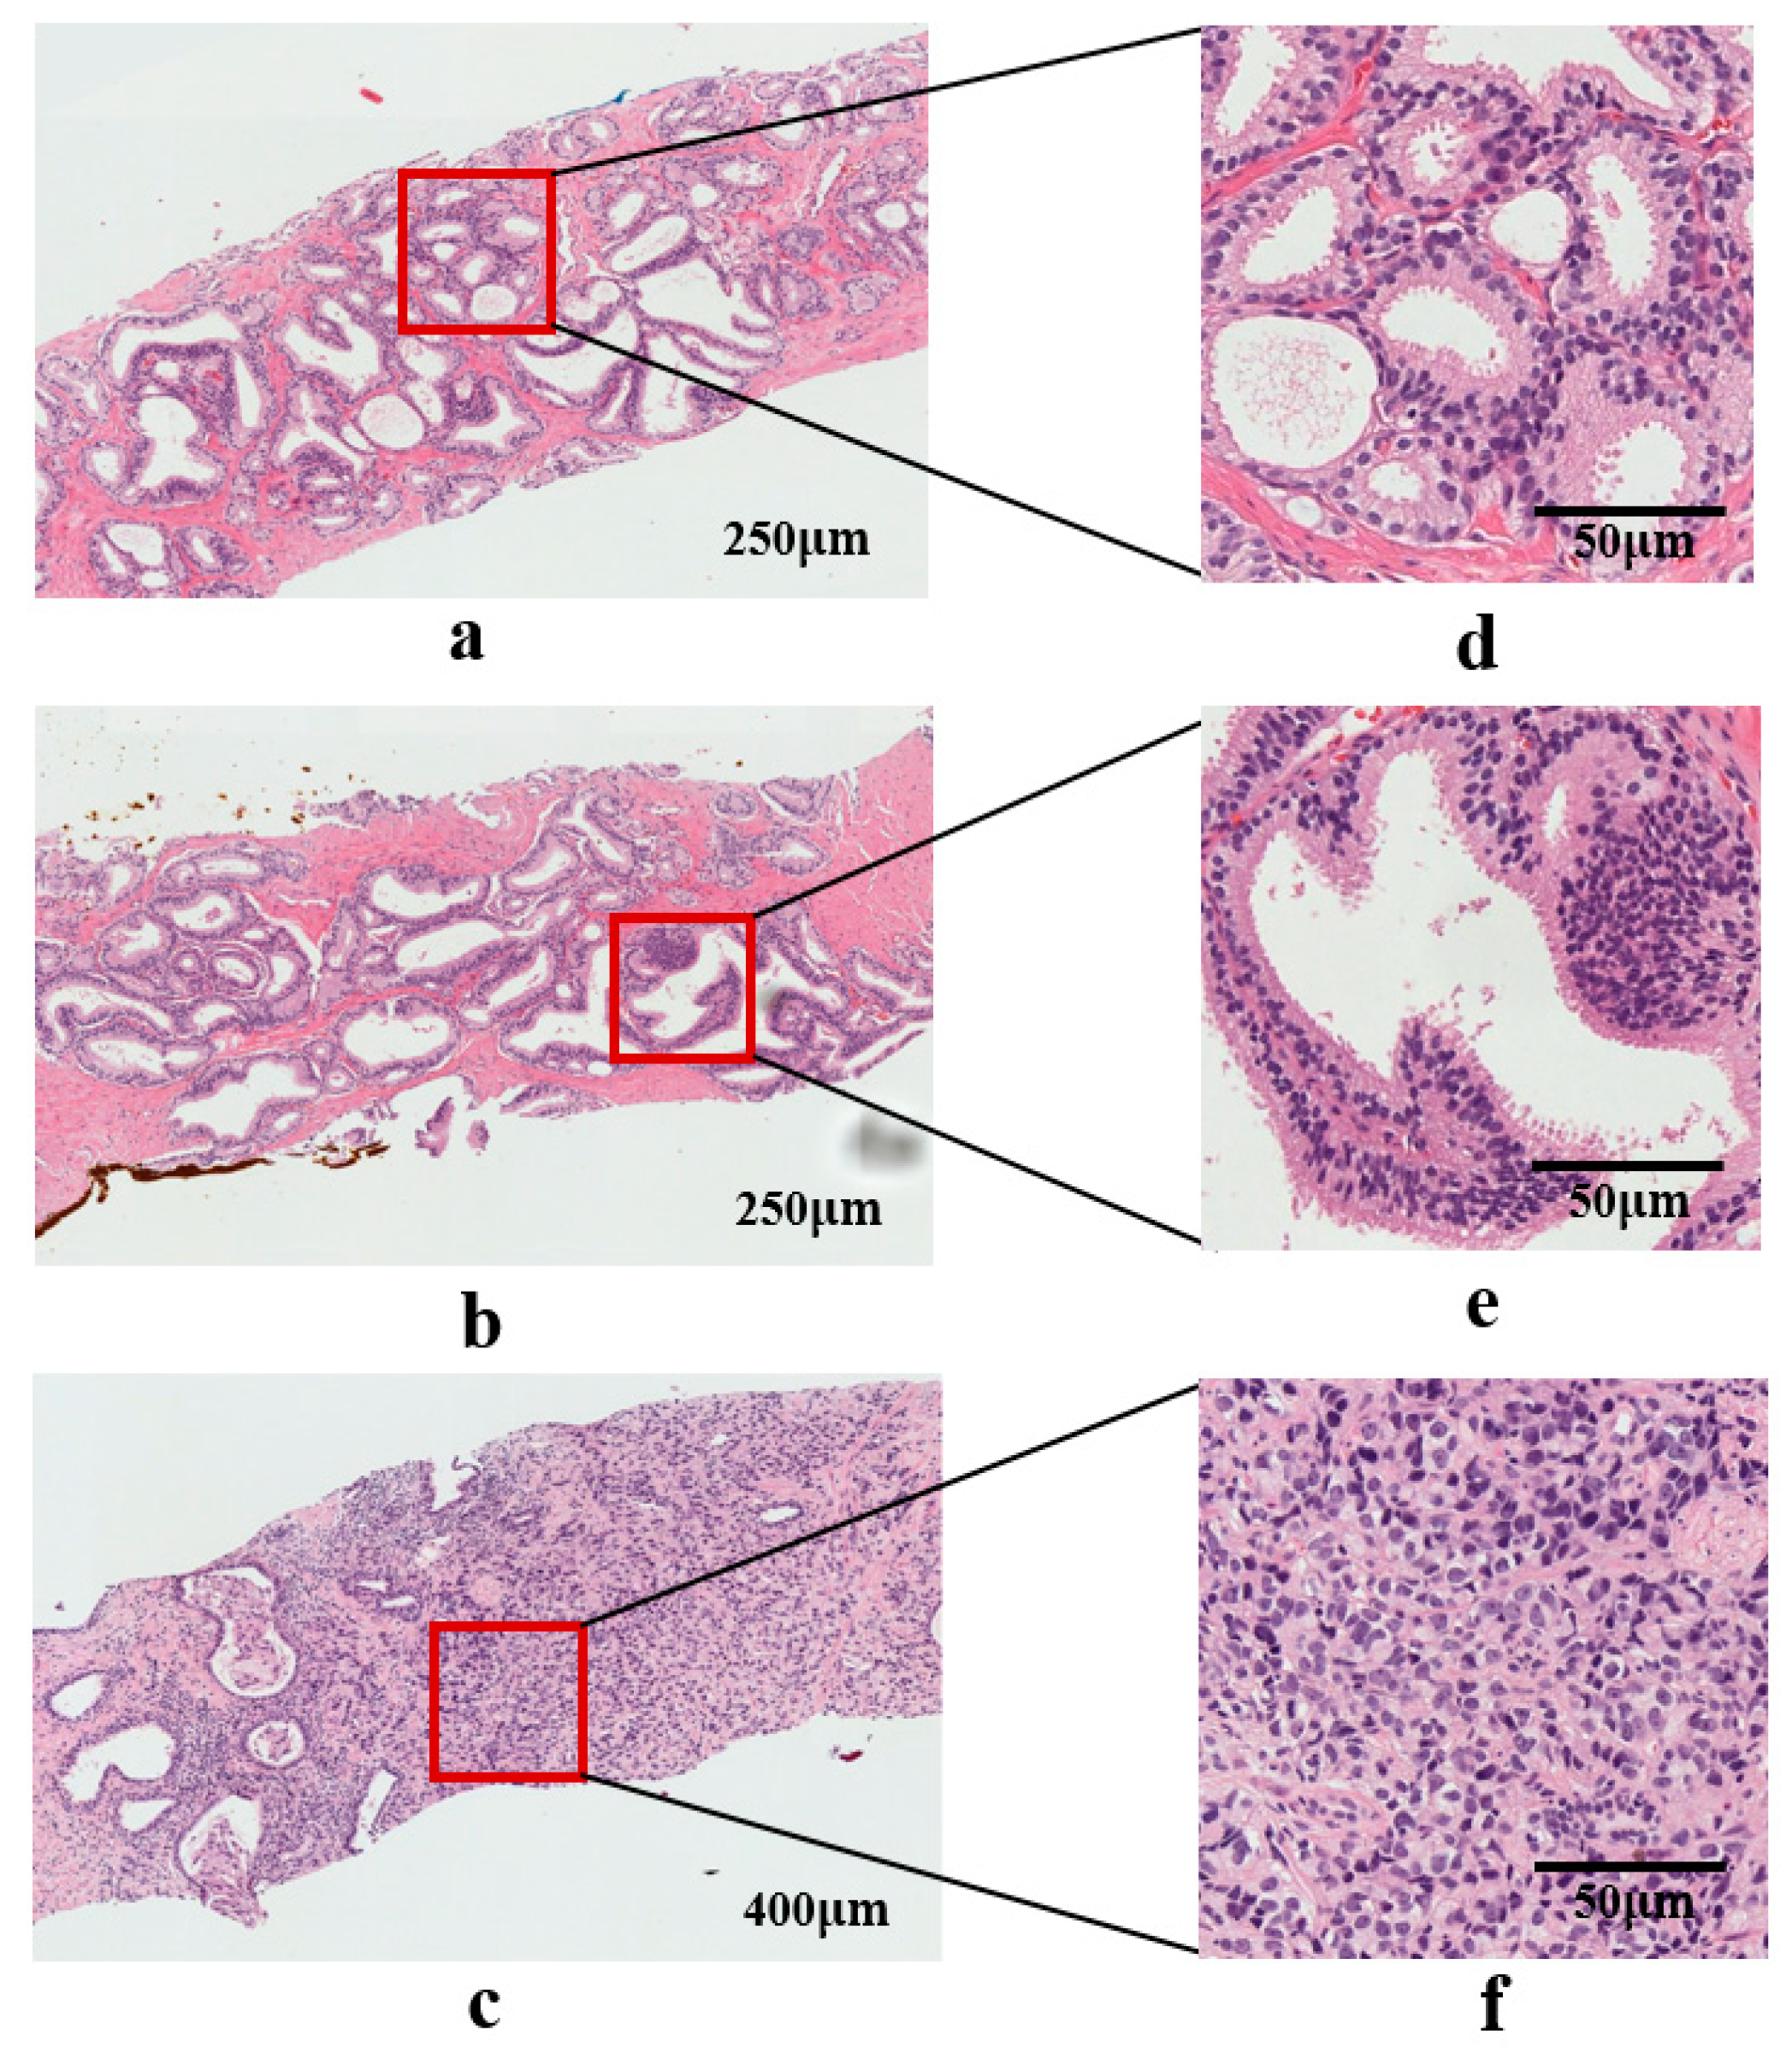
2.1. Dataset Preparation
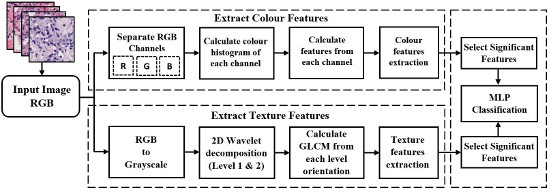
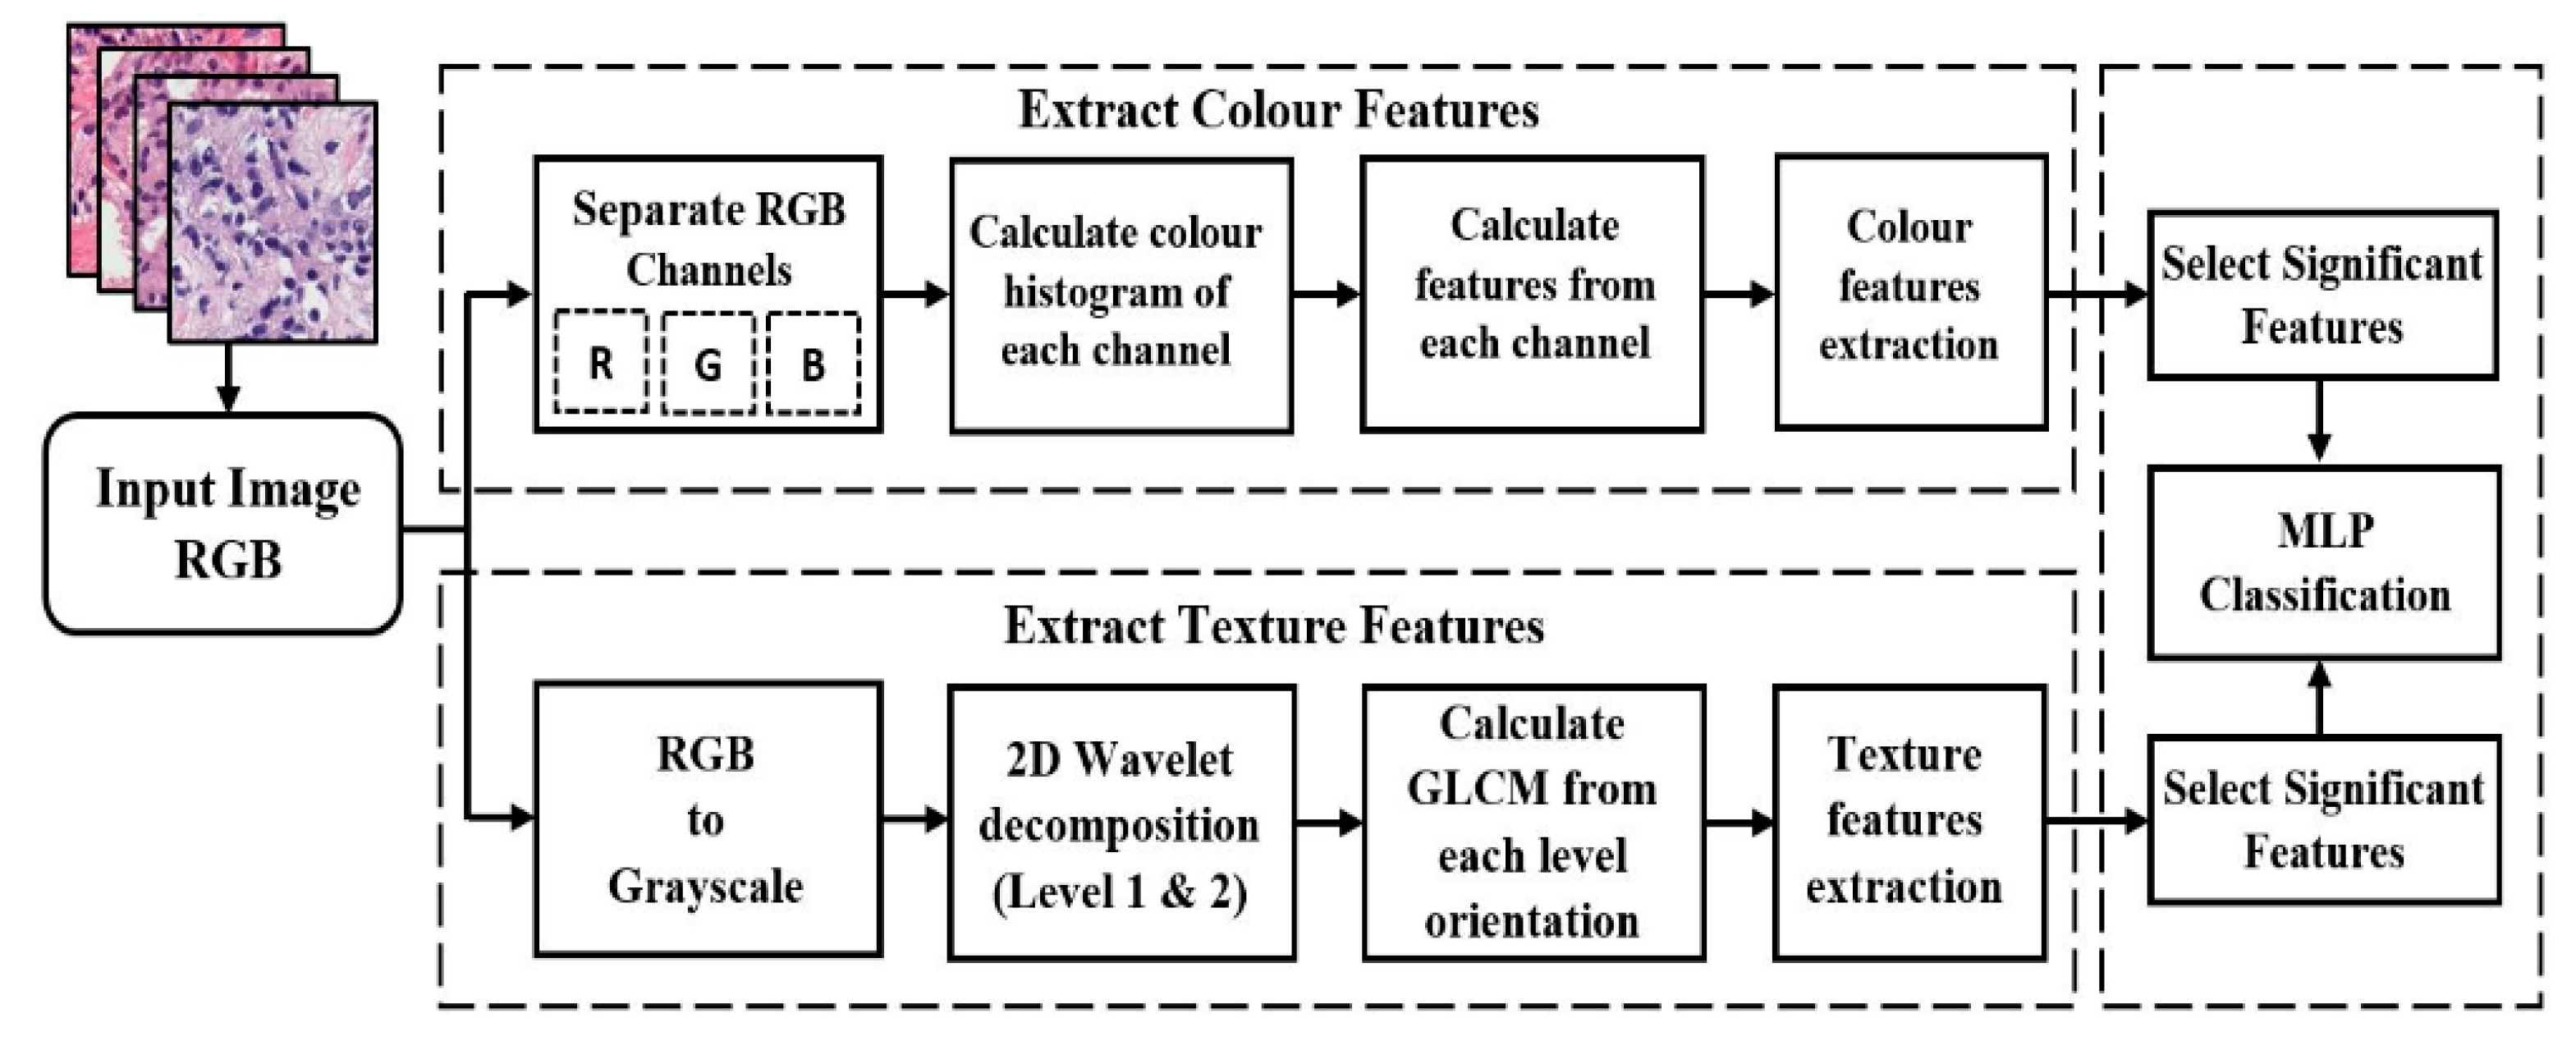
2.2. Proposed Pipeline for Analysis and Classification
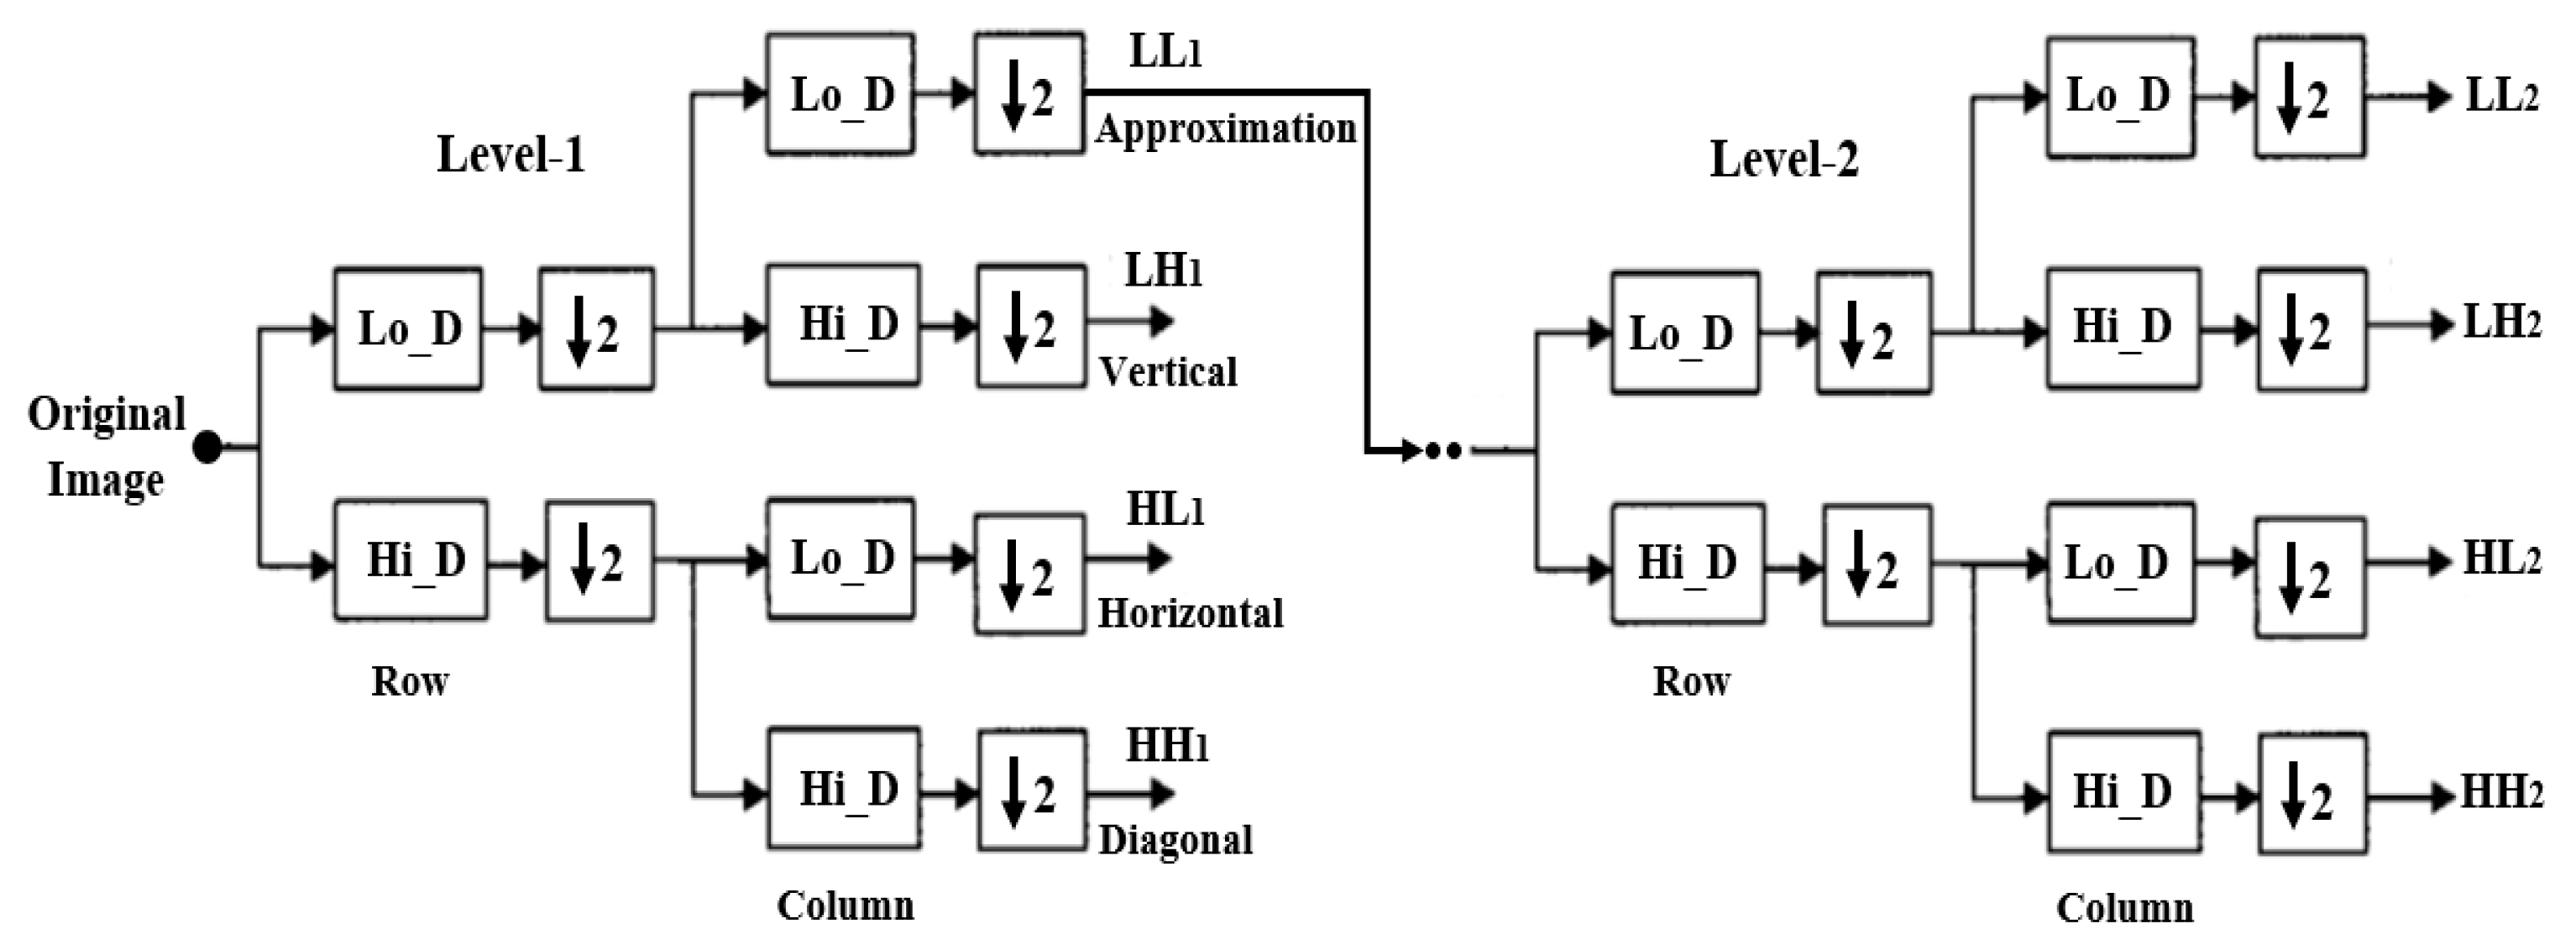
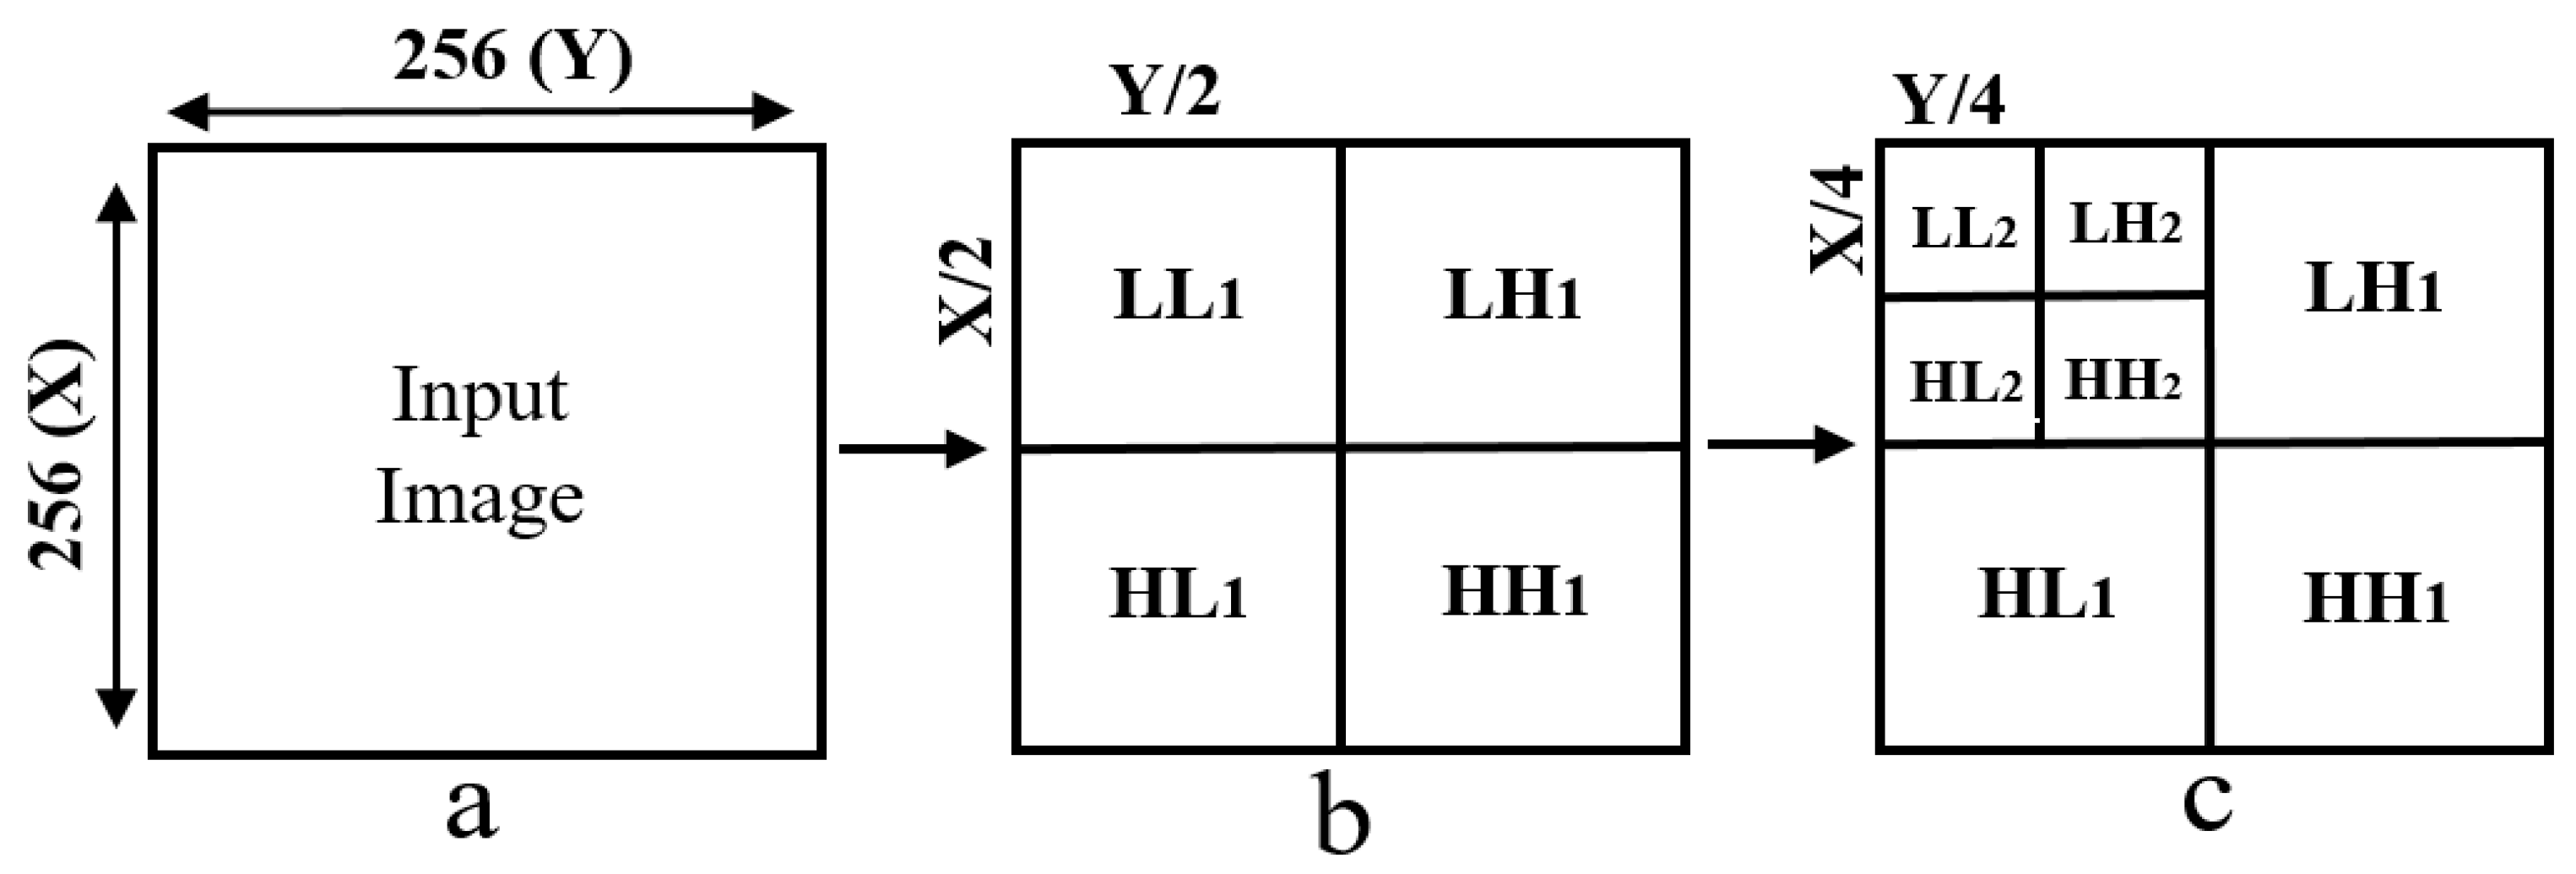
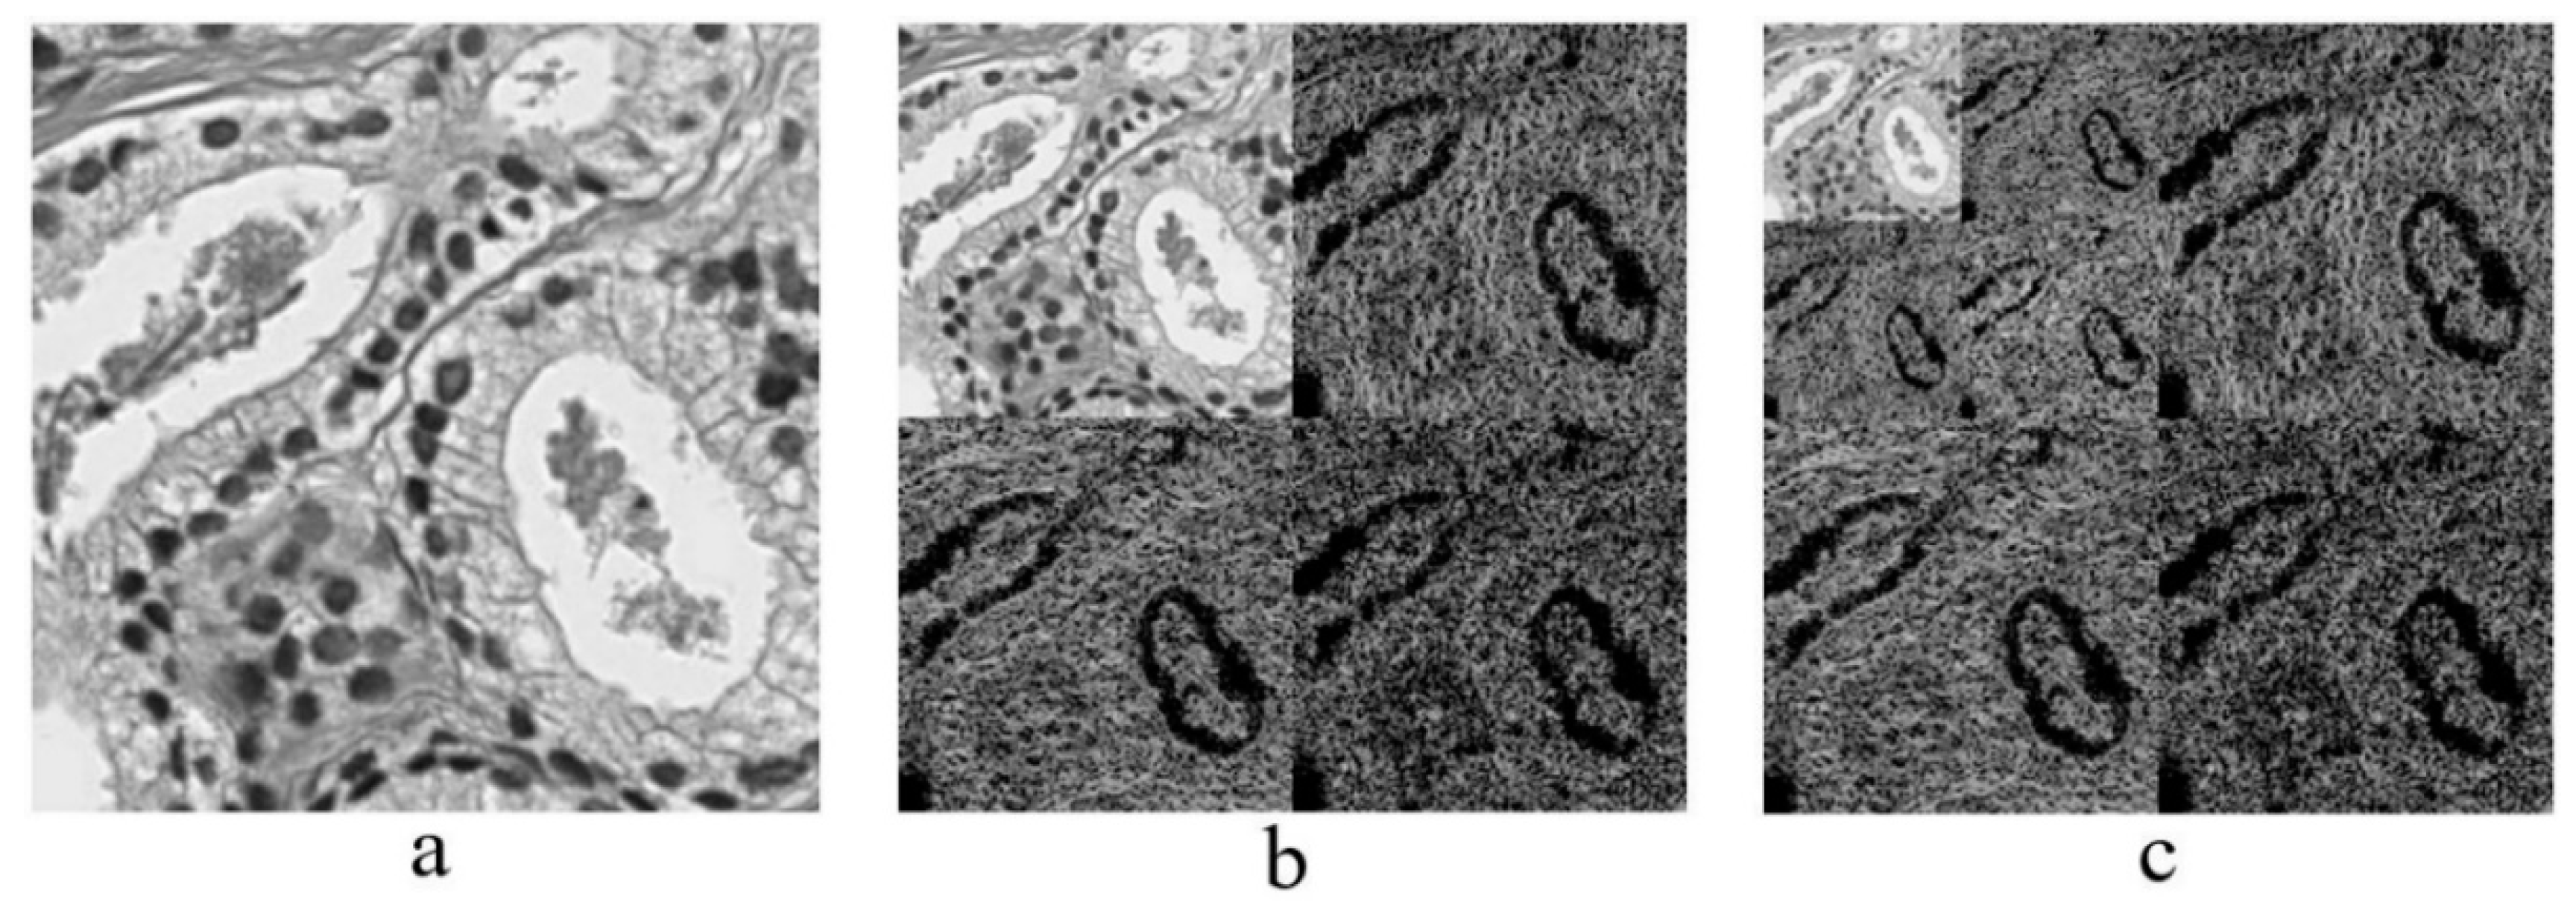
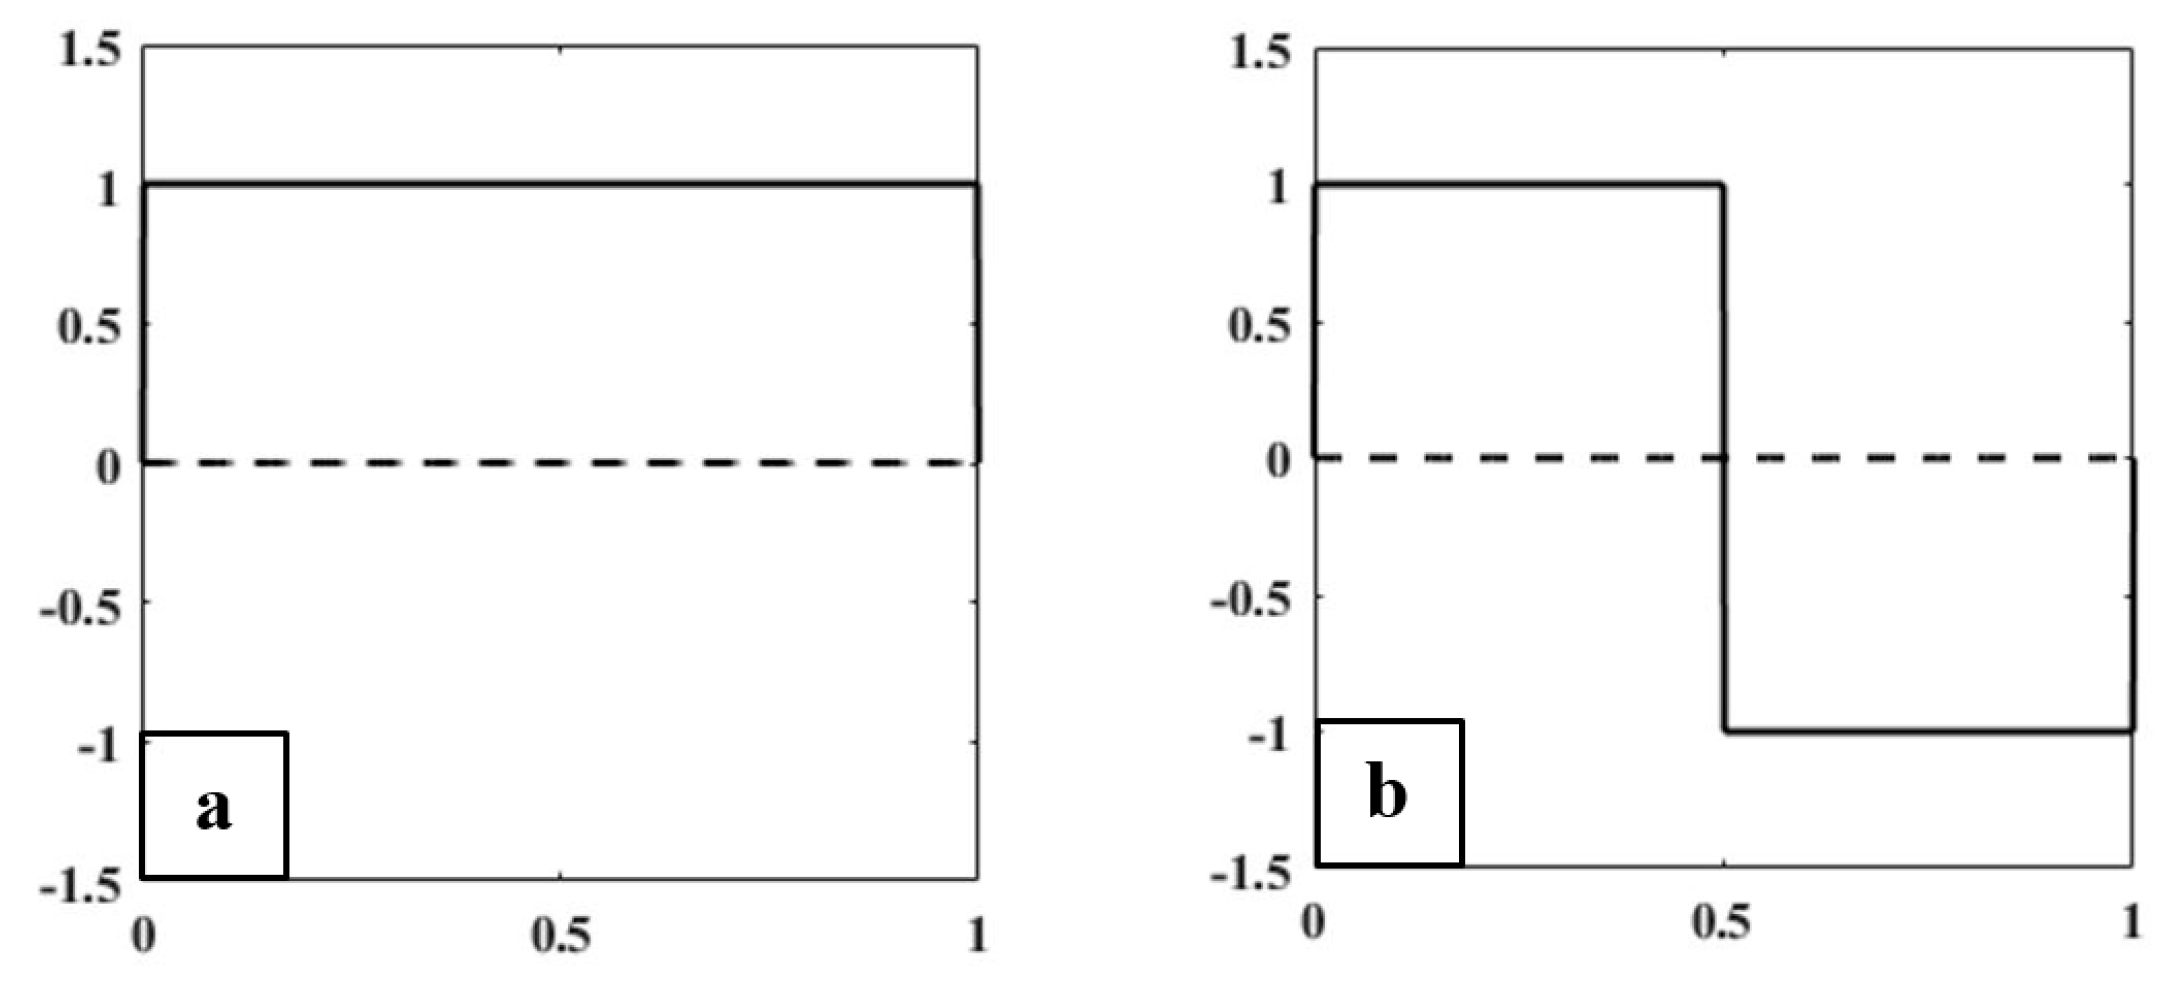
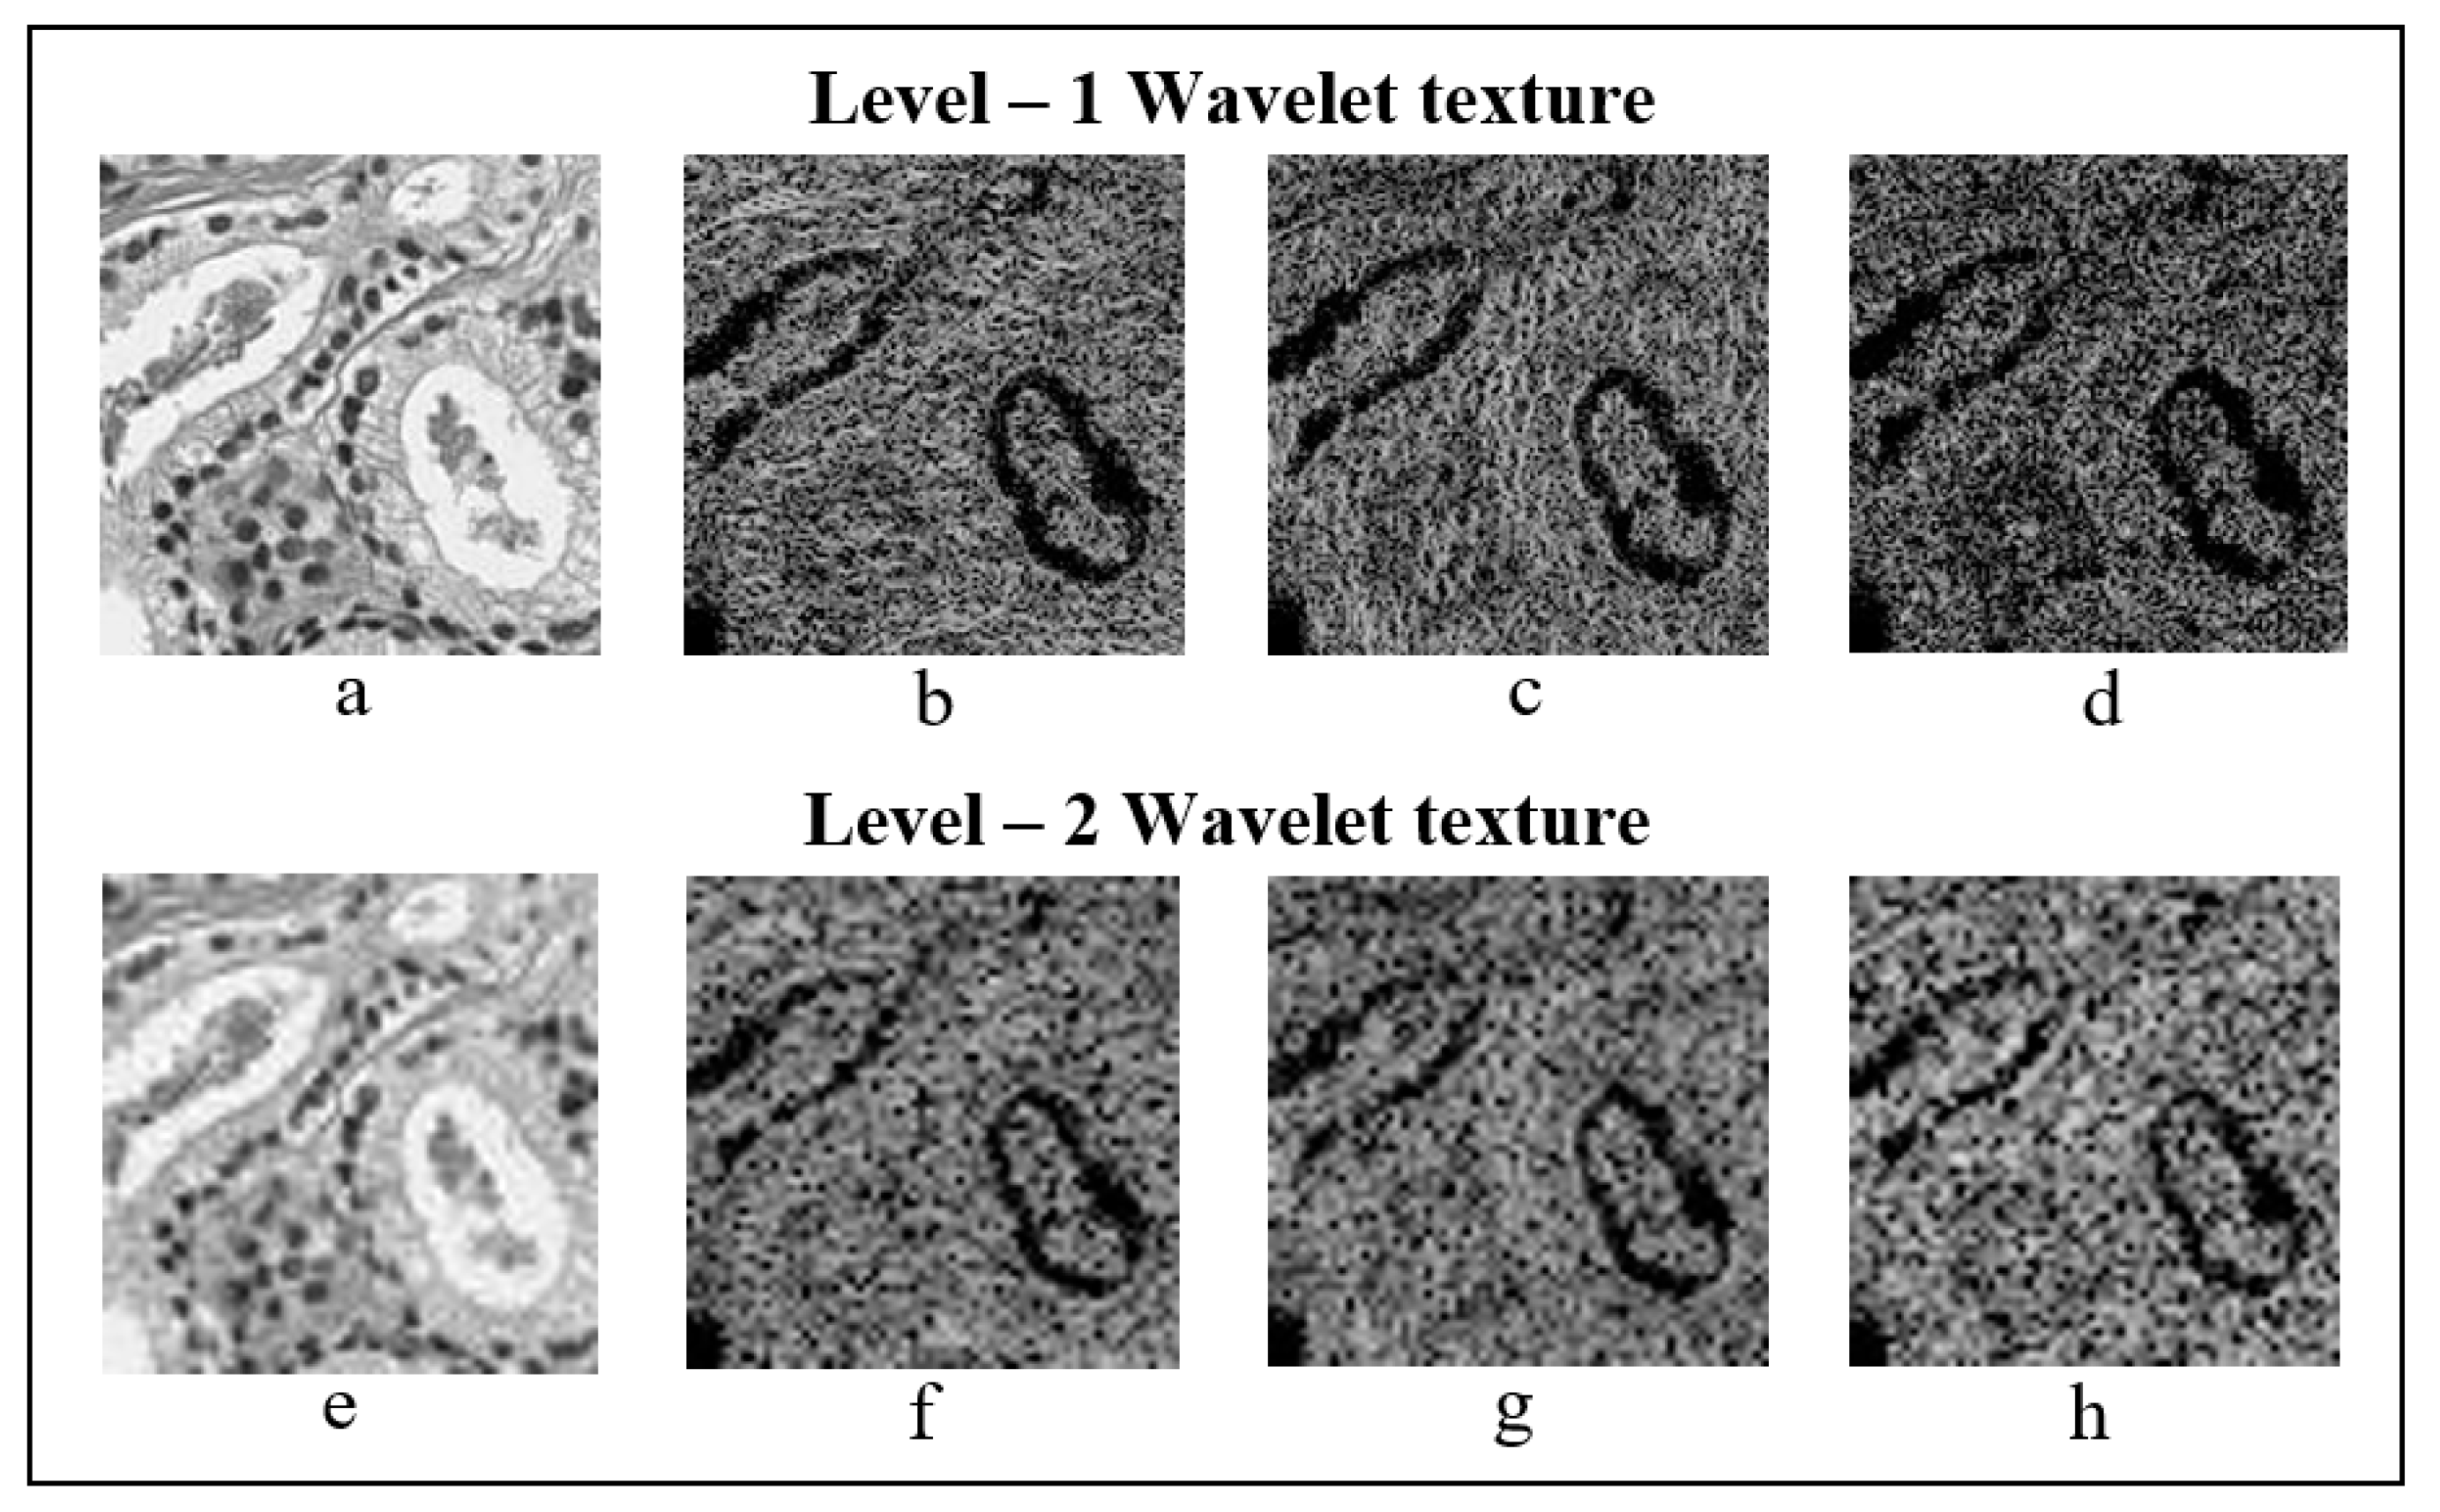
2.3. Discrete Wavelet Transform
Haar Wavelet Transform
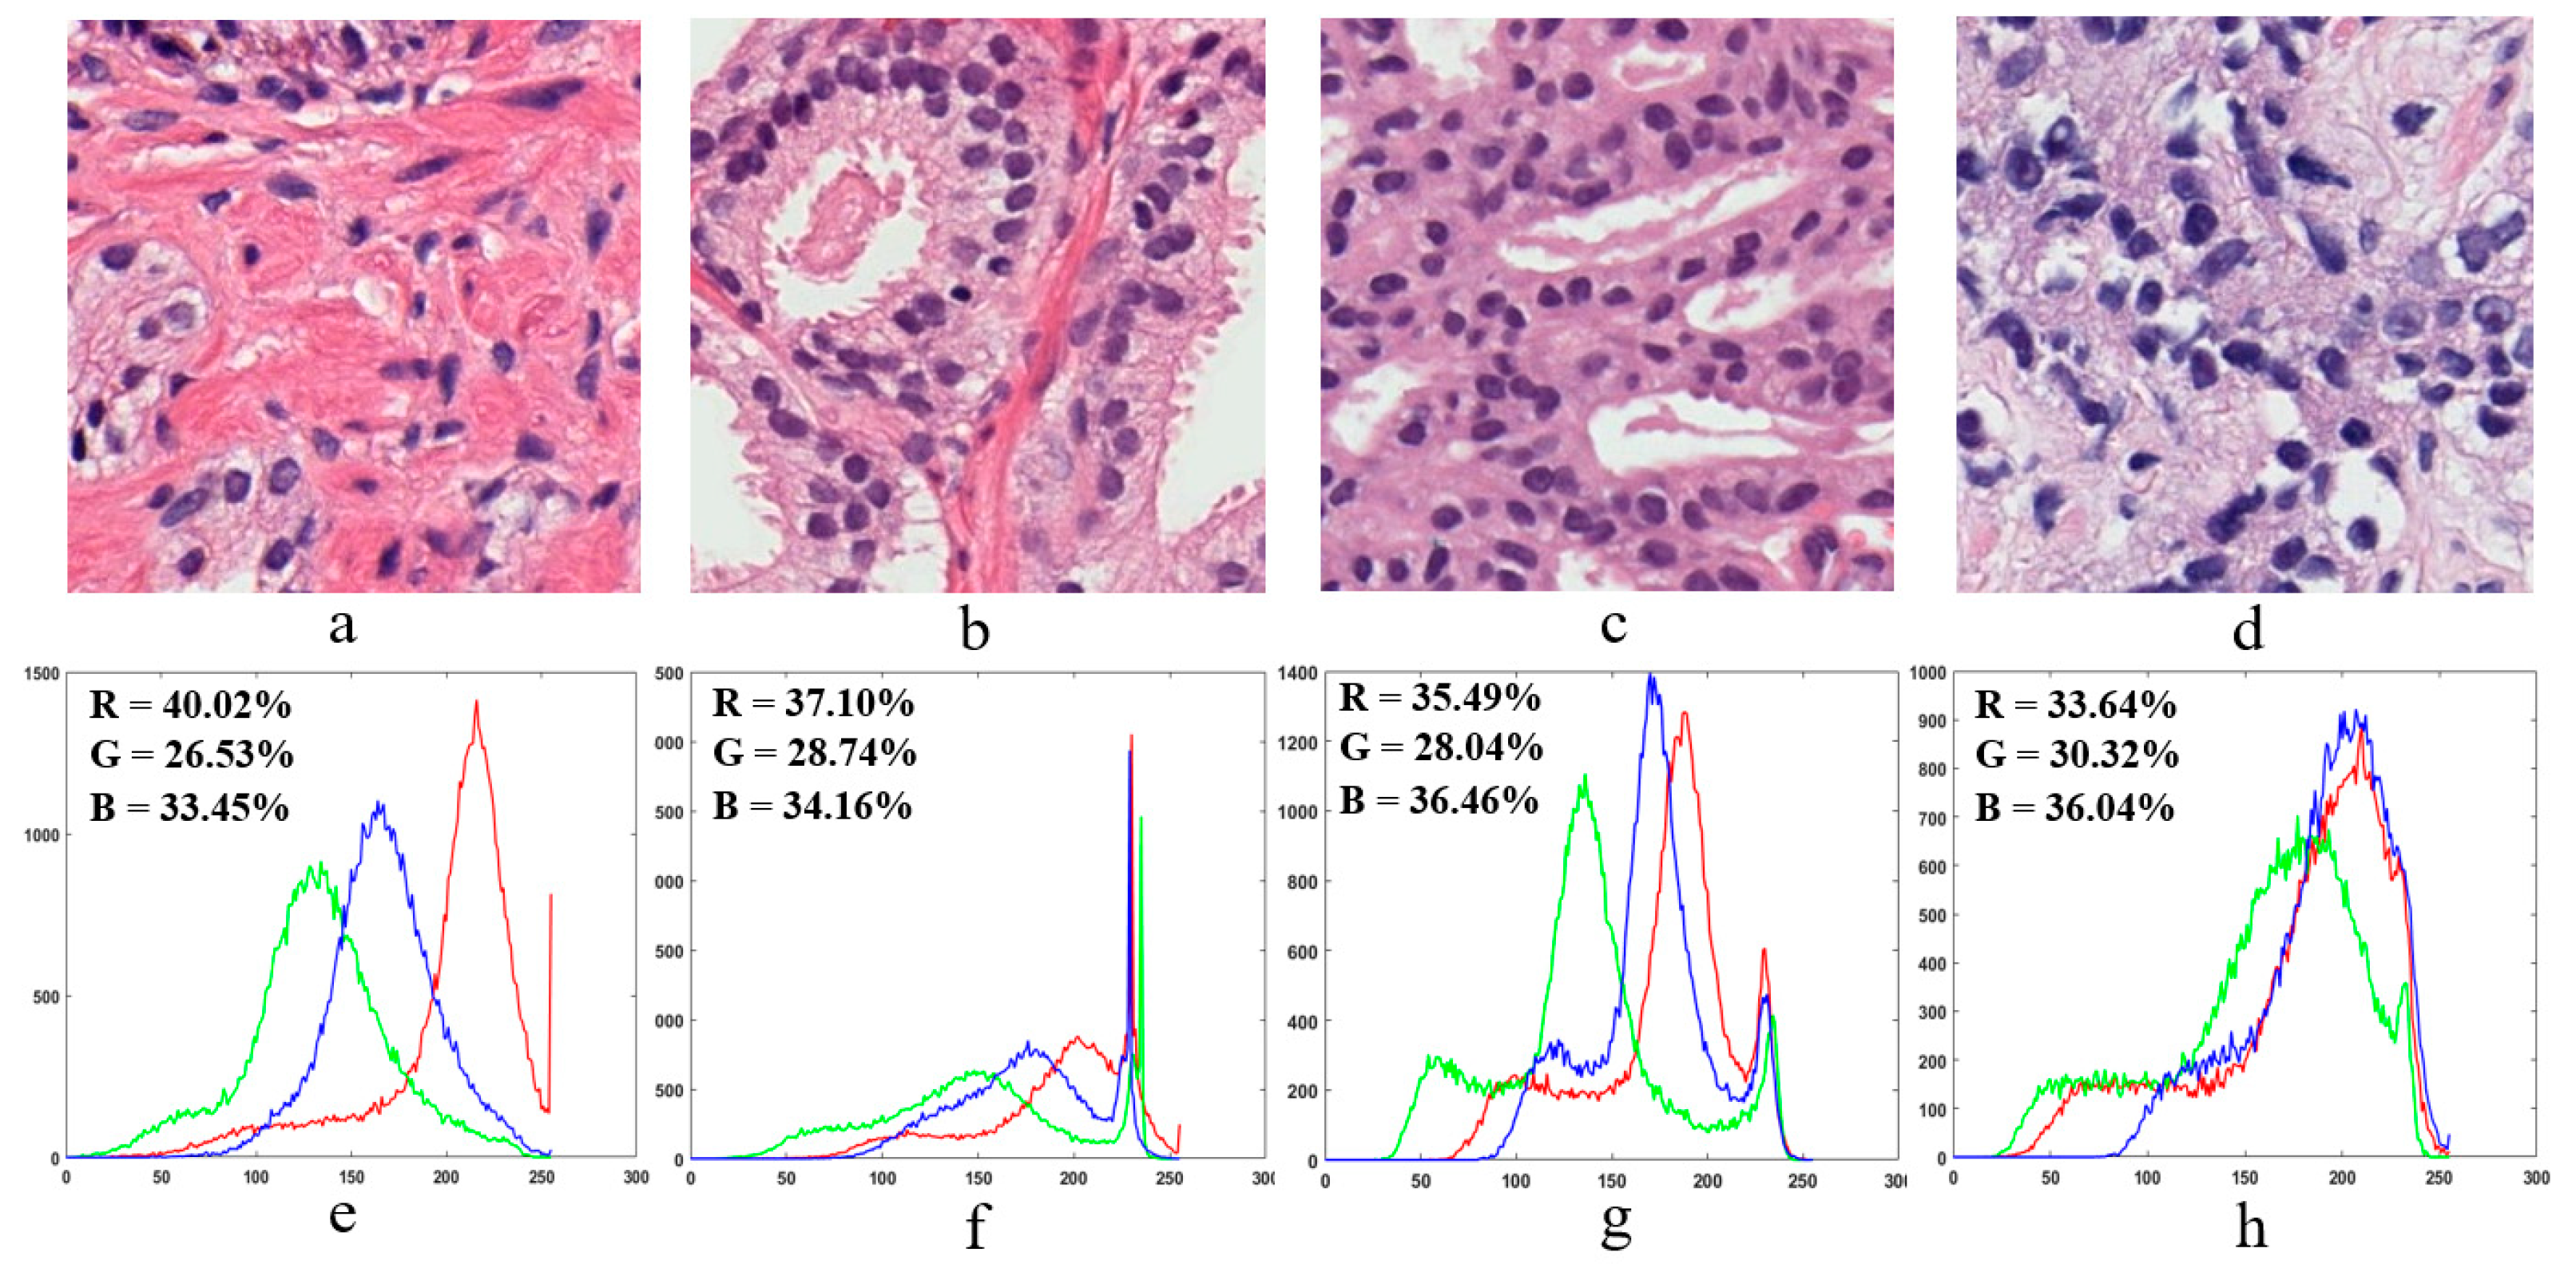
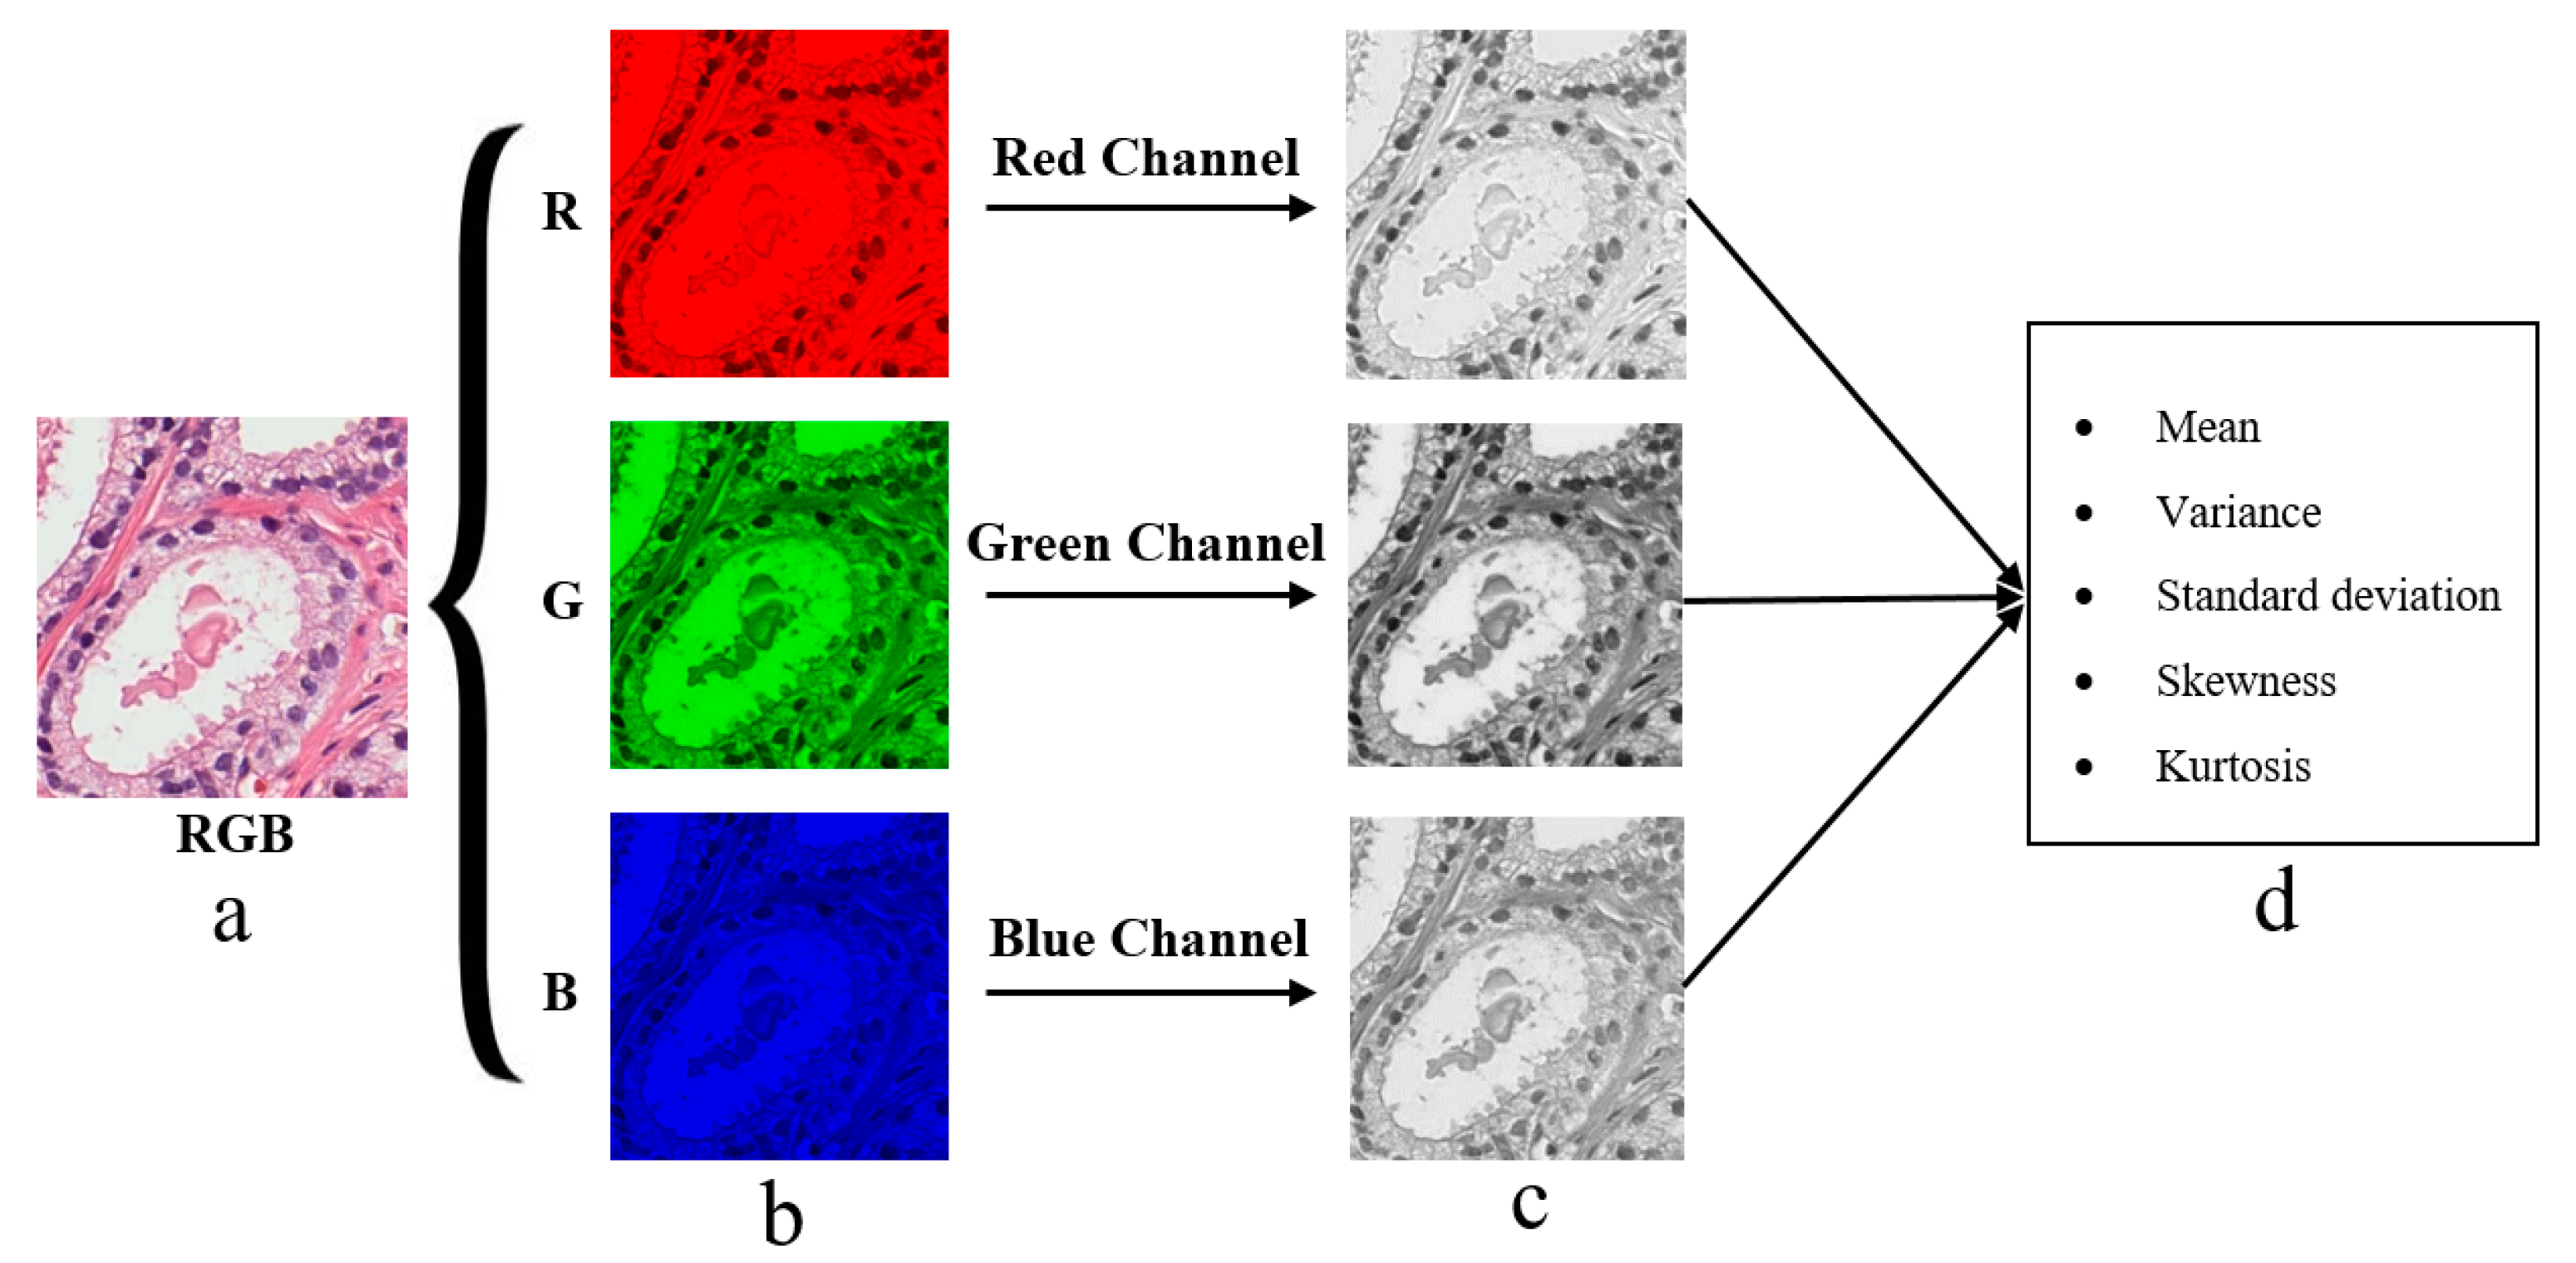
2.4. Color Moment Analysis
2.5. Feature Extraction
2.5.1. Texture Features
2.5.2. Colour Moment Features
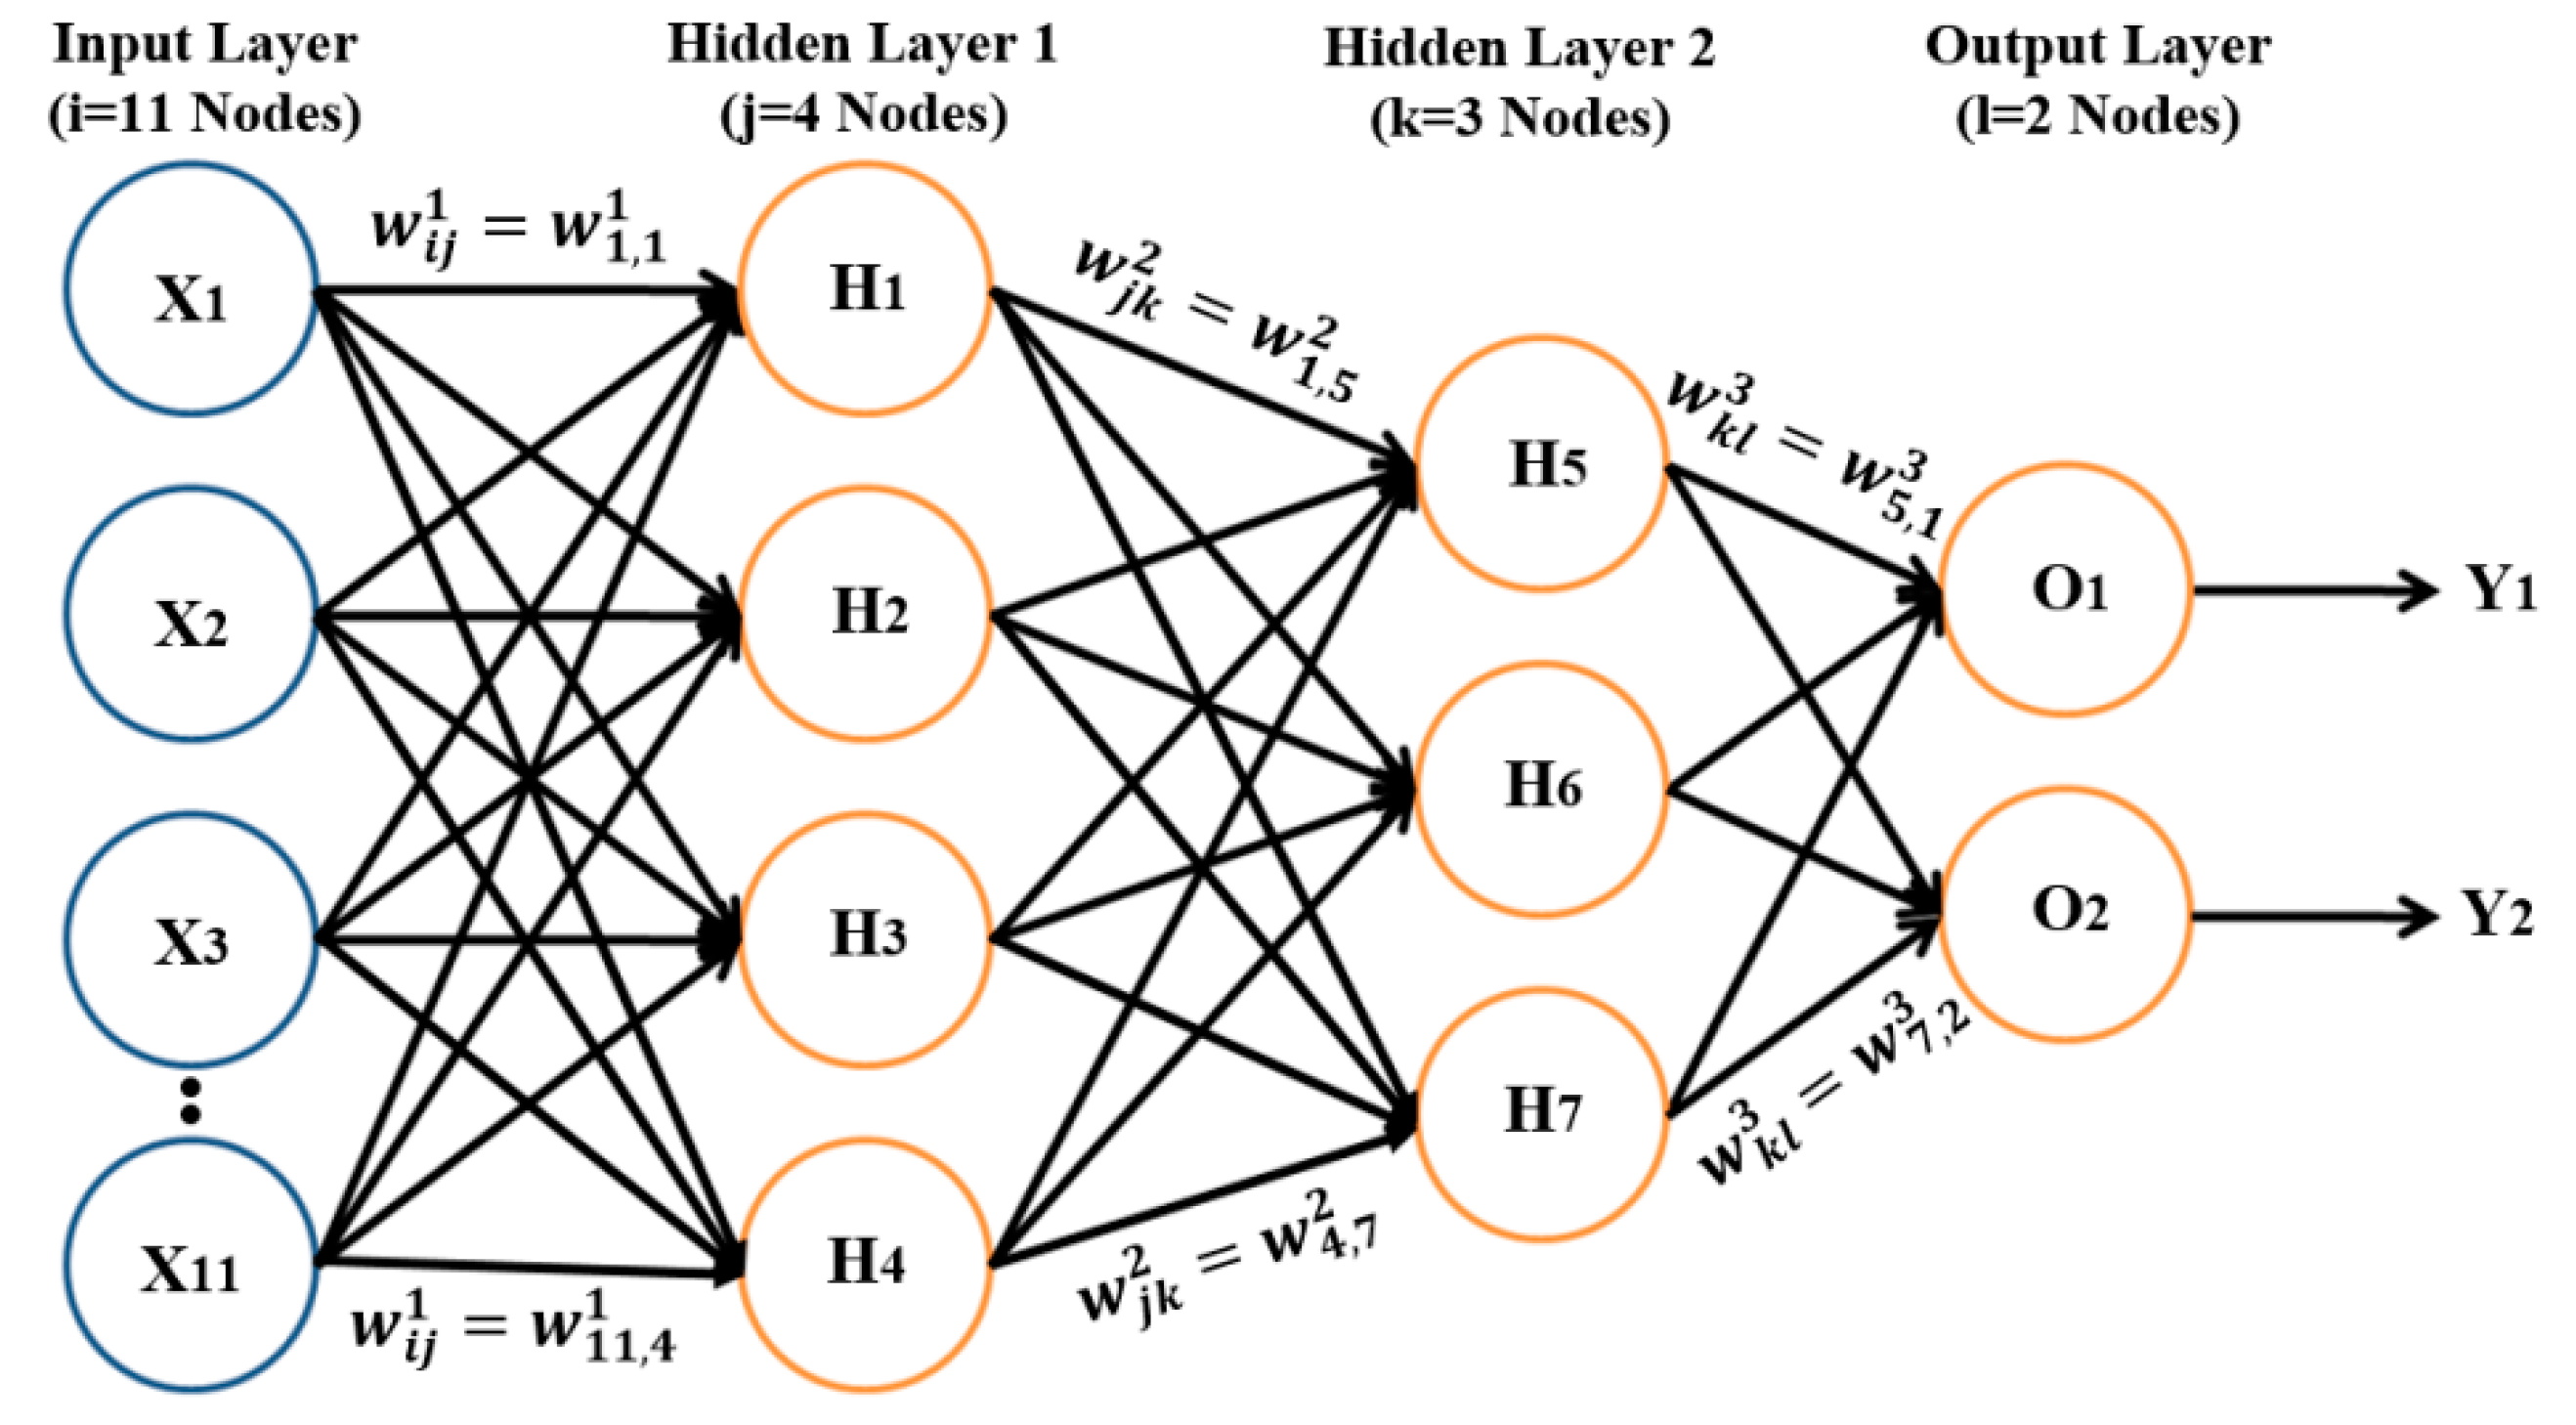
2.6. MLP Classification
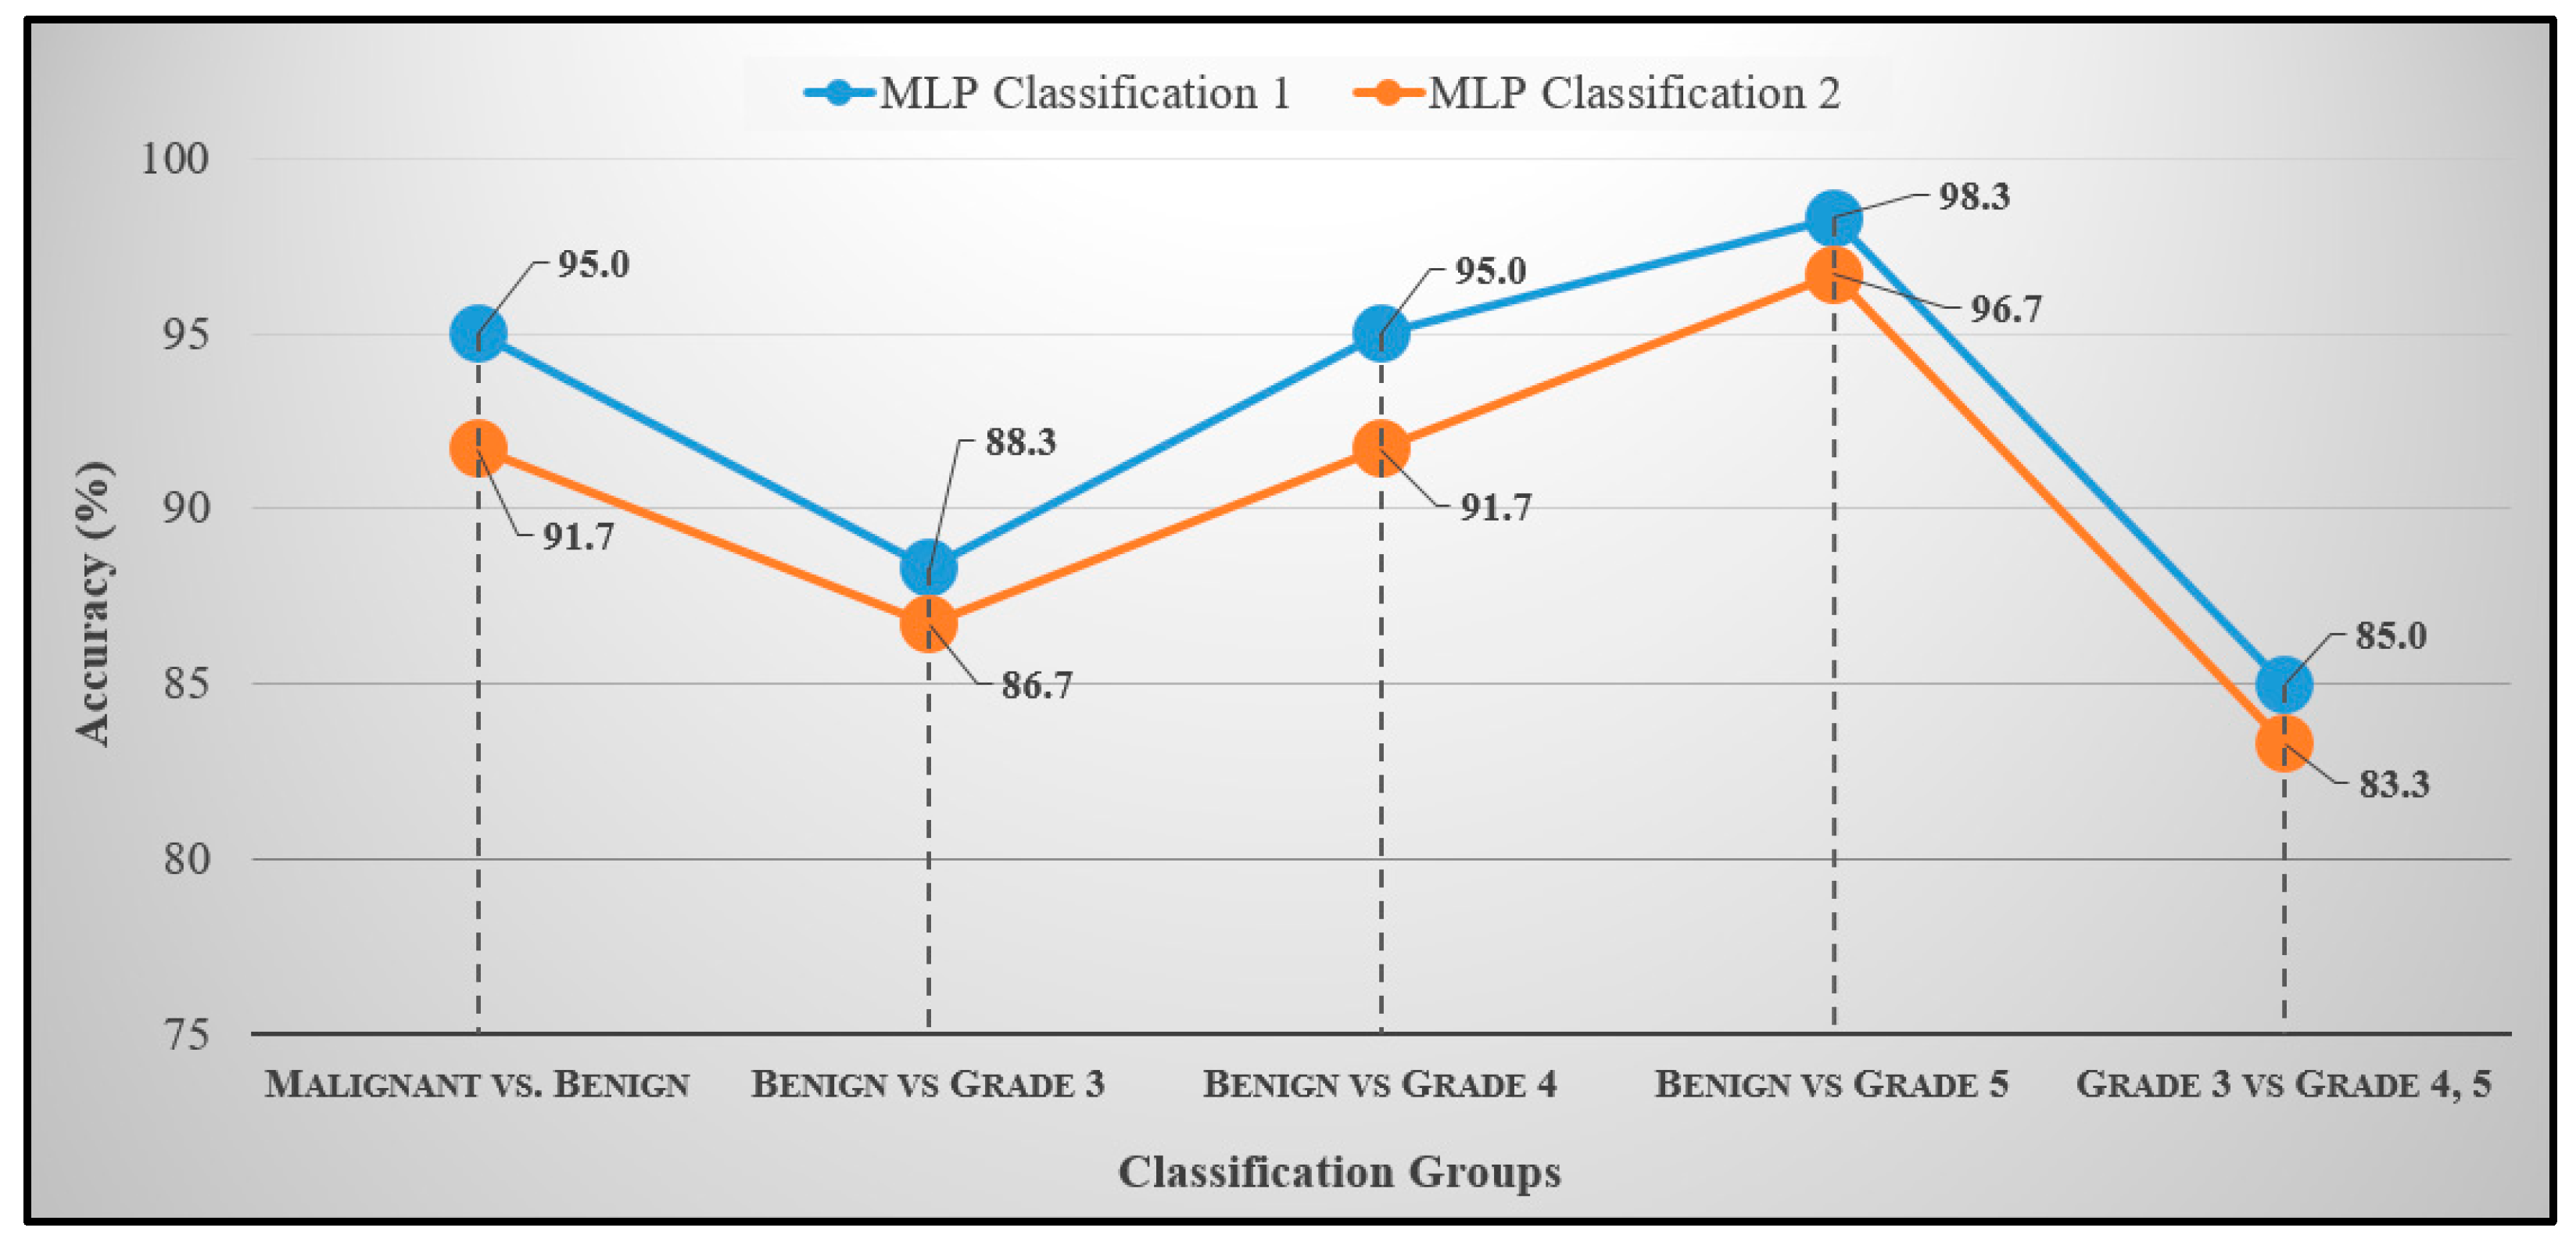
3. Results and Discussion
Performance Metrics
- Accuracy: How many TP and TN were obtained out of all outcomes among all samples.
- Sensitivity: The rate of correctly classifying samples positively.
- Specificity: The rate of correctly classifying samples negatively.
- F1-score: It is calculated using a combination of the “Precision” and “Recall” metrics. The precision metric indicates how many classified samples are relevant, and the recall metric represents how many relevant samples are classified.
- MCC: An index of the performance binary of classification. Indicates the correlation between the observed and predicted binary classification.
- (a)
- It provides concurrent localisation in time and frequency domains.
- (b)
- Small wavelets can be used to separate fine details in an image, and large wavelets can identify coarse details.
- (c)
- An image can be de-noised without appreciable degradation.
4. Conclusions
Author Contributions
Funding
Conflicts of Interest
Appendix A
- (a)
- Centrifuge the samples and transfer 200 to 400 µL (microliter) supernatant plasma aliquots into an individual microfuge tube.
- (b)
- Add 200 µL of plasma, about 200 µL of thromboplastin, and about 200 µL of 0.025 molar calcium chloride to the fixed cultured cells and allow the mixtures to form cell clots at room temperature for about ten minutes.
- (c)
- Wash the cell clots 2× with 1 mL of PBS (phosphate buffered saline), fully transferring the clots onto individual pieces of formalin moistened filter paper after the second wash.
- (d)
- Wrap the clots in the filter paper and use a pin set to place the clots to an individual tissue holder in the center of four other pieces of formalin moistened paper.
- (e)
- Place the tissue holder into a glass jar containing 50 mL of buffered formalin for overnight formalin fixation at 4 °C.
- (a)
- Load the tissue holder into a tissue processor that was kept in a glass jar for overnight formalin fixation.
- (b)
- At least one hour before the end of the processing procedure, turn on a heated embedding station to melt the paraffin.
- (c)
- When the embedded station and the clot are ready, confirm the presence of molten paraffin in the metal mold and transfer a formed cell clot in the paraffin.
- (d)
- Place a new tissue case without the lid into the metal mold and cover the case with more molten paraffin.
- (e)
- Let the paraffin solidify in a cold plate for 30 to 60 s. Then separate the tissue case from the metal mold.
- (a)
- Locate the cell clot in one paraffin cell block and use a microtome to cut the block into 3–4 micrometer (µm) thick slices.
- (b)
- Place paraffin sections onto saline coated glass slides and place the slides into a 37 °C oven for 30 min.
- (c)
- When the sections have adhered to the slides, de-paraffinize the slides in 15 mL of xylene for 3–4 min followed by dehydration of the sections with sequential 2 min in ethanol incubations.
- (d)
- After the 80% ethanol incubation, wash the sections in running water for 10 min to remove the ethanol and boil the slides in a jar containing 40 mL of Tris-EDTA retrieval buffer for 30 min.
- (e)
- At the end of the incubation, wash the antigen retrieved slides under running water followed by a 10 min incubation in 95% ethanol at 4 °C.
- (f)
- Wash the slides in TBS-T (Tris Buffered Saline) followed by incubation in hydrogen peroxide block for 15 min to remove any remnant peroxidase activity.
- (g)
- Wash the slides three times in TBS-T each for two minutes, then label the sections with 100 mL of primary antibody mixture from the immunocytochemical stain kit of interest for one hour followed by TBC-T washes for five times, each for two minutes.
- (h)
- After the last wash, incubate the slides in primary antibody enhancer from the kit for 15 min at room temperature in the dark.
- (i)
- At the end of the incubation, wash the sections four times in TBS-T, add about 200 mL of secondary antibody labelled with horseradish peroxidase, and incubate the slides at room temperature for 30 min.
- (j)
- Wash the enhanced sections five times in fresh TBS-T and stain the slides with hematoxylin compound and incubate it for 8–10 min.
- (k)
- Wash the slides in fresh TBS-T and stain with eosin compound and incubate in for 3–5 min.
- (l)
- Wash the slides again in fresh TBS-T and rehydrate by incubating in 95% ethanol for 2 min followed by 1 dip in 95% ethanol and 2 dips in 100% ethanol.
- (m)
- Incubate the ethanol dehydrated sections in 40 mL of xylene in a glass jar for five minutes and allow the slides to air dry.
- (n)
- Observe the staining pattern under the microscope.
References
- Kweon, S.-S. Updates on Cancer Epidemiology in Korea, 2018. Chonnam Med. J. 2018, 54, 90–100. [Google Scholar] [CrossRef] [PubMed] [Green Version]
- Gleason, D.F. Histologic Grading of Prostate Cancer: A Perspective. Hum. Pathol. 1992, 23, 273–279. [Google Scholar] [CrossRef]
- Al-Maghrabi, J.A.; Bakshi, N.A.; Farsi, H.M.A. Gleason Grading of Prostate Cancer in Needle Core Biopsies: A Comparison of General and Urologic Pathologists. Ann. Saudi Med. 2013, 33, 40–44. [Google Scholar] [CrossRef] [PubMed]
- Braunhut, B.L.; Punnen, S.; Kryvenko, O.N. Updates on Grading and Staging of Prostate Cancer. Surg. Pathol. Clin. 2018, 11, 759–774. [Google Scholar] [CrossRef]
- Chung, M.S.; Shim, M.; Cho, J.S.; Bang, W.; Kim, S.I.; Cho, S.Y.; Rha, K.H.; Hong, S.J.; Koo, K.C.; Lee, K.S.; et al. Pathological Characteristics of Prostate Cancer in Men Aged < 50 Years Treated with Radical Prostatectomy: A Multi-Centre Study in Korea. J. Korean Med. Sci. 2019, 34, 1–10. [Google Scholar]
- Gupta, D.; Choubey, S. Discrete Wavelet Transform for Image Processing. Int. J. Emerg. Technol. Adv. Eng. 2015, 4, 598–602. [Google Scholar]
- Hatamimajoumerd, E.; Talebpour, A. A Temporal Neural Trace of Wavelet Coefficients in Human Object Vision: An MEG Study. Front. Neural Circuits 2019, 13, 1–11. [Google Scholar] [CrossRef]
- Hwang, H.G.; Choi, H.J.; Lee, B.I.; Yoon, H.K.; Nam, S.H.; Choi, H.K. Multi-Resolution Wavelet-Transformed Image Analysis of Histological Sections of Breast Carcinomas. Cell. Oncol. 2005, 27, 237–244. [Google Scholar]
- Hiremath, P.S.; Shivashankar, S. Wavelet Based Features for Texture Classification. GVIP J. 2006, 6, 55–58. [Google Scholar]
- Jafari-Khouzani, K.; Soltanian-Zadeh, H. Multiwavelet Grading of Pathological Images of Prostate. IEEE Trans. Biomed. Eng. 2003, 50, 697–704. [Google Scholar] [CrossRef]
- Sinecen, M.; Makinaci, M. Classification of Prostate Cell Nuclei using Artificial Neural Network Methods. Int. J. Med. Health Sci. 2007, 1, 474–476. [Google Scholar]
- Niwas, S.I.; Palanisamy, P.; Sujathan, K. Wavelet Based Feature Extraction Method for Breast Cancer Cytology Images. In Proceedings of the 2010 IEEE Symposium on Industrial Electronics and Applications (ISIEA), Penang, Malaysia, 3–5 October 2010; pp. 686–690. [Google Scholar]
- Banu, M.S.; Nallaperumal, K. Analysis of Color Feature Extraction Techniques for Pathology Image Retrieval System. In Proceedings of the 2010 IEEE International Conference on Computational Intelligence and Computing Research, Coimbatore, India, 28–29 December 2010; pp. 1–7. [Google Scholar]
- Maggio, S.; Palladini, A.; De Marchi, L.; Alessandrini, M.; Speciale, N.; Masetti, G. Predictive Deconvolution and Hybrid Feature Selection for Computer-Aided Detection of Prostate Cancer. IEEE Trans. Med. Imaging 2010, 29, 455–464. [Google Scholar] [CrossRef]
- Naik, S.; Doyle, S.; Agner, S.; Madabhushi, A.; Feldman, M.; Tomaszewski, J. Automated Gland and Nuclei Segmentation for Grading of Prostate and Breast Cancer Histopathology. In Proceedings of the 2008 5th IEEE International Symposium on Biomedical Imaging: From Nano to Macro, Paris, France, 14–17 May 2008; pp. 284–287. [Google Scholar]
- Tai, S.K.; Li, C.Y.; Wu, Y.C.; Jan, Y.J.; Lin, S.C. Classification of Prostatic Biopsy. In Proceedings of the 6th International Conference on Digital Content, Multimedia Technology and Its Applications, Seoul, Korea, 16–18 August 2010; pp. 354–358. [Google Scholar]
- Singh, K.S.H.R. A Comparison of Gray-Level Run Length Matrix and Gray-Level Co-Occurrence Matrix Towards Cereal Grain Classification. Int. J. Comput. Eng. Technol. Int. J. Comput. Eng. Technol. 2016, 7, 9–17. [Google Scholar]
- Arivazhagan, S.; Ganesan, L. Texture Classification Using Wavelet Transform. Pattern Recognit. Lett. 2003, 24, 1513–1521. [Google Scholar] [CrossRef]
- Nguyen, K.; Sabata, B.; Jain, A.K. Prostate Cancer Grading: Gland Segmentation and Structural Features. Pattern Recognit. Lett. 2012, 33, 951–961. [Google Scholar] [CrossRef]
- Diamond, J.; Anderson, N.H.; Bartels, P.H.; Montironi, R.; Hamilton, P.W. The Use of Morphological Characteristics and Texture Analysis in the Identification of Tissue Composition in Prostatic Neoplasia. Hum. Pathol. 2004, 35, 1121–1131. [Google Scholar] [CrossRef] [PubMed]
- Li, X.; Plataniotis, K.N. Novel Chromaticity Similarity Based Color Texture Descriptor for Digital Pathology Image Analysis. PLoS ONE 2018, 13, e0206996. [Google Scholar] [CrossRef] [Green Version]
- Pham, M.-T.; Mercier, G.; Bombrun, L. Color Texture Image Retrieval Based on Local Extrema Features and Riemannian Distance. J. Imaging 2017, 3, 43. [Google Scholar] [CrossRef] [Green Version]
- Fehr, D.; Veeraraghavan, H.; Wibmer, A.; Gondo, T.; Matsumoto, K.; Vargas, H.A.; Sala, E.; Hricak, H.; Deasy, J.O. Automatic Classification of Prostate Cancer Gleason Scores from Multiparametric Magnetic Resonance Images. Proc. Natl. Acad. Sci. USA 2015, 112, E6265–E6273. [Google Scholar] [CrossRef] [Green Version]
- Feng, Y.; Zhang, L.; Yi, Z. Breast Cancer Cell Nuclei Classification in Histopathology Images Using Deep Neural Networks. Int. J. Comput. Assist. Radiol. Surg. 2018, 13, 179–191. [Google Scholar] [CrossRef]
- García, G.; Colomer, A.; Naranjo, V. First-Stage Prostate Cancer Identification on Histopathological Images: Hand-Driven versus Automatic Learning. Entropy 2019, 21, 356. [Google Scholar] [CrossRef] [Green Version]
- Baik, J.; Ye, Q.; Zhang, L.; Poh, C.; Rosin, M.; MacAulay, C.; Guillaud, M. Automated Classification of Oral Premalignant Lesions Using Image Cytometry and Random Forests-Based Algorithms. Cell. Oncol. 2014, 37, 193–202. [Google Scholar] [CrossRef] [PubMed]
- Anuranjeeta, A.; Shukla, K.; Tiwari, A.; Sharma, S. Classification of Histopathological Images of Breast Cancerous and Non Cancerous Cells Based on Morphological Features. Biomed. Pharm. J. 2017, 10, 353–366. [Google Scholar] [CrossRef]
- Lai, Z.; Deng, H. Medical Image Classification Based on Deep Features Extracted by Deep Model and Statistic Feature Fusion with Multilayer Perceptron. Comput. Intell. Neurosci. 2018, 2018, 1–13. [Google Scholar] [CrossRef] [PubMed] [Green Version]
- Balkenhol, M.C.A.; Bult, P.; Tellez, D.; Vreuls, W.; Clahsen, P.C.; Ciompi, F.; van der Laak, J.A.W.M. Deep Learning and Manual Assessment Show That the Absolute Mitotic Count Does Not Contain Prognostic Information in Triple Negative Breast Cancer. Cell. Oncol. 2019, 42, 555–569. [Google Scholar] [CrossRef] [Green Version]
- Majid, M.A.; Huneiti, Z.A.; Balachandran, W.; Balarabe, Y. Matlab as a Teaching and Learning Tool for Mathematics: A Literature Review. Int. J. Arts Sci. 2013, 6, 23–44. [Google Scholar]
- David, S.; Saeb, A.; Al Rubeaan, K. Comparative Analysis of Data Mining Tools and Classification Techniques Using WEKA in Medical Bioinformatics. Comput. Eng. Intell. 2013, 4, 28–39. [Google Scholar]
- Albashish, D.; Sahran, S.; Abdullah, A.; Abd Shukor, N.; Md Pauzi, H.S. Lumen-Nuclei Ensemble Machine Learning System for Diagnosing Prostate Cancer in Histopathology Images. Pertanika J. Sci. Technol. 2017, 25, 39–48. [Google Scholar]
- Doyle, S.; Madabhushi, A.; Feldman, M.; Tomaszeweski, J. A Boosting Cascade for Automated Detection of Prostate Cancer from Digitized Histology. Med. Image Comput. Comput. Assist. Interv. 2006, 9, 504–511. [Google Scholar]
- Shaukat, A.; Ali, J.; Khan, K.; Author, C.; Ali, U.; Hussain, M.; Bilal Khan, M.; Ali Shah, M. Automatic Cancerous Tissue Classification Using Discrete Wavelet Transformation and Support Vector Machine. J. Basic. Appl. Sci. Res. 2016, 6, 15–23. [Google Scholar]
- Kim, C.H.; So, J.H.; Park, H.G.; Madusanka, N.; Deekshitha, P.; Bhattacharjee, S.; Choi, H.K. Analysis of Texture Features and Classifications for the Accurate Diagnosis of Prostate Cancer. J. Korea Multimed. Soc. 2019, 22, 832–843. [Google Scholar]
- Bhattacharjee, S.; Park, H.-G.; Kim, C.-H.; Madusanka, D.; So, J.-H.; Cho, N.-H.; Choi, H.-K. Quantitative Analysis of Benign and Malignant Tumors in Histopathology: Predicting Prostate Cancer Grading Using SVM. Appl. Sci. 2019, 9, 2969. [Google Scholar] [CrossRef] [Green Version]


| Groups | Accuracy (%) | Sensitivity (%) | Specificity (%) | F1-Score (%) | MCC (%) |
|---|---|---|---|---|---|
| Benign vs. Malignant | 95.0 | 96.5 | 93.5 | 94.9 | 90.0 |
| Benign vs. Grade 3 | 88.3 | 82.9 | 96.0 | 89.2 | 77.7 |
| Benign vs. Grade 4 | 95.0 | 93.5 | 96.5 | 95.1 | 90.0 |
| Benign vs. Grade 5 | 98.3 | 100.0 | 96.8 | 98.3 | 96.7 |
| Grade 3 vs. Grade 4/5 | 85.0 | 95.4 | 76.9 | 80.8 | 69.5 |
| Groups | Accuracy (%) | Sensitivity (%) | Specificity (%) | F1-Score (%) | MCC (%) |
|---|---|---|---|---|---|
| Benign vs. Malignant | 91.7 | 93.1 | 90.3 | 91.5 | 83.4 |
| Benign vs. Grade 3 | 86.7 | 80.6 | 95.8 | 87.9 | 74.8 |
| Benign vs. Grade 4 | 91.7 | 90.3 | 93.1 | 91.8 | 83.4 |
| Benign vs. Grade 5 | 96.7 | 96.7 | 96.7 | 96.7 | 93.3 |
| Grade 3 vs. Grade 4/5 | 83.3 | 95.4 | 76.3 | 80.8 | 69.2 |
| Authors | Method | Features | Classes | Accuracy |
|---|---|---|---|---|
| Hae-Gil et al., 2005 [8] | Discriminant analysis | Wavelet features (Haar, level-2) | Benign, DCIS, CA | 87.8% |
| Kourosh et al., 2003 [10] | k-NN | Multiwavelet texture features | Grades 2, 3, 4, 5 | 97.0% |
| Mahmut et al., 2007 [11] | MLP | Texture (GMRF, Fourier entropy, wavelet) | Benign vs. Malignant | 86.9% |
| Issac et al., 2010 [12] | k-NN | Wavelet texture features | Benign vs. Malignant | 93.3% |
| Tai et al., 2010 [15] | SVM | Wavelet-based fractal dimension | Normal, Grade 3, 4, 5 | 86.3% |
| Naik et al., 2008 [16] | SVM | Shape features of the lumen and the gland inner boundary | Grade 3 vs. Grade 4 | 95.2% |
| Benign vs. Grade 3 | 86.3% | |||
| Benign vs. Grade 4 | 92.9% | |||
| Nguyen et al., 2012 [19] | SVM | Gland morphology and co-occurrence | Benign, Grade 3 and 4 carcinoma | 85.6% |
| Diamond et al., 2004 [20] | Machine vision assessment | Colour, texture, and morphometric | Stroma, benign tissue and prostatic carcinoma | 79.3% |
| Albashish et al., 2017 [32] | SVM | Texture features, (Haralick, HOG, run-length matrix) | Grade 3 vs. Grade 4 | 88.9% |
| Benign vs. Grade 3 | 97.9% | |||
| Benign vs. Grade 4 | 92.4% | |||
| Doyle et al., 2006 [33] | Bayesian | Texture features, (first-order statistics, co-occurrence matrix, wavelet) | Benign vs. Malignant | 88.0% |
| Shaukat et al., 2016 [34] | SVM | Wavelet texture features | Grades 3, 4, 5 | 92.2% |
| Kim et al., 2019 [35] | SVM | GLCM co-occurrence matrix | Benign vs. Malignant | 84.1% |
| Grade 3 vs. Grade 4,5 | 85.0% | |||
| Subrata et al., 2019 [36] | SVM | Morphological features | Benign vs. Malignant | 88.7% |
| Grade 3 vs. Grades 4,5 | 85.0% | |||
| Grade 4 vs. Grade 5 | 92.5% | |||
| Grade 3 | 90.0% | |||
| Grade 4 | 90.0% | |||
| Grade 5 | 95.0% | |||
| Proposed | MLP | Wavelet texture (level-1) and colour features | Benign vs. Malignant | 95.0% |
| Grade 3 vs. Grade 4,5 | 85.0% | |||
| Benign vs. Grade 3 | 88.3% | |||
| Benign vs. Grade 4 | 95.0% | |||
| Benign vs. Grade 5 | 98.3% |
© 2019 by the authors. Licensee MDPI, Basel, Switzerland. This article is an open access article distributed under the terms and conditions of the Creative Commons Attribution (CC BY) license (http://creativecommons.org/licenses/by/4.0/).
Share and Cite
Bhattacharjee, S.; Kim, C.-H.; Park, H.-G.; Prakash, D.; Madusanka, N.; Cho, N.-H.; Choi, H.-K. Multi-Features Classification of Prostate Carcinoma Observed in Histological Sections: Analysis of Wavelet-Based Texture and Colour Features. Cancers 2019, 11, 1937. https://doi.org/10.3390/cancers11121937
Bhattacharjee S, Kim C-H, Park H-G, Prakash D, Madusanka N, Cho N-H, Choi H-K. Multi-Features Classification of Prostate Carcinoma Observed in Histological Sections: Analysis of Wavelet-Based Texture and Colour Features. Cancers. 2019; 11(12):1937. https://doi.org/10.3390/cancers11121937
Chicago/Turabian StyleBhattacharjee, Subrata, Cho-Hee Kim, Hyeon-Gyun Park, Deekshitha Prakash, Nuwan Madusanka, Nam-Hoon Cho, and Heung-Kook Choi. 2019. "Multi-Features Classification of Prostate Carcinoma Observed in Histological Sections: Analysis of Wavelet-Based Texture and Colour Features" Cancers 11, no. 12: 1937. https://doi.org/10.3390/cancers11121937
APA StyleBhattacharjee, S., Kim, C.-H., Park, H.-G., Prakash, D., Madusanka, N., Cho, N.-H., & Choi, H.-K. (2019). Multi-Features Classification of Prostate Carcinoma Observed in Histological Sections: Analysis of Wavelet-Based Texture and Colour Features. Cancers, 11(12), 1937. https://doi.org/10.3390/cancers11121937