Article

Molecular Profiling of Atypical Tenosynovial Giant Cell Tumors Reveals Novel Non-CSF1 Fusions

1
Department of Pathology, New York University Langone Health, New York, NY 10016, USA
2
Department of Dermatology, New York University Langone Health, New York, NY 10016, USA
*
Author to whom correspondence should be addressed.
Cancers 2020, 12(1), 100; https://doi.org/10.3390/cancers12010100
Submission received: 27 November 2019 / Revised: 20 December 2019 / Accepted: 29 December 2019 / Published: 31 December 2019

Abstract

:
Tenosynovial giant cell tumor (TGCT) is a benign neoplasm characterized by recurrent fusions involving the colony-stimulating factor 1 (CSF1) gene and translocation partners including collagen type VI alpha 3 chain (COL6A3) or S100 calcium-binding protein A10 (S100A10). Herein, we report three atypical TGCT cases with very unusual morphology comprising areas with increased cellular atypia, mitotic activity, and worrisome features that harbor unique non-CSF1 gene fusions. Anchored multiplex PCR (AMP) for next-generation sequencing utilizing a customized panel targeting 86 cancer-related genes was performed, and it identified novel non-CSF1-driven gene fusions: NIPBL-ERG, FN1-ROS1, and YAP1-MAML2. Screening of three control TGCTs with conventional morphology found translocations involving CSF1, with partner genes COL6A3, FN1, and newly identified KCNMA1. All novel fusions were further validated by reverse transcriptase-PCR (RT-PCR) and Sanger sequencing. Late and multiple local recurrences occurred in the atypical TGCTs, while no recurrences were reported in the conventional TGCTs. Our findings reveal that atypical TGCTs harbor gene fusions not implicating CSF1 and suggest that non-CSF1 fusions potentially confer greater propensity to recurrences and local aggressiveness while indicating the presence of alternate pathogenic mechanisms that warrant further investigation.

1. Introduction

Tenosynovial giant cell tumor (TGCT), also known as giant cell tumor of tendon sheath, is a benign soft tissue lesion that is catalogued among the so-called fibrohistiocytic tumors. TGCTs are subcategorized into localized or diffuse (pigmented villonodular synovitis) variants depending on the extent of disease behavior and clinical features [1,2]. TGCTs typically affect individuals between the ages of 30 and 50 years and have an increased propensity in women [2,3]. The most common site of presentation is the fingers, and they can develop insidiously as a painless well-circumscribed growing mass. Importantly, these tumors have the proclivity to recur after excision in up to 45% of cases, thus warranting close monitoring [4].
A large proportion of these tumors are characterized by recurrent chromosomal translocations involving breakpoints in 1p11-13, with 2q35-37 being the most common translocation partner, while 5q22-31, 11q11-12, and 8q21-22 are less frequent [5]. Subsequent findings identified colony-stimulating factor 1 (CSF1) as the gene present at the 1p13 breakpoint locus and collagen type VI alpha 3 chain (COL6A3) gene on 2q37 as the translocation partner in a subset of these cases [6]. Interestingly, CSF1 expression was only detected in a minority of cells harboring the translocation, as demonstrated by combined fluorescent in situ hybridization (FISH) and immunohistochemistry (IHC) analysis, inferring that these are neoplastic parenchymal cells and that the translocation results in aberrant expression of CSF1 [6]. Overexpression of CSF1 in the neoplastic cell population is believed to result in abnormal recruitment of CSF1R-expressing macrophages to the tumor site [6,7]. Further evidence has demonstrated that the CSF1 translocation is not required for CSF1 upregulation. An additional fusion partner, S100 calcium-binding protein A10 (S100A10), has also been identified, which replaces the 3′ untranslated region (UTR) of CSF1 with sequences from the 3′ end of the S100A10 gene [8]. These findings demonstrate that overexpression of CSF1 appears to play a fundamental role in the pathogenesis of TGCTs.
A minor subset of these tumors, however, exhibit unusual histologic features comprising areas with increased atypia, proliferative activity, irregular enlarged nuclei, and spindle cell morphology and are accompanied by varying degrees of fibrosis and degenerative changes. Distinction of these unconventional tumors often renders a diagnostic challenge. In the past, it has been suggested that culmination of atypical histologic features that exhibit worrisome morphology in the frank absence of sarcomatous change perhaps be referred to as “atypical TGCTs” [1].
In the present study, we pursued further expansion of our current understanding of atypical TGCTs at the molecular level. We identified novel non-CSF1-implicated gene fusions using anchored multiplex PCR (AMP) technology and subsequently validated the fusion transcripts by reverse transcriptase-PCR (RT-PCR) and Sanger sequencing. Following these findings, we further compared the transcriptome landscape of conventional TGCTs using RNA sequencing and found distinct differences among the two groups.

2. Results

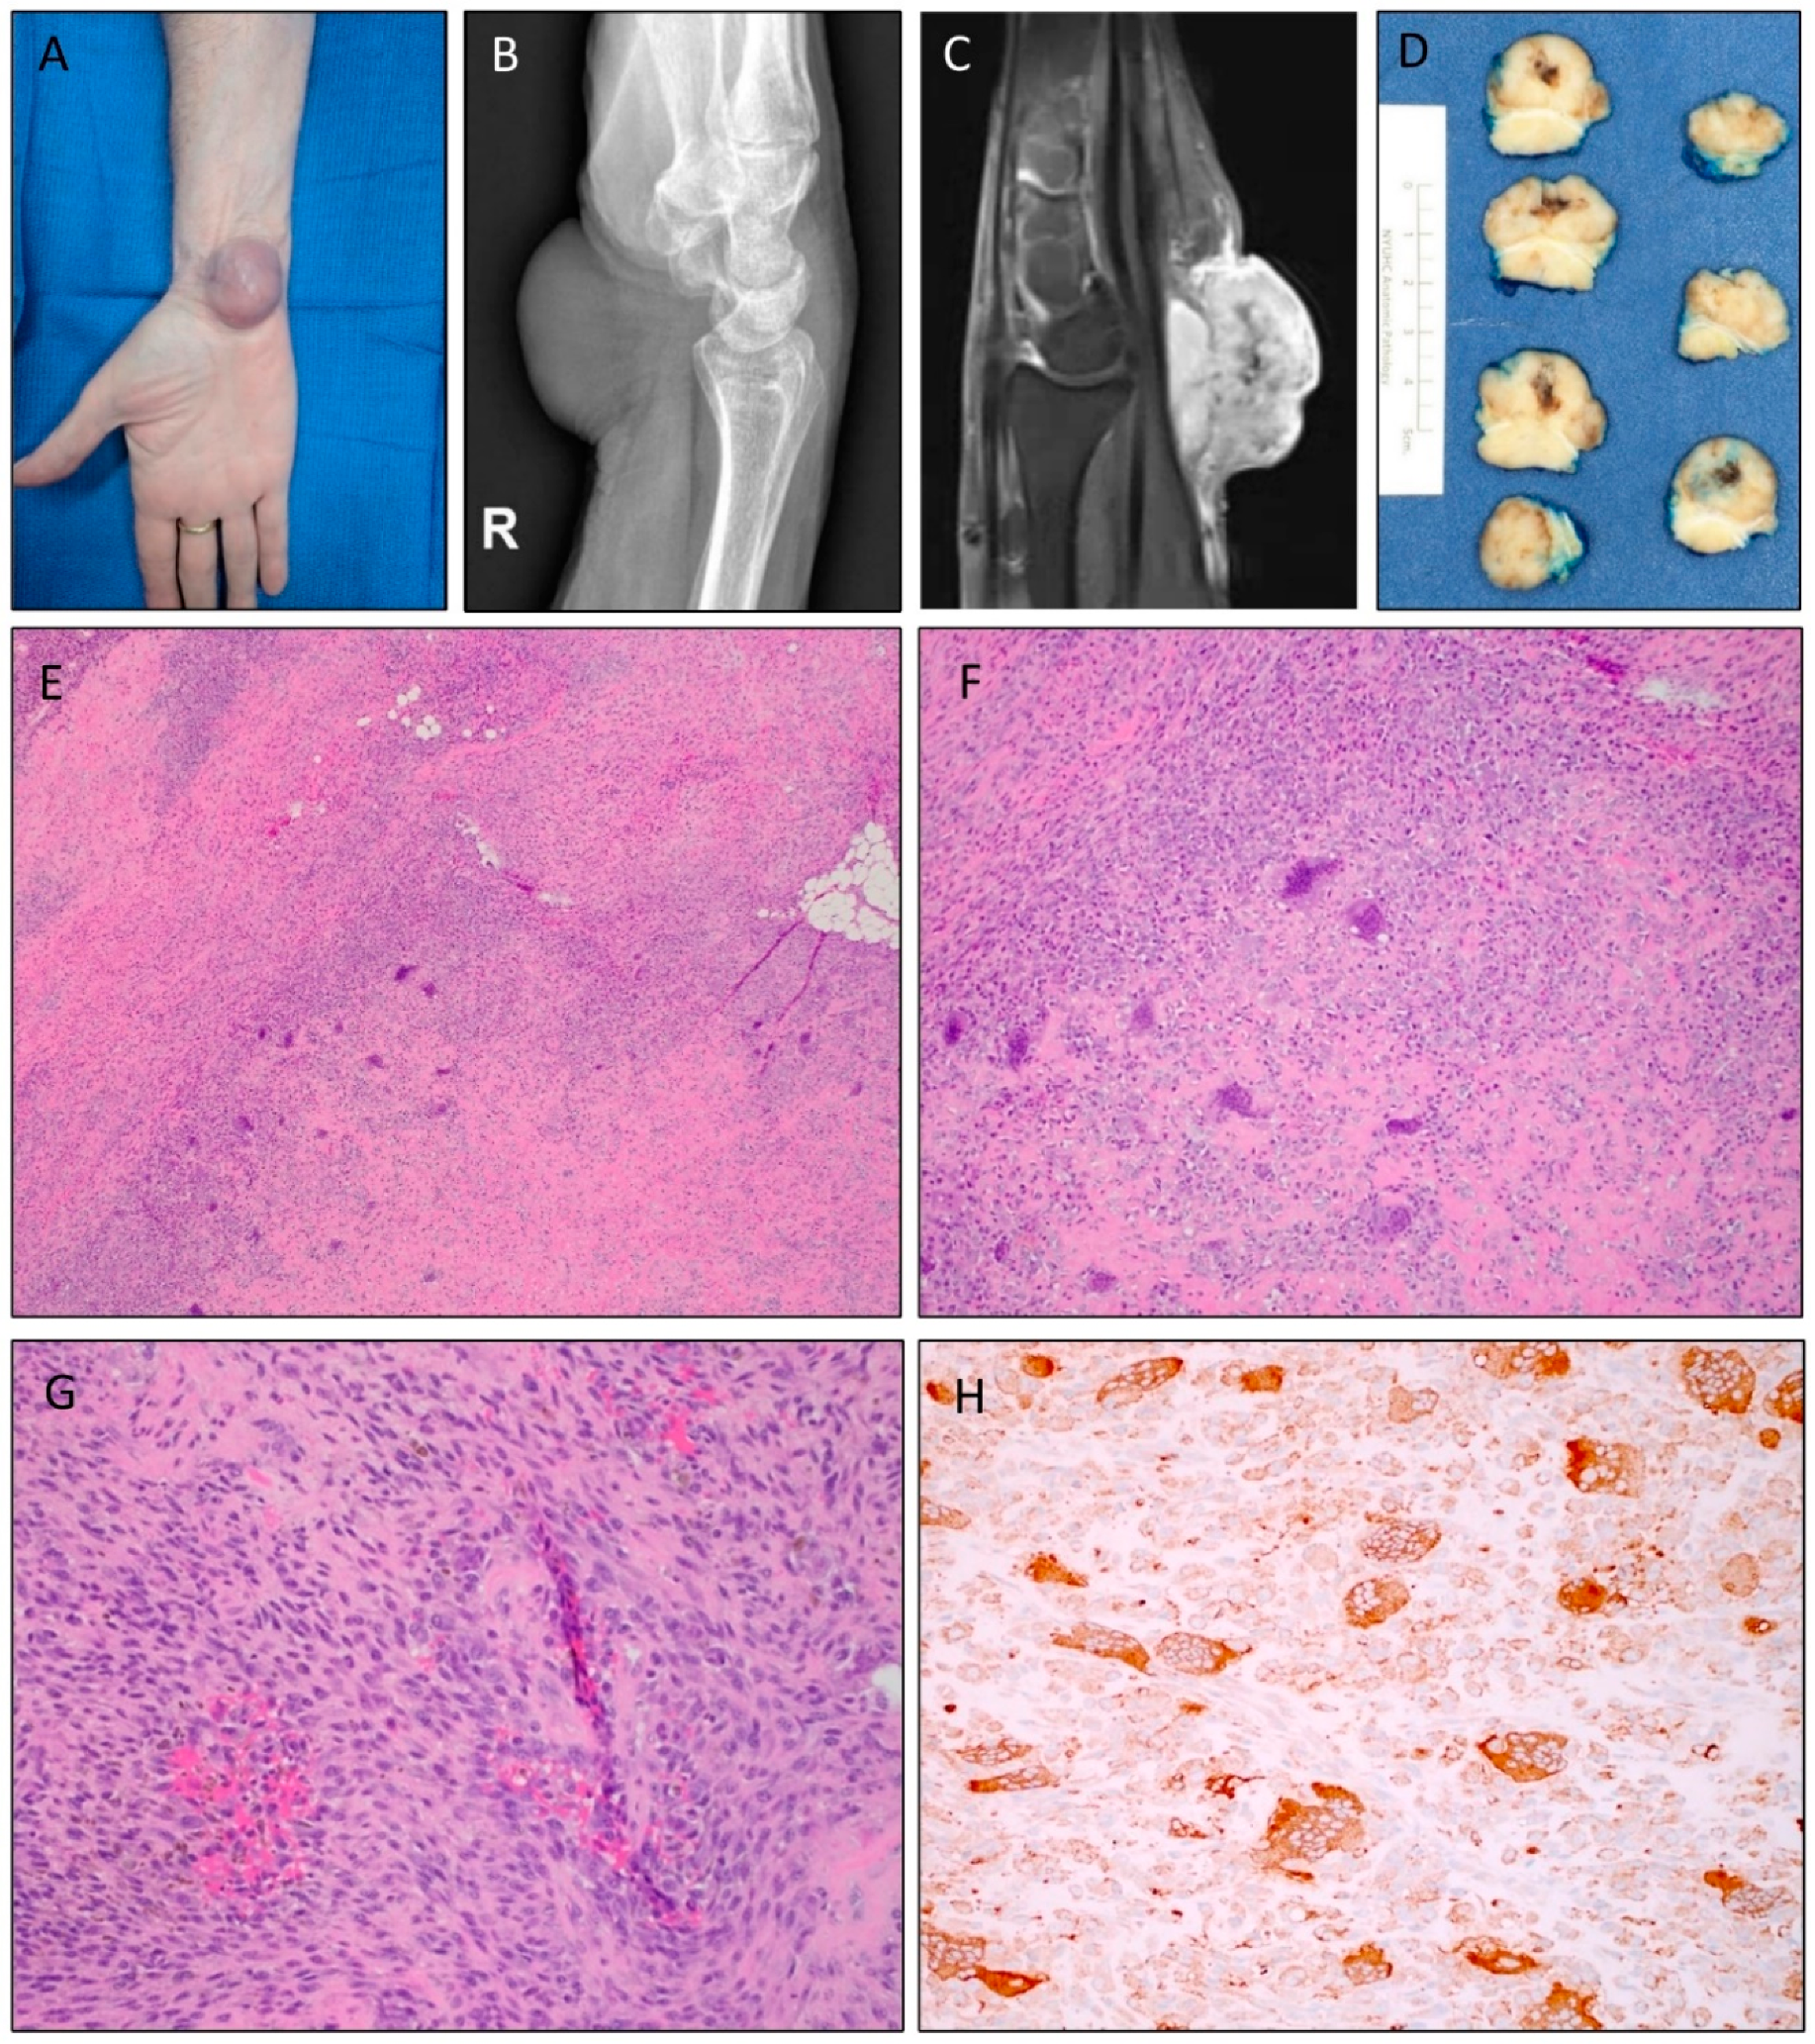
2.1. Clinical Presentation and Morphology of Atypical TGCTs

The cohort consisted of three atypical TGCTs with unconventional morphologic features comprising areas with increased cellularity, varying degrees of pleomorphism, and mitotic activity. The lesions ranged in size from 2 to 3.8 cm (mean = 3 cm) in greatest dimension and arose either on the wrists or ankle. Multiple local or late recurrences developed in patients where sufficient follow-up time was available; however, no distant metastases were identified in any patient.
The index case (Case 1) was from a 69-year-old female who presented with an exophytic mass located on the volar aspect of the right wrist that had increased in size and grown painful over a nine-month period (Figure 1A). A lateral X-ray of the wrist showed a large nonspecific soft tissue mass (Figure 1B), and subsequent magnetic resonance imaging (MRI) with IV contrast demonstrated a 2.7 × 2.4 × 2.2 cm diffusely enhancing mass, most consistent with an aggressive neoplasm (Figure 1C). Ultrasound-guided biopsy of the mass revealed an atypical spindle and giant cell tumor with fibrotic and collagenized areas as well as areas displaying osteoid-type early bone production. Gross examination of the marginal excision specimen revealed a well-circumscribed 3.2 × 2.7 × 1.8 cm tan-pink mass with a central hemorrhagic area partially surrounded by a deep fibrous band (Figure 1D). Microscopically, the tumor was composed of areas consisting of conventional TGCT morphology with mononuclear stromal cells, multinucleated giant cells, and histiocytes with bland cytologic features (Figure 1E). Admixed throughout the tumor were areas of increased atypia and heterogeneous growth, with varying degrees of fibrosis, hyalinization, bone formation, and degenerative changes (Figure 1F). Focal areas harboring fibrous spindle cells and prominent cellularity were also seen in addition to increased mitotic activity, but there were no atypical mitotic figures (Figure 1G). The tumor cells showed robust coarse immunopositivity for CD68 (Figure 1H) and displayed a variable Ki-67 proliferative index.
Given the unusual features and presence of the tumor at tissue edges, close clinical follow-up for recurrences was recommended. Initial workup, including a chest computed tomography (CT) scan, was negative for distant metastases. The patient had a subsequent re-excision at seven months to remove residual tumor as well as a local re-excision at 14 months to remove a recurrence. Both re-excised specimens showed similar morphologic findings, and all surgical procedures were done in the same localized area with residual or recurrent nodules occurring adjacent to the original site of tumor. The patient is alive at 24 months of follow-up since initial diagnosis, with no evidence of distant disease (negative positron emission tomography scan and chest CT scan).
A review of archived cases of atypical TGCTs identified an additional two cases. Case 2 was from a 46-year-old female who presented with a recurrent left wrist mass that developed in the same location nearly nine years following initial excision. The tumor displayed conventional TGCT features (Figure 2A) in addition to areas of increased cellular atypia with presence of hyperchromatic nuclei (Figure 2B). Moderate morphologic atypia was present in the tumor, but some appeared to represent symplastic or degenerative atypia (Figure 2C). The Ki-67 proliferation index was <5%, suggesting a nonmalignant proliferation, and no significant mitotic activity was identified in the tumor. The recurrence was morphologically similar to the initial tumor, with a nodular configuration and foci of hyalinization, osteoid, and mature bone formation. The tumor displayed abundant giant cells and mononuclear cells, with focal areas of spindle cells.
Case 3 was from a 64-year-old female who presented with a mildly painful, slow-growing soft tissue left ankle mass. MRI revealed a partially encapsulated mixed fluid-intensity lesion overlying the distal fibula and abutting the lateral margin of the talus and calcaneus. Diffuse soft tissue edema was present, but there was no bone destruction. On excision, the mass consisted of tan-pink soft tissue that measured 3.8 × 3 × 2.5 cm. Microscopically, the lesion harbored areas with benign-appearing TGCT histology (Figure 2D); however, it additionally showed worrisome morphologic features, including enlarged nuclei with mild to moderate pleomorphism and prominent nucleoli (Figure 2E). A few areas of myxoid change, scattered spindle cells, and cells with virocyte-like nucleoli (Figure 2F) were also appreciated, but no high-grade sarcomatous component was seen in the specimen, and the mitotic activity was low. The tumor displayed immunopositivity for CD68, CD163, and a variable Ki-67 proliferation index.

2.2. Identification of Novel Gene Fusions in Atypical TGCTs

The unconventional morphologic characteristics that were observed raised the question as to whether atypical TGCTs may potentially harbor distinct genetic aberrations. Routine FISH studies performed on the specimens were negative for traditional CSF1 gene rearrangements. We employed in-house RNA sequencing using our customized NYU FUSIONSEQer panel, which revealed novel gene fusions not involving the CSF1 gene. Case 1 harbored a NIPBL (NM_015384.4: exon: 1)/ERG (NM_004449.4: exon: 1) in-frame fusion in the tumor cells arising from a translocation involving loci 5p13.2 and 21q22.2, respectively. The fusion transcript was independently validated using RT-PCR, which showed a strong band in the tumor cDNA sample but not in the normal control, and by Sanger sequencing (Figure 3A,B). In addition, further IHC studies showed positive ERG expression in the mononuclear tumor cells (Figure 3C). Molecular testing on Case 2 revealed a FN1-ROS1 gene fusion with exon 42 of FN1 (NM_002026.2) and exon 34 of ROS1 (NM_002944.2) (Figure 3D,E). Analogous to reported ROS1 fusion proteins, the ROS1 kinase domain was conserved in the case of FN1-ROS1. In Case 3, the fusion assay identified a YAP1-MAML2 fusion involving exon 4 of YAP1 and exon 2 of MAML2 (Figure 3F,G), similar to those reported in poromas [9]. All fusion transcripts were validated by RT-PCR as well as Sanger sequencing. These findings demonstrate that atypical TGCTs harbor non-CSF1 gene fusions.

2.3. Detection of New CSF1 Fusion Partners in Conventional TGCTs

We screened three additional TGCTs with typical morphology as a control group to compare potential differences between conventional and atypical TGCTs. All three conventional TGCTs were confirmed to have translocations involving CSF1, including the known CSF1-COL6A3 and the recently reported CSF1-FN1 [10] in addition to a new fusion partner gene KCNMA1 (Figure 4A,B). Cases 4 and 6 showed the same exact breakpoint in exon 5 chr1:110464616, while the breakpoint was identified in exon 9 of CSF1 in Case 5. Both of these breakpoints have been previously identified in CSF1 fusions with partners such as COL6A3. The mean tumor size of the conventional TGCTs was 2.2 cm, and anatomic sites of presentation included the arm in Case 4 and the knee in Cases 5 and 6 (Table 1). None of the conventional TGCTs in our cohort showed evidence of recurrence (mean follow-up = 14.7 months). The cumulative clinical information and fusions that were identified are collectively summarized in Table 1.

3. Discussion

In this study, we sought to elucidate the transcriptional signatures of atypical TGCTs and describe their morphologic and clinical correlates. Instigated by an index case, we identified novel gene fusions harbored in atypical TGCTs not involving CSF1. Late and multiple recurrences developed in atypical TGCT cases with sufficient follow-up in our cohort, suggesting greater propensity for local recurrence, with possible alternative mechanisms of pathogenesis. Despite the recurring nature of these tumors, unequivocal morphologic characteristics of malignancy, such as necrosis, nuclear pleomorphism, high mitotic activity, or sarcomatous change, were not present.
To date, approximately 50 malignant TGCTs have been reported in the present literature [11]. Currently, there is no consensus pertaining to what morphologic features constitute a malignant TGCT. Criteria proposed by Enzinger and Weiss designate the malignant variant as a benign TGCT coexisting with malignant areas or a prior diagnosed benign TGCT recurring with a malignant morphology [12]. More recently, in a cohort of 10 malignant TGCTs, Al-Ibraheemi et al. demonstrated loss of CD68, CD163, and CD11c immunoreactivity in mononuclear cells with malignant morphology [11]. Furthermore, in their cohort, malignant areas displayed a mean mitotic activity of 18/10 high-power fields (HPFs). According to the WHO Classification of Tumors of Soft Tissue and Bone, malignant TGCTs in large part exhibit enlarged nuclei, ample eosinophilic cytoplasm in histiocyte-like cells, myxoid stroma, areas of necrosis, and a mitotic index of >20/10 HPFs [13]. The abovementioned accepted features of malignancy were not present in any of our cases.
The morphologic differential diagnosis of TGCT includes two important entities: giant cell tumor (GCT) of soft tissue and phosphaturic mesenchymal tumor (PMT) [14]. GCT of soft tissue is a rare mesenchymal neoplasm sharing similarities with its osseous counterpart [15]. These tumors are characterized by uniformly and evenly distributed multinucleated osteoclast-like giant cells among mononuclear cells. This finding was constantly lacking in our cohort across both conventional and atypical cases, arguing against the diagnosis of GCT of soft tissue. PMTs are rare mesenchymal neoplasms characterized by osteomalacia that is caused by a neoplasm. The hallmark of these lesions includes bland spindled cells, scattered osteoclast-like giant cells, and a basophilic matrix with flocculent calcifications [14]. None of these findings were identified in our cases. Furthermore, no patient presented with osteomalacia or systemic symptoms seen in PMTs, such as muscle pain. Our atypical cases showed significant morphologic overlapping features, which are listed in Table 1. This fact suggests that these lesions could potentially represent an unusual hitherto unrecognized entity, which merits further investigation in a larger study focusing on these particular morphologic parameters.
ETS transcription factor ERG (ERG) is a protein encoding oncogene that belongs to the erythroblast transformation-specific (ETS) family of transcription factors and is frequently involved in gene fusions in prostate cancer, Ewing sarcoma, and acute myeloid leukemia [16,17,18]. Rearrangements of ERG and the androgen-regulated gene transmembrane serine protease 2 (TMPRSS2) are prevalent in a large percentage of prostate cancers, where the TMPRSS2-ERG fusion has been shown to correlate with prostate cancer-specific death and metastasis in men managed with expectant therapy of localized prostate cancer [19]. Several studies have linked the presence of TMPRSS2-ERG with dismal outlook in prostate cancer patients, suggesting that the chimeric protein serves as a poor prognostic indicator [19,20]. ERG rearrangements involving multiple partners have further been characterized in Ewing sarcoma. A smaller subset of these tumors lack the canonical EWSR1-FLI1 fusion, however, have been shown to carry alternate rearrangements involving the ERG gene, more specifically EWSR1-ERG and FUS-ERG [21,22,23]. Aberrant expression of transcription factors as a result of these chimeric gene fusions is assumed to play crucial roles in driving neoplastic transformation.
The breakpoints identified in our fusion are distinct from those previously described in the small round blue cell tumor/Ewing sarcoma groups [21,22,23]. A thorough literature and COSMIC database search revealed no previous reports of NIPBL-ERG fusions [24,25]. Furthermore, the closest reported breakpoints in ERG fusions to the ERG breakpoints identified in our case (chr21:40033588) are seen in rare variants of TMPRSS2-ERG (only 1.17% of the characterized and reported ERG fusions in prostate cancer (COSF123)). In these variants, the first observed exon in the TMPRSS2-ERG fusion is exon 2 of ERG [24,25]. Interestingly, all the described EWSR1-ERG and FUS-ERG fusions in the small round blue cell tumor/Ewing sarcoma groups involve a breakpoint situated in exons 8, 9, 10, and 11 further downstream toward the 3′ end of ERG [22,24,26]. Moreover, the NIPBL-ERG fusion in Case 1 was identified in both recurrences at 7 and 14 months, implying a common pathogenic theme for local recurrence in this specific tumor.
Cohesin loading factor (NIPBL) has important functions in sister chromatid cohesion by regulating the loading and unloading of cohesin onto chromatin [27]. Missense and protein-truncating mutations in NIPBL have been reported to cause Cornelia de Lange syndrome [28]. No NIPBL fusions have been reported in human cancers thus far [25]. While the biological function of the NIPBL-ERG fusion at present is not known, given the lack of mechanistic studies, our findings suggest that the fusion exerts its function in an analogous manner to TMPRSS2-ERG in prostate cancer. Although the mechanism of the NIPBL-ERG fusion (translocation) is different from that of TMPRSS2-ERG fusion (chromosomal interstitial deletion on chromosome 21), both result in overexpression of ERG under the influence of the 5′ UTR of their respective fusion partner. In this scenario, the ERG gene is constitutively expressed from the NIPBL promoter, which results in aberrant ERG expression. This is further corroborated by the positive immunoreactivity with ERG in Case 1. Recent preclinical studies have demonstrated that ERG inhibitory peptides (EIPs) and derived peptidomimetics bind ERG with high affinity and specificity, leading to proteolytic degradation of the ERG protein [29]. Yet, the utility of EIPs in the clinical setting remains to be investigated.
The FN1-ROS1 fusion identified in Case 2 is reminiscent of those encountered in ROS1 rearranged non-small cell lung cancer (NSCLC). ROS proto-oncogene 1 (ROS1) is a receptor tyrosine kinase gene that is mapped to 6q22.1, and ROS1 fusions result in protein kinase activation, which is encoded by exons 36 through 41 [30,31]. ROS1-rearranged tumors are found in multiple types of human cancer, including NSCLC, gastric cancer, colon cancer, and spitzoid tumors, and ubiquitous ROS1 partner genes have been identified thus far. ROS1 translocations are prevalent in 1–2% of NSCLCs and, more importantly, are actionable drug targets [32]. The fusion partner detected in our case, fibronectin 1 (FN1), encodes an extracellular matrix glycoprotein with a fibronectin type III domain. FN1 gene fusions have been reported in PMTs, cartilaginous tumors, and more recently in calcifying aponeurotic fibromas [33,34,35]. The mechanism by which ROS1 becomes oncogenic still remains unclear to date.
Ancillary IHC studies performed on Case 3 were positive for CD68 and CD163 and negative for EMA, Cam 5.2, AE1/AE3, ALK, Sox10, STAT6, MelanA, and p63. The tumor displayed a few areas of myxoid change and scattered cells with virocyte-like nucleoli, which raised the possibility of a myxoinflammatory fibroblastic sarcoma; however, FISH studies utilizing bacterial artificial chromosome (BAC) probes showed no additional abnormalities in TGFBR3, MGEA5, VGLL3, and BRAF genes. The YAP1-MAML2 fusion detected in our case is seen in poromas and has been shown to augment anchorage-independent epithelial cellular growth [9].
The additional newly identified partner gene, potassium calcium-activated channel subfamily M alpha 1 (KCNMA1), in the conventional TGCT involved exon 9 of CSF1 and intron 5 of KCNMA1. KCNMA1 encodes calcium-activated potassium channels, and gene fusions implicating KCNMA1 have been reported in prostate adenocarcinoma and leukemia [36]. Similar to what was reported before in CSF1 fusions in TGCTs, the downstream amino-terminal part of CSF1, which interacts with its receptor CSF1R, was not encoded by the chimeric transcripts in any of the three conventional TGCTs in our cohort. This substantiates the tumorigenesis of TGCT, which depends on high level of CSF1 expression in the neoplastic cells, which in turn will recruit the non-neoplastic CSF1R-expressing cells [8].
Besides gene fusions, recent studies have also detected the existence of additional genomic alterations involved in the pathogenesis of TGCTs. Recurrent somatic CBL missense mutations were observed in up to 35% of TGCTs and have been associated with increased JAK2 expression and shorter local failure-free survival [10]. Notably, the authors emphasized the potential role of targeted therapies with JAK2 inhibitors in CBL-mutant cases. Loss of CDKN2A/B has further been reported in a case of malignant TGCT with bilateral pleural metastatic disease [37]. Given that CDKN2A is a crucial component of the RB1 pathway, perturbations in the tumor suppressor pathway will result with deletion of CDKN2A [38]. These findings, though beyond the focus of our research question, underline the molecular heterogeneity of TGCTs and provide the rationale for further exploration.
Our study highlights novel kinase and ETS transcription factor gene driven pathways of tumorigenesis in atypical TGCTs. One caveat of our study is the limited sample size of atypical TGCTs, which is due to the rarity of its occurrence. Nonetheless, our findings suggest that atypical TGCTs may represent a distinct subtype that is different on the molecular level from conventional CSF1-driven TGCTs that show worrisome morphologic features and possibly greater propensity to local recurrences.

4. Materials and Methods

4.1. Case Selection

After institutional review board (IRB) approval (s18-00637), a total of 6 cases, i.e., 3 atypical TGCTs and 3 conventional TGCTs, were selected for this study from patients diagnosed at New York University Langone Health. No patient consent was required given that there was no direct patient contact. A retrospective archival search was performed, and all available slides were reviewed by two experienced bone and soft tissue pathologists (S.T.H. and G.J.) at our institution who concurred with the diagnoses.

4.2. Immunohistochemistry

Immunostains were performed on a Ventana BenchMark Ultra Autostainer (Ventana Medical Systems, Tucson, AZ, USA). The following prediluted antibodies were used: anti-CD68 (KP-1) primary antibody (Ventana, Tucson, AZ, USA), and anti-ERG (EPR3864) rabbit monoclonal primary antibody (Ventana, Tucson, AZ, USA) with appropriate controls.

4.3. Detection and Validation of Fusions

FISH using specific BAC probes targeting CSF1 were used. Subsequently, RNA was extracted and sequenced using a customized panel targeting 86 cancer-related genes (NYU FUSIONSEQer) using anchored multiplex PCR (ArcherDX®, Boulder, CO, USA). Briefly, RNA extraction was performed using automated Maxwell® RSC RNA FFPE Kit (Promega, Madison, WI, USA) and quantified using the Qubit fluorometric assay (Thermo Fisher Scientific, Waltham, MA, USA). Library preparation was carried by two-step PCR reactions (first- and second-strand cDNA synthesis) using manufacturer-provided reagents and designed primers (ArcherDX®, Boulder, CO, USA). The libraries were quantified using a quantitative PCR assay (Library Quantification Kit, KAPA Biosystems, Wilmington, MA, USA) and were then pooled and sequenced via the Illumina NextSeq system (2 × 150 bp paired end sequencing). Data analysis was performed on a Health Insurance Portability and Accountability Act (HIPAA)-compliant high-performance computing system using manufacturer-provided bioinformatics pipeline. One-step RT-PCR was performed using QIAGEN OneStep RT-PCR Kit (Qiagen, Germantown, MD, USA) with primers designed based on the fusion gene: NIPBL-ERG 210F: 5′-TTATAGTCTCTCGCCACAGCG-3′ and NIPBL-ERG 210R: 5′-GTCCTTCAGTAAGCCAGCCC-3′, FN1-ROS1 278F: 5′-TGTTACCGTGGGCAACTCTG-3′ and FN1-ROS1 278R 5′-TATGCCAGACAAAGGTCAGTG-3′, YAP1-MAML2 163F: 5′-CAACTCCAACCAGCAGCAACA-3′ and YAP1-MAML2 163R: 5′-AAAGCCATTGGGTCGCTTGC-3′, CSF1-KCNMA1 120F: 5′-CTGGCCATCCTCCTGGAATG-3′ and CSF1-KCNMA1 120R: 5′-CTCTCTTTGAGGGAGGGAGGA-3′, CSF1-FN1 222F: 5′-CAGTTGCTGGAGAAGGTCAAG-3′ and CSF1-FN1 222R : 5′-AACGCACCAGGAAGTTGGTTA-3′). RT-PCR product was purified using GenElute™ PCR Clean-Up Kit (Sigma-Aldrich, St. Louis, MO, USA) and sequenced on the ABI 3500× L genetic analyzer (Applied Biosystem/ThermoFisher, Foster City, CA, USA) using the same primer sets as shown above.

5. Conclusions

Our data show that atypical TGCTs harbor non-CSF1 fusions, suggesting the existence of alternate mechanisms of pathogenesis not implicating CSF1. This is underscored by the presence of novel fusion transcripts identified in these tumors that potentially portend increased local aggressiveness and recurrence in an otherwise benign lesion. Further investigation of our findings in a larger cohort is warranted.

Author Contributions

Conceptualization: T.V., S.T.H. and G.J.; data curation: T.V., G.S. and X.F.; formal analysis: T.V., G.S., X.F. and G.J.; methodology: G.S. and X.F.; resources: G.J.; writing—original draft: T.V.; writing—review and editing: S.T.H. and G.J. All authors have read and agreed to the published version of the manuscript.

Funding

This research received no external funding.

Conflicts of Interest

The authors declare no financial interests.

References

  1. Somerhausen, N.S.; Fletcher, C.D. Diffuse-type giant cell tumor: Clinicopathologic and immunohistochemical analysis of 50 cases with extraarticular disease. Am. J. Surg. Pathol. 2000, 24, 479–492. [Google Scholar] [CrossRef] [PubMed]
  2. Ushijima, M.; Hashimoto, H.; Tsuneyoshi, M.; Enjoji, M. Giant cell tumor of the tendon sheath (nodular tenosynovitis): A study of 207 cases to compare the large joint group with the common digit group. Cancer 1986, 57, 875–884. [Google Scholar] [CrossRef]
  3. Monaghan, H.; Salter, D.M.; Al-Nafussi, A. Giant cell tumour of tendon sheath (localised nodular tenosynovitis): Clinicopathological features of 71 cases. J. Clin. Pathol. 2001, 54, 404–407. [Google Scholar] [CrossRef] [PubMed] [Green Version]
  4. Kotwal, P.P.; Gupta, V.; Malhotra, R. Giant-cell tumour of the tendon sheath. Is radiotherapy indicated to prevent recurrence after surgery? J. Bone Jt. Surg. Br. 2000, 82, 571–573. [Google Scholar] [CrossRef]
  5. Nilsson, M.; Hoglund, M.; Panagopoulos, I.; Sciot, R.; Dal Cin, P.; Debiec-Rychter, M.; Mertens, F.; Mandahl, N. Molecular cytogenetic mapping of recurrent chromosomal breakpoints in tenosynovial giant cell tumors. Virchows Arch. 2002, 441, 475–480. [Google Scholar] [PubMed]
  6. West, R.B.; Rubin, B.P.; Miller, M.A.; Subramanian, S.; Kaygusuz, G.; Montgomery, K.; Zhu, S.; Marinelli, R.J.; De Luca, A.; Downs-Kelly, E.; et al. A landscape effect in tenosynovial giant-cell tumor from activation of csf1 expression by a translocation in a minority of tumor cells. Proc. Natl. Acad. Sci. USA 2006, 103, 690–695. [Google Scholar] [CrossRef] [Green Version]
  7. Cupp, J.S.; Miller, M.A.; Montgomery, K.D.; Nielsen, T.O.; O’Connell, J.X.; Huntsman, D.; van de Rijn, M.; Gilks, C.B.; West, R.B. Translocation and expression of csf1 in pigmented villonodular synovitis, tenosynovial giant cell tumor, rheumatoid arthritis and other reactive synovitides. Am. J. Surg. Pathol. 2007, 31, 970–976. [Google Scholar] [CrossRef]
  8. Panagopoulos, I.; Brandal, P.; Gorunova, L.; Bjerkehagen, B.; Heim, S. Novel csf1-s100a10 fusion gene and csf1 transcript identified by RNA sequencing in tenosynovial giant cell tumors. Int. J. Oncol. 2014, 44, 1425–1432. [Google Scholar] [CrossRef] [Green Version]
  9. Sekine, S.; Kiyono, T.; Ryo, E.; Ogawa, R.; Wakai, S.; Ichikawa, H.; Suzuki, K.; Arai, S.; Tsuta, K.; Ishida, M.; et al. Recurrent yap1-maml2 and yap1-nutm1 fusions in poroma and porocarcinoma. J. Clin. Investig. 2019, 130, 3827–3832. [Google Scholar] [CrossRef]
  10. Tsuda, Y.; Hirata, M.; Katayama, K.; Motoi, T.; Matsubara, D.; Oda, Y.; Fujita, M.; Kobayashi, H.; Kawano, H.; Nishida, Y.; et al. Massively parallel sequencing of tenosynovial giant cell tumors reveals novel csf1 fusion transcripts and novel somatic cbl mutations. Int. J. Cancer 2019, 145, 3276–3284. [Google Scholar] [CrossRef]
  11. Al-Ibraheemi, A.; Ahrens, W.A.; Fritchie, K.; Dong, J.; Oliveira, A.M.; Balzer, B.; Folpe, A.L. Malignant tenosynovial giant cell tumor: The true “synovial sarcoma?” A clinicopathologic, immunohistochemical, and molecular cytogenetic study of 10 cases, supporting origin from synoviocytes. Mod. Pathol. 2019, 32, 242–251. [Google Scholar] [CrossRef] [PubMed]
  12. Goldblum, J.R.; Folpe, A.L.; Weiss, S.W. Enzinger and Weiss’s Soft Tissue Tumors, 6th ed.; Elsevier: Philadelphia, PA, USA, 2014. [Google Scholar]
  13. Jo, V.Y.; Fletcher, C.D. Who classification of soft tissue tumours: An update based on the 2013 (4th) edition. Pathology 2014, 46, 95–104. [Google Scholar] [CrossRef] [PubMed]
  14. Folpe, A.L. Phosphaturic mesenchymal tumors: A review and update. Semin. Diagn. Pathol. 2019, 36, 260–268. [Google Scholar] [CrossRef] [PubMed]
  15. O’Connell, J.X.; Wehrli, B.M.; Nielsen, G.P.; Rosenberg, A.E. Giant cell tumors of soft tissue: A clinicopathologic study of 18 benign and malignant tumors. Am. J. Surg. Pathol. 2000, 24, 386–395. [Google Scholar] [CrossRef] [PubMed]
  16. Hsu, T.; Trojanowska, M.; Watson, D.K. Ets proteins in biological control and cancer. J. Cell. Biochem. 2004, 91, 896–903. [Google Scholar] [CrossRef] [PubMed] [Green Version]
  17. Oikawa, T.; Yamada, T. Molecular biology of the ETS family of transcription factors. Gene 2003, 303, 11–34. [Google Scholar] [CrossRef]
  18. Tomlins, S.A.; Laxman, B.; Varambally, S.; Cao, X.; Yu, J.; Helgeson, B.E.; Cao, Q.; Prensner, J.R.; Rubin, M.A.; Shah, R.B.; et al. Role of the tmprss2-erg gene fusion in prostate cancer. Neoplasia 2008, 10, 177–188. [Google Scholar] [CrossRef] [Green Version]
  19. Demichelis, F.; Fall, K.; Perner, S.; Andren, O.; Schmidt, F.; Setlur, S.R.; Hoshida, Y.; Mosquera, J.M.; Pawitan, Y.; Lee, C.; et al. Tmprss2: Erg gene fusion associated with lethal prostate cancer in a watchful waiting cohort. Oncogene 2007, 26, 4596–4599. [Google Scholar] [CrossRef] [Green Version]
  20. Perner, S.; Demichelis, F.; Beroukhim, R.; Schmidt, F.H.; Mosquera, J.M.; Setlur, S.; Tchinda, J.; Tomlins, S.A.; Hofer, M.D.; Pienta, K.G.; et al. Tmprss2:Erg fusion-associated deletions provide insight into the heterogeneity of prostate cancer. Cancer Res. 2006, 66, 8337–8341. [Google Scholar] [CrossRef] [Green Version]
  21. Berg, T.; Kalsaas, A.H.; Buechner, J.; Busund, L.T. Ewing sarcoma-peripheral neuroectodermal tumor of the kidney with a fus-erg fusion transcript. Cancer Genet. Cytogenet. 2009, 194, 53–57. [Google Scholar] [CrossRef]
  22. Ginsberg, J.P.; de Alava, E.; Ladanyi, M.; Wexler, L.H.; Kovar, H.; Paulussen, M.; Zoubek, A.; Dockhorn-Dworniczak, B.; Juergens, H.; Wunder, J.S.; et al. Ews-fli1 and ews-erg gene fusions are associated with similar clinical phenotypes in ewing’s sarcoma. J. Clin. Oncol. 1999, 17, 1809–1814. [Google Scholar] [CrossRef] [PubMed]
  23. Shing, D.C.; McMullan, D.J.; Roberts, P.; Smith, K.; Chin, S.F.; Nicholson, J.; Tillman, R.M.; Ramani, P.; Cullinane, C.; Coleman, N. Fus/erg gene fusions in ewing’s tumors. Cancer Res. 2003, 63, 4568–4576. [Google Scholar] [PubMed]
  24. Tate, J.G.; Bamford, S.; Jubb, H.C.; Sondka, Z.; Beare, D.M.; Bindal, N.; Boutselakis, H.; Cole, C.G.; Creatore, C.; Dawson, E.; et al. Cosmic: The catalogue of somatic mutations in cancer. Nucleic Acids Res. 2019, 47, D941–D947. [Google Scholar] [CrossRef] [PubMed] [Green Version]
  25. COSMIC. Available online: https://cancer.sanger.ac.uk/cosmic/fusion/overview?Fid=2778&gid=1538 (accessed on 3 October 2019).
  26. Chen, S.; Deniz, K.; Sung, Y.S.; Zhang, L.; Dry, S.; Antonescu, C.R. Ewing sarcoma with erg gene rearrangements: A molecular study focusing on the prevalence of fus-erg and common pitfalls in detecting ewsr1-erg fusions by fish. Genes Chromosomes Cancer 2016, 55, 340–349. [Google Scholar] [CrossRef] [PubMed] [Green Version]
  27. Visnes, T.; Giordano, F.; Kuznetsova, A.; Suja, J.A.; Lander, A.D.; Calof, A.L.; Strom, L. Localisation of the smc loading complex nipbl/mau2 during mammalian meiotic prophase i. Chromosoma 2014, 123, 239–252. [Google Scholar] [CrossRef] [Green Version]
  28. Gillis, L.A.; McCallum, J.; Kaur, M.; DeScipio, C.; Yaeger, D.; Mariani, A.; Kline, A.D.; Li, H.H.; Devoto, M.; Jackson, L.G.; et al. Nipbl mutational analysis in 120 individuals with cornelia de lange syndrome and evaluation of genotype-phenotype correlations. Am. J. Hum. Genet. 2004, 75, 610–623. [Google Scholar] [CrossRef] [Green Version]
  29. Wang, X.; Qiao, Y.; Asangani, I.A.; Ateeq, B.; Poliakov, A.; Cieslik, M.; Pitchiaya, S.; Chakravarthi, B.; Cao, X.; Jing, X.; et al. Development of peptidomimetic inhibitors of the erg gene fusion product in prostate cancer. Cancer Cell 2017, 31, 844–847. [Google Scholar] [CrossRef] [Green Version]
  30. Satoh, H.; Yoshida, M.C.; Matsushime, H.; Shibuya, M.; Sasaki, M. Regional localization of the human c-ros-1 on 6q22 and flt on 13q12. Jpn. J. Cancer Res. GANN 1987, 78, 772–775. [Google Scholar]
  31. Shaw, A.T.; Hsu, P.P.; Awad, M.M.; Engelman, J.A. Tyrosine kinase gene rearrangements in epithelial malignancies. Nat. Rev. Cancer 2013, 13, 772–787. [Google Scholar] [CrossRef]
  32. Bergethon, K.; Shaw, A.T.; Ou, S.H.; Katayama, R.; Lovly, C.M.; McDonald, N.T.; Massion, P.P.; Siwak-Tapp, C.; Gonzalez, A.; Fang, R.; et al. Ros1 rearrangements define a unique molecular class of lung cancers. J. Clin. Oncol. 2012, 30, 863–870. [Google Scholar] [CrossRef] [Green Version]
  33. Lee, J.C.; Jeng, Y.M.; Su, S.Y.; Wu, C.T.; Tsai, K.S.; Lee, C.H.; Lin, C.Y.; Carter, J.M.; Huang, J.W.; Chen, S.H.; et al. Identification of a novel fn1-fgfr1 genetic fusion as a frequent event in phosphaturic mesenchymal tumour. J. Pathol. 2015, 235, 539–545. [Google Scholar] [CrossRef] [PubMed]
  34. Totoki, Y.; Yoshida, A.; Hosoda, F.; Nakamura, H.; Hama, N.; Ogura, K.; Yoshida, A.; Fujiwara, T.; Arai, Y.; Toguchida, J.; et al. Unique mutation portraits and frequent col2a1 gene alteration in chondrosarcoma. Genome Res. 2014, 24, 1411–1420. [Google Scholar] [CrossRef] [PubMed] [Green Version]
  35. Puls, F.; Hofvander, J.; Magnusson, L.; Nilsson, J.; Haywood, E.; Sumathi, V.P.; Mangham, D.C.; Kindblom, L.G.; Mertens, F. Fn1-egf gene fusions are recurrent in calcifying aponeurotic fibroma. J. Pathol. 2016, 238, 502–507. [Google Scholar] [CrossRef] [PubMed]
  36. Grossmann, V.; Kohlmann, A.; Klein, H.U.; Schindela, S.; Schnittger, S.; Dicker, F.; Dugas, M.; Kern, W.; Haferlach, T.; Haferlach, C. Targeted next-generation sequencing detects point mutations, insertions, deletions and balanced chromosomal rearrangements as well as identifies novel leukemia-specific fusion genes in a single procedure. Leukemia 2011, 25, 671–680. [Google Scholar] [CrossRef]
  37. Alexiev, B.A.; Tumer, Y.; Yang, G.Y. Malignant tenosynovial giant cell tumor with CDKN2A/B genomic alteration: A histological, immunohistochemical, and molecular study. Hum. Pathol. 2017, 63, 144–148. [Google Scholar] [CrossRef]
  38. Møller, M.B.; Ino, Y.; Gerdes, A.M.; Skjødt, K.; Louis, D.N.; Pedersen, N.T. Aberrations of the p53 pathway components p53, MDM2 and CDKN2A appear independent in diffuse large B cell lymphoma. Leukemia 1999, 13, 453–459. [Google Scholar] [CrossRef] [Green Version]
Figure 1. Clinical presentation, radiologic features, and histomorphology of Case 1. (A) A soft tissue mass was seen located on the volar aspect of the wrist. (B) Lateral X-ray of the right wrist revealed a nonspecific mass. (C) Sagittal T1 fat-suppressed postcontrast MRI showed hyperintensity of the lesion. (D) Gross appearance of the excised tumor demonstrated an area of central hemorrhage encased by a partial deep fibrous band. (E) Photomicrograph with low-power magnification showing a cellular neoplasm growing in a vague fascicular pattern with scattered osteoclast-like multinucleated giant cells and areas of hyaline matrix deposition and focal osteoid matrix formation (original magnification ×4). (F) Areas of hypercellularity with stromal hyalinization and osteoid deposition (original magnification ×10). (G) Higher-power magnification demonstrated areas of increased cellularity with spindle cells with enlarged nuclei, open chromatin, and focal enlarged nucleoli. Note the lack of necrosis (original magnification ×20). (H) Tumor cells displayed immunopositivity for CD68, both mononuclear and multinucleated cells.
Cancers 12 00100 g001
Figure 2. Spectrum of histomorphologic features of atypical tenosynovial giant cell tumors (TGCTs) in Case 2 (AC) and Case 3 (DF). (A) Mid-power magnification showing a cellular neoplasm with a predominance of mononucleated cells with scattered multinucleated osteoclast-like cells with intervening fibrous stroma (original magnification ×20). (B) Areas showing hyperchromatic pleomorphic nuclei and spindling. No necrosis was seen (original magnification ×40). (C) High-power magnification demonstrating multinucleated giant cells with symplastic changes in addition to increased cellular atypia in the mononuclear cell population consistent with the rendered diagnosis of atypical component within the tumor (original magnification ×40). (D) Photomicrograph of more benign-appearing areas composed of multinucleated giant cells and sheets of epithelioid histiocytoid cells arranged in a syncytial pattern (original magnification ×20). (E) Areas showing presence of larger pleomorphic nuclei with open chromatin and prominent nucleoli (original magnification ×40). (F) Scattered areas of cells with enlarged nuclei, spindle cells, and cells with virocyte-like nucleoli conferring worrisome morphology (original magnification ×40).
Cancers 12 00100 g002
Figure 3. Discovery and validation of the novel gene fusions in atypical TGCTs. A partial sequence chromatogram is shown from each fusion transcript, with the arrow depicting the fusion breakpoint. Gel electrophoresis images display respective cDNA fragment amplification. A positive band can be seen in Lane 1, supporting the presence of the fusion product. M, DNA marker (Promega, Madison, WI, USA); Lane 1, patient case; Lane 2, HapMap normal RNA control; Lane 3, no template control (water control). (A,B) Identification and validation of NIPBL-ERG fusion transcript by anchored multiple PCR (AMP), Sanger sequencing, and RT-PCR. (C) ERG overexpression in the mononuclear tumor cells by immunohistochemistry (IHC). Identification and validation of FN1-ROS1 (D,E) and YAP1-MAML2 (F,G) fusion transcripts by AMP, Sanger sequencing, and RT-PCR.
Cancers 12 00100 g003aCancers 12 00100 g003b
Figure 4. Detection and confirmation of CSF1 partner genes identified in conventional TGCTs. A partial sequence chromatogram is shown from each fusion transcript, with the arrow depicting the fusion breakpoint. Gel electrophoresis images display respective cDNA fragment amplification. A positive band can be seen in Lane 1, supporting the presence of the fusion product. M, DNA marker (Promega, Madison, WI, USA); Lane 1, patient case; Lane 2, HapMap normal RNA control; Lane 3, no template control (water control). Identification and validation of CSF1-KCNMA1 (A) and CSF1-FN1 (B) fusion transcripts by AMP, Sanger sequencing, and RT-PCR.
Cancers 12 00100 g004
Table 1. Summary of clinical features and molecular findings. N/A, not applicable.
CaseTumor TypeFusionLocation/LateralitySize (cm)SexAge (Years)Local RecurrenceDuration to Latest Recurrence (Months)Follow-Up after Latest Excision/Recurrence (Months)Atypical Features
1Atypical TGCTNIPBL-ERGWrist/Right3.2Female69Yes; multiple79Prominent cellularity; increased mitotic activity; spindle cells
2Atypical TGCTFN1-ROS1Wrist/Left2; fragmentedFemale46Yes; multiple10432Hyperchromatic nuclei; symplastic change; spindle cells
3Atypical TGCTYAP1-MAML2Ankle/Left3.8Female64NoN/A4Enlarged nuclei; virocyte-like nucleoli; myxoid change; spindle cells
4TGCTCSF1-COL6A3Arm/Left1.5Female14NoN/A14N/A
5TGCTCSF1-KCNMA1Knee/Right2.5Male43NoN/A15N/A
6TGCTCSF1-FN1Knee/Right2.5Male29NoN/A15N/A

