Non-Invasive Prediction of IDH Mutation in Patients with Glioma WHO II/III/IV Based on F-18-FET PET-Guided In Vivo 1H-Magnetic Resonance Spectroscopy and Machine Learning

 , , , ,
  ,
,  ,
,  and
and
Abstract
Simple Summary
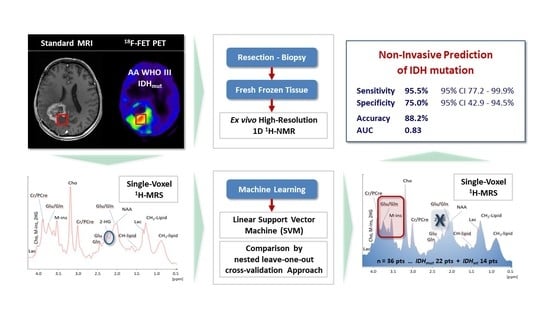
Abstract
1. Introduction
2. Results
2.1. Patient Characteristics
2.2. Standard 1H-MRS at 3T Is Not Sufficient to Reliably Detect 2-HG
2.3. IDH Mutation Induces a Specific Pattern of Alterations in 1H-MR Spectra
2.4. A Linear Support Vector Machine Provides High Sensitivity and Specificity in Detecting IDHmut
2.5. In Vivo and Ex Vivo Analysis of Metabolites
3. Discussion
4. Materials and Methods
4.1. Patients Characteristics
4.2. Glioma Diagnosis and Molecular Parameters
4.3. Standard MRI and 18F-FET PET Imaging
4.4. Data Acquisition of 1H-MRS
4.5. 1H-MRS Data Pre-Processing
4.6. 1H-MRS Classification
4.7. Ex Vivo Evaluation of Tumor Material
5. Conclusions
Supplementary Materials
Author Contributions
Funding
Conflicts of Interest
References
- Stupp, R.; Mason, W.P.; Bent, M.J.V.D.; Weller, M.; Fisher, B.; Taphoorn, M.J.; Belanger, K.; Brandes, A.A.; Marosi, C.; Bogdahn, U.; et al. Radiotherapy plus concomitant and adjuvant temozolomide for glioblastoma. N. Engl. J. Med. 2005, 352, 987–996. [Google Scholar] [CrossRef]
- Stupp, R.; Hegi, M.E.; Gorlia, T.; Erridge, S.C.; Perry, J.; Hong, Y.-K.; Aldape, K.D.; Lhermitte, B.; Pietsch, T.; Grujicic, D.; et al. Cilengitide combined with standard treatment for patients with newly diagnosed glioblastoma with methylated MGMT promoter (CENTRIC EORTC 26071-22072 study): A multicentre, randomised, open-label, phase 3 trial. Lancet Oncol. 2014, 15, 1100–1108. [Google Scholar] [CrossRef]
- Louis, D.N.; Perry, A.; Reifenberger, G.; Von Deimling, A.; Figarella-Branger, D.; Cavenee, W.K.; Ohgaki, H.; Wiestler, O.D.; Kleihues, P.; Ellison, D.W. The 2016 World Health Organization classification of tumors of the central nervous system: A summary. Acta Neuropathol. 2016, 131, 803–820. [Google Scholar] [CrossRef]
- Eckel-Passow, J.E.; Lachance, D.H.; Molinaro, A.M.; Walsh, K.M.; Decker, P.A.; Sicotte, H.; Pekmezci, M.; Rice, T.; Kosel, M.L.; Smirnov, I.V.; et al. Glioma groups based on 1p/19q, IDH, and TERT promoter mutations in tumors. N. Engl. J. Med. 2015, 372, 2499–2508. [Google Scholar] [CrossRef]
- Brat, D.J.; Verhaak, R.G.; Aldape, K.D.; Yung, W.K.; Salama, S.R.; Cooper, L.A.; Rheinbay, E.; Miller, C.R.; Vitucci, M.; Morozova, O.; et al. Comprehensive, integrative genomic analysis of diffuse lower-grade gliomas. N. Engl. J. Med. 2015, 372, 2481–2498. [Google Scholar] [CrossRef]
- Yan, H.; Parsons, D.W.; Jin, G.; McLendon, R.; Rasheed, B.A.; Yuan, W.; Kos, I.; Batinic-Haberle, I.; Jones, S.; Riggins, G.J.; et al. IDH1 and IDH2 mutations in gliomas. N. Engl. J. Med. 2009, 360, 765–773. [Google Scholar] [CrossRef]
- Hartmann, C.; Hentschel, B.; Wick, W.; Capper, D.; Felsberg, J.; Simon, M.; Westphal, M.; Schackert, G.; Meyermann, R.; Pietsch, T.; et al. Patients with IDH1 wild type anaplastic astrocytomas exhibit worse prognosis than IDH1-mutated glioblastomas, and IDH1 mutation status accounts for the unfavorable prognostic effect of higher age: Implications for classification of gliomas. Acta Neuropathol. 2010, 120, 707–718. [Google Scholar] [CrossRef]
- Cuyàs, E.; Fernández-Arroyo, S.; Corominas-Faja, B.; Rodríguez-Gallego, E.; Bosch-Barrera, J.; Martin-Castillo, B.; De Llorens, R.; Joven, J.; Menendez, J.A. Oncometabolic mutation IDH1 R132H confers a metformin-hypersensitive phenotype. Oncotarget 2015, 6, 12279–12296. [Google Scholar] [CrossRef]
- Elhammali, A.; Ippolito, J.E.; Collins, L.; Crowley, J.; Marasa, J.; Piwnica-Worms, D. A high-throughput fluorimetric assay for 2-hydroxyglutarate identifies Zaprinast as a glutaminase inhibitor. Cancer Discov. 2014, 4, 828–839. [Google Scholar] [CrossRef]
- Cairns, R.A.; Mak, T.W. Oncogenic isocitrate dehydrogenase mutations: Mechanisms, models, and clinical opportunities. Cancer Discov. 2013, 3, 730–741. [Google Scholar] [CrossRef]
- Jalbert, L.E.; Elkhaled, A.; Phillips, J.J.; Neill, E.; Williams, A.; Crane, J.C.; Olson, M.P.; Molinaro, A.M.; Berger, M.S.; Kurhanewicz, J.; et al. Metabolic profiling of IDH mutation and malignant progression in infiltrating glioma. Sci. Rep. 2017, 7, 44792. [Google Scholar] [CrossRef]
- Izquierdo-Garcia, J.L.; Cai, L.M.; Chaumeil, M.M.; Eriksson, P.; Robinson, A.E.; Pieper, R.O.; Phillips, J.J.; Ronen, S.M. Glioma cells with the IDH1 mutation modulate metabolic fractional flux through pyruvate carboxylase. PLoS ONE 2014, 9, e108289. [Google Scholar] [CrossRef]
- Ohka, F.; Ito, M.; Ranjit, M.; Senga, T.; Motomura, A.; Motomura, K.; Saito, K.; Kato, K.; Kato, Y.; Wakabayashi, T.; et al. Quantitative metabolome analysis profiles activation of glutaminolysis in glioma with IDH1 mutation. Tumour Biol. 2014, 35, 5911–5920. [Google Scholar] [CrossRef]
- Brat, D.J.; Aldape, K.; Colman, H.; Holland, E.C.; Louis, D.N.; Jenkins, R.B.; Kleinschmidt-DeMasters, B.K.; Perry, A.; Reifenberger, G.; Stupp, R.; et al. cIMPACT-NOW update 3: Recommended diagnostic criteria for “Diffuse astrocytic glioma, IDH-wildtype, with molecular features of glioblastoma, WHO grade IV”. Acta Neuropathol. 2018, 136, 805–810. [Google Scholar] [CrossRef]
- Grassian, A.R.; Parker, S.J.; Davidson, S.M.; Divakaruni, A.S.; Green, C.R.; Zhang, X.; Slocum, K.L.; Pu, M.; Lin, F.; Vickers, C.; et al. IDH1 mutations alter citric acid cycle metabolism and increase dependence on oxidative mitochondrial metabolism. Cancer Res. 2014, 74, 3317–3331. [Google Scholar] [CrossRef]
- Bhavya, B.; Anand, C.R.; Madhusoodanan, U.K.; Rajalakshmi, P.; Krishnakumar, K.; Easwer, H.V.; Deepti, A.N.; Gopala, S. To be wild or mutant: Role of isocitrate dehydrogenase 1 (IDH1) and 2-hydroxy glutarate (2-HG) in gliomagenesis and treatment outcome in glioma. Cell. Mol. Neurobiol. 2020, 40, 53–63. [Google Scholar] [CrossRef]
- Andronesi, O.C.; Rapalino, O.; Gerstner, E.; Chi, A.; Batchelor, T.T.; Cahill, D.P.; Sorensen, A.G.; Rosen, B.R. Detection of oncogenic IDH1 mutations using magnetic resonance spectroscopy of 2-hydroxyglutarate. J. Clin. Investig. 2013, 123, 3659–3663. [Google Scholar] [CrossRef]
- Capper, D.; Weissert, S.; Balss, J.; Habel, A.; Meyer, J.; Jäger, D.; Ackermann, U.; Tessmer, C.; Korshunov, A.; Zentgraf, H.; et al. Characterization of R132H mutation-specific IDH1 antibody binding in brain tumors. Brain Pathol. 2010, 20, 245–254. [Google Scholar] [CrossRef]
- Chen, L.; Voronovich, Z.; Clark, K.; Hands, I.; Mannas, J.; Walsh, M.; Nikiforova, M.N.; Durbin, E.B.; Weiss, H.; Horbinski, C. Predicting the likelihood of an isocitrate dehydrogenase 1 or 2 mutation in diagnoses of infiltrative glioma. Neuro. Oncol. 2014, 16, 1478–1483. [Google Scholar] [CrossRef]
- Suh, C.H.; Kim, H.S.; Jung, S.C.; Choi, C.G.; Kim, S.J. 2-Hydroxyglutarate MR spectroscopy for prediction of isocitrate dehydrogenase mutant glioma: A systemic review and meta-analysis using individual patient data. Neuro. Oncol. 2018, 20, 1573–1583. [Google Scholar] [CrossRef]
- Rohle, D.; Popovici-Muller, J.; Palaskas, N.; Turcan, S.; Grommes, C.; Campos, C.; Tsoi, J.; Clark, O.; Oldrini, B.; Komisopoulou, E.; et al. An inhibitor of mutant IDH1 delays growth and promotes differentiation of glioma cells. Science 2013, 340, 626–630. [Google Scholar] [CrossRef]
- Golub, D.; Iyengar, N.; Dogra, S.; Wong, T.; Bready, D.; Tang, K.; Modrek, A.S.; Placantonakis, D.G. Mutant isocitrate dehydrogenase inhibitors as targeted cancer therapeutics. Front. Oncol. 2019, 9, 417. [Google Scholar] [CrossRef]
- Schumacher, T.; Bunse, L.; Pusch, S.; Sahm, F.; Wiestler, B.; Quandt, J.; Menn, O.; Osswald, M.; Oezen, I.; Ott, M.; et al. A vaccine targeting mutant IDH1 induces antitumour immunity. Nature 2014, 512, 324–327. [Google Scholar] [CrossRef]
- Suh, C.H.; Kim, H.S.; Jung, S.C.; Choi, C.G.; Kim, S.J. Imaging prediction of isocitrate dehydrogenase (IDH) mutation in patients with glioma: A systemic review and meta-analysis. Eur. Radiol. 2019, 29, 745–758. [Google Scholar] [CrossRef] [PubMed]
- Zhou, H.; Chang, K.; Bai, H.X.; Xiao, B.; Su, C.; Bi, W.L.; Zhang, P.J.; Senders, J.T.; Vallieres, M.; Kavouridis, V.K.; et al. Machine learning reveals multimodal MRI patterns predictive of isocitrate dehydrogenase and 1p/19q status in diffuse low- and high-grade gliomas. J. Neuroncol. 2019, 142, 299–307. [Google Scholar] [CrossRef] [PubMed]
- Lohmann, P.; Lerche, C.; Bauer, E.K.; Steger, J.; Stoffels, G.; Blau, T.; Dunkl, V.; Kocher, M.; Viswanathan, S.; Filss, C.P.; et al. Predicting IDH genotype in gliomas using FET PET radiomics. Sci. Rep. 2018, 8, 13328. [Google Scholar] [CrossRef] [PubMed]
- Vettermann, F.; Suchorska, B.; Unterrainer, M.; Nelwan, D.; Forbrig, R.; Ruf, V.; Wenter, V.; Kreth, F.W.; Herms, J.; Bartenstein, P.; et al. Non-invasive prediction of IDH-wildtype genotype in gliomas using dynamic (18)F-FET PET. Eur. J. Nucl. Med. Mol. Imaging 2019, 46, 2581–2589. [Google Scholar] [CrossRef] [PubMed]
- Verger, A.; Stoffels, G.; Bauer, E.K.; Lohmann, P.; Blau, T.; Fink, G.R.; Neumaier, B.; Shah, N.J.; Langen, K.J.; Galldiks, N. Static and dynamic (18)F-FET PET for the characterization of gliomas defined by IDH and 1p/19q status. Eur. J. Nucl. Med. Mol. Imaging 2018, 45, 443–451. [Google Scholar] [CrossRef]
- Varma, S.; Simon, R. Bias in error estimation when using cross-validation for model selection. BMC Bioinform. 2006, 7, 91. [Google Scholar] [CrossRef]
- Choi, C.; Ganji, S.K.; DeBerardinis, R.J.; Hatanpaa, K.J.; Rakheja, D.; Kovacs, Z.; Yang, X.L.; Mashimo, T.; Raisanen, J.M.; Marin-Valencia, I.; et al. 2-hydroxyglutarate detection by magnetic resonance spectroscopy in IDH-mutated patients with gliomas. Nat. Med. 2012, 18, 624–629. [Google Scholar] [CrossRef]
- Berrington, A.; Voets, N.L.; Larkin, S.J.; de Pennington, N.; McCullagh, J.; Stacey, R.; Schofield, C.J.; Jezzard, P.; Clare, S.; Cadoux-Hudson, T.; et al. A comparison of 2-hydroxyglutarate detection at 3 and 7 T with long-TE semi-LASER. NMR Biomedicine 2018, 31. [Google Scholar] [CrossRef] [PubMed]
- Shen, X.; Voets, N.L.; Larkin, S.J.; de Pennington, N.; Plaha, P.; Stacey, R.; McCullagh, J.S.O.; Schofield, C.J.; Clare, S.; Jezzard, P.; et al. A noninvasive comparison study between human gliomas with IDH1 and IDH2 mutations by MR spectroscopy. Metabolites 2019, 9. [Google Scholar] [CrossRef]
- Andronesi, O.C.; Kim, G.S.; Gerstner, E.; Batchelor, T.; Tzika, A.A.; Fantin, V.R.; Vander Heiden, M.G.; Sorensen, A.G. Detection of 2-hydroxyglutarate in IDH-mutated glioma patients by in vivo spectral-editing and 2D correlation magnetic resonance spectroscopy. Sci. Transl. Med. 2012, 4, 116ra114. [Google Scholar] [CrossRef] [PubMed]
- Verma, G.; Mohan, S.; Nasrallah, M.P.; Brem, S.; Lee, J.Y.; Chawla, S.; Wang, S.; Nagarajan, R.; Thomas, M.A.; Poptani, H. Non-invasive detection of 2-hydroxyglutarate in IDH-mutated gliomas using two-dimensional localized correlation spectroscopy (2D L-COSY) at 7 Tesla. J. Transl. Med. 2016, 14, 274. [Google Scholar] [CrossRef] [PubMed]
- Wenger, K.J.; Hattingen, E.; Harter, P.N.; Richter, C.; Franz, K.; Steinbach, J.P.; Bähr, O.; Pilatus, U. Fitting algorithms and baseline correction influence the results of non-invasive in vivo quantitation of 2-hydroxyglutarate with (1) H-MRS. NMR Biomed. 2019, 32, e4027. [Google Scholar] [CrossRef] [PubMed]
- Pope, W.B.; Prins, R.M.; Albert Thomas, M.; Nagarajan, R.; Yen, K.E.; Bittinger, M.A.; Salamon, N.; Chou, A.P.; Yong, W.H.; Soto, H.; et al. Non-invasive detection of 2-hydroxyglutarate and other metabolites in IDH1 mutant glioma patients using magnetic resonance spectroscopy. J. Neurooncol. 2012, 107, 197–205. [Google Scholar] [CrossRef] [PubMed]
- Tiwari, V.; Daoud, E.V.; Hatanpaa, K.J.; Gao, A.; Zhang, S.; An, Z.; Ganji, S.K.; Raisanen, J.M.; Lewis, C.M.; Askari, P.; et al. Glycine by MR spectroscopy is an imaging biomarker of glioma aggressiveness. Neuro. Oncol. 2020, 22, 1018–1029. [Google Scholar] [CrossRef]
- Branzoli, F.; Marjańska, M. Magnetic resonance spectroscopy of isocitrate dehydrogenase mutated gliomas: Current knowledge on the neurochemical profile. Curr. Opin. Neurol. 2020, 33, 413–421. [Google Scholar] [CrossRef]
- Nagashima, H.; Tanaka, K.; Sasayama, T.; Irino, Y.; Sato, N.; Takeuchi, Y.; Kyotani, K.; Mukasa, A.; Mizukawa, K.; Sakata, J.; et al. Diagnostic value of glutamate with 2-hydroxyglutarate in magnetic resonance spectroscopy for IDH1 mutant glioma. Neuro. Oncol. 2016, 18, 1559–1568. [Google Scholar] [CrossRef]
- Miyata, S.; Tominaga, K.; Sakashita, E.; Urabe, M.; Onuki, Y.; Gomi, A.; Yamaguchi, T.; Mieno, M.; Mizukami, H.; Kume, A.; et al. Comprehensive metabolomic analysis of IDH1(R132H) clinical glioma samples reveals suppression of β-oxidation due to carnitine deficiency. Sci. Rep. 2019, 9, 9787. [Google Scholar] [CrossRef]
- Nagashima, H.; Sasayama, T.; Tanaka, K.; Kyotani, K.; Sato, N.; Maeyama, M.; Kohta, M.; Sakata, J.; Yamamoto, Y.; Hosoda, K.; et al. Myo-inositol concentration in MR spectroscopy for differentiating high grade glioma from primary central nervous system lymphoma. J. Neurooncol. 2018, 136, 317–326. [Google Scholar] [CrossRef]
- Steidl, E.; Pilatus, U.; Hattingen, E.; Steinbach, J.P.; Zanella, F.; Ronellenfitsch, M.W.; Bahr, O. Myoinositol as a biomarker in recurrent glioblastoma treated with bevacizumab: A 1H-magnetic resonance spectroscopy study. PLoS ONE 2016, 11, e0168113. [Google Scholar] [CrossRef]
- Riemenschneider, M.J.; Fischer, J.; Grassow-Narlik, M.; Mawrin, C.; von Deimling, A.; Pietsch, T.; Reifenberger, G.; Mueller, W.C.; Sommer, C.J.; Dietel, M.; et al. Quality assurance in neuropathology: Experiences from the round robin trials on IDH mutation and MGMT promoter methylation testing launched by the quality assurance initiative pathology (QuIP) in 2018 and 2019. Clin. Neuropathol. 2020, 39, 203–211. [Google Scholar] [CrossRef]
- Dietmaier, W.; Lorenz, J.; Riemenschneider, M.J. Molecular diagnostics in neuropathology. Pathologe 2015, 36, 171–180. [Google Scholar] [CrossRef]
- Riemenschneider, M.J.; Louis, D.N.; Weller, M.; Hau, P. Refined brain tumor diagnostics and stratified therapies: The requirement for a multidisciplinary approach. Acta Neuropathol. 2013, 126, 21–37. [Google Scholar] [CrossRef]
- Langen, K.J.; Bartenstein, P.; Boecker, H.; Brust, P.; Coenen, H.H.; Drzezga, A.; Grünwald, F.; Krause, B.J.; Kuwert, T.; Sabri, O.; et al. German guidelines for brain tumour imaging by PET and SPECT using labelled amino acids. Nuklearmedizin 2011, 50, 167–173. [Google Scholar] [CrossRef]
- Wester, H.J.; Herz, M.; Weber, W.; Heiss, P.; Senekowitsch-Schmidtke, R.; Schwaiger, M.; Stöcklin, G. Synthesis and radiopharmacology of O-(2-[18F]fluoroethyl)-L-tyrosine for tumor imaging. J. Nucl. Med. 1999, 40, 205–212. [Google Scholar]
- Stefan, D.; Cesare, F.D.; Andrasescu, A.; Popa, E.; Lazariev, A.; Vescovo, E.; Strbak, O.; Williams, S.; Starcuk, Z.; Cabanas, M.; et al. Quantitation of magnetic resonance spectroscopy signals: The jMRUI software package. Meas. Sci. Technol. 2009, 20, 104035. [Google Scholar] [CrossRef]
- Gronwald, W.; Klein, M.S.; Kaspar, H.; Fagerer, S.R.; Nurnberger, N.; Dettmer, K.; Bertsch, T.; Oefner, P.J. Urinary metabolite quantification employing 2D NMR spectroscopy. Anal. Chem. 2008, 80, 9288–9297. [Google Scholar] [CrossRef]


| IDH1-Mutation | |||||||||
|---|---|---|---|---|---|---|---|---|---|
| IDHwt | IDHmut | ||||||||
| Mean | Median | Number | in % | Mean | Median | Number | in % | ||
| Age at first diagnosis | 55 | 54 | 39 | 37 | |||||
| Age at begin of trial * | 55 | 55 | 43 | 43 | |||||
| Gender | male | 6 | 50% | 12 | 55% | ||||
| female | 6 | 50% | 10 | 45% | |||||
| Diagnosis | diffuse astrocytoma | 0 | 0% | 3 | 14% | ||||
| oligodendroglioma | 0 | 0% | 4 | 18% | |||||
| anaplastic astrocytoma | 2 | 17% | 9 | 41% | |||||
| anaplastic oligodendroglioma | 0 | 0% | 4 | 18% | |||||
| glioblastoma | 10 | 83% | 2 | 9% | |||||
| WHO | II | 0 | 0% | 7 | 32% | ||||
| III | 2 | 17% | 13 | 59% | |||||
| IV | 10 | 83% | 2 | 9% | |||||
| MGMT-Status | non-methylated | 8 | 67% | 6 | 27% | ||||
| methylated | 4 | 33% | 15 | 68% | |||||
| unknown | 0 | 0% | 1 | 5% | |||||
| LOH1p19q | no | 6 | 50% | 14 | 64% | ||||
| yes | 0 | 0% | 7 | 32% | |||||
| unknown | 6 | 50% | 1 | 5% | |||||
| Karnofsky | 80 | 5 | 42% | 0 | 0% | ||||
| 90 | 3 | 25% | 5 | 23% | |||||
| 100 | 4 | 33% | 17 | 77% | |||||
| Timepoint of Inclusion | first-line treatment | 6 | 50% | 14 | 64% | ||||
| first relapse | 5 | 42% | 4 | 18% | |||||
| >first relapse | 1 | 8% | 4 | 18% | |||||
| * range 25–73 years | * range 21–66 years | ||||||||
Publisher’s Note: MDPI stays neutral with regard to jurisdictional claims in published maps and institutional affiliations. |
© 2020 by the authors. Licensee MDPI, Basel, Switzerland. This article is an open access article distributed under the terms and conditions of the Creative Commons Attribution (CC BY) license (http://creativecommons.org/licenses/by/4.0/).
Share and Cite
Bumes, E.; Wirtz, F.-P.; Fellner, C.; Grosse, J.; Hellwig, D.; Oefner, P.J.; Häckl, M.; Linker, R.; Proescholdt, M.; Schmidt, N.O.; et al. Non-Invasive Prediction of IDH Mutation in Patients with Glioma WHO II/III/IV Based on F-18-FET PET-Guided In Vivo 1H-Magnetic Resonance Spectroscopy and Machine Learning. Cancers 2020, 12, 3406. https://doi.org/10.3390/cancers12113406
Bumes E, Wirtz F-P, Fellner C, Grosse J, Hellwig D, Oefner PJ, Häckl M, Linker R, Proescholdt M, Schmidt NO, et al. Non-Invasive Prediction of IDH Mutation in Patients with Glioma WHO II/III/IV Based on F-18-FET PET-Guided In Vivo 1H-Magnetic Resonance Spectroscopy and Machine Learning. Cancers. 2020; 12(11):3406. https://doi.org/10.3390/cancers12113406
Chicago/Turabian StyleBumes, Elisabeth, Fro-Philip Wirtz, Claudia Fellner, Jirka Grosse, Dirk Hellwig, Peter J. Oefner, Martina Häckl, Ralf Linker, Martin Proescholdt, Nils Ole Schmidt, and et al. 2020. "Non-Invasive Prediction of IDH Mutation in Patients with Glioma WHO II/III/IV Based on F-18-FET PET-Guided In Vivo 1H-Magnetic Resonance Spectroscopy and Machine Learning" Cancers 12, no. 11: 3406. https://doi.org/10.3390/cancers12113406
APA StyleBumes, E., Wirtz, F.-P., Fellner, C., Grosse, J., Hellwig, D., Oefner, P. J., Häckl, M., Linker, R., Proescholdt, M., Schmidt, N. O., Riemenschneider, M. J., Samol, C., Rosengarth, K., Wendl, C., Hau, P., Gronwald, W., & Hutterer, M. (2020). Non-Invasive Prediction of IDH Mutation in Patients with Glioma WHO II/III/IV Based on F-18-FET PET-Guided In Vivo 1H-Magnetic Resonance Spectroscopy and Machine Learning. Cancers, 12(11), 3406. https://doi.org/10.3390/cancers12113406