Distinct Clinical Characteristics in Young-Onset Pancreatic Neuroendocrine Tumor

 ,
, 

Abstract
:Simple Summary
Abstract
1. Introduction
2. Results
2.1. Baseline Characteristics
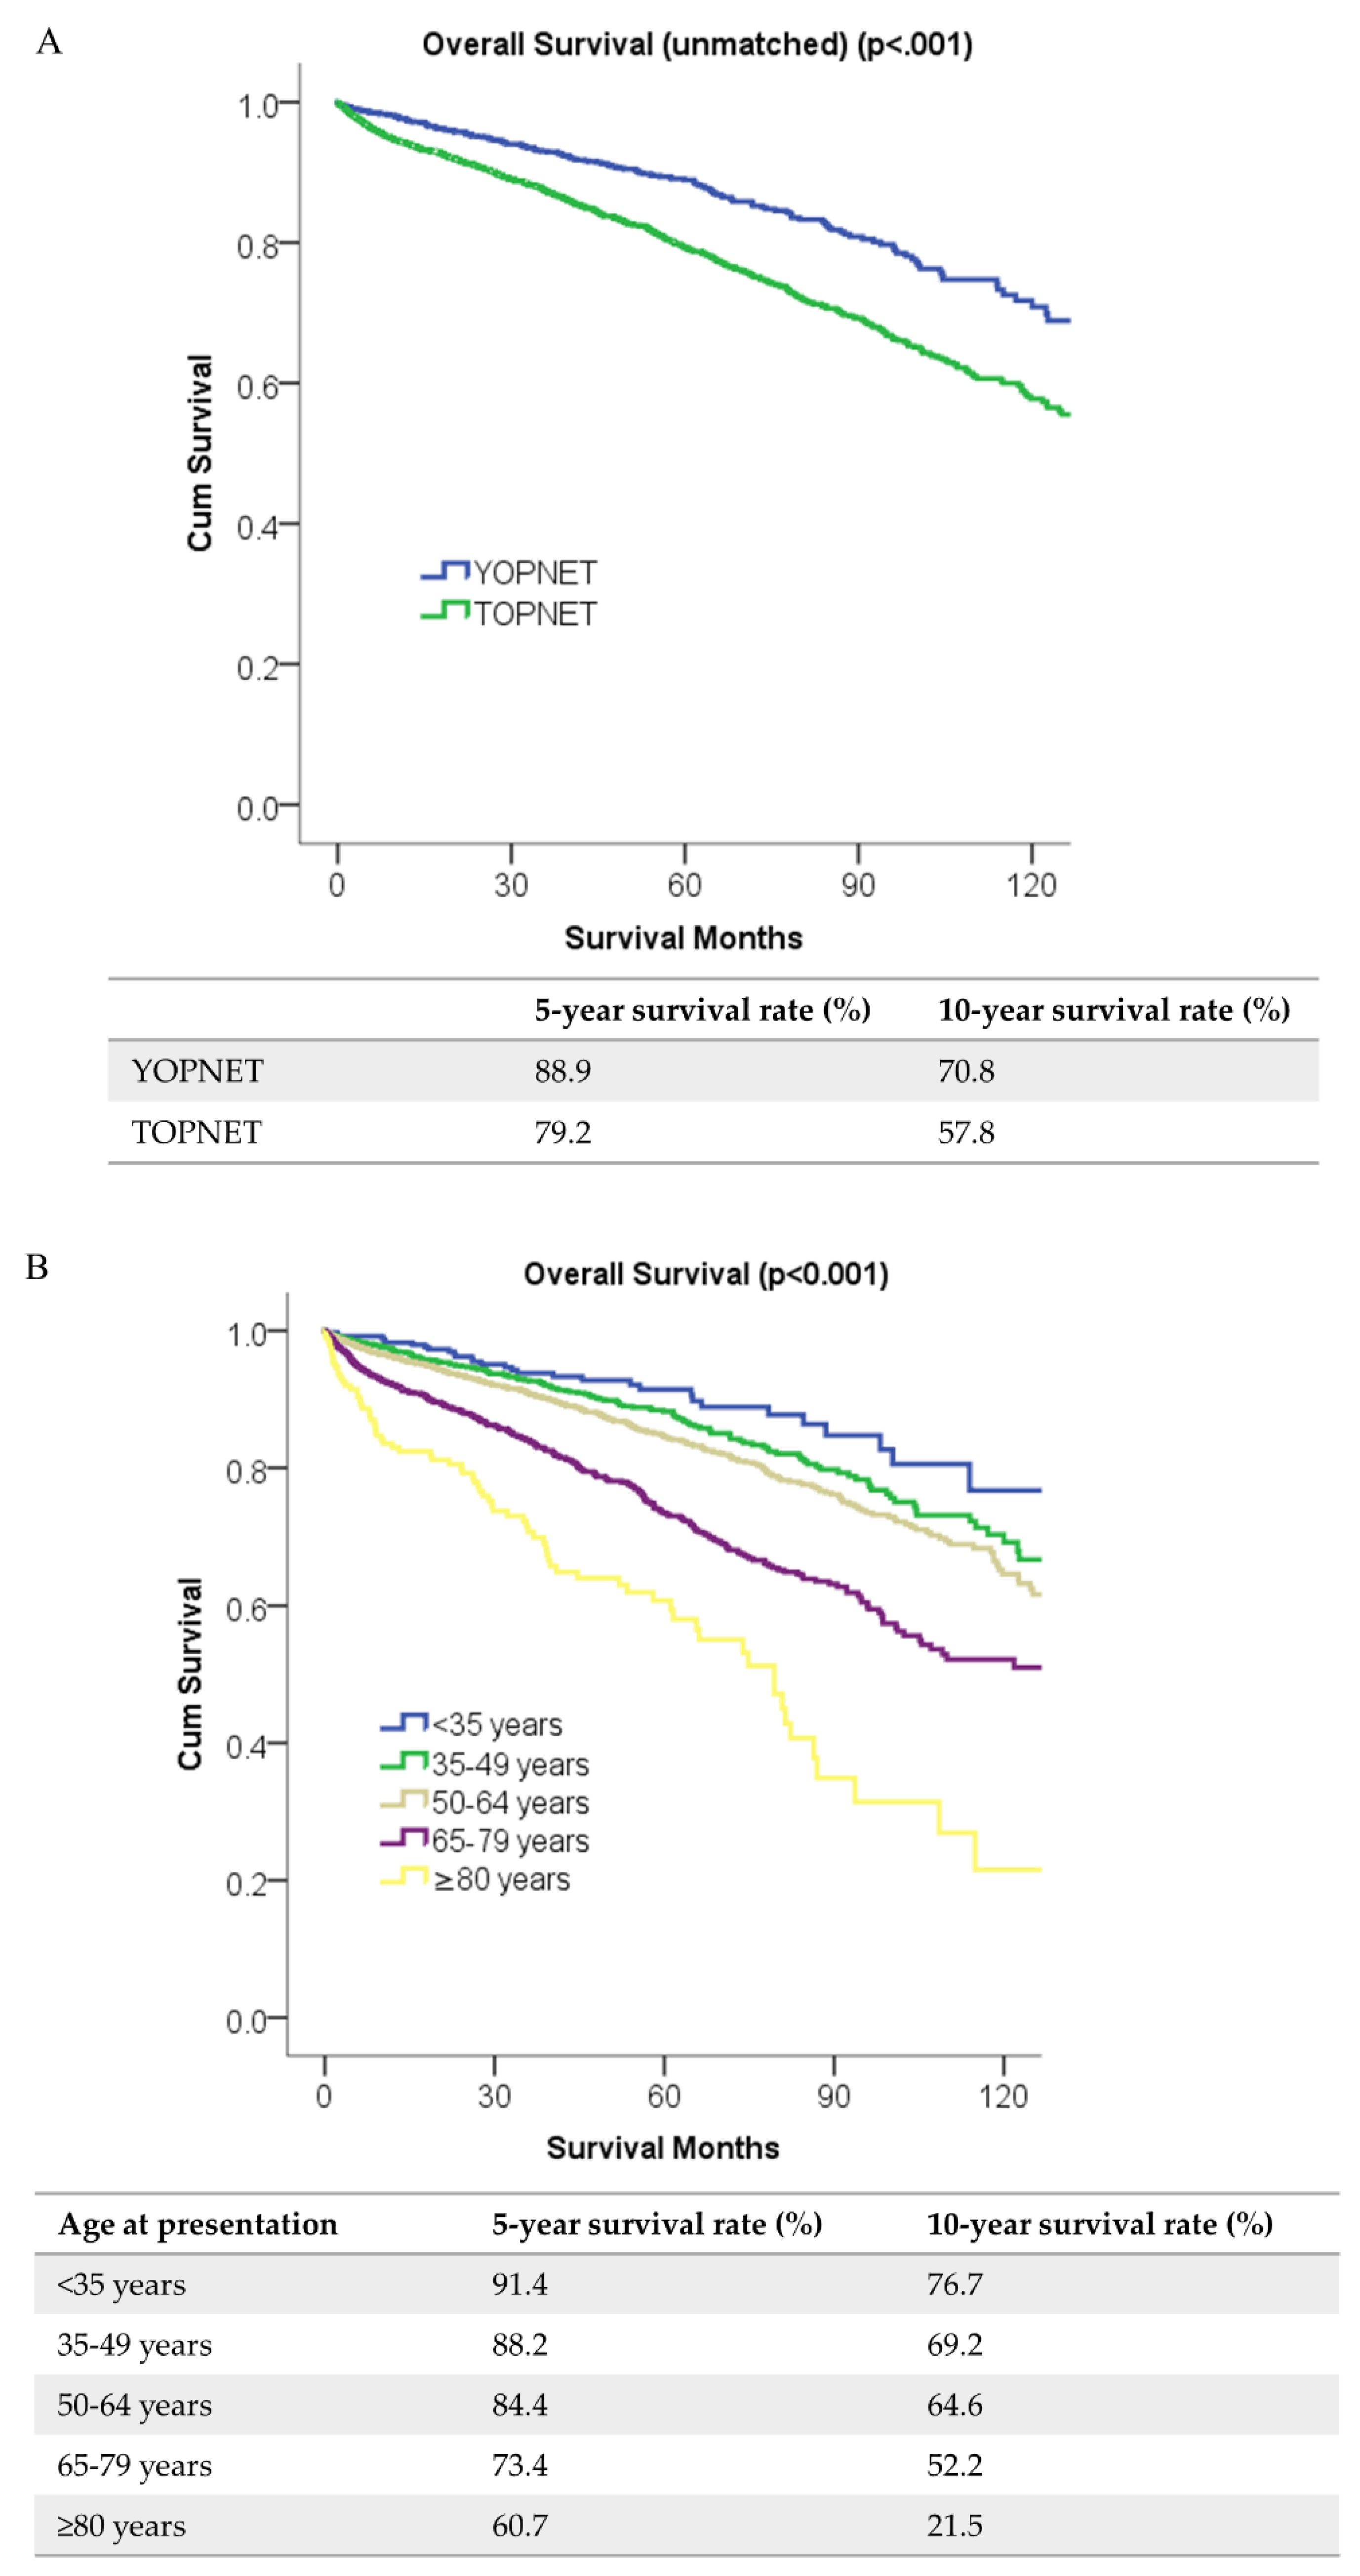
2.2. Survival Analyses
2.3. Genomic Analysis
3. Discussion
4. Materials and Methods
4.1. Study Population
4.2. Primary Interest
4.3. Covariables
4.4. Patient Selection for Genomic Analysis
4.5. Statistical Analysis
5. Conclusions
Author Contributions
Funding
Acknowledgments
Conflicts of Interest
References
- Halfdanarson, T.R.; Rabe, K.G.; Rubin, J.; Petersen, G.M. Pancreatic neuroendocrine tumors (PNETs): Incidence, prognosis and recent trend toward improved survival. Ann. Oncol. 2008, 19, 1727–1733. [Google Scholar] [CrossRef] [PubMed]
- Dasari, A.; Shen, C.; Halperin, D.; Zhao, B.; Zhou, S.; Xu, Y.; Shih, T.; Yao, J.C. Trends in the incidence, prevalence, and survival outcomes in patients with neuroendocrine tumors in the United States. JAMA Oncol. 2017, 3, 1335–1342. [Google Scholar] [CrossRef] [PubMed]
- Beeghly-Fadiel, A.; Luu, H.N.; Du, L.; Shi, C.; McGavic, D.P.; Parikh, A.A.; Raskin, L. Early onset pancreatic malignancies: Clinical characteristics and survival associations. Int. J. Cancer 2016, 139, 2169–2177. [Google Scholar] [CrossRef] [PubMed]
- Muniraj, T.; Jamidar, P.A.; Aslanian, H.R. Pancreatic cancer: A comprehensive review and update. Dis. Mon. 2013, 59, 368–402. [Google Scholar] [CrossRef] [PubMed]
- Raimondi, S.; Maisonneuve, P.; Lowenfels, A.B. Epidemiology of pancreatic cancer: An overview. Nat. Rev. Gastroenterol. Hepatol. 2009, 6, 699–708. [Google Scholar] [CrossRef]
- Ballester, V.; Rashtak, S.; Boardman, L. Clinical and molecular features of young-onset colorectal cancer. World J. Gastroenterol. 2016, 22, 1736–1744. [Google Scholar] [CrossRef]
- Salinas, C.A.; Tsodikov, A.; Ishak-Howard, M.; Cooney, K.A. Prostate cancer in young men: An important clinical entity. Nat. Rev. Urol. 2014, 11, 317–323. [Google Scholar] [CrossRef]
- Gabriel, C.A.; Domchek, S.M. Breast cancer in young women. Breast Cancer Res. 2010, 12, 212. [Google Scholar] [CrossRef] [Green Version]
- Bergquist, J.R.; Leiting, J.L.; Habermann, E.B.; Cleary, S.P.; Kendrick, M.L.; Smoot, R.L.; Nagorney, D.M.; Truty, M.J.; Grotz, T.E. Early-onset gastric cancer is a distinct disease with worrisome trends and oncogenic features. Surgery 2019, 166, 547–555. [Google Scholar] [CrossRef]
- Bilimoria, K.Y.; Talamonti, M.S.; Tomlinson, J.S.; Stewart, A.K.; Winchester, D.P.; Ko, C.Y.; Bentrem, D.J. Prognostic Score Predicting Survival After Resection of Pancreatic Neuroendocrine Tumors: Analysis of 3851 Patients. Ann. Surg. 2008, 247, 490–500. [Google Scholar] [CrossRef]
- Han, X.; Xu, X.; Jin, D.; Wang, D.; Ji, Y.; Lou, W. Clinicopathological characteristics and prognosis-related factors of resectable pancreatic neuroendocrine tumors: A retrospective study of 104 cases in a single Chinese center. Pancreas 2014, 43, 526–531. [Google Scholar] [CrossRef] [PubMed] [Green Version]
- Yang, M.; Tian, B.L.; Zhang, Y.; Su, A.P.; Yue, P.J.; Xu, S.; Wang, L. Evaluation of the World Health Organization 2010 grading system in surgical outcome and prognosis of pancreatic neuroendocrine tumors. Pancreas 2014, 43, 1003–1008. [Google Scholar] [CrossRef] [PubMed]
- Liu, J.B.; Baker, M.S. Surgical Management of Pancreatic Neuroendocrine Tumors. Surg. Clin. N. Am. 2016, 96, 1447–1468. [Google Scholar] [CrossRef] [PubMed]
- Schurr, P.G.; Strate, T.; Rese, K.; Kaifi, J.T.; Reichelt, U.; Petri, S.; Kleinhans, H.; Yekebas, E.F.; Izbicki, J.R. Aggressive surgery improves long-term survival in neuroendocrine pancreatic tumors: An institutional experience. Ann. Surg. 2007, 245, 273–281. [Google Scholar] [CrossRef] [PubMed]
- Howe, J.R.; Merchant, N.B.; Conrad, C.; Keutgen, X.M.; Hallet, J.; Drebin, J.A.; Minter, R.M.; Lairmore, T.C.; Tseng, J.F.; Zeh, H.J.; et al. The North American Neuroendocrine Tumor Society Consensus Paper on the Surgical Management of Pancreatic Neuroendocrine Tumors. Pancreas 2020, 49, 1–33. [Google Scholar] [CrossRef]
- Ehehalt, F.; Saeger, H.D.; Schmidt, C.M.; Grutzmann, R. Neuroendocrine tumors of the pancreas. Oncologist 2009, 14, 456–467. [Google Scholar] [CrossRef]
- Zikusoka, M.N.; Kidd, M.; Eick, G.; Latich, I.; Modlin, I.M. The molecular genetics of gastroenteropancreatic neuroendocrine tumors. Cancer 2005, 104, 2292–2309. [Google Scholar] [CrossRef]
- Pieterman, C.R.; Conemans, E.B.; Dreijerink, K.M.; de Laat, J.M.; Timmers, H.T.; Vriens, M.R.; Valk, G.D. Thoracic and duodenopancreatic neuroendocrine tumors in multiple endocrine neoplasia type 1: Natural history and function of menin in tumorigenesis. Endocr. Relat. Cancer 2014, 21, R121–R142. [Google Scholar] [CrossRef]
- Thakker, R.V.; Newey, P.J.; Walls, G.V.; Bilezikian, J.; Dralle, H.; Ebeling, P.R.; Melmed, S.; Sakurai, A.; Tonelli, F.; Brandi, M.L. Clinical practice guidelines for multiple endocrine neoplasia type 1 (MEN1). J. Clin. Endocrinol. Metab. 2012, 97, 2990–3011. [Google Scholar] [CrossRef]
- Akerstrom, G.; Hessman, O.; Hellman, P.; Skogseid, B. Pancreatic tumours as part of the MEN-1 syndrome. Best Pract. Res. Clin. Gastroenterol. 2005, 19, 819–830. [Google Scholar] [CrossRef]
- Dean, P.G.; van Heerden, J.A.; Farley, D.R.; Thompson, G.B.; Grant, C.S.; Harmsen, W.S.; Ilstrup, D.M. Are patients with multiple endocrine neoplasia type I prone to premature death? World J. Surg. 2000, 24, 1437–1441. [Google Scholar] [CrossRef] [PubMed]
- Nell, S.; Borel Rinkes, I.H.M.; Verkooijen, H.M.; Bonsing, B.A.; van Eijck, C.H.; van Goor, H.; de Kleine, R.H.J.; Kazemier, G.; Nieveen van Dijkum, E.J.; Dejong, C.H.C.; et al. Early and Late Complications After Surgery for MEN1-related Nonfunctioning Pancreatic Neuroendocrine Tumors. Ann. Surg. 2018, 267, 352–356. [Google Scholar] [CrossRef] [PubMed]
- Binkovitz, L.; Johnson, C.D.; Stephens, D. Islet cell tumors in von Hippel-Lindau disease: Increased prevalence and relationship to the multiple endocrine neoplasias. AJR. Am. J. Roentgenol. 1990, 155, 501–505. [Google Scholar] [CrossRef] [PubMed]
- Libutti, S.K.; Choyke, P.L.; Bartlett, D.L.; Vargas, H.; Walther, M.; Lubensky, I.; Glenn, G.; Linehan, W.M.; Alexander, H.R. Pancreatic neuroendocrine tumors associated with von Hippel Lindau disease: Diagnostic and management recommendations. Surgery 1998, 124, 1153–1159. [Google Scholar] [CrossRef]
- Larson, A.; Hedgire, S.; Deshpande, V.; Stemmer-Rachamimov, A.; Harisinghani, M.; Ferrone, C.; Shah, U.; Thiele, E. Pancreatic neuroendocrine tumors in patients with tuberous sclerosis complex. Clin. Genet. 2012, 82, 558–563. [Google Scholar] [CrossRef] [PubMed]
- Luo, G.; Javed, A.; Strosberg, J.R.; Jin, K.; Zhang, Y.; Liu, C.; Xu, J.; Soares, K.; Weiss, M.J.; Zheng, L. Modified staging classification for pancreatic neuroendocrine tumors on the basis of the American Joint Committee on Cancer and European Neuroendocrine Tumor Society Systems. J. Clin. Oncol. 2017, 35, 274–280. [Google Scholar] [CrossRef]
- Zhou, H.; Zhang, Y.; Wei, X.; Yang, K.; Tan, W.; Qiu, Z.; Li, S.; Chen, Q.; Song, Y.; Gao, S. Racial disparities in pancreatic neuroendocrine tumors survival: A SEER study. Cancer Med. 2017, 6, 2745–2756. [Google Scholar] [CrossRef]
- Yao, J.C.; Hassan, M.; Phan, A.; Dagohoy, C.; Leary, C.; Mares, J.E.; Abdalla, E.K.; Fleming, J.B.; Vauthey, J.-N.; Rashid, A. One hundred years after “carcinoid”: Epidemiology of and prognostic factors for neuroendocrine tumors in 35,825 cases in the United States. J. Clin. Oncol. 2008, 26, 3063–3072. [Google Scholar] [CrossRef] [Green Version]
- Sanford, N.N.; Aguilera, T.A.; Folkert, M.R.; Ahn, C.; Mahal, B.A.; Zeh, H.; Beg, M.S.; Mansour, J.; Sher, D.J. Sociodemographic Disparities in the Receipt of Adjuvant Chemotherapy Among Patients With Resected Stage I–III Pancreatic Adenocarcinoma. J. Natl. Compr. Cancer Netw. 2019, 17, 1292–1300. [Google Scholar] [CrossRef] [Green Version]
- Ordonez, J.E.; Hester, C.A.; Zhu, H.; Augustine, M.; Porembka, M.R.; Wang, S.C.; Yopp, A.C.; Mansour, J.C.; Zeh, H.J.; Polanco, P.M. Clinicopathologic Features and Outcomes of Early-Onset Pancreatic Adenocarcinoma in the United States. Ann. Surg. Oncol. 2020, 27, 1997–2006. [Google Scholar] [CrossRef]
- Raimondi, S.; Maisonneuve, P.; Löhr, J.-M.; Lowenfels, A.B. Early onset pancreatic cancer: Evidence of a major role for smoking and genetic factors. Cancer Epidemiol. Prev. Biomark. 2007, 16, 1894–1897. [Google Scholar] [CrossRef] [PubMed] [Green Version]
- Piciucchi, M.; Capurso, G.; Valente, R.; Larghi, A.; Archibugi, L.; Signoretti, M.; Stigliano, S.; Zerboni, G.; Barucca, V.; La Torre, M. Early onset pancreatic cancer: Risk factors, presentation and outcome. Pancreatology 2015, 15, 151–155. [Google Scholar] [CrossRef] [PubMed]
- Massarweh, N.N.; Chiang, Y.-J.; Xing, Y.; Chang, G.J.; Haynes, A.B.; You, Y.N.; Feig, B.W.; Cormier, J.N. Association between travel distance and metastatic disease at diagnosis among patients with colon cancer. J. Clin. Oncol. 2014, 32, 942. [Google Scholar] [CrossRef] [PubMed] [Green Version]
- Youngwirth, L.M.; Nussbaum, D.P.; Thomas, S.; Adam, M.A.; Blazer III, D.G.; Roman, S.A.; Sosa, J.A. Nationwide trends and outcomes associated with neoadjuvant therapy in pancreatic cancer: An analysis of 18 243 patients. J. Surg. Oncol. 2017, 116, 127–132. [Google Scholar] [CrossRef] [PubMed]
- Deyo, R.A.; Cherkin, D.C.; Ciol, M.A. Adapting a clinical comorbidity index for use with ICD-9-CM administrative databases. J. Clin. Epidemiol. 1992, 45, 613–619. [Google Scholar] [CrossRef]
- Consortium, A.P.G. AACR Project GENIE: Powering precision medicine through an international consortium. Cancer Discov. 2017, 7, 818–831. [Google Scholar] [CrossRef] [Green Version]
- Ho, D.E.; Imai, K.; King, G.; Stuart, E.A. MatchIt: Nonparametric Preprocessing for Parametric Causal Inference. J. Stat. Softw. 2011, 42, 1–28. Available online: https://gking.harvard.edu/matchit (accessed on 15 January 2020). [CrossRef] [Green Version]
- Austin, P.C. An introduction to propensity score methods for reducing the effects of confounding in observational studies. Multivar. Behav. Res. 2011, 46, 399–424. [Google Scholar] [CrossRef] [Green Version]


| Characteristics | Before Propensity Score Matching | p-Value | After Propensity Score Matching | p-Value | ||
|---|---|---|---|---|---|---|
| YOPNET (%) | TOPNET (%) | YOPNET (%) | TOPNET (%) | |||
| 1692 (27.0) | 4567 (73.0) | 1692 (50.0) | 1692 (50.0) | |||
| Age at diagnosis (median) | 42 | 62 | 42 | 60 | ||
| Sex | <0.001 | NS | ||||
| Male | 769 (45.4) | 2412 (52.8) | 769 (45.4) | 822 (48.6) | ||
| Female | 923 (54.6) | 2155 (47.2) | 923 (54.6) | 870 (51.4) | ||
| Race/Ethnicity | <0.001 | <0.001 | ||||
| Non-Hispanic White | 1122 (66.3) | 3493 (76.5) | 1122 (66.3) | 1218 (72.0) | ||
| Non-Hispanic Black | 266 (15.7) | 499 (10.9) | 266 (15.7) | 183 (10.8) | ||
| Hispanics | 142 (8.4) | 217 (4.8) | 142 (8.4) | 97 (5.7) | ||
| Other/Unknown | 162 (9.6) | 358 (7.8) | 162 (9.6) | 194 (11.5) | ||
| Year of diagnosis | 0.004 | NS | ||||
| 2004–2006 | 145 (8.6) | 376 (8.2) | 145 (8.6) | 156 (9.2) | ||
| 2007–2009 | 317 (18.7) | 692 (15.2) | 317 (18.7) | 292 (17.3) | ||
| 2010–2012 | 474 (28.0) | 1295 (28.4) | 474 (28.0) | 473 (28.0) | ||
| 2013–2015 | 756 (44.7) | 2204 (48.3) | 756 (44.7) | 771 (45.6) | ||
| Comorbidity Score | <0.001 | 0.03 | ||||
| 0 | 1377 (81.4) | 3100 (67.9) | 1377 (81.4) | 1324 (78.3) | ||
| 1 | 260 (15.4) | 1116 (24.4) | 260 (15.4) | 317 (18.7) | ||
| 2+ | 55 (3.3) | 351 (7.7) | 55 (3.3) | 51 (3.0) | ||
| Facility Type | <0.001 | <0.001 | ||||
| Academic | 765 (45.2) | 2986 (65.4) | 765 (45.2) | 777 (45.9) | ||
| Non-academic | 288 (17.0) | 1581 (34.6) | 288 (17.0) | 915 (54.1) | ||
| Others | 639 (37.8) | 0 (0) | 639 (37.8) | 0 (0) | ||
| Facility Location | <0.001 | <0.001 | ||||
| New England | 40 (2.4) | 183 (4.0) | 40 (2.4) | 37 (2.2) | ||
| Middle Atlantic | 185 (10.9) | 836 (18.3) | 185 (10.9) | 189 (11.2) | ||
| South Atlantic | 264 (15.6) | 1016 (22.2) | 264 (15.6) | 309 (18.3) | ||
| East North Central | 158 (9.3) | 781 (17.1) | 158 (9.3) | 246 (14.5) | ||
| East South Central | 64 (3.8) | 287 (6.3) | 64 (3.8) | 124 (7.3) | ||
| West North Central | 107 (6.3) | 435 (9.5) | 107 (6.3) | 187 (11.1) | ||
| West South Central | 78 (4.6) | 377 (8.3) | 78 (4.6) | 172 (10.2) | ||
| Mountain | 42 (2.5) | 181 (4.0) | 42 (2.5) | 112 (6.6) | ||
| Pacific | 115 (6.8) | 471 (10.3) | 115 (6.8) | 316 (18.7) | ||
| Unknown | 639 (37.8) | 0 (0) | 639 (37.8) | 0 (0) | ||
| Insurance status | <0.001 | <0.001 | ||||
| Uninsured | 78 (4.6) | 89 (1.9) | 78 (4.6) | 82 (4.8) | ||
| Private | 1314 (77.7) | 2273 (49.8) | 1314 (77.7) | 1215 (71.8) | ||
| Government | 267 (15.8) | 2120 (46.4) | 267 (15.8) | 382 (22.6) | ||
| Unknown | 33 (2.0) | 85 (1.9) | 33 (2.0) | 13 (0.8) | ||
| Income | NS | 0.009 | ||||
| <USD 38,000 | 270 (16.0) | 683 (15.0) | 270 (16.0) | 236 (13.9) | ||
| USD 38,000–USD 47,999 | 345 (20.4) | 965 (21.1) | 345 (20.4) | 339 (20.0) | ||
| USD 48,000–USD 62,999 | 409 (24.2) | 1230 (26.9) | 409 (24.2) | 485 (28.7) | ||
| >USD 63,000 | 664 (39.2) | 1672 (36.6) | 664 (39.2) | 621 (36.7) | ||
| Unknown | 4 (0.2) | 17 (0.4) | 4 (0.2) | 11 (0.7) | ||
| Education | NS | NS | ||||
| ≥21% | 269 (15.9) | 651 (14.3) | 269 (15.9) | 245 (14.5) | ||
| 13–20.9% | 418 (24.7) | 1117 (24.5) | 418 (24.7) | 408 (24.1) | ||
| 7–12.9% | 521 (30.8) | 1520 (33.3) | 521 (30.8) | 552 (32.6) | ||
| <7% | 481 (28.4) | 1264 (27.7) | 481 (28.4) | 476 (28.1) | ||
| Unknown | 3 (0.2) | 15 (0.3) | 3 (0.2) | 11 (0.7) | ||
| Rurality | NS | NS | ||||
| Metropolitan | 1430 (84.5) | 3757 (82.3) | 1430 (84.5) | 1425 (84.2) | ||
| Non-metropolitan | 223 (13.2) | 693 (15.2) | 223 (13.2) | 238 (14.1) | ||
| Unknown | 39 (2.3) | 117 (2.6) | 39 (2.3) | 29 (1.7) | ||
| Travel distance | 0.038 | NS | ||||
| <12.5 miles | 562 (33.2) | 1690 (37.0) | 562 (33.2) | 597 (35.3) | ||
| 12.5–49.9 miles | 657 (38.8) | 1667 (36.5) | 657 (38.8) | 622 (36.8) | ||
| ≥50 miles | 470 (27.8) | 1197 (26.2) | 470 (27.8) | 463 (27.4) | ||
| Unknown | 3 (0.2) | 13 (0.3) | 3 (0.2) | 10 (0.6) | ||
| Tumor location | 0.004 | NS | ||||
| Head | 487 (28.8) | 1214 (26.6) | 487 (28.8) | 437 (25.8) | ||
| Body/Tail | 886 (52.4) | 2603 (57.0) | 886 (52.4) | 950 (56.1) | ||
| Other | 319 (18.9) | 750 (16.4) | 319 (18.9) | 305 (18.0) | ||
| Tumor size (cm) | <0.001 | NS | ||||
| <2 | 453 (26.8) | 1466 (32.1) | 453 (26.8) | 473 (28.0) | ||
| 2–4 | 682 (40.3) | 1819 (39.8) | 682 (40.3) | 677 (40.0) | ||
| >4 | 543 (32.1) | 1246 (27.3) | 543 (32.1) | 528 (31.2) | ||
| Unknown | 14 (0.8) | 36 (0.8) | 14 (0.8) | 14 (0.8) | ||
| Nodal status | 0.048 | NS | ||||
| Negative | 943 (55.7) | 2655 (58.1) | 943 (55.7) | 959 (56.7) | ||
| Positive | 545 (32.2) | 1325 (29.0) | 545 (32.2) | 519 (30.7) | ||
| Unknown | 204 (12.1) | 587 (12.9) | 204 (12.1) | 214 (12.6) | ||
| Stage | <0.001 | NS | ||||
| 1–2 | 1239 (73.2) | 3580 (78.4) | 1239 (73.2) | 1278 (75.5) | ||
| 3–4 | 245 (14.5) | 513 (11.2) | 245 (14.5) | 211 (12.5) | ||
| Unknown | 208 (12.3) | 474 (10.4) | 208 (12.3) | 203 (12.0) | ||
| Grade | NS | NS | ||||
| I | 1290 (76.2) | 3520 (77.1) | 1290 (76.2) | 1304 (77.1) | ||
| II | 329 (19.4) | 808 (17.7) | 329 (19.4) | 307 (18.1) | ||
| III | 62 (3.7) | 216 (4.7) | 62 (3.7) | 70 (4.1) | ||
| IV | 11 (0.7) | 23 (0.5) | 11 (0.7) | 11 (0.7) | ||
| Radiotherapy | NS | NS | ||||
| Yes | 52 (3.1) | 125 (2.7) | 52 (3.1) | 55 (3.3) | ||
| No/Unknown | 1640 (96.9) | 4442 (97.3) | 1640 (96.9) | 1637 (96.7) | ||
| Chemotherapy | 0.009 | NS | ||||
| Yes | 120 (7.1) | 242 (5.3) | 120 (7.1) | 124 (7.3) | ||
| No/Unknown | 1572 (92.9) | 4325 (94.7) | 1572 (92.9) | 1568 (92.7) | ||
| Characteristics | Unmatched | Propensity Matched | ||
|---|---|---|---|---|
| HR (95% CI) | p-Value | HR (95% CI) | p-Value | |
| Age | ||||
| YOPNET | 0.77 (0.63–0.93) | 0.008 | 0.75 (0.60–0.93) | 0.012 |
| TOPNET | Ref | Ref | ||
| Sex | ||||
| Male | Ref | Ref | ||
| Female | 0.76 (0.67–0.87) | <0.001 | 0.82 (0.68–0.98) | 0.038 |
| Race/Ethnicity | ||||
| Non-Hispanic White | Ref | Ref | ||
| Non-Hispanic Black | 0.80 (0.64–1.00) | NS | 0.78 (0.56–1.08) | NS |
| Hispanics | 0.88 (0.64–1.21) | NS | 1.04 (0.68–1.58) | NS |
| Other/Unknown | 1.03 (0.83–1.28) | NS | 0.96 (0.72–1.27) | NS |
| Comorbidity Score | ||||
| 0 | Ref | Ref | ||
| 1 | 1.23 (1.06–1.42) | 0.005 | 1.28 (1.01–1.61) | 0.035 |
| 2+ | 1.73 (1.40–2.13) | <0.001 | 1.42 (0.89–2.29) | NS |
| Facility Type | ||||
| Academic | Ref | Ref | ||
| Non-academic | 1.12 (0.97–1.29) | NS | 1.13 (0.90–1.42) | NS |
| Unknown | 0.66 (0.43–1.04) | NS | 0.68 (0.49–0.93) | 0.017 |
| Travel distance | ||||
| <12.5 miles | Ref | Ref | ||
| 12.5–49.9 miles | 1.02 (0.87–1.19) | NS | 1.05 (0.84–1.31) | NS |
| ≥50 miles | 0.84 (0.70–1.02) | NS | 0.96 (0.73–1.27) | NS |
| Unknown | 0.26 (0.02–2.59) | NS | 0.19 (0.01–3.28) | NS |
| Income | ||||
| <USD 38,000 | Ref | Ref | ||
| USD 38,000–USD 47,999 | 0.88 (0.72–1.08) | NS | 1.04 (0.76–1.43) | NS |
| USD 48,000–USD 62,999 | 0.82 (0.67–1.01) | NS | 1.05 (0.78–1.41) | NS |
| >USD 63,000 | 0.75 (0.61–0.93) | 0.01 | 0.90 (0.66–1.24) | NS |
| Unknown | 1.72 (0.53–5.51) | NS | 4.84 (0.66–35.7) | NS |
| Insurance status | ||||
| Uninsured | Ref | Ref | ||
| Private | 0.87 (0.57–1.33) | NS | 0.81 (0.52–1.26) | NS |
| Government | 1.65 (1.08–2.51) | 0.018 | 1.71 (1.08–2.71) | 0.02 |
| Unknown | 1.31 (0.73–2.36) | NS | 0.77 (0.26–2.29) | NS |
| Rurality | ||||
| Metropolitan | Ref | Ref | ||
| Non-metropolitan | 1.04 (0.86–1.26) | NS | 1.01 (0.75–1.36) | NS |
| Unknown | 1.02 (0.68–1.53) | NS | 2.24 (1.22–4.13) | 0.01 |
| Tumor Location | ||||
| Head | Ref | Ref | ||
| Body/Tail | 0.76 (0.66–0.88) | <0.001 | 0.74 (0.59–0.91) | 0.005 |
| Other | 0.79 (0.65–0.95) | 0.012 | 0.76 (0.58–0.99) | 0.047 |
| Tumor size (cm) | ||||
| <2 | Ref | Ref | ||
| 2–4 | 1.45 (1.19–1.78) | <0.001 | 1.46 (1.04–2.04) | 0.026 |
| >4 | 1.71 (1.39–2.10) | <0.001 | 1.86 (1.33–2.61) | <0.001 |
| Unknown | 1.88 (1.18–3.01) | 0.008 | 1.65 (0.77–3.53) | NS |
| Nodal status | ||||
| Negative | Ref | Ref | ||
| Positive | 1.41 (1.22–1.63) | <0.001 | 1.33 (1.08–1.64) | 0.006 |
| Unknown | 0.99 (0.79–1.23) | NS | 0.78 (0.54–1.14) | NS |
| Stage | ||||
| I-II | Ref | Ref | ||
| III-IV | 2.19 (1.87–2.57) | <0.001 | 2.39 (1.90–3.01) | <0.001 |
| Unknown | 1.26 (1.05–1.50) | 0.011 | 1.38 (1.06–1.78) | 0.015 |
| Grade | ||||
| I | Ref | Ref | ||
| II | 1.16 (0.98–1.36) | NS | 1.25 (0.99–1.59) | NS |
| III | 3.09 (2.55–3.74) | <0.001 | 3.48 (2.63–4.59) | <0.001 |
| IV | 4.06 (2.62–6.30) | <0.001 | 6.35 (3.64–11.08) | <0.001 |
| Chemotherapy | ||||
| Yes | Ref | Ref | ||
| No/Unknown | 1.67 (1.39–2.00) | <0.001 | 2.04 (1.61–2.59) | <0.001 |
| Genes | MSK-IMPACT | |||
|---|---|---|---|---|
| YOPNET (n/%) 48 (27%) | TOPNET (n/%) 129 (73%) | p-Value | q-Value * | |
| MEN1 | 14 (26%) | 82 (56%) | <0.001 | 0.04 |
| DAXX | 14 (26%) | 52 (36%) | NS | NS |
| TSC2 | 13 (24%) | 23 (16%) | NS | NS |
| ATRX | 7 (13%) | 31 (21%) | NS | NS |
| TP53 | 7 (13%) | 21 (14%) | NS | NS |
| BRAF | 5 (9%) | 5 (3%) | NS | NS |
| ATM | 4 (7%) | 7 (5%) | NS | NS |
| ARID1A | 4 (7%) | 14 (9%) | NS | NS |
| PTEN | 4 (7%) | 12 (8%) | NS | NS |
| SETD2 | 3 (5%) | 19 (13%) | NS | NS |
| BCOR | 3 (5%) | 2 (1%) | NS | NS |
| TSC1 | 3 (5%) | 4 (3%) | NS | NS |
| TERT | 3 (5%) | 6 (4%) | NS | NS |
| MDC1 | 2 (4%) | 0 (0%) | NS | NS |
| RASA1 | 2 (4%) | 0 (0%) | NS | NS |
| PPM1D | 2 (4%) | 1 (1%) | NS | NS |
| ATR | 2 (4%) | 1 (1%) | NS | NS |
| BCL6 | 2 (4%) | 1 (1%) | NS | NS |
| INPP4B | 2 (4%) | 1 (1%) | NS | NS |
| KMT2D | 1 (2%) | 11 (7%) | NS | NS |
© 2020 by the authors. Licensee MDPI, Basel, Switzerland. This article is an open access article distributed under the terms and conditions of the Creative Commons Attribution (CC BY) license (http://creativecommons.org/licenses/by/4.0/).
Share and Cite
Goksu, S.Y.; Ozer, M.; Kazmi, S.M.A.; Sanford, N.N.; Aguilera, T.A.; Ahn, C.; Hsiehchen, D.; Sanjeevaiah, A.; Khosama, L.; Bleeker, J.; et al. Distinct Clinical Characteristics in Young-Onset Pancreatic Neuroendocrine Tumor. Cancers 2020, 12, 2501. https://doi.org/10.3390/cancers12092501
Goksu SY, Ozer M, Kazmi SMA, Sanford NN, Aguilera TA, Ahn C, Hsiehchen D, Sanjeevaiah A, Khosama L, Bleeker J, et al. Distinct Clinical Characteristics in Young-Onset Pancreatic Neuroendocrine Tumor. Cancers. 2020; 12(9):2501. https://doi.org/10.3390/cancers12092501
Chicago/Turabian StyleGoksu, Suleyman Yasin, Muhammet Ozer, Syed Mohammad Ali Kazmi, Nina Niu Sanford, Todd A. Aguilera, Chul Ahn, David Hsiehchen, Aravind Sanjeevaiah, Leticia Khosama, Jonathan Bleeker, and et al. 2020. "Distinct Clinical Characteristics in Young-Onset Pancreatic Neuroendocrine Tumor" Cancers 12, no. 9: 2501. https://doi.org/10.3390/cancers12092501