
Virtual Biopsy for Diagnosis of Chemotherapy-Associated Liver Injuries and Steatohepatitis: A Combined Radiomic and Clinical Model in Patients with Colorectal Liver Metastases


 ,
,  , ,
, ,  and
and 
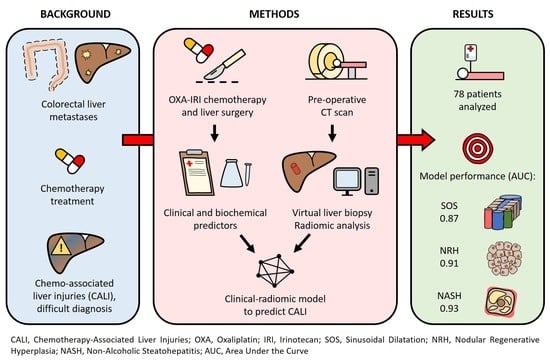
Abstract
Simple Summary
Abstract
1. Introduction
2. Material and Methods
2.1. Patients Management and Pathology Data
2.2. Statistical Analyses
3. Results
3.1. Predictive Model for Sinusoidal Dilatation
3.2. Predictive Model for NRH
3.3. Predictive Model for NASH
3.4. Contribution of Radiomic Features Extracted from the Unenhanced CT Scan
4. Discussion
5. Conclusions
Supplementary Materials
Author Contributions
Funding
Institutional Review Board Statement
Informed Consent Statement
Data Availability Statement
Acknowledgments
Conflicts of Interest
References
- Van Cutsem, E.; Cervantes, A.; Adam, R.; Sobrero, A.; Van Krieken, J.H.; Aderka, D.; Aranda Aguilar, E.; Bardelli, A.; Benson, A.; Bodoky, G.; et al. ESMO consensus guidelines for the management of patients with metastatic colorectal cancer. Ann. Oncol. 2016, 27, 1386–1422. [Google Scholar] [CrossRef]
- Viganò, L.; Torzilli, G.; Cimino, M.; Imai, K.; Vibert, E.; Donadon, M.; Castaing, D.; Adam, R. Drop-out between the two liver resections of two-stage hepatectomy. Patient selection or loss of chance? Eur. J. Surg. Oncol. 2016, 42, 1385–1393. [Google Scholar] [CrossRef]
- Nordlinger, B.; Sorbye, H.; Glimelius, B.; Poston, G.J.; Schlag, P.M.; Rougier, P.; Bechstein, W.O.; Primrose, J.N.; Walpole, E.T.; Finch-Jones, M.; et al. Perioperative FOLFOX4 chemotherapy and surgery versus surgery alone for resectable liver metastases from colorectal cancer (EORTC 40983): Long-term results of a randomised, controlled, phase 3 trial. Lancet Oncol. 2013, 14, 1208–1215. [Google Scholar] [CrossRef]
- Adam, R.; Pascal, G.; Castaing, D.; Azoulay, D.; Delvart, V.; Paule, B.; Levi, F.; Bismuth, H. Tumor progression while on chemotherapy: A contraindication to liver resection for multiple colorectal metastases? Ann. Surg. 2004, 240, 1052–1064. [Google Scholar] [CrossRef] [PubMed]
- Viganó, L.; Capussotti, L.; Barroso, E.; Nuzzo, G.; Laurent, C.; Ijzermans, J.N.M.; Gigot, J.F.; Figueras, J.; Gruenberger, T.; Mirza, D.F.; et al. Progression while receiving preoperative chemotherapy should not be an absolute contraindication to liver resection for colorectal metastases. Ann. Surg. Oncol. 2012, 19, 2786–2796. [Google Scholar] [CrossRef] [PubMed]
- Capussotti, L.; Vigano, L.; Ferrero, A.; Lo Tesoriere, R.; Ribero, D.; Polastri, R. Timing of resection of liver metastases synchronous to colorectal tumor: Proposal of prognosis-based decisional model. Ann. Surg. Oncol. 2007, 14, 1143–1150. [Google Scholar] [CrossRef]
- Adam, R.; Wicherts, D.A.; De Haas, R.; Ciacio, O.; Levi, F.; Paule, B.; Ducreux, M.; Azoulay, D.; Bismuth, H.; Castaing, D. Patients with initially unresectable colorectal liver metastases: Is there a possibility of cure? J. Clin. Oncol. 2009, 27, 1829–1835. [Google Scholar] [CrossRef]
- Rubbia-Brandt, L.; Audard, V.; Sartoretti, P.; Roth, A.D.; Brezault, C.; Le Charpentier, M.; Dousset, B.; Morel, P.; Soubrane, O.; Chaussade, S.; et al. Severe hepatic sinusoidal obstruction associated with oxaliplatin-based chemotherapy in patients with metastatic colorectal cancer. Ann. Oncol. 2004, 15, 460–466. [Google Scholar] [CrossRef] [PubMed]
- Vauthey, J.N.; Pawlik, T.M.; Ribero, D.; Wu, T.T.; Zorzi, D.; Hoff, P.M.; Xiong, H.Q.; Eng, C.; Lauwers, G.Y.; Mino-Kenudson, M.; et al. Chemotherapy regimen predicts steatohepatitis and an increase in 90-day mortality after surgery for hepatic colorectal metastases. J. Clin. Oncol. 2006, 24, 2065–2072. [Google Scholar] [CrossRef]
- Viganò, L.; Rubbia-Brandt, L.; De Rosa, G.; Majno, P.; Langella, S.; Toso, C.; Mentha, G.; Capussotti, L. Nodular regenerative hyperplasia in patients undergoing liver resection for colorectal metastases after chemotherapy: Risk factors, preoperative assessment and clinical impact. Ann. Surg. Oncol. 2015, 22, 4149–4157. [Google Scholar] [CrossRef]
- Viganò, L.; Capussotti, L.; De Rosa, G.; De Saussure, W.O.; Mentha, G.; Rubbia-Brandt, L. Liver resection for colorectal metastases after chemotherapy: Impact of chemotherapy-related liver injuries, pathological tumor response, and micrometastases on long-term survival. Ann. Surg. 2013, 258, 731–742. [Google Scholar] [CrossRef]
- Rubbia-Brandt, L.; Lauwers, G.Y.; Wang, H.; Majno, P.E.; Tanabe, K.; Zhu, A.; Brezault, C.; Soubrane, O.; Abdalla, E.K.; Vauthey, J.N.; et al. Sinusoidal obstruction syndrome and nodular regenerative hyperplasia are frequent oxaliplatin-associated liver lesions and partially prevented by bevacizumab in patients with hepatic colorectal metastasis. Histopathology 2010, 56, 430–439. [Google Scholar] [CrossRef]
- Mahli, A.; Saugspier, M.; Koch, A.; Sommer, J.; Dietrich, P.; Lee, S.; Thasler, R.; Schulze-Luehrmann, J.; Luehrmann, A.; Thasler, W.E.; et al. ERK activation and autophagy impairment are central mediators of irinotecan-induced steatohepatitis. Gut 2018, 67, 746–756. [Google Scholar] [CrossRef]
- Sheka, A.C.; Adeyi, O.; Thompson, J.; Hameed, B.; Crawford, P.A.; Ikramuddin, S. Nonalcoholic Steatohepatitis: A Review. JAMA J. Am. Med. Assoc. 2020, 323, 1175–1183. [Google Scholar] [CrossRef] [PubMed]
- Viganò, L.; Conci, S.; Cescon, M.; Fava, C.; Capelli, P.; D’Errico, A.; Torzilli, G.; Di Tommaso, L.; Giuliante, F.; Vecchio, F.M.; et al. Liver resection for hepatocellular carcinoma in patients with metabolic syndrome: A multicenter matched analysis with HCV-related HCC. J. Hepatol. 2015, 63, 93–101. [Google Scholar] [CrossRef] [PubMed]
- Nakano, H.; Oussoultzoglou, E.; Rosso, E.; Casnedi, S.; Chenard-Neu, M.P.; Dufour, P.; Bachellier, P.; Jaeck, D. Sinusoidal injury increases morbidity after major hepatectomy in patients with colorectal liver metastases receiving preoperative chemotherapy. Ann. Surg. 2008, 247, 118–124. [Google Scholar] [CrossRef]
- De Meijer, V.E.; Kalish, B.T.; Puder, M.; IJzermans, J.N.M. Systematic review and meta-analysis of steatosis as a risk factor in major hepatic resection. Br. J. Surg. 2010, 97, 1331–1339. [Google Scholar] [CrossRef]
- Aloia, T.; Sebagh, M.; Plasse, M.; Karam, V.; Lévi, F.; Giacchetti, S.; Azoulay, D.; Bismuth, H.; Castaing, D.; Adam, R. Liver histology and surgical outcomes after preoperative chemotherapy with fluorouracil plus oxaliplatin in colorectal cancer liver metastases. J. Clin. Oncol. 2006, 24, 4983–4990. [Google Scholar] [CrossRef] [PubMed]
- Soubrane, O.; Brouquet, A.; Zalinski, S.; Terris, B.; Brézault, C.; Mallet, V.; Goldwasser, F.; Scatton, O. Predicting high grade lesions of sinusoidal obstruction syndrome related to oxaliplatin-based chemotherapy for colorectal liver metastases. Ann. Surg. 2010, 251, 454–460. [Google Scholar] [CrossRef] [PubMed]
- Zhao, J.; Van Mierlo, K.M.C.; Gómez-Ramírez, J.; Kim, H.; Pilgrim, C.H.C.; Pessaux, P.; Rensen, S.S.; Van der Stok, E.P.; Schaap, F.G.; Soubrane, O.; et al. Systematic review of the influence of chemotherapy-associated liver injury on outcome after partial hepatectomy for colorectal liver metastases. Br. J. Surg. 2017, 104, 990–1002. [Google Scholar] [CrossRef]
- Viganò, L.; Sollini, M.; Ieva, F.; Fiz, F.; Torzilli, G. Chemotherapy-associated liver injuries. Unmet needs and new insights for surgical oncologists. Ann. Surg. Oncol. 2021, 1–6. [Google Scholar] [CrossRef]
- Takamoto, T.; Hashimoto, T.; Sano, K.; Maruyama, Y.; Inoue, K.; Ogata, S.; Takemura, T.; Kokudo, N.; Makuuchi, M. Recovery of liver function after the cessation of preoperative chemotherapy for colorectal liver metastasis. Ann. Surg. Oncol. 2010, 17, 2747–2755. [Google Scholar] [CrossRef] [PubMed]
- Wakiya, T.; Kudo, D.; Toyoki, Y.; Ishido, K.; Kimura, N.; Narumi, S.; Kijima, H.; Hakamada, K. Evaluation of the usefulness of the indocyanine green clearance test for chemotherapy-associated liver injury in patients with colorectal cancer liver metastasis. Ann. Surg. Oncol. 2014, 21, 167–172. [Google Scholar] [CrossRef] [PubMed]
- Lock, J.F.; Westphal, T.; Rubin, T.; Malinowski, M.; Schulz, A.; Jara, M.; Bednarsch, J.; Stockmann, M. LiMAx Test improves diagnosis of chemotherapy-associated liver injury before resection of colorectal liver metastases. Ann. Surg. Oncol. 2017, 24, 2447–2455. [Google Scholar] [CrossRef]
- Zhang, Y.; Yan, Y.; Song, B. Noninvasive imaging diagnosis of sinusoidal obstruction syndrome: A pictorial review. Insights Imaging 2019, 10, 110. [Google Scholar] [CrossRef] [PubMed]
- Castera, L.; Friedrich-Rust, M.; Loomba, R. Noninvasive assessment of liver disease in patients with nonalcoholic fatty liver disease. Gastroenterology 2019, 156, 1264–1281.e4. [Google Scholar] [CrossRef]
- Viganò, L.; Ravarino, N.; Ferrero, A.; Motta, M.; Torchio, B.; Capussotti, L. Prospective evaluation of accuracy of liver biopsy findings in the identification of chemotherapy-associated liver injuries. Arch. Surg. 2012, 147, 1085–1091. [Google Scholar] [CrossRef] [PubMed][Green Version]
- Sollini, M.; Bandera, F.; Kirienko, M. Quantitative imaging biomarkers in nuclear medicine: From SUV to image mining studies. Highlights from annals of nuclear medicine 2018. Eur. J. Nucl. Med. Mol. Imaging 2019, 46, 2737–2745. [Google Scholar] [CrossRef] [PubMed]
- Fiz, F.; Viganò, L.; Gennaro, N.; Costa, G.; La Bella, L.; Boichuk, A.; Cavinato, L.; Sollini, M.; Politi, L.S.; Chiti, A.; et al. Radiomics of liver metastases: A systematic review. Cancers 2020, 12, 2881. [Google Scholar] [CrossRef] [PubMed]
- Lubner, M.G.; Jones, D.; Kloke, J.; Said, A.; Pickhardt, P.J. CT texture analysis of the liver for assessing hepatic fibrosis in patients with hepatitis C virus. Br. J. Radiol. 2019, 92, 20180153. [Google Scholar] [CrossRef]
- Lubner, M.G.; Malecki, K.; Kloke, J.; Ganeshan, B.; Pickhardt, P.J. Texture analysis of the liver at MDCT for assessing hepatic fibrosis. Abdom. Radiol. 2017, 42, 2069–2078. [Google Scholar] [CrossRef]
- Park, H.J.; Lee, S.S.; Park, B.; Yun, J.; Sung, Y.S.; Shim, W.H.; Shin, Y.M.; Kim, S.Y.; Lee, S.J.; Lee, M.G. Radiomics analysis of gadoxetic acid–enhanced MRI for staging liver fibrosis. Radiology 2019, 290, 380–387. [Google Scholar] [CrossRef]
- Wang, K.; Lu, X.; Zhou, H.; Gao, Y.; Zheng, J.; Tong, M.; Wu, C.; Liu, C.; Huang, L.; Jiang, T.; et al. Deep learning radiomics of shear wave elastography significantly improved diagnostic performance for assessing liver fibrosis in chronic hepatitis B: A prospective multicentre study. Gut 2019, 68, 729–741. [Google Scholar] [CrossRef] [PubMed]
- Nioche, C.; Orlhac, F.; Boughdad, S.; Reuze, S.; Goya-Outi, J.; Robert, C.; Pellot-Barakat, C.; Soussan, M.; Frouin, F.; Buvat, I. Lifex: A freeware for radiomic feature calculation in multimodality imaging to accelerate advances in the characterization of tumor heterogeneity. Cancer Res. 2018, 78, 4786–4789. [Google Scholar] [CrossRef] [PubMed]
- Nioche, C. LifeX Sofware. Available online: www.lifexsoft.org (accessed on 10 March 2021).
- Viganò, L.; Procopio, F.; Cimino, M.M.; Donadon, M.; Gatti, A.; Costa, G.; Del Fabbro, D.; Torzilli, G. Is tumor detachment from vascular structures equivalent to R0 resection in surgery for colorectal liver metastases? An observational cohort. Ann. Surg. Oncol. 2016, 23, 1352–1360. [Google Scholar] [CrossRef]
- Vigano, L.; Darwish, S.S.; Rimassa, L.; Cimino, M.; Carnaghi, C.; Donadon, M.; Procopio, F.; Personeni, N.; Del Fabbro, D.; Santoro, A.; et al. Progression of colorectal liver metastases from the end of chemotherapy to resection: A new contraindication to surgery? Ann. Surg. Oncol. 2018, 25, 1676–1685. [Google Scholar] [CrossRef]
- Torzilli, G.; Viganò, L.; Gatti, A.; Costa, G.; Cimino, M.; Procopio, F.; Donadon, M.; Del Fabbro, D. Twelve-year experience of “radical but conservative” liver surgery for colorectal metastases: Impact on surgical practice and oncologic efficacy. HPB 2017, 19, 775–784. [Google Scholar] [CrossRef] [PubMed]
- Stevenson, H.L.; Prats, M.M.; Sasatomi, E. Chemotherapy-induced Sinusoidal Injury (CSI) score: A novel histologic assessment of chemotherapy-related hepatic sinusoidal injury in patients with colorectal liver metastasis. BMC Cancer 2017, 17. [Google Scholar] [CrossRef]
- Wanless, I.R. Micronodular transformation (nodular regenerative hyperplasia) of the liver: A report of 64 cases among 2500 autopsies and a new classification of benign hepatocellular nodules. Hepatology 1990, 11, 787–797. [Google Scholar] [CrossRef]
- Kleiner, D.E.; Brunt, E.M.; Van Natta, M.; Behling, C.; Contos, M.J.; Cummings, O.W.; Ferrell, L.D.; Liu, Y.C.; Torbenson, M.S.; Unalp-Arida, A.; et al. Design and validation of a histological scoring system for nonalcoholic fatty liver disease. Hepatology 2005, 41, 1313–1321. [Google Scholar] [CrossRef] [PubMed]
- Marchesini, G.; Day, C.P.; Dufour, J.F.; Canbay, A.; Nobili, V.; Ratziu, V.; Tilg, H.; Roden, M.; Gastaldelli, A.; Yki-Jarvinen, H.; et al. EASL-EASD-EASO Clinical Practice Guidelines for the management of non-alcoholic fatty liver disease. J. Hepatol. 2016, 64, 1388–1402. [Google Scholar] [CrossRef] [PubMed]
- Bedossa, P.; Poynard, T. An algorithm for the grading of activity in chronic hepatitis C. Hepatology 1996, 24, 289–293. [Google Scholar] [CrossRef] [PubMed]
- StataCorp. Stata Statistical Software: Release 16; StataCorp LLC: College Station, TX, USA, 2019. [Google Scholar]
- R Core Team. R: A Language and Environment for Statistical Computing; R Foundation for Statistical Computing: Vienna, Austria, 2020. [Google Scholar]
- Bethesda. Nonalcoholic fatty liver. In LiverTox: Clinical and Research Information on Drug-Induced Liver Injury; Bethesda: National Institute of Diabetes and Digestive and Kidney Diseases: Rockville Pike, MD, USA, 2012. Available online: https://www.ncbi.nlm.nih.gov/books/NBK547860/ (accessed on 4 May 2019).
- Bethesda. Nodular regenerative hyperplasia. In LiverTox: Clinical and Research Information on Drug-Induced Liver Injury; Bethesda: National Institute of Diabetes and Digestive and Kidney Diseases: Rockville Pike, MD, USA, 2012. Available online: https://www.ncbi.nlm.nih.gov/books/NBK548385/ (accessed on 4 May 2019).
- Bethesda. Sinusoidal obstruction syndrome (veno-occlusive disease. In LiverTox: Clinical and Research Information on Drug-Induced Liver Injury; Bethesda: National Institute of Diabetes and Digestive and Kidney Diseases: Rockville Pike, MD, USA, 2012. Available online: https://www.ncbi.nlm.nih.gov/books/NBK548032/ (accessed on 4 May 2019).
- Ward, J.; Guthrie, J.A.; Sheridan, M.B.; Boyes, S.; Smith, J.T.; Wilson, D.; Wyatt, J.I.; Treanor, D.; Robinson, P.J. Sinusoidal obstructive syndrome diagnosed with superparamagnetic iron oxide-enhanced magnetic resonance imaging in patients with chemotherapy-treated colorectal liver metastases. J. Clin. Oncol. 2008, 26, 4304–4310. [Google Scholar] [CrossRef] [PubMed]
- Overman, M.J.; Maru, D.M.; Charnsangavej, C.; Loyer, E.M.; Wang, H.; Pathak, P.; Eng, C.; Hoff, P.M.; Vauthey, J.N.; Wolff, R.A.; et al. Oxaliplatin-mediated increase in spleen size as a biomarker for the development of hepatic sinusoidal injury. J. Clin. Oncol. 2010, 28, 2549–2555. [Google Scholar] [CrossRef] [PubMed]
- Shindoh, J.; Kobayashi, Y.; Kinowaki, K.; Mise, Y.; Gonoi, W.; Yoshida, S.; Tani, K.; Matoba, S.; Kuroyanagi, H.; Hashimoto, M. Dynamic changes in normal liver parenchymal volume during chemotherapy for colorectal cancer: Liver atrophy as an alternate marker of chemotherapy-associated liver injury. Ann. Surg. Oncol. 2019, 26, 4100–4107. [Google Scholar] [CrossRef]
- Tani, K.; Shindoh, J.; Takamoto, T.; Shibahara, J.; Nishioka, Y.; Hashimoto, T.; Sakamoto, Y.; Hasegawa, K.; Makuuchi, M.; Kokudo, N. Kinetic changes in liver parenchyma after preoperative chemotherapy for patients with colorectal liver metastases. J. Gastrointest. Surg. 2017, 21, 813–821. [Google Scholar] [CrossRef]
- Tuceryan, M.; Jain, A.K. Texture analysis. In Handbook of Pattern Recognition and Computer Vision; World Scientific: Singapore, 1993; pp. 235–276. [Google Scholar]
- Yip, S.S.F.; Aerts, H.J.W.L. Applications and limitations of radiomics. Phys. Med. Biol. 2016, 61, R150–R166. [Google Scholar] [CrossRef] [PubMed]
- Parekh, V.S.; Jacobs, M.A. Deep learning and radiomics in precision medicine. Expert Rev. Precis. Med. Drug Dev. 2019, 4, 59–72. [Google Scholar] [CrossRef]
- Wen, Y.L.; Leech, M. Review of the role of radiomics in tumour risk classification and prognosis of cancer. Anticancer Res. 2020, 40, 3605–3618. [Google Scholar] [CrossRef]
- Miranda Magalhaes Santos, J.M.; Clemente Oliveira, B.; de Araujo-Filho, J.A.B.; Assuncao-Jr, A.N.; Felipe, F.A.; Carlos Tavares Rocha, C.; Horvat, J.V.; Menezes, M.R.; Horvat, N. State-of-the-art in radiomics of hepatocellular carcinoma: A review of basic principles, applications, and limitations. Abdom. Radiol. 2020, 45, 342–353. [Google Scholar] [CrossRef] [PubMed]
- Takamoto, T.; Hashimoto, T.; Ichida, A.; Shimada, K.; Maruyama, Y.; Makuuchi, M. Surgical strategy based on indocyanine green test for chemotherapy-associated liver injury and long-term outcome in colorectal liver metastases. J. Gastrointest. Surg. 2018, 22, 1077–1088. [Google Scholar] [CrossRef] [PubMed]
- Ryou, M.; Stylopoulos, N.; Baffy, G. Nonalcoholic fatty liver disease and portal hypertension. Explor. Med. 2020, 1, 149–169. [Google Scholar] [CrossRef] [PubMed]
- Zhao, J.; Sawo, P.; Rensen, S.S.; Rouflart, M.M.J.; Winstanley, A.; Vreuls, C.P.H.; Verheij, J.; Van Mierlo, K.M.C.; Lodewick, T.M.; Van Woerden, V.; et al. Impact of chemotherapy-associated liver injury on tumour regression grade and survival in patients with colorectal liver metastases. HPB 2018, 20, 147–154. [Google Scholar] [CrossRef] [PubMed]
- Vigano, L.; De Rosa, G.; Toso, C.; Andres, A.; Ferrero, A.; Roth, A.; Sperti, E.; Majno, P.; Rubbia-Brandt, L. Reversibility of chemotherapy-related liver injury. J. Hepatol. 2017, 67, 84–91. [Google Scholar] [CrossRef]
- Williams, C.D.; Stengel, J.; Asike, M.I.; Torres, D.M.; Shaw, J.; Contreras, M.; Landt, C.L.; Harrison, S.A. Prevalence of nonalcoholic fatty liver disease and nonalcoholic steatohepatitis among a largely middle-aged population utilizing ultrasound and liver biopsy: A prospective study. Gastroenterology 2011, 140, 124–131. [Google Scholar] [CrossRef] [PubMed]
- Nakamuta, M.; Morizono, S.; Soejima, Y.; Yoshizumi, T.; Aishima, S.; Takasugi, S.; Yoshimitsu, K.; Enjoji, M.; Kotoh, K.; Taketomi, A.; et al. Short-term intensive treatment for donors with hepatic steatosis in living-donor liver transplantation. Transplantation 2005, 80, 608–612. [Google Scholar] [CrossRef] [PubMed]
- Lassailly, G.; Caiazzo, R.; Ntandja-Wandji, L.-C.; Gnemmi, V.; Baud, G.; Verkindt, H.; Ningarhari, M.; Louvet, A.; Leteurtre, E.; Raverdy, V.; et al. Bariatric surgery provides long-term resolution of nonalcoholic steatohepatitis and regression of fibrosis. Gastroenterology 2020, 159, 1290–1301.e5. [Google Scholar] [CrossRef]
- Sollini, M.; Cozzi, L.; Ninatti, G.; Antunovic, L.; Cavinato, L.; Chiti, A.; Kirienko, M. PET/CT radiomics in breast cancer: Mind the step. Methods 2020, 188, 122–132. [Google Scholar] [CrossRef]
- Rizzo, S.; Botta, F.; Raimondi, S.; Origgi, D.; Fanciullo, C.; Morganti, A.G.; Bellomi, M. Radiomics: The facts and the challenges of image analysis. Eur. Radiol. Exp. 2018, 2, 1–8. [Google Scholar] [CrossRef]
- Dindo, D.; Demartines, N.; Clavien, P.A. Classification of surgical complications: A new proposal with evaluation in a cohort of 6336 patients and results of a survey. Ann Surg. 2004, 240, 205–213. [Google Scholar] [CrossRef]
- Rahbari, N.N.; Garden, O.J.; Padbury, R.; Brooke-Smith, M.; Crawford, M.; Adam, R.; Koch, M.; Makuuchi, M.; Dematteo, R.P.; Christophi, C.; et al. Posthepatectomy liver failure: A definition and grading by the International Study Group of Liver Surgery (ISGLS). Surgery 2011, 149, 713–724. [Google Scholar] [CrossRef] [PubMed]


| Chemotherapy Data | |
|---|---|
| Regimen | |
| Oxaliplatin | 69 (88%) |
| Irinotecan | 33 (42%) |
| Anti-VEGF treatment | 45 (58%) |
| Anti-EGFR treatment | 29 (37%) |
| Number of cycles, median (range) | 8 (3–35) |
| >6 cycles | 48 (62%) |
| ≥2 lines | 25 (32%) |
| Interval chemotherapy-surgery, weeks, median (range) | 5 (4–7) |
| CALI | |
| Sinusoidal dilatation | 56 (72%) |
| Grade 2–3 * | 25 (32%) |
| NRH | 27 (35%) |
| Grade 2–3 ** | 9 (12%) |
| Steatosis | 34 (44%) |
| Grade 2–3 *** | 19 (24%) |
| Lobular inflammation | 21 (27%) |
| Hepatocellular ballooning | 14 (18%) |
| NASH **** | 14 (18%) |
| Grade 2–3 Sinusoidal Dilatation | ||||
| N | Y | p | ||
| Age, years, median (range) | 61 (30–82) | 66 (51–80) | 0.032 | |
| APRI score, median (range) | 0.33 (0.10–1.16) | 0.50 (0.12–1.89) | 0.006 | |
| GGT, UI/L, median (range) | 59 (7–247) | 76 (11–372) | 0.290 | |
| BMI, kg/m2, median (range) | 25.8 (19.0–40.3) | 24.9 (20.4–33.6) | 0.368 | |
| Dyslipidemia | N | 24 (69%) | 11 (31%) | 0.915 |
| Y | 29 (67%) | 14 (33%) | ||
| Diabetes | N | 44 (66%) | 23 (34%) | 0.487 |
| Y | 9 (82%) | 2 (18%) | ||
| Metabolic syndrome | N | 47 (67%) | 23 (33%) | 0.652 |
| Y | 6 (75%) | 2 (25%) | ||
| Oxaliplatin-based chemotherapy | N | 7 (78%) | 2 (22%) | 0.502 |
| Y | 46 (67%) | 23 (33%) | ||
| Irinotecan-based chemotherapy | N | 30 (67%) | 15 (33%) | 0.777 |
| Y | 23 (70%) | 10 (30%) | ||
| Anti-VEGF treatment | N | 18 (55%) | 15 (45%) | 0.030 |
| Y | 35 (78%) | 25 (32%) | ||
| Number of cycles of chemotherapy | 1–6 | 19 (63%) | 11 (37%) | 0.490 |
| >6 | 34 (71%) | 14 (29%) | ||
| NRH | ||||
| N | Y | p | ||
| Age, years, median (range) | 62 (30–82) | 64 (47–80) | 0.333 | |
| APRI score, median (range) | 0.32 (0.10–1.16) | 0.49 (0.12–1.89) | 0.006 | |
| GGT, UI/L, median (range) | 54 (7–247) | 83 (11–372) | 0.032 | |
| BMI, kg/m2, median (range) | 26.0 (19.0–40.3) | 4.6 (20.4–32.3) | 0.161 | |
| Dyslipidemia | N | 21 (60%) | 14 (40%) | 0.367 |
| Y | 30 (70%) | 13 (30%) | ||
| Diabetes | N | 43 (64%) | 24 (36%) | 0.739 |
| Y | 8 (73%) | 3 (27%) | ||
| Metabolic syndrome | N | 44 (63%) | 26 (37%) | 0.165 |
| Y | 7 (87%) | 1 (13%) | ||
| Oxaliplatin-based chemotherapy | N | 7 (78%) | 2 (22%) | 0.406 |
| Y | 44 (64%) | 25 (36%) | ||
| Irinotecan-based chemotherapy | N | 31 (69%) | 14 (31%) | 0.447 |
| Y | 20 (61%) | 13 (39%) | ||
| Anti-VEGF treatment | N | 17 (52%) | 16 (48%) | 0.027 |
| Y | 34 (76%) | 11 (24%) | ||
| Number of cycles of chemotherapy | 1–6 | 21 (70) | 9 (30%) | 0.498 |
| >6 | 30 (62%) | 18 (38%) | ||
| Steatohepatitis | ||||
| N | Y | p | ||
| Age, years, median (range) | 63 (30–82) | 61 (47–78) | 0.595 | |
| APRI score, median (range) | 0.37 (0.10–1.89) | 0.42 (0.14–1.16) | 0.610 | |
| GGT, UI/L, median (range) | 63 (7–372) | 72 (21–218) | 0.651 | |
| BMI, kg/m2, median (range) | 25.4 (19.0–33.7) | 29.9 (22.6–40.3) | <0.001 | |
| Dyslipidemia | N | 31 (89%) | 4 (11%) | 0.239 |
| Y | 33 (77%) | 10 (23%) | ||
| Diabetes | N | 55 (82%) | 12 (18%) | 1.000 |
| Y | 9 (82%) | 2 (18%) | ||
| Metabolic syndrome | N | 60 (86%) | 10 (14%) | 0.013 |
| Y | 4 (50%) | 4 (50%) | ||
| Oxaliplatin-based chemotherapy | N | 7 (78%) | 2 (22%) | 0.722 |
| Y | 57 (83%) | 12 (17%) | ||
| Irinotecan-based chemotherapy | N | 40 (89%) | 5 (11%) | 0.066 |
| Y | 24 (73%) | 9 (27%) | ||
| Anti-VEGF treatment | N | 31 (94%) | 2 (6%) | 0.019 |
| Y | 33 (73%) | 12 (27%) | ||
| Number of cycles of chemotherapy | 1–6 | 25 (83%) | 5 (17%) | 0.816 |
| >6 | 39 (81%) | 9 (19%) | ||
| Variable. | OR (95% IC) | p |
|---|---|---|
| Age | 1.11 (1.02–1.21) | 0.015 |
| APRI score | 64.16 (3.32–120.30) | 0.006 |
| Oxaliplatin-based chemotherapy | 11.92 (0.54–26.29) | 0.118 |
| Irinotecan-based chemotherapy | 3.46 (0.66–18.18) | 0.142 |
| Anti-VEGF treatment | 0.18 (0.04–0.77) | 0.021 |
| Number of cycles of chemotherapy | 1.08 (0.98–1.2) | 0.128 |
| Hist_IQR | 0.74 (0.49–1.11) | 0.144 |
| GLRLM_f3 | 12.25 (1.34–111.90) | 0.026 |
| NGLDM_f1 | 7.77 (1.37–44.06) | 0.021 |
| NGLDM_f2 | 0.28 (0.04–1.73) | 0.169 |
| GLZLM_f2 | 0.53 (0.31–0.91) | 0.022 |
| GLZLM_f4 | 1.72 (0.85–3.48) | 0.131 |
| Variable | OR (95% IC) | p |
|---|---|---|
| Age | 1.10 (1.01–1.20) | 0.027 |
| APRI score | 275.08 (4.75–15937.97) | 0.007 |
| BMI | 0.68 (0.49–0.94) | 0.021 |
| Oxaliplatin-based chemotherapy | 34.41 (0.52–2295.05) | 0.099 |
| Irinotecan-based chemotherapy | 28.71 (1.80–459.04) | 0.018 |
| Anti-VEGF treatment | 0.05 (0.01–0.49) | 0.010 |
| Number of cycles of chemotherapy | 1.15 (1.01–1.32) | 0.031 |
| CONVENTIONAL_HUQ2 | 0.76 (0.62–0.92) | 0.005 |
| GLCM_f2 | 1.99 (0.84–4.71) | 0.119 |
| GLRLM_f3 | 0.39 (0.11–1.42) | 0.153 |
| NGLDM_f2 | 2.65 (0.86–8.24) | 0.091 |
| GLZLM_f2 | 0.05 (0.01–0.43) | 0.007 |
| GLZLM_f3 | 7.97 (1.52–41.85) | 0.014 |
| Variable | OR (95% IC) | p |
|---|---|---|
| CONVENTIONAL_HUQ2 | 0.79 (0.66–0.94) | 0.010 |
| GLZLM_f2 | 0.22 (0.03–1.66) | 0.143 |
Publisher’s Note: MDPI stays neutral with regard to jurisdictional claims in published maps and institutional affiliations. |
© 2021 by the authors. Licensee MDPI, Basel, Switzerland. This article is an open access article distributed under the terms and conditions of the Creative Commons Attribution (CC BY) license (https://creativecommons.org/licenses/by/4.0/).
Share and Cite
Costa, G.; Cavinato, L.; Masci, C.; Fiz, F.; Sollini, M.; Politi, L.S.; Chiti, A.; Balzarini, L.; Aghemo, A.; di Tommaso, L.; et al. Virtual Biopsy for Diagnosis of Chemotherapy-Associated Liver Injuries and Steatohepatitis: A Combined Radiomic and Clinical Model in Patients with Colorectal Liver Metastases. Cancers 2021, 13, 3077. https://doi.org/10.3390/cancers13123077
Costa G, Cavinato L, Masci C, Fiz F, Sollini M, Politi LS, Chiti A, Balzarini L, Aghemo A, di Tommaso L, et al. Virtual Biopsy for Diagnosis of Chemotherapy-Associated Liver Injuries and Steatohepatitis: A Combined Radiomic and Clinical Model in Patients with Colorectal Liver Metastases. Cancers. 2021; 13(12):3077. https://doi.org/10.3390/cancers13123077
Chicago/Turabian StyleCosta, Guido, Lara Cavinato, Chiara Masci, Francesco Fiz, Martina Sollini, Letterio Salvatore Politi, Arturo Chiti, Luca Balzarini, Alessio Aghemo, Luca di Tommaso, and et al. 2021. "Virtual Biopsy for Diagnosis of Chemotherapy-Associated Liver Injuries and Steatohepatitis: A Combined Radiomic and Clinical Model in Patients with Colorectal Liver Metastases" Cancers 13, no. 12: 3077. https://doi.org/10.3390/cancers13123077
APA StyleCosta, G., Cavinato, L., Masci, C., Fiz, F., Sollini, M., Politi, L. S., Chiti, A., Balzarini, L., Aghemo, A., di Tommaso, L., Ieva, F., Torzilli, G., & Viganò, L. (2021). Virtual Biopsy for Diagnosis of Chemotherapy-Associated Liver Injuries and Steatohepatitis: A Combined Radiomic and Clinical Model in Patients with Colorectal Liver Metastases. Cancers, 13(12), 3077. https://doi.org/10.3390/cancers13123077