Simple Summary
Monitoring and controlling the temperature distribution combined with precise energy delivery are key components for hyperthermia treatment success. Magnetic resonance (MR) imaging is used clinically to monitor the temperature of the treated volume non-invasively. However, there are no comprehensive systematic studies on MR thermometry accuracy during deep pelvic hyperthermia, and the few investigational studies suffer from a high probability of bias due to lacking objective criteria for data inclusion. This study presents the first systematic analysis and defines an imaging-based criterion for prospective patient selection to standardize clinical MR thermometry accuracy assessments.
Abstract
The efficacy of a hyperthermia treatment depends on the delivery of well-controlled heating; hence, accurate temperature monitoring is essential for ensuring effective treatment. For deep pelvic hyperthermia, there are no comprehensive and systematic reports on MR thermometry. Moreover, data inclusion generally lacks objective selection criteria leading to a high probability of bias when comparing results. Herein, we studied whether imaging-based data inclusion predicts accuracy and could serve as a tool for prospective patient selection. The accuracy of the MR thermometry in patients with locally advanced cervical cancer was benchmarked against intraluminal temperature. We found that gastrointestinal air motion at the start of the treatment, quantified by the Jaccard similarity coefficient, was a good predictor for MR thermometry accuracy. The results for the group that was selected for low gastrointestinal air motion improved compared to the results for all patients by 50% (accuracy), 26% (precision), and 80% (bias). We found an average MR thermometry accuracy of 2.0 °C when all patients were considered and 1.0 °C for the selected group. These results serve as the basis for comprehensive benchmarking of novel technologies. The Jaccard similarity coefficient also has good potential to prospectively determine in which patients the MR thermometry will be valuable.
1. Introduction
Several randomized clinical studies have shown the benefit of hyperthermia as a sensitizing agent for chemotherapy and/or radiotherapy [1,2,3,4,5,6,7,8]. Franckena et al. showed a statistically significant correlation between thermal dose delivered during treatment and treatment outcome in a group of patients with locally advanced cervical cancer (LACC) [9]. This study suggests that the quality of hyperthermia treatment delivery is crucial to its clinical success. Hence, the 3D temperature distribution knowledge, supplemented with equipment that facilitates precise and adaptive delivery, is critical for improving treatment outcome [10,11,12]. Magnetic resonance (MR)-guided hyperthermia is considered the most promising technological platform to monitor the tumor and healthy tissue temperature non-invasively for real-time dose-optimization and dosimetry in multi-institution clinical trials [13,14,15,16,17]. However, systematic assessment of the accuracy and reliability of the non-invasive 3D-MR temperature measurements during treatment is currently lacking. At the same time, this is crucial for deciding on clinical acceptance and for benchmarking technology improvements.
Temperature measurements during hyperthermia treatment can be performed by direct thermometry using invasive and/or intraluminal thermometry probes or by indirect methods such as MR thermometry. Intraluminal thermometry is currently the gold standard for temperature assessment during the treatment of patients with LACC [18,19]. This method will remain the gold standard until MR thermometry presents enough accuracy to provide absolute temperature information. In this technique, temperature probes are inserted into closed-tip catheters previously positioned in body cavities. Invasive/intraluminal thermometry presents severe limitations [20] since it samples only data at a specific location and/or along the implanted catheter, leading to a limited spatial resolution. Additionally, this technique is unpleasant for the patient and can be associated with possible risks such as hemorrhages or infections [19,21,22,23]. MR thermometry offers the advantage that it can non-invasively monitor temperature changes in the treated volume and surrounding tissues. Additionally, it offers the possibility to characterize treatment efficacy by observing the required thermal metrics in real time during treatment. This technique brings opportunities for dynamic treatment delivery feedback control [24,25,26,27,28,29,30], as well as treatment planning validation [13,17,31], and assessment of thermoregulation in tissues [32,33,34,35]. There are several MR thermometry methods; the proton resonance frequency shift (PRFS) method is the most widely used due to its linearity and sensitivity [36,37,38,39,40].
Interest in MR-guided hyperthermia systems has steadily grown over the last decades [14,16,41,42]. Several studies have demonstrated the feasibility of non-invasive MR thermometry and benchmarked MR thermometry against invasive/intraluminal thermometry. Gellermann et al. [43] showed the potential of MR thermometry in patients with recurrent rectal carcinoma. They found a correlation of R2 = 0.67 and an accuracy of 1.5 °C between MR thermometry and thermistor probe readings. A follow-up study included patients with soft tissue sarcomas of the lower extremities and pelvis [44] and showed a correlation of R2 = 0.96 between MR thermometry and thermistor probe readings. Craciunescu et al. [45] evaluated the bias between MR thermometry and invasive thermometry for high-grade extremity soft-tissue sarcomas. They found that the mean differences in a small volume of interest around interstitial probe positions were below 1 °C. However, Craciunescu et al. [45] showed that in regions at muscle/fat or tumor/fat, the bias was 1.89 °C. For large extremity soft tissue sarcoma, Stauffer et al. [46] showed that the bias between MR thermometry and interstitial measurements was 0.85 °C. In a more recent study, Unsoeld et al. [33] found a correlation between MR thermometry data and pathologic response for soft-tissue sarcomas of the lower extremities. Assessment of MR thermometry performance in deep pelvic tumors; i.e., nearby inner patient locations with motion such as moving air in the intestines has been evaluated in only a few studies [43,44,47]. These studies did show a qualitative correlation between invasive/intraluminal probe measurements and MR thermometry. However, these did not evaluate the accuracy in a volume of interest close to the temperature probes, the latter being crucial information for clinical acceptance. In addition, no studies have reported MR thermometry temporal precision for RF hyperthermia [48]. Finally, replicating these results is lacking and will be cumbersome in a retrospective setting due to the strong but not clearly defined patient selection. Hence, the accuracy of MR thermometry during deep pelvic hyperthermia treatments remains ambiguous.
In this study, we investigated MR thermometry in patients with LACC and assessed accuracy, temporal precision, and bias. As the gold standard, we used intraluminal placed temperature probes. In addition, we investigated the feasibility of a standardized pre-treatment patient selection based on a relevant and measurable imaging parameter.
2. Materials and Methods
2.1. Patients and Clinical Protocol
This study included 14 patients diagnosed with locally advanced cervical carcinoma. All patients were treated at the Erasmus Medical Center with curative intent using hyperthermia as an adjunct to radiotherapy. Approval of the medical ethics committee was obtained prior to start of the study (MEC 2015-108). The patient/tumor characteristics are presented in Table 1.

Table 1.
Characterization of the data used in this study: patient and tumor characteristics, and hyperthermia treatment sessions characteristics. For continuous data, the age, total number of sessions, and values were expressed by the mean ± standard deviation.
All patients were treated in the BSD-2000-3D MR-compatible system (Pyrexar Medical Corp., Salt Lake City, UT, USA) [14] integrated into a 1.5 T GE Signa Excite scanner (General Electric Healthcare, Waukesha, WI, USA). Following the non-MR monitored procedure, intraluminal thermometry was acquired during the hyperthermia treatment by Bowman probes inserted into closed tip catheters placed in the bladder, vagina, and rectum before the hyperthermia treatment. Temperature mapping along the catheters was performed every 5 min with a step size of 1 cm and a maximum mapping length of 14 cm. Each patient received, on average, three hyperthermia treatments of approximately 90 min within the BSD-2000-3D MR-compatible hyperthermia system during the entire course of radiotherapy (Table 1). A patient-specific treatment plan was delivered for each patient. Treatment settings for power and phase were adjusted accordingly following patient complaints and/or if healthy tissue temperature exceeded 43 °C [49,50].
2.2. MR Thermometry Image Acquisition
The schematic description of the MR protocol is presented in Figure 1. We used two types of scans: the high resolution scan for verifying the patient positioning and anatomic information, and the MR thermometry scan for temperature imaging [17].
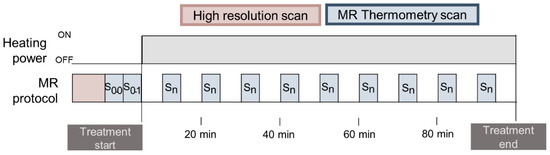
Figure 1.
Description of the clinical MR protocol. Each sequence is represented with a color. High-resolution scan and two MR thermometry scans were taken before the treatment, and approximately nine MR thermometry scans were performed during treatment.
For temperature monitoring, we employed the PRFS method [36,40,51]. The clinical sequence provided by the manufacturer is the double echo gradient recalled echo (DEGRE) sequence [36,43,44,47] with parameters: echo times: TE = 4.8 and 19.1 ms; repetition time: TR = 620 ms; 25 axial slices; slice thickness = 1 cm; field of view (FOV) = 50 × 50 cm; acquisition matrix = 128 × 128; reconstruction matrix = 256 × 256; flip angle = 40°; scan time = 83 s. Each MR thermometry scan (S) presents 25 phase images (φ) and 25 magnitude images.
2.3. Contouring and Region Selection
T1-weighted datasets (high-resolution scan in Figure 1) were used to identify the catheters containing Bowman probes and delineate regions of interest. From the 25 slices of the T1-weighted datasets, only two to eight slices were used to identify intraluminal locations due to the limited probe range. Figure 2a presents an example of the probe range in the bladder and rectum, where, in the sagittal view, the rectum probe was identified in only in five slices (−2 cm to −7 cm), while the bladder probe was identified in eight slices (−2 to −10 cm). Note that the probe located in the vagina is not visualized in this sagittal image. Pointwise matching the probes to the MR temperature mapping was difficult; therefore, we draw a circular region of interest (ROI) for each location identified to reduce the impact of spatial mismatches. As shown in Figure 2b, the ROIs had a diameter of 1.37 cm, resulting in an ROI area of 1.47 cm2. Body fat was delineated for MRT correction purposes and to evaluate its impact on MR thermometry accuracy. As presented in Figure 3, gastrointestinal air was delineated in the baseline scans to evaluate the impact of air volume and motion on MR thermometry accuracy during the treatment.
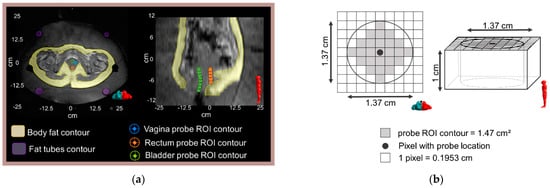
Figure 2.
(a) An axial and a sagittal T1-weighted MR image of the pelvic are shown along with an illustration of the location of the Bowman probes points and the corresponding delineated ROIs: vagina, rectum, and bladder. The left and right images correspond to the middle axial slice (z = −2 cm) and middle sagittal slice (x = 0 cm), respectively. Body fat and fat-like tube ROIs are indicated in the axial MR image. (b) Schematic representation of the probe ROI contour in the axial and sagittal view.
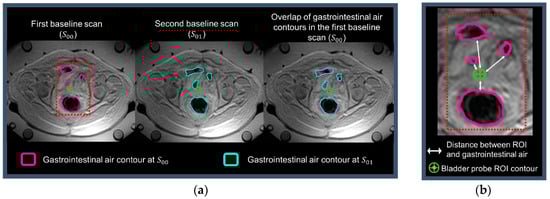
Figure 3.
The axial anatomic images and a zoomed region from MR thermometry reference scans are shown: (a) presents the gastrointestinal air contours in the two first baseline scans and the overlap of these contours in the first baseline scan; (b) shows the distances between the probe and gastrointestinal air contour. This representative treatment session presented: Jaccard coefficient = 0.67; minimum distance = 0.2 cm; fat volume = 8782.7 mL; and gastrointestinal air volume = 548.5 mL.
2.4. MR Thermometry Processing
The PRFS method measures relative temperature differences () based on phase changes () of the different MR thermometry scans. Hence, before the application of RF power, reference phase data ( and ) was acquired to establish baseline temperature conditions. After power on, on average, nine phase datasets were acquired during the treatment session (.
The acquired images were processed as described in the following steps:
- Uncorrected MR thermometry maps: MR thermometry maps were calculated by taking the difference between the phase maps ( and ), which is formulated as:where is the gyromagnetic ratio and equal to 267.5 × 10⁶ rad/T∙s; is the PRF change coefficient, which is equal to −0.001 ppm/°C; is the magnetic field strength equal to 1.5 T; TE is the echo time equal to 19.1 ms; and n is the scan time.
- Low SNR masking: For each MR thermometry map, voxels with low SNR corresponding to a temperature deviation > 3 °C with respect to three-by-three neighbors were masked to prevent the inclusion of noisy data in the voxels used for drift correction.
- B0 drift correction: In addition to the four fat-like tubes included in the hyperthermia device, body fat (Figure 2) was used to compensate for changes of the static magnetic field B0. A 2D polynomial spatial-temporal correction was applied across the MR temperature maps such that temperature changes are reversed to zero in the selected fat regions. Hence, denotes the final corrected MR thermometry.
- Inaccurate data exclusion: Unrealistic data was removed to avoid pollution by data points affected by confounders such as moving air or other motion. The absolute difference between intraluminal measurements and average MR thermometry measurement within ROIs was minimized. The absolute difference between the two measurements is given by Equation (2), and the minimization is given by Equation (3). The threshold for removal was found to be 7 °C, which was iteratively found between 0 °C and 20 °C using an optimization cycle.where is the MR thermometry temperature; n is the scanning time; is the average intraluminal temperature along the catheter at each location (bladder, rectum, and vagina), j is the index of filtered voxels, and card(J) is the number of voxels within the ROI that were taken into account after applying the threshold.
- Average MR thermometry measurement within ROI: For each probe location, at each scanning time, the average temperature was calculated within the delineated ROIs ). The formulation of the average temperature is given by:where is the MR thermometry temperature, n is the scanning time, j is the index of voxels, and card(J) is the number of voxels within the ROI. Hence, for each intraluminal location and at each scan, a was calculated (, , ).
2.5. Imaging-Based MRT Accuracy Prediction Parameters
The PRFS method measures the relative temperature, which is acquired by the subtraction of temporal phase maps. The supposition behind this method is that the anatomy is stationary, and any phase change between the subtracted images results entirely from temperature changes. Therefore, motion leads to temperature errors, i.e., the intra-scan motion leads to motion-dependent measurement blurring, and inter-scan motion leads to misregistration with the reference phase image. To enable prospective patient selection, we formulated four imaging-based parameters to associate them with MR thermometry accuracy. These were fat volume, gastrointestinal air volume, gastrointestinal air motion, and the minimum distance between the gastrointestinal air contours and the probe ROIs. The minimum distance used consisted of the mean minimum distance calculated in all slices where probe ROIs were delineated (Figure 3b).
As shown in Figure 3a, for each treatment session, the gastrointestinal air was delineated using the magnitude of the baseline scans ( and ). was used to quantify the initial gastrointestinal air volume, and and were used to quantify gastrointestinal air motion. The average time between the start of the two baseline scans within all treatment sessions was 97 ± 10 s. Note that an MR thermometry scan duration is 83 s, so the average time between the end and start of the two scans was 14 s. Gastrointestinal air motion was measured using the Jaccard similarity coefficient [52,53,54]:
where A and B are the air contours in and , respectively (Figure 3). This coefficient is somewhat equivalent to the Dice similarity coefficient but is more sensitive to the absence or presence of overlap. Even though these coefficients are monotonic to one another, the Jaccard coefficient tends to penalize contour differences more than the Dice similarity. Moreover, a higher Jaccard coefficient indicates better agreement between contours. Additionally, the minimum distance between gastrointestinal air and probe ROI contour was computed, as illustrated by the arrows in Figure 3b.
The receiver operating characteristic (ROC) curve was used to analyze how predictive each feature is for acceptable/reliable MR thermometry, and to determine the cut-off values [55,56]. MR thermometry was classified as acceptable for each treatment session (true-condition) when in-accuracy was equal or lower than 1 °C [57], and false otherwise. The area under the ROC curve (AUC) was used as a robust measure to evaluate the performance of the score classifier [58,59]. The AUC ranges from 0.5 (random predictive ability) to 1.0 (perfect predictive ability). The optimal cut-off value () was obtained by taking the minimum distance from the ROC curve to the top-left corner or point (0,1) [60]. In addition, the 95% confidence interval was calculated for each feature and the p-value for the null hypothesis that the AUC is equal to 0.5 (random relation).For each treatment session, the accuracy of MR thermometry measurements (Equation (6)) provided the degree of closeness of the measured temperature change to the actual temperature change (i.e., intraluminal temperature) [48,61]. Given the importance of keeping the proper heating range, we consider the accuracy of ≤1 °C as suitable [48,57]. The temporal precision was determined by the variability of the spatial mean temperature in an ROI across all time points, shown in Equation (7). Since precision provides the reproducibility and repeatability of measurements, we consider that precision should be ≤1 °C [57]. We calculated the bias as the mean error between MR thermometry and intraluminal measurements (Equation (8)) [48,61]. This parameter shows if there is an over or underestimation of temperature. We consider a bias of ≤|0.5 °C| as appropriate [48]. For each intraluminal location (bladder, rectum, and vagina), we described the precision, accuracy, and bias measurements by mean (μ) ± standard deviation (σ). The accuracy, precision, and bias at each probe location were compared using one-way ANOVA analysis [62].
where is the average MR thermometry in the ROI, is the average intraluminal temperature measured along the catheter, and n are measured time points.
Furthermore, for each evaluation parameter, the average deviation from the acceptable threshold was calculated. In other words, the accuracy, precision, and bias within the three locations was calculated and compared with the acceptable threshold to acquire the deviation.
3. Results
3.1. Predictive Value for MRT Accuracy of Imaging-Based Parameters
Figure 4 reports the ROC analysis for the different patient features concerning the predictive value for acceptable MR thermometry accuracy. Gastrointestinal air motion (Jaccard coefficient) outperformed the AUC value and significance and had an optimal cut-off value of 0.91 for a scanning interval of 97 s. The AUC score of gastrointestinal air volume was considerably high (0.79), and the optimal cut-off values were equal to 105.6 mL. The fat volume and minimum distance presented an AUC indicating that these parameters should be considered as random; i.e., they are not suitable predictors for acceptable MR thermometry.
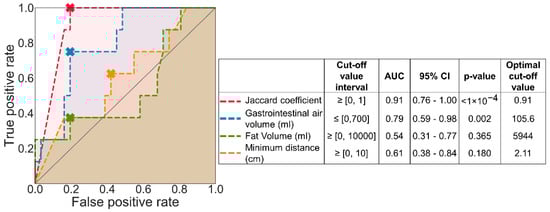
Figure 4.
ROC curve analysis of each predicted condition. The cross marked in each curve indicates the optimal cut-off value, and the shade under each represents AUC. The identity line presented by a solid grey line represents the ROC curve with an AUC equal to 0.5.
Figure 5 presents an example of a session where a Jaccard coefficient was equal to 1, and the gastrointestinal air volume was equal to 221 mL. The session exemplified in Figure 5 represents one of the 15 sessions where we observed that the air motion presented a higher impact than air volume. Hence, the Jaccard coefficient was considered the most suitable parameter for predicting the MR thermometry accuracy and, consequently, it was the parameter used for the treatment session selection.
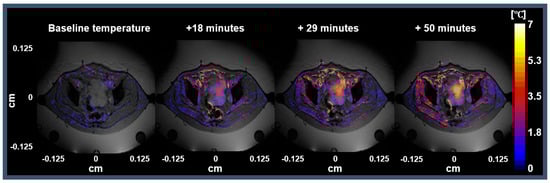
Figure 5.
Representative session with Jaccard coefficient equal to 1 and the gastrointestinal air volume was equal to 221 mL. The first image represents the MR thermometry map between the phase images of and . The following three images represent the MR thermometry maps after 18, 29, and 50 min from when RF power was applied (treatment start).
3.2. MRT Accuracy for All Data versus MRT Accuracy from Selected Sessions
All data: The robustness of MR thermometry accuracy prediction was evaluated by quantifying the temperature accuracy for all probe locations (Figure 6). Figure 6a shows that the median accuracy within the ROIs for all probe locations was 1.7 °C. Light red circles in Figure 6a mark the mean accuracy expressed in Table 2. The mean MR thermometry accuracy in all intraluminal locations was outside the acceptable threshold of 1 °C [48,57]. In addition, the total mean accuracy was equal to 2 °C. The differences in accuracy and the number of voxels used between the different intraluminal locations were insignificant (p-value > 0.05).
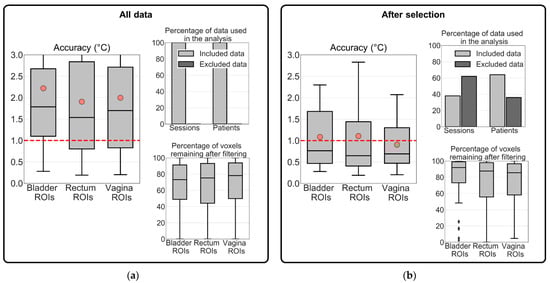
Figure 6.
Evaluation of MR thermometry accuracy in (a) all treatment sessions and (b) in the group of selected treatment sessions. The MR thermometry was calculated for the three intraluminal locations. The evaluation of MR thermometry was based on the voxels remaining after filtering and data used in the analysis. The dashed red line represents the acceptable mean accuracy threshold (1 °C) and, in light red circles, the mean MR thermometry accuracy in each location. The inter-quartile range denotes the middle 50% of the dataset. The top box shows 75% of the dataset that falls below the upper quartile, while the bottom line consists of 25% of the dataset that falls below the lower quartile. The middle line represents the median value, and the line extending from the box represents 2.5% and 97.5% limits of the dataset.
Table 2.
Accuracy, precision, and bias parameters of MR thermometry in all treatment sessions and the selected dataset based on the Jaccard coefficient threshold equal to 0.91. All evaluation parameters are expressed by the mean (µ) ± standard deviation (σ); these mean values are also indicated in light red circles in Figure 6 and Figure 7. The number of sessions and patients remaining after exclusion are indicated. In addition, the average deviation from the acceptable threshold is given for accuracy (1 °C), precision (1 °C), and bias (±0.5 °C). The equal values or below the acceptable threshold are in boldface and underline.
After selection: The MR thermometry accuracy of the selected sessions (Jaccard coefficient ≥ 0.91) was lower than when considering all data. The median MR thermometry accuracy for the bladder, rectum, and vagina was 0.8 °C, 0.6 °C, and 0.7 °C, respectively (Figure 6b). The marked points in Figure 6b show that even though there was an improvement, the mean MR thermometry accuracy was within the acceptable values only in the vagina ROIs (0.9 °C). In contrast, the mean accuracy was equal to 1.1 °C in the bladder and rectum ROIs. Imaging-based selection excluded 36% of the total patients, but the percentage of voxels remaining after filtering increased from 76% to 88%. The differences in accuracy between the different intraluminal locations were not significant (p-value > 0.05). Note that significantly more voxels of the bladder ROIs remain after filtering than in the ROIs of the rectum and vagina (p-value = 0.04).
Table 2 summarizes the mean (µ) and standard deviation (σ) of MR thermometry accuracy, precision, and bias. These parameters were calculated for two datasets: all the treatment sessions and treatment sessions selected were based on gastrointestinal air motion (Jaccard coefficient). Table 2 presents the number and percentage of treatment sessions and patients resulting from each exclusion combination. MR thermometry accuracy, precision, and bias were acceptable when the air motion was used as the selection criterion based on the recommended thresholds. As presented in Table 2, for the selected dataset, the average accuracy and bias within all locations were equal or better than the acceptable threshold (Figure 7b), while the average precision was above the threshold (Figure 7b). In other words, the deviations for accuracy and bias were 0.0 °C and −0.3 °C, respectively, while for precision, the deviation was +0.2 °C. In comparison with including all sessions, we observed that the selection based on the Jaccard coefficient improved MR thermometry accuracy by 50%, precision by 26%, and bias by 80%.
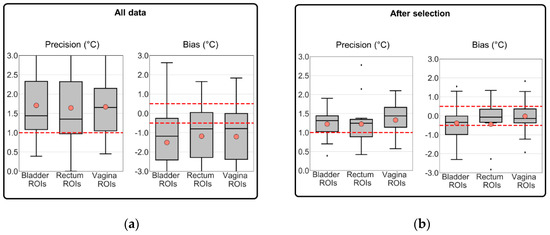
Figure 7.
Evaluation of MR thermometry precision and bias in (a) all treatment sessions and (b) in the group of selected treatment sessions. The MR thermometry was calculated for the three intraluminal locations. The evaluation of MR thermometry was based on the voxels remaining after filtering and data used in the analysis. The dashed red line represents the acceptable mean accuracy threshold (1 °C) and, in light red circles, the mean MR thermometry accuracy in each location. The inter-quartile range denotes the middle 50% of the dataset. The top box shows 75% of the dataset that falls below the upper quartile, while the bottom line consists of 25% of the dataset that falls below the lower quartile. The middle line represents the median value, and the line extending from the box represents 2.5% and 97.5% limits of the dataset.
Figure 7 presents the additional evaluation of MR thermometry regarding precision and bias in all data and the selected dataset. In the selected dataset, the mean values for bias in the bladder, rectum, and vagina location were −0.4 °C, −0.4 °C, and 0.0 °C, i.e., all within the defined threshold value of ±0.5 °C [48]. Figure 7b shows that most of the selected sessions presented an MR thermometry bias within the limits. We observed that the most significant improvement was in the vagina ROIs (98%). In all and selected data, we observed an overall bias of −1.3 °C and −0.3 °C, respectively. These results indicate a general underestimation by MR thermometry. The average precision was approximately 1.3 °C for the intraluminal locations in the selected data, which is slightly above the required threshold (1 °C [57]). Note that the differences between the three intraluminal locations for precision and bias were not significant, both for all data and the selected data (p-value > 0.05).
4. Discussion
4.1. Image Parameters to Select Treatments with Robust MRT
This study evaluated MR thermometry accuracy, precision, and bias before and after imaging-based patient selection. This evaluation compared MR thermometry in small ROIs with intraluminal measurements in the bladder, rectum, and vagina. Note that these were initially created to include the monitoring region of the Bowman probes. These regions were carefully identified for each location in the MR thermometry measurements (time and location) and compared with the gold standard, i.e., intraluminal temperature measurements. We observed that MR thermometry accuracy was poor and above the values (≥1 °C [48,57]) defined as acceptable when using all treatment sessions in the evaluation. We tested four patient-dependent features—fat volume, gastrointestinal air volume, gastrointestinal air motion, and the minimum distance between the gastrointestinal air contours and the probe ROIs. We used the ROC analysis to evaluate which features were predictors for MR thermometry reliability (Figure 4). Our analysis showed that gastrointestinal air motion was predictive for MR thermometry accuracy (AUC = 0.91).
The accuracy of the PRFS method to acquire non-invasive temperature is strongly variable in the pelvic region because of the adjacent intestines and rectum. These organs often contain moving air and, consequently, causing significant susceptibility artifacts [33,44,51,63], which the PRFS method misinterprets as temperature changes. When using all the patient data, we found an average accuracy of 2.0 °C (Figure 6a, Table 2). By selecting treatment sessions based on the amount of air motion between the two baseline images, we could identify which sessions would present improved MR thermometry accuracy compared to all treatment sessions. In addition, we observed an acceptable MR thermometry precision and bias since we found a mean value equal to 1.2 °C and −0.3 °C, respectively (Table 2 and Figure 7). In comparison to all patient data, MR thermometry precision and bias improved 26% and 80%, respectively. Overall, we presented and validated a selection criterion based on an imaging parameter that can be used prospectively to ensure reliable MR-thermometry measurements.
Previous studies have evaluated the MR thermometry accuracy and bias; however, no clinical studies have reported MR thermometry temporal precision. The study conducted by Dadakova et al. [47] reported MR thermometry accuracy and bias equal to 0.40 °C and 0.04 °C, respectively. This study included a group of patients with myxoid liposarcoma (one patient), mucinous rectal cancer (one patient), and rectal adenocarcinoma (two patients). The results found in this study were within the acceptable thresholds; however, the measurement regions were further away from internal motion. One of the patients was excluded from the analysis because of artifacts caused by the air in the rectum. For rectal carcinoma, the study carried out by Gellermann et al. [43] showed that MR thermometry accuracy was equal to ±1 °C after 20 min of treatment time and increased during the treatment to ±1.5 °C. Gellermann et al. [44] found an MR thermometry bias equal to 1.1 °C between several ROIs delineated in the water of water bolus and the probe measurements. Moreover, in both studies, MR thermometry accuracy and bias were not measured in the small volumes where the probes are located and, hence, are prone to underestimate the inaccuracies.
In addition to the B0 drift correction, we applied a filtering process to the MR thermometry maps to remove unrealistic data. The threshold found and used was equal to 7 °C, which implies that the maximum absolute temperature found was approximately 44 °C. Several studies have shown that the increase in the tumor site temperature can be higher than 7 °C [33,34,43,44,45,47]. This threshold was optimized based on the agreement between MR thermometry and intraluminal measurements. Therefore, the tumor site was not taken into account since intraluminal measurements indicate tumor temperature but hardly ever within the tumor. Additionally, we found that many more data points remained valid after the filtering process in the selected group of patients than all patients/treatment sessions (Figure 6). This result indicates that our filtering process also removes systematic errors and that the excluded treatment sessions indeed incorporated corrupt or noisy data.
Table 3 presents the average temperature increase measured at each location and the temperature increase from two studies by Gellermann et al. [43,44]. For rectal carcinoma, the high average measured temperatures in the bladder (>7 °C) were reported and were explained as due to the anatomic changes caused by the bladder filling during treatment [43]. At Erasmus MC, a transurethral catheter was positioned inside the patient’s bladder, so anatomy changes due to bladder filling were expected to be less likely to occur during treatment. In contrast to Gellermann et al. [43], our results show that the temperature increase in the bladder was approximately the same between MR thermometry and intraluminal measurements (Table 3). As shown in Table 3, for soft tissue sarcomas, Gellermann et al. [44] found a higher average increase of temperature from MR thermometry measurements than intraluminal measurements. However, that study suggests that MR thermometry measurements overestimate the temperature by 1 °C to 2 °C. In the studies mentioned, treatment sessions were removed from the analysis due to disturbances caused by technical reasons, incomplete MR datasets, and/or restlessness of the patient. Our study used fewer patient data (64%) compared to the two studies (100%). Regarding the percentage of treatment sessions taken into account, our study used more treatment sessions (38%) compared to Gellermann et al. [43] (20%), but less compared to Gellermann et al. [44] (50%). Overall, our results showed a good agreement between intraluminal and MR thermometry measurements (0.1 °C to 0.4 °C) in the selected data.
Table 3.
Mean and standard deviation (µ ± σ) of temperature increase from MR thermometry measurements and intraluminal temperature measurements in delineated ROIs. The percentage of sessions and patients used in each study is compared with the total number. The mean temperature increase is reported for the dataset with low gastrointestinal air motion. MR thermometry measurements are expressed as MRT, and Intraluminal corresponds to the intraluminal measurements.
4.2. Clinical Relevance
In general, this study shows the feasibility of MR thermometry in the pelvic region and indicates directions to improve MR-thermometry for hyperthermia treatment of patients with LACC. We retrospectively looked at several imaging parameters and evaluated MR thermometry accuracy based on these. We considered using imaging parameters (gastrointestinal air motion: Jaccard coefficient) useful, not only as a selection criterion but also as tools to further improve hyperthermia treatment planning. Hyperthermia treatment planning is designed to predict and optimize hyperthermia treatment performance. One of the steps from this procedure is to segment different tissues to generate a 3D patient model. In this study, we selected patients prospectively using air motion between two anatomical images taken before the treatment. Since gastrointestinal air is one of the tissues being segmented, the Jaccard coefficient could be calculated during the treatment planning phase, which would provide valuable information about the expected reliability of MR thermometry.
At Erasmus MC, deep regional hyperthermia is performed using several devices [16,17,64,65], where the choice of device used to deliver hyperthermia depends on the patient’s size, clinical opinion, and patient comfort. The BSD-2000-3D MR-compatible presents restrictive patient size guidelines [9,66], limiting the number of patients treated. Even though the imaging-based selection limits the number of patients that are amendable for reliable MR thermometry acquisition, this can be used for retrospective data selection. In addition, this study provided valuable information that gastrointestinal air motion is crucial for MR thermometry reliability. Further research on motion correction methods should also be applied retrospectively to be able to include the data corrupted by motion [67]. In recent years, new MR sequences and approaches are being studied and developed to improve MR thermometry performance and exploit the possibility to perform MR thermometry in more challenging regions [68,69,70,71,72,73,74,75]. Given the promising solutions and approaches in reach, we believe that our data will form a valuable baseline for benchmarking methods that correct internal movement [48].
4.3. Study Limitations
Our study had some limitations. First, we used body fat for drift correction, which was based on the fact that the proton resonance frequency of fat tissue has no frequency shift during treatment [76]. Although fat tissue contains more than 70% fat and less than 10% water, this still may result in a slight systematic underestimation of the final MR temperature. Since the temperature increase in fat tissue was small, we expect the error to be minor. Second, several techniques [67,70,71,72,77] have been developed for managing motion, such as gastrointestinal air motion, which has not been used in our study. Third, air motion was quantified by the Jaccard coefficient applied to pairs of manual segmentations. These manual segmentations were prone to intra- and inter-observer variability. Hence, we consider this a disadvantage since the air delineations were performed only by two operators, and the variability was not considered in this study. However, for hyperthermia treatment planning, an automated segmentation procedure is currently being developed at Erasmus MC; therefore, it would reduce the inter-and intra-observer variability.
5. Conclusions
In this study, we confirmed that air motion is a severe disturbing factor for MR thermometry and that this knowledge can be used to predict MR thermometry accuracy. We found a mean MR thermometry accuracy, precision, and bias of approximately 1 °C, 1.2 °C, and −0.3 °C, respectively, considering all locations investigated in the selected data. In addition, we showed that the overall group-mean accuracy and bias were acceptable, whereas the mean precision of the group was slightly higher than acceptable (0.2 °C). The average MR thermometry accuracy, bias, and precision were better in the selected data than the whole patient group by 50%, 80%, and 26%, respectively. Hence, our study showed that air-motion imaging-based selection before treatment predicts satisfactory MR thermometry accuracy. Therefore, this parameter has the potential to prospectively determine when MR thermometry will be valuable and might be used to replace intraluminal thermometry. In conclusion, we performed the first systematic analysis of clinical MR thermometry performance for the pelvic region. Our finding on the importance of air motion can be helpful to guide MR thermometry technology improvements.
Author Contributions
Conceptualization, I.V.-R., S.C., M.F., G.C.v.R. and M.M.P.; methodology, I.V.-R., S.C., G.C.v.R. and M.M.P.; software, I.V.-R. and M.M.P.; formal analysis, I.V.-R., S.C., M.F., G.C.v.R. and M.M.P.; resources, S.C., M.F., G.C.v.R. and M.M.P.; writing—original draft preparation, I.V.-R.; writing—review and editing, S.C., M.F., G.C.v.R. and M.M.P.; supervision, S.C., M.F., G.C.v.R. and M.M.P.; project administration, S.C., M.F., G.C.v.R. and M.M.P.; funding acquisition, S.C., M.F., G.C.v.R. and M.M.P. All authors have read and agreed to the published version of the manuscript.
Funding
This research has been made possible by the Dutch Cancer Society and the Netherlands Organization for Scientific Research (NWO) as a part of their joint Partnership Programme: “Technology for Oncology” grant number: 15195 and the Dutch Cancer Society grant KWF-DDHK 2013-6072. In addition, this project has received funding from the European Union’s Horizon 2020 research and innovation programme under the Marie Sklodowska-Curie grant agreement No 845645.
Institutional Review Board Statement
Not applicable.
Informed Consent Statement
Informed consent was obtained from all subjects involved in the study.
Data Availability Statement
The data presented in this study are available on request from the corresponding author. The data are not publicly available due to privacy.
Acknowledgments
We thank Anton F. Rink for his help in the process of image delineation. We also thank Theresa Feddersen for the proofreading of the manuscript.
Conflicts of Interest
The authors declare no conflict of interest. The funders had no role in the study’s design, in the collection, analyses, or interpretation of data, in the writing of the manuscript, or in the decision to publish the results.
References
- Van Der Zee, J.; González, D.G.; Rhoon, G.C.; Van Dijk, J.D.P.; Van Putten, W.L.J. Van Comparison of Radiotherapy alone with Radiotherapy plus Hyperthermia in Locally Advanced Pelvic Tumors. Lancet 2000, 355, 1119–1125. [Google Scholar] [CrossRef]
- Datta, N.; Bose, A.; Kapoor, H.K. Thermoradiotherapy in the management of carcinoma cervix (stage IIIB): A controlled clinical study. Indian Med. Gaz. 1987, 121, 68–71. [Google Scholar]
- Sharma, S.; Patel, F.D.; Sandhu, A.P.S.; Gupta, B.D.; Yadav, N.S. A prospective randomized study of local hyperthermia as a supplement and radiosensitizer in the treatment of carcinoma of the cervix with radiotherapy. Endocuriether. Hyperth. Oncol. 1989, 5, 151–159. [Google Scholar]
- Chen, H.W.; Jun-Jie, F. Randomized trial of hyperthermo-radiochemotherapy for uterine cervix cancer. Chin. J. Clin. Oncol. 1997, 24, 249–251. [Google Scholar]
- Harima, Y.; Nagata, K.; Harima, K.; Ostapenko, V.V.; Tanaka, Y.S.S. “A randomized clinical trial of radiation therapy versus thermoradiotherapy in stage IIIB cervical carcinoma” of Yoko Harima et al. (2001): Multiple biases and no advantage of hyperthermia. Int. J. Hyperth. 2018, 34, 1400. [Google Scholar] [CrossRef]
- Datta, N.R.; Rogers, S.; Klingbiel, D.; Gómez, S.; Puric, E.; Bodis, S. Hyperthermia and radiotherapy with or without chemotherapy in locally advanced cervical cancer: A systematic review with conventional and network meta-analyses. Int. J. Hyperth. 2016, 32, 809–821. [Google Scholar] [CrossRef] [PubMed]
- Datta, N.R.; Stutz, E.; Gomez, S.; Bodis, S. Efficacy and Safety Evaluation of the Various Therapeutic Options in Locally Advanced Cervix Cancer: A Systematic Review and Network Meta-Analysis of Randomized Clinical Trials. Int. J. Radiat. Oncol. Biol. Phys. 2019, 103, 411–437. [Google Scholar] [CrossRef]
- Lutgens, L.; van der Zee, J.; Pijls-Johannesma, M.; De Haas-Hock, D.F.M.; Buijsen, J.; Mastrigt, G.A.P.G.V.; Lammering, G.; De Ruysscher, D.K.M. Combined use of hyperthermia and radiation therapy for treating locally advanced cervical carcinoma. Cochrane Database Syst. Rev. 2010. [Google Scholar] [CrossRef]
- Franckena, M.; Fatehi, D.; de Bruijne, M.; Canters, R.A.M.; van Norden, Y.; Mens, J.W.; van Rhoon, G.C.; van der Zee, J. Hyperthermia dose-effect relationship in 420 patients with cervical cancer treated with combined radiotherapy and hyperthermia. Eur. J. Cancer 2009, 45, 1969–1978. [Google Scholar] [CrossRef]
- Perez, C.A.; Gillespie, B.; Pajak, T.; Hornback, N.B.; Emami, D.; Rubin, P. Quality assurance problems in clinical hyperthermia and their impact on therapeutic outcome: A report by the radiation therapy oncology group. Int. J. Radiat. Oncol. Biol. Phys. 1989, 16, 551–558. [Google Scholar] [CrossRef]
- Van Der Zee, J.; van Rhoon, G.C.; Wust, P. In regard to Dr. Vasanthan et al. (Int J Radiat Oncol Biol Phys 2005;61:145-153). Int. J. Radiat. Oncol. Biol. Phys. 2005, 62, 940–945. [Google Scholar] [CrossRef]
- Bruggmoser, G.; Bauchowitz, S.; Canters, R.; Crezee, H.; Ehmann, M.; Gellermann, J.; Lamprecht, U.; Lomax, N.; Messmer, M.B.; Ott, O.; et al. Quality assurance for clinical studies in regional deep hyperthermia. Strahlenther. Onkol. 2011, 187, 605–610. [Google Scholar] [CrossRef]
- Gellermann, J.; Wlodarczyk, W.; Ganter, H.; Nadobny, J.; Fähling, H.; Seebass, M.; Felix, R.; Wust, P. A practical approach to thermography in a hyperthermia/magnetic resonance hybrid system: Validation in a heterogeneous phantom. Int. J. Radiat. Oncol. Biol. Phys. 2005, 61, 267–277. [Google Scholar] [CrossRef]
- Gellermann, J.; Wlodarczyk, W.; Feussner, A.; Fähling, H.; Nadobny, J.; Hildebrandt, B.; Felix, R.; Wust, P. Methods and potentials of magnetic resonance imaging for monitoring radiofrequency hyperthermia in a hybrid system. Int. J. Hyperth. 2005, 21, 497–513. [Google Scholar] [CrossRef]
- De Senneville, B.D.; Quesson, B.; Moonen, C.T.W. Magnetic resonance temperature imaging. Int. J. Hyperth. 2005, 21, 515–531. [Google Scholar] [CrossRef]
- Adibzadeh, F.; Sumser, K.; Curto, S.; Yeo, D.T.B.; Shishegar, A.A.; Paulides, M.M. Systematic review of pre-clinical and clinical devices for magnetic resonance-guided radiofrequency hyperthermia. Int. J. Hyperth. 2020, 37, 15–27. [Google Scholar] [CrossRef]
- Curto, S.; Aklan, B.; Mulder, T.; Mils, O.; Schmidt, M.; Lamprecht, U.; Peller, M.; Wessalowski, R.; Lindner, L.H.; Fietkau, R.; et al. Quantitative, Multi-institutional Evaluation of MR Thermometry Accuracy for Deep-Pelvic MR-Hyperthermia Systems Operating in Multi-vendor MR-systems Using a New Anthropomorphic Phantom. Cancers 2019, 11, 1709. [Google Scholar] [CrossRef]
- Bruggmoser, G.; Bauchowitz, S.; Canters, R.; Crezee, H.; Ehmann, M.; Gellermann, J.; Lamprecht, U.; Lomax, N.; Messmer, M.B.; Ott, O.; et al. Guideline for the clinical application, documentation and analysis of clinical studies for regional deep hyperthermia. Int. J. Radiat. Oncol. Biol. Phys. 2012, 188, 198–211. [Google Scholar] [CrossRef]
- Fatehi, D.; Van Der Zee, J.; Notenboom, A.; Van Rhoon, G.C. Comparison of intratumor and intraluminal temperatures during locoregional deep hyperthermia of pelvic tumors. Strahlenther. Onkol. 2007, 183, 479–486. [Google Scholar] [CrossRef]
- Wust, P.; Cho, C.H.; Hildebrandt, B.; Gellermann, J. Thermal monitoring: Invasive, minimal-invasive and non-invasive approaches. Int. J. Hyperth. 2006, 22, 255–262. [Google Scholar] [CrossRef]
- Jones, E.; Secord, A.A.; Prosnitz, L.R.; Samulski, T.V.; Oleson, J.R.; Berchuck, A.; Clarke-Pearson, D.; Soper, J.; Dewhirst, M.W.; Vujaskovic, Z. Intra-peritoneal cisplatin and whole abdomen hyperthermia for relapsed ovarian carcinoma. Int. J. Hyperth. 2006, 22, 161–172. [Google Scholar] [CrossRef]
- Van der Zee, J.; Peer-Valstar, J.N.; Rietveld, P.J.; de Graaf-Strukowska, L.; van Rhoon, G.C. Practical limitations of interstitial thermometry during deep hyperthermia. Int. J. Radiat. Oncol. Biol. Phys. 1998, 40, 1205–1212. [Google Scholar] [CrossRef]
- Kok, H.P.; Schooneveldt, G.; Bakker, A.; de Kroon-Oldenhof, R.; Korshuize-van Straten, L.; de Jong, C.E.; Steggerda-Carvalho, E.; Geijsen, E.D.; Stalpers, L.J.A.; Crezee, J. Predictive value of simulated SAR and temperature for changes in measured temperature after phase-amplitude steering during locoregional hyperthermia treatments. Int. J. Hyperth. 2018, 35, 330–339. [Google Scholar] [CrossRef] [PubMed]
- Hendrikx, R.W.M.; Curto, S.; De Jager, B.; Maljaars, E.; Van Rhoon, G.C.; Paulides, M.M.; Heemels, W.P.M.H. POD-Based Recursive Temperature Estimation for MR-Guided RF Hyperthermia Cancer Treatment: A Pilot Study. In Proceedings of the 57th IEEE Conference on Decision and Control, Miami Beach, FL, USA, 17–19 December 2018; pp. 5201–5208. [Google Scholar]
- Hutchinson, E.; Dahleh, M.; Hynynen, K. The feasibility of MRI feedback control for intracavitary phased array hyperthermia treatments. Int. J. Hyperth. 1998, 14, 39–56. [Google Scholar] [CrossRef]
- Cheng, K.S.; Stakhursky, V.; Craciunescu, O.I.; Stauffer, P.; Dewhirst, M.; Das, S.K. Fast temperature optimization of multi-source hyperthermia applicators with reduced-order modeling of “virtual sources”. Phys. Med. Biol. 2008, 53, 1619–1635. [Google Scholar] [CrossRef] [PubMed][Green Version]
- Pacheco, C.C.; Orlande, H.R.B.; Colaço, M.J.; Dulikravich, G.S.; Varón, L.A.B.; Lamien, B. Real-time temperature estimation with enhanced spatial resolution during MR-guided hyperthermia therapy. Numer. Heat Transf. Part A Appl. 2020, 77, 782–806. [Google Scholar] [CrossRef]
- Stakhursky, V.L.; Arabe, O.; Cheng, K.S.; MacFall, J.; MacCarini, P.; Craciunescu, O.; Dewhirst, M.; Stauffer, P.; Das, S.K. Real-time MRI-guided hyperthermia treatment using a fast adaptive algorithm. Phys. Med. Biol. 2009, 54, 2131–2145. [Google Scholar] [CrossRef]
- Potocki, J.K.; Tharp, H.S. Concurrent hyperthermia estimation schemes based on extended kalman filtering and reduced-order modelling. Int. J. Hyperth. 1993, 9, 849–865. [Google Scholar] [CrossRef]
- Kowalski, M.E.; Jin, J.M. A temperature-based feedback control system for electromagnetic phased-array hyperthermia: Theory and simulation. Phys. Med. Biol. 2003, 48, 633–651. [Google Scholar] [CrossRef]
- Gellermann, J.; Weihrauch, M.; Cho, C.H.; Wlodarczyk, W.; Fähling, H.; Felix, R.; Budach, V.; Weiser, M.; Nadobny, J.; Wust, P. Comparison of MR-thermography and planning calculations in phantoms. Med. Phys. 2006, 33, 3912–3920. [Google Scholar] [CrossRef]
- Cline, H.E.; Hynynen, K.; Schneider, E.; Hardy, C.J.; Maier, S.E.; Watkins, R.D.; Jolesz, F.A. Simultaneous magnetic resonance phase and magnitude temperature maps in muscle. Magn. Reson. Med. 1996, 35, 309–315. [Google Scholar] [CrossRef] [PubMed]
- Unsoeld, M.; Lamprecht, U.; Traub, F.; Hermes, B.; Scharpf, M.; Potkrajcic, V.; Zips, D.; Paulsen, F.; Eckert, F. MR thermometry data correlate with pathological response for soft tissue sarcoma of the lower extremity in a single center analysis of prospectively registered patients. Cancers 2020, 12, 959. [Google Scholar] [CrossRef] [PubMed]
- Craciunescu, O.I.; Raaymakers, B.W.; Kotte, A.N.T.J.; Das, S.K.; Samulski, T.V.; Lagendijk, J.J.W. Discretizing large traceable vessels and using DE-MRI perfusion maps yields numerical temperature contours that match the MR non-invasive measurements. Med. Phys. 2001, 28, 2289–2296. [Google Scholar] [CrossRef] [PubMed]
- Poorman, M.E.; Braškutė, I.; Bartels, L.W.; Grissom, W.A. Multi-echo MR thermometry using iterative separation of baseline water and fat images. Physiol. Behav. 2016, 176, 139–148. [Google Scholar] [CrossRef] [PubMed]
- De Poorter, J.; De Wagter, C.; De Deene, Y.; Thomsen, C.; Ståhlberg, F.; Achten, E. Noninvasive MRI Thermometry with the Proton Resonance Frequency (PRF) Method: In Vivo Results in Human Muscle. Magn. Reson. Med. 1995, 33, 74–81. [Google Scholar] [CrossRef]
- Peters, R.D.; Hinks, R.S.; Henkelman, R.M. Ex vivo tissue-type independence in proton-resonance frequency shift MR thermometry. Magn. Reson. Med. 1998, 40, 454–459. [Google Scholar] [CrossRef]
- Quesson, B.; De Zwart, J.A.; Moonen, C.T.W. Magnetic resonance temperature imaging for guidance of thermotherapy. J. Magn. Reson. Imaging 2000, 12, 525–533. [Google Scholar] [CrossRef]
- Young, I.R.; Hajnal, J.V.; Roberts, I.G.; Ling, J.X.; Hill-cottingham, R.J.; Oatridge, A.; Wilson, J.A. An Evaluation of the Effects of Susceptibility Changes on the Water Chemical Shift Method of Temperature Measurement in Human Peripheral Muscle. Magn. Reson. Med. 1996, 36, 366–374. [Google Scholar] [CrossRef]
- Rieke, V.; Pauly, P.K.B. MR Thermometry Viola. North 2008, 29, 1883–1889. [Google Scholar]
- Numan, W.C.M.; Hofstetter, L.W.; Kotek, G.; Bakker, J.F.; Fiveland, E.W.; Houston, G.C.; Kudielka, G.; Yeo, D.T.B.; Paulides, M.M. Exploration of MR-guided head and neck hyperthermia by phantom testing of a modified prototype applicator for use with proton resonance frequency shift thermometry. Int. J. Hyperth. 2014, 30, 184–191. [Google Scholar] [CrossRef] [PubMed]
- Oberacker, E.; Kuehne, A.; Nadobny, J.; Zschaeck, S.; Weihrauch, M.; Waiczies, H.; Ghadjar, P.; Wust, P.; Niendorf, T.; Winter, L. Radiofrequency applicator concepts for simultaneous MR imaging and hyperthermia treatment of glioblastoma multiforme. Curr. Dir. Biomed. Eng. 2017, 3, 473–477. [Google Scholar] [CrossRef]
- Gellermann, J.; Wlodarczyk, W.; Hildebrandt, B.; Ganter, H.; Nicolau, A.; Rau, B.; Tilly, W.; Fähling, H.; Nadobny, J.; Felix, R.; et al. Non-invasive magnetic resonance thermography of recurrent rectal carcinoma in a 1.5 tesla hybrid system. Cancer Res. 2005, 65, 5872–5880. [Google Scholar] [CrossRef]
- Gellermann, J.; Hildebrandt, B.; Issels, R.; Ganter, H.; Wlodarczyk, W.; Budach, V.; Felix, R.; Tunn, P.U.; Reichardt, P.; Wust, P. Non-invasive magnetic resonance thermography of soft tissue sarcomas during regional hyperthermia: Correlation with response and direct thermometry. Cancer 2006, 107, 1373–1382. [Google Scholar] [CrossRef]
- Craciunescu, O.I.; Stauffer, P.R.; Soher, B.J.; Wyatt, C.R.; Arabe, O.; MacCarini, P.; Das, S.K.; Cheng, K.S.; Wong, T.Z.; Jones, E.L.; et al. Accuracy of real time non-invasive temperature measurements using magnetic resonance thermal imaging in patients treated for high grade extremity soft tissue sarcomas. Med. Phys. 2009, 36, 4848–4858. [Google Scholar] [CrossRef] [PubMed]
- Stauffer, P.R.; Craciunescu, O.I.; Maccarini, P.F.; Wyatt, C.; Arunachalam, K.; Arabe, O.; Stakhursky, V.; Soher, B.; MacFall, J.R.; Li, Z.; et al. Clinical utility of magnetic resonance thermal imaging (MRTI) for real-time guidance of deep hyperthermia. In Proceedings of the Energy-based Treatment of Tissue and Assessment V, San Jose, CA, USA, 24–29 January 2009; Volume 7181, p. 71810I. [Google Scholar]
- Dadakova, T.; Gellermann, J.; Voigt, O.; Korvink, J.G.; Pavlina, J.M.; Hennig, J.; Bock, M. Fast PRF-based MR thermometry using double-echo EPI: In vivo comparison in a clinical hyperthermia setting. Magn. Reson. Mater. Phys. Biol. Med. 2015, 28, 305–314. [Google Scholar] [CrossRef]
- Feddersen, T.V.; Hernandez-Tamames, J.A.; Franckena, M.; van Rhoon, G.C.; Paulides, M.M. Clinical performance and future potential of magnetic resonance thermometry in hyperthermia. Cancers 2021, 13, 1–19. [Google Scholar]
- Rijnen, Z.; Bakker, J.F.; Canters, R.A.M.; Togni, P.; Verduijn, G.M.; Levendag, P.C.; Van Rhoon, G.C.; Paulides, M.M. Clinical integration of software tool VEDO for adaptive and quantitative application of phased array hyperthermia in the head and neck. Int. J. Hyperth. 2013, 29, 181–193. [Google Scholar] [CrossRef]
- Canters, R.A.M.; Paulides, M.M.; Franckena, M.F.; Van Der Zee, J.; Van Rhoon, G.C. Implementation of treatment planning in the routine clinical procedure of regional hyperthermia treatment of cervical cancer: An overview and the Rotterdam experience. Int. J. Hyperth. 2012, 28, 570–581. [Google Scholar] [CrossRef] [PubMed]
- Winter, L.; Oberacker, E.; Paul, K.; Ji, Y.; Oezerdem, C.; Ghadjar, P.; Thieme, A.; Budach, V.; Wust, P.; Niendorf, T. Magnetic resonance thermometry: Methodology, pitfalls and practical solutions. Int. J. Hyperth. 2016, 32, 63–75. [Google Scholar] [CrossRef]
- Jaccard, P. The Distribution of the Flora in the Alpine Zone. New Phytol. 1912, 11, 37–50. [Google Scholar] [CrossRef]
- McGuinness, K.; O’Connor, N.E. A comparative evaluation of interactive segmentation algorithms. Pattern Recognit. 2010, 43, 434–444. [Google Scholar] [CrossRef]
- Niwattanakul, S.; Singthongchai, J.; Naenudorn, E.; Wanapu, S. Using of jaccard coefficient for keywords similarity. Lect. Notes Eng. Comput. Sci. 2013, 2202, 380–384. [Google Scholar]
- Metz, C.E.; Kronman, H.B. Statistical significance tests for binormal ROC curves. J. Math. Psychol. 1980, 22, 218–243. [Google Scholar] [CrossRef]
- Fan, J.; Upadhye, S.; Worster, A. Understanding receiver operating characteristic (ROC) curves. Can. J. Emerg. Med. 2006, 8, 19–20. [Google Scholar] [CrossRef] [PubMed]
- Kothapalli, S.V.V.N.; Altman, M.B.; Zhu, L.; Partanen, A.; Cheng, G.; Gach, H.M.; Straube, W.; Zoberi, I.; Hallahan, D.E.; Chen, H. Evaluation and selection of anatomic sites for magnetic resonance imaging-guided mild hyperthermia therapy: A healthy volunteer study. Int. J. Hyperth. 2018, 34, 1381–1389. [Google Scholar] [CrossRef]
- Hanley, J.A.; McNeil, B.J. The meaning and use of the area under a receiver operating characteristic (ROC) curve. Radiology 1982, 143, 29–36. [Google Scholar] [CrossRef]
- Mandrekar, J.N. Receiver operating characteristic curve in diagnostic test assessment. J. Thorac. Oncol. 2010, 5, 1315–1316. [Google Scholar] [CrossRef]
- Akobeng, A.K. Understanding diagnostic tests 3: Receiver operating characteristic curves. Acta Paediatr. Int. J. Paediatr. 2007, 96, 644–647. [Google Scholar] [CrossRef] [PubMed]
- Walther, B.A.; Moore, J.L. The concepts of bias, precision and accuracy, and their use in testing the performance of species richness estimators, with a literature review of estimator performance. Ecography 2005, 28, 815–829. [Google Scholar] [CrossRef]
- Miller, R.L.; Acton, C.; Fullerton, D.A.; Maltby, J. Analysis of Variance (ANOVA). In SPSS for Social Scientists; Campling, J., Ed.; Palgrave: London, UK, 2002. [Google Scholar] [CrossRef]
- Wang, P. Evaluation of MR thermometry with proton resonance frequency method at 7T. Quant. Imaging Med. Surg. 2017, 7, 259–266. [Google Scholar] [CrossRef] [PubMed]
- Canters, R.A.M.; Paulides, M.M.; Franckena, M.; Mens, J.W.; Van Rhoon, G.C. Benefit of replacing the Sigma-60 by the Sigma-Eye applicator: A Monte Carlo-based uncertainty analysis. Int. J. Radiat. Oncol. Biol. Phys. 2013, 189, 74–80. [Google Scholar] [CrossRef] [PubMed]
- Fatehi, D.; van der Zee, J.; de Bruijne, M.; Franckena, M.; van Rhoon, G.C. RF-power and temperature data analysis of 444 patients with primary cervical cancer: Deep hyperthermia using the Sigma-60 applicator is reproducible. Int. J. Hyperth. 2007, 23, 623–643. [Google Scholar] [CrossRef] [PubMed]
- Van Rhoon, G.C.; Van Der Heuvel, D.J.; Ameziane, A.; Rietveld, P.J.M.; Volenec, K.; Van Der Zee, J. Characterization of the SAR-distribution of the Sigma-60 applicator for regional hyperthermia using a Schottky diode sheet. Int. J. Hyperth. 2003, 19, 642–654. [Google Scholar] [CrossRef] [PubMed]
- Wu, M.; Mulder, H.T.; Baron, P.; Coello, E.; Menzel, M.I.; van Rhoon, G.C.; Haase, A. Correction of motion-induced susceptibility artifacts and B0 drift during proton resonance frequency shift-based MR thermometry in the pelvis with background field removal methods. Magn. Reson. Med. 2020, 84, 2495–2511. [Google Scholar] [CrossRef]
- De Denis Senneville, B.; Quesson, B.; Desbarats, P.; Salomir, R.; Palussière, J.; Moonen, C.T.W. Atlas-based motion correction for on-line MR temperature mapping. Proc. Int. Conf. Image Process. ICIP 2004, 4, 2571–2574. [Google Scholar]
- Yuan, J.; Mei, C.-S.; Panych, L.P.; McDannold, N.J.; Madore, B. Towards fast and accurate temperature mapping with proton resonance frequency-based MR thermometry. Quant. Imaging Med. Surg. 2012, 2, 21–32. [Google Scholar]
- Tanner, C.; Zur, Y.; French, K.; Samei, G.; Strehlow, J.; Sat, G.; McLeod, H.; Houston, G.; Kozerke, S.; Székely, G.; et al. In vivo validation of spatio-temporal liver motion prediction from motion tracked on MR thermometry images. Int. J. Comput. Assist. Radiol. Surg. 2016, 11, 1143–1152. [Google Scholar] [CrossRef]
- Celicanin, Z.; Auboiroux, V.; Bieri, O.; Petrusca, L.; Santini, F.; Viallon, M.; Scheffler, K.; Salomir, R. Real-time method for motion-compensated MR thermometry and MRgHIFU treatment in abdominal organs. Magn. Reson. Med. 2014, 72, 1087–1095. [Google Scholar] [CrossRef]
- De Senneville, B.D.; Roujol, S.; Moonen, C.; Ries, M. Motion correction in MR thermometry of abdominal organs: A comparison of the referenceless vs. the multibaseline approach. Magn. Reson. Med. 2010, 64, 1373–1381. [Google Scholar] [CrossRef]
- De Senneville, B.D.; Desbarats, P.; Salomir, R.; Quesson, B.; Moonen, C.T.W. Correction of accidental patient motion for online Mr thermometry. In Proceedings of the 7th International Conference on Medical Image Computing and Computer-Assisted Intervention (MICCAI 2004), Saint-Malo, France, 26–29 September 2004; pp. 637–644. [Google Scholar]
- Todd, N.; Diakite, M.; Payne, A.; Parker, D.L. In vivo evaluation of multi-echo hybrid PRF/T1 approach for temperature monitoring during breast MR-guided focused ultrasound surgery treatments. Magn. Reson. Med. 2014, 72, 793–799. [Google Scholar] [CrossRef]
- Nakagawa, Y.; Kokuryo, D.; Kaihara, T.; Fujii, N.; Kumamoto, E. Image reconstruction method with compressed sensing for high-speed MR temperature measurement of abdominal organs. In Proceedings of the 41st Annual International Conference of the IEEE Engineering in Medicine and Biology Society (EMBC), Berlin, Germany, 23–27 July 2019; pp. 2731–2735. [Google Scholar]
- Poorter, J. De Noninvasive MRI thermometry with the proton resonance frequency method: Study of susceptibility effects. Magn. Reson. Med. 1995, 34, 359–367. [Google Scholar] [CrossRef] [PubMed]
- Gaur, P.; Partanen, A.; Werner, B.; Ghanouni, P.; Bitton, R.; Butts Pauly, K.; Grissom, W.A. Correcting heat-induced chemical shift distortions in proton resonance frequency-shift thermometry. Magn. Reson. Med. 2016, 76, 172–182. [Google Scholar] [CrossRef] [PubMed]


Publisher’s Note: MDPI stays neutral with regard to jurisdictional claims in published maps and institutional affiliations. |
© 2021 by the authors. Licensee MDPI, Basel, Switzerland. This article is an open access article distributed under the terms and conditions of the Creative Commons Attribution (CC BY) license (https://creativecommons.org/licenses/by/4.0/).