1. Introduction
Pancreatic ductal adenocarcinoma (PDAC) is an aggressive malignancy with a very poor prognosis [
1]. Standardized therapies such as surgery, chemo- and radiotherapy have failed to cure this cancer in a great majority of patients. The mean 5-year survival of patients is less than 10% [
2]. There is, therefore, an urgent need to develop more effective therapeutic strategies for the treatment of pancreatic cancer.
Strong desmoplasia is a hallmark of pancreatic cancer [
3], which can expand to more than 70% of the tumor tissues [
4]. It has been well established that the tumor stroma plays an important role in the biology of this malignant disease. While the stroma in PDAC has a tumor-promoting effect owing to the activation of tumor cell invasion and metastasis [
3,
5], in contrast, depletion of tumor stroma can accelerate tumor progression owing to the loss of differentiation, induction of hypoxia, epithelial-to-mesenchymal transition, and the promotion of cancer stem cells [
6].
T-cell movement through the three-dimensional (3D) extracellular matrix (ECM) occurs via a process of amoeboid-like migration [
7]. It is driven by chemokines and is characterized by adaptive morphology, vigorous shape change, crawling along collagen fibrils (contact guidance), and squeezing through pre-existing matrix gaps [
8,
9]. In contrast to migration across two-dimensional (2D) substrates, it is usually independent of the interaction with integrins and matrix metalloproteinases [
9,
10]. Although 3D ECM creates a scaffold that supports 3D T-cell migration, a dense ECM fiber network can form non-permissive regions that exclude T-cell entrance. Such regions were demonstrated in the stroma of some human tumor types and have been proposed to weaken the local immune response [
11,
12]. Further, PDAC induces a cellular immune response [
13,
14]. Although direct contact between T-cells and tumor cells is important for prognosis [
15], tumor-infiltrating T-cells do not reach tumor cells in sufficient numbers and can mainly be found in the tumor stroma at a distance from tumor cells [
16,
17].
Our previous study investigated the mechanisms controlling intratumoral T-cell migration in PDAC in terms of chemokines and contact guidance and determined whether and how these mechanisms contribute to immune evasion of pancreatic cancer [
18]. Additionally, PDAC overproduced several T-cell-active chemokines, but their levels did not correlate with intratumoral T-cell infiltration [
18]. Collagen itself promoted the high migratory activity of T-cells, but completely abolished chemokine-guided movement [
18].
Generally, fibrillar collagen is highly abundant in the stroma of pancreatic cancer [
4,
19,
20]. The local structure of collagen organization is the result of complex physiological processes, which include the activity of collagen-producing and -remodeling cells [
21,
22] and physical factors such as interstitial flow, spatial movement, and expansion of proliferating cellular components [
23,
24]. Several features such as fiber diameter, length, straightness, alignment (parallelism degree of single fibers), and spatial orientation to cellular structures as well as collagen density define the mechanical properties of the collagen network and potentially influence the movement of stromal cells.
It has previously been shown that the alignment of collagen fibers is an important factor that controls the contact guidance of tumor cells [
25,
26]. In the stroma of human tumors, several patterns of collagen alignment have been recognized and proposed to promote tumor cell migration and invasion [
27,
28,
29]. Previous studies have mainly addressed the effects of collagen alignment on tumor cells, with little focus so far being paid to T-cells. In contrast to tumor cells, migrating lymphocytes use short-lived, poorly adhesive cell–substrate interactions and do not degrade or reorganize the extracellular matrix, but rather slip through and along existing tissue gaps and trails [
30,
31]. Consistent with this fact, it can be proposed that collagen organization may influence T-cell migration and potentially contribute to stromal T-cell distribution. In the context of the emerging role of cancer immunotherapy, an examination of this hypothesis could have a high translational relevance, as the stroma is the microenvironmental factor that participates in local T-cell immune responses in pancreatic cancer [
32]. An examination of the above hypothesis would help us to better understand the T-cell immune response, depending on the individual spatial and cellular organization of the tumor stroma. Furthermore, several previous studies have suggested stroma remodeling or stroma destruction for potential tumor treatment strategies [
3,
33]. An examination of the above hypothesis would provide important information that could support the rationale for these strategies.
In the present study, we defined individual stroma regions in PDAC patients based on the fibrillar collagen network. Subsequently, the newly established procedure of image processing and analysis enabled, for the first time, the generation of tailored data on collagen organization and T-cell distribution in two individually defined PDAC regions.
2. Material and Methods
2.1. Patients and Tissue Samples
Tissue samples of the normal pancreas, chronic pancreatitis, PDAC, and ACC were obtained from the tissue collection (PancoBank) of the European Pancreatic Center (EPZ), University of Heidelberg. Patients admitted to the study were undergoing surgery for pancreatic diseases in the Department of Surgery at the University of Heidelberg. The protocol was approved by the local ethics committee and informed consent was obtained according to the Helsinki declaration. Tissue samples were snap-frozen and stored in liquid nitrogen. Hematoxylin and eosin staining of 7 µm slides was performed using Meyer’s hemalaun (Merck, Darmstadt, Germany) and Eosin G (Carl Roth, Karlsruhe, Germany). The histological diagnosis and grading of single tumor samples were performed by a specialist in pancreatic pathology (F.B.). The tumor cellularity of PDAC samples was analyzed as previously described [
4]. It was defined as high (>30%) or low (≤30%) and was studied microscopically by subjective assessment of tumor cell fraction on histological slides (evaluated by E.R.). The tissue sample information is summarized in
Table S1.
2.2. Immunofluorescence Staining
All histological and immunofluorescence stainings were performed using filtered particle-free solutions and under sterile conditions, which ensured that optical artefacts did not appear in the tissue slides. For immunohistochemistry, 7 or 100 µm (for 3D reconstruction) acetone-fixed cryosections were pre-blocked using 20% goat serum (Agilent, Santa Clara, CA, USA) for 30 min and stained using rabbit anti-human Cytokeratin 7 (CK7, 50 ng/mL, clone EPR17978, Alexa Fluor 488-conjugated; Abcam, Cambridge, UK) and mouse anti-human CD3 (10 µg/mL, clone HIT3A; Biolegend, San Diego, CA, USA) followed by Alexa Fluor 568-conjugated secondary anti-mouse IgG (dilution 1 ÷ 200, Abcam). All incubations of labeled antibodies were performed in the dark for 1 h at room temperature. The staining procedures of 7 and 100 µm tissue slides were identical. Respective isotypic antibodies (Biolegend) were used as controls for immunofluorescence staining.
2.3. Multiphoton and Second Harmonic Generation (SHG) Microscopy
A TriM Scope 2-photon microscope (LaVision BioTec, Bielefeld, Germany) mounted on a Nikon FN-1 upright stand (Nikon Instruments, Düsseldorf, Germany) and equipped with a water-dipping 16× NA 0.8 long working distance objective (Nikon Instruments, Düsseldorf, Germany) was used. The excitation was carried out with a Chameleon Ultra II femtosecond titan:sapphire laser (Coherent, Dieburg, Germany) (80 MHz, 730–1050 nm) at 800 nm for collagen and 940 nm for Alexa Fluor 488-labeled epithelial cells and 850 nm for Alexa Fluor 568-labeled T-cells. The forward SHG signal of the collagen fibers was detected with a 405/10 nm bandpass filter. The emission of the labeled tumor clusters was detected at 525/50 nm and the emission of the labeled T-cells at 605/50 nm. Individual images of 625 µm × 625 µm (1611 px × 1611 px; 0.39 µm/px) were acquired with a 20% overlap between images. The interval between Z-stack images was set on 1.0 μm. Three-dimensional reconstructions of stitched stacks were created using arivis Vision4D software (arivis AG, Munich, Germany).
2.4. Pre-Processing and Computerized Analysis of Multiphoton and SHG Images
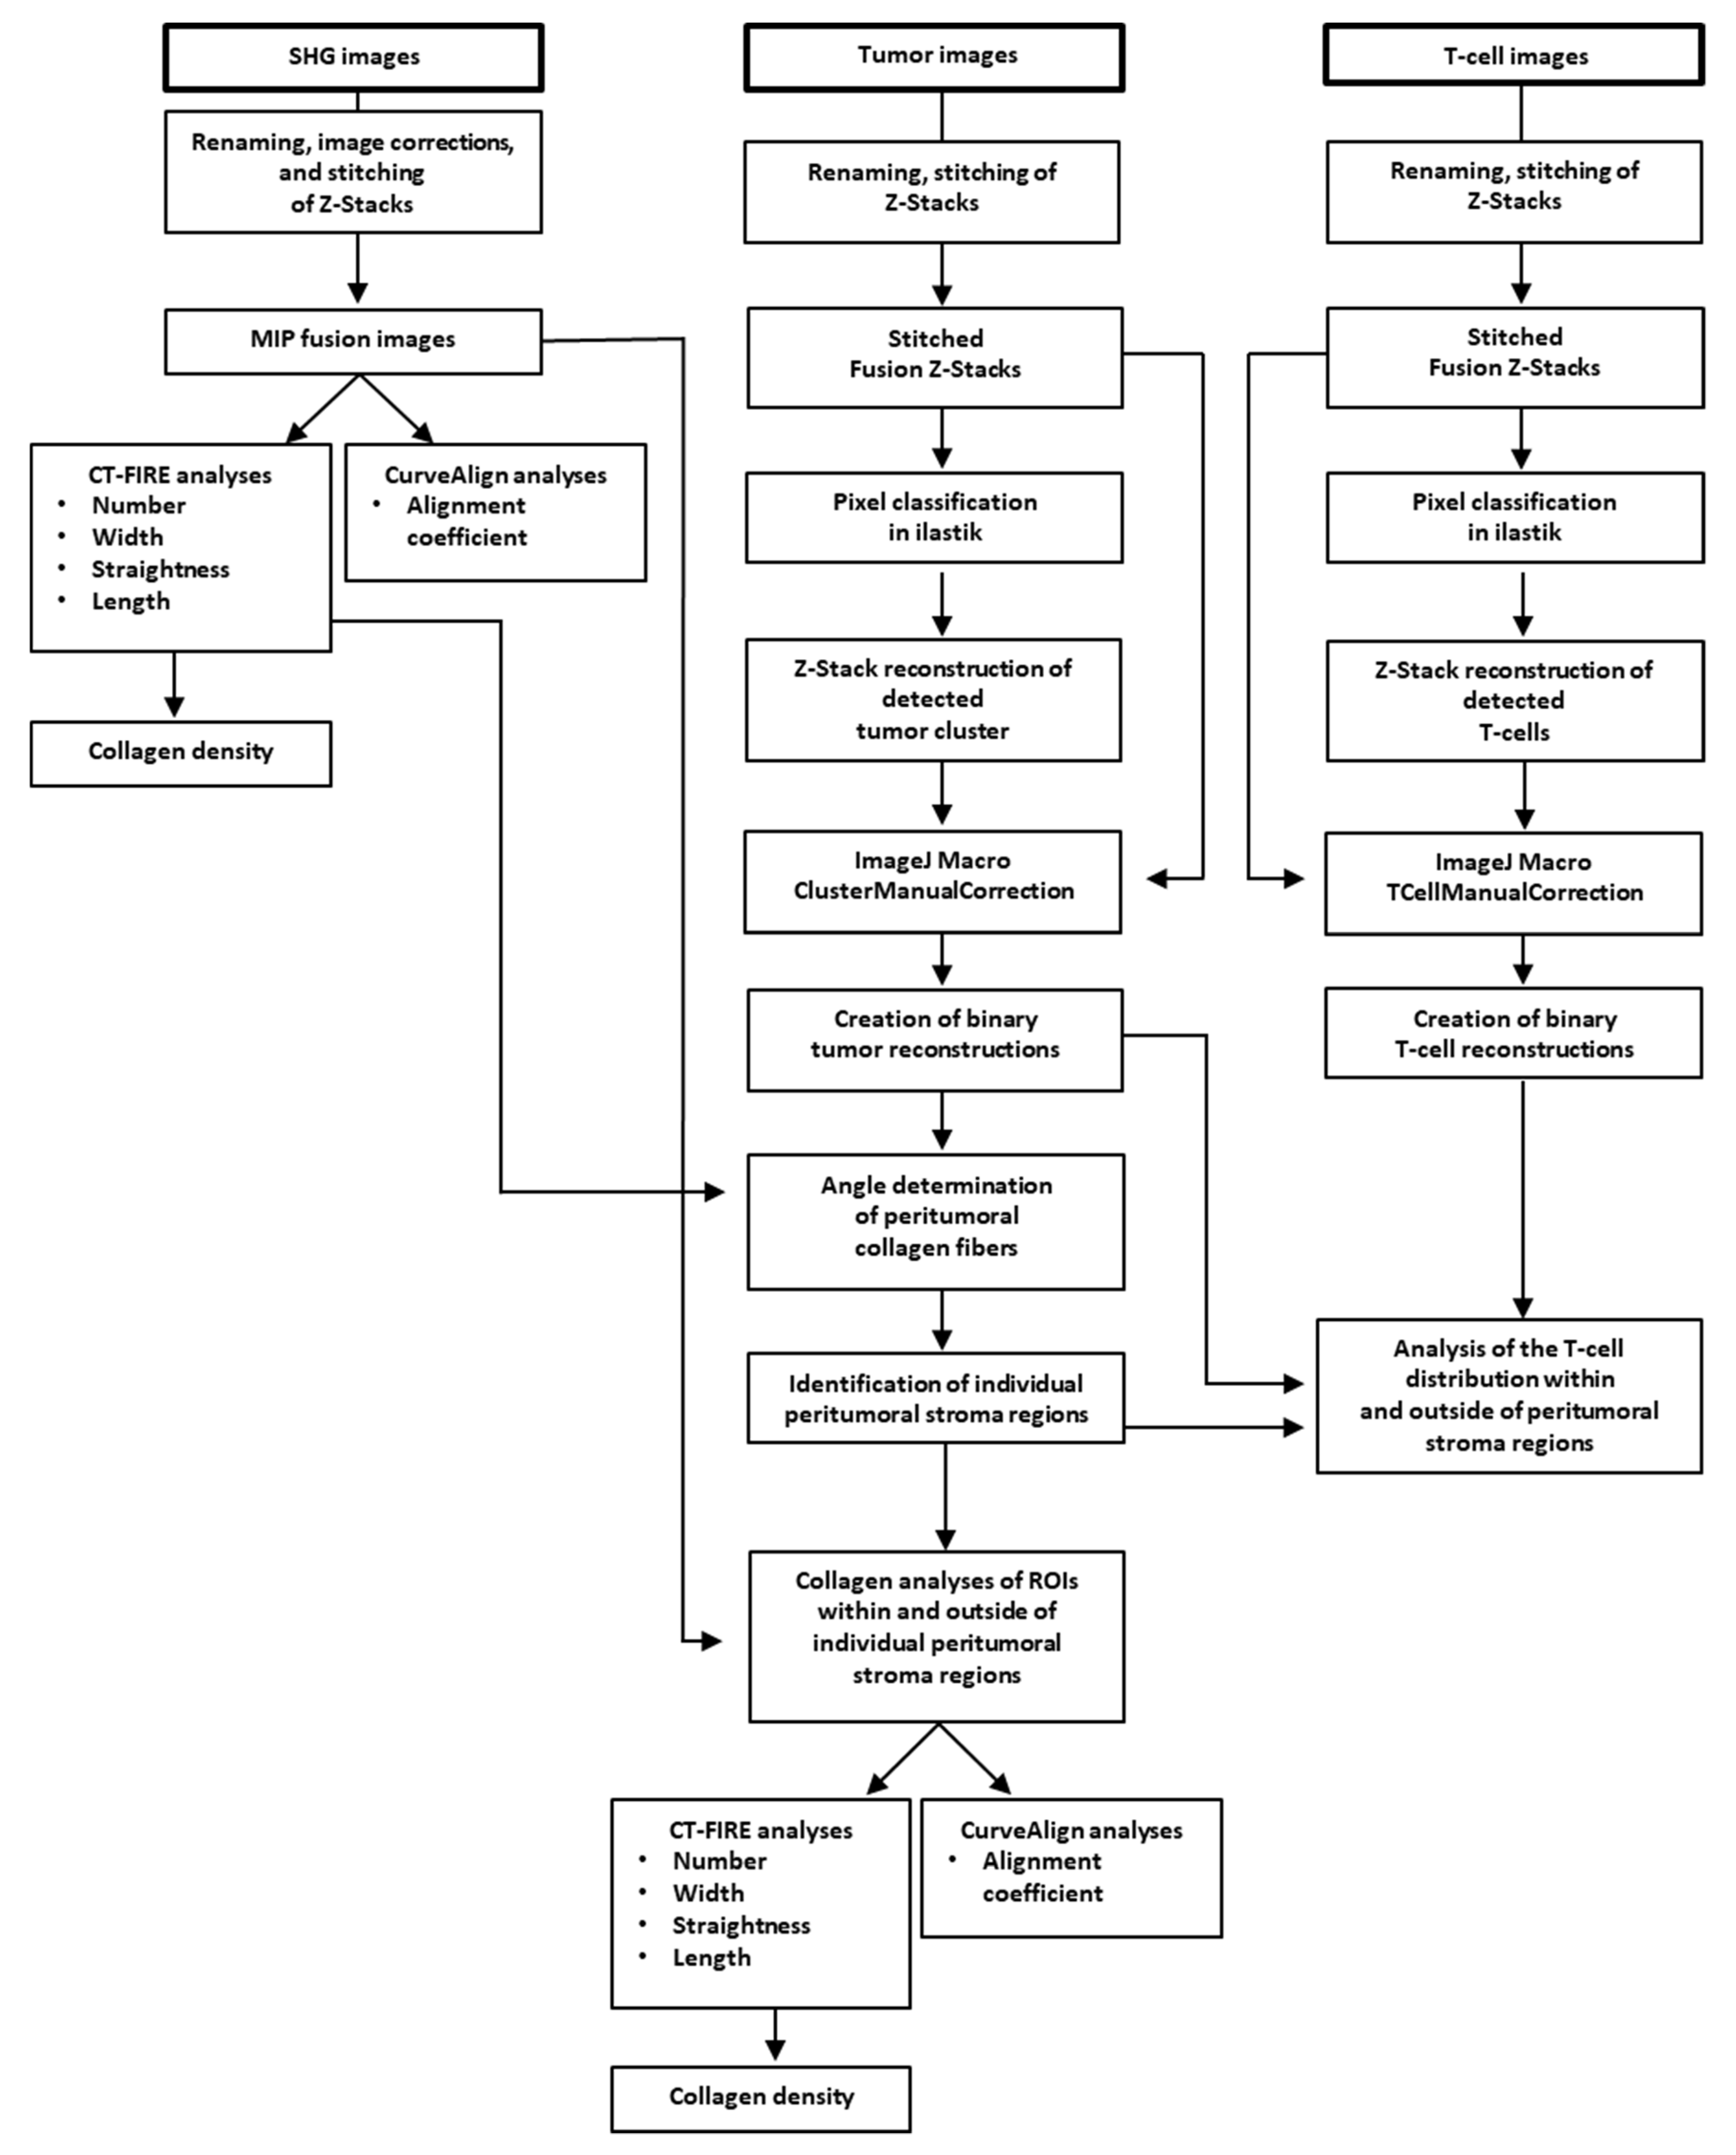
2.4.1. Segmentation of SHG and Multiphoton Images, CT-FIRE, and CurveAlign
Image files of SHG, tumor, and T-cell images were renamed (macro RenameInputFile) in ImageJ plugin (NIH, Bethesda, MD, USA) and images were stitched (macro StitchingData) to create fused maximum intensity projection (MIP) images as well as fused Z-stacks. Prior to quantification of the collagen fibers, fused SHG MIP images were transformed into 8-bit images and adjusted using threshold between 10 and 255 gray levels to eliminate background noise. CT-FIRE and CurveAlign (LOCI, Madison, WI, USA) were run on fused MIP images according to the manufacturer’s instructions to calculate the collagen fiber parameters: length, number, straightness, and width (CT-FIRE V1.3); fiber alignment (CurveAlign V3.0), as previously described [
34,
35]. Fiber density was calculated by number of fibers per image area. The procedure is summarized in the workflow chart from
Figure 1.
Tumor cluster and T-cell segmentation was performed using a combination of the pixel classification workflow based on the machine-learning image analysis (ilastik) [
36] and ImageJ. The pixel classification workflow was used to enhance the foreground pixel and remove the background. Raw z-stacks of the tumor and T-cell images were used as input to train the pixel classification workflow. The ilastik machine-learning classifier was trained individually by creating for each single channel a pixel classification project. The training was performed on cropped (XY) images from different patients and applied by batch processing on the entire dataset of images. For those patients for whom the prediction did not match the training expectation, a new training session was performed by retraining the existing ilastik project with cropping (XY) of the problematic data or by creating a new ilastik pixel classification project trained on these images alone. The foreground probability map generated by ilastik for each input stack was processed in ImageJ. The binary masks of tumors and T-cells were extracted from the MIP and used further in the analysis (macros SegmentTumorCluster_ilastik.ijm, ManualClusterCorrection_ilastik.ijm, SegmentTCellAndManualCorrection_ilastik.ijm). For T-cells, a virtual particle filter was used, which eliminated all (non-cellular) particles below 25 pixels
2. Indeed, the binary tumor MIP were used for the individual collagen analysis in the tumor microenvironment and the binary MIP of the T-cells for the individual T-cell distribution analysis inside and outside the peritumoral stroma regions of PDAC samples. The analysis steps are summarized in the ImageJ macros code (
https://github.com/cberri/Kamionka_et_al-2020) and in the
Table S2.
2.4.2. Definition of the Individual Peritumoral PDAC Stroma Regions
Images of tumor masks were generated by manually reconstructing the tumor clusters in fused SHG–MIP images using CurveAlign V4.0. The mean collagen fiber length in the PDAC samples was calculated to be 22.4 µm using CT-FIRE V1.3. Using these tumor mask images in combination with the previously generated CT-FIRE results of the average collagen fiber length in PDAC, a detailed, individual description of collagen in the PDAC microenvironment of twelve (see 4.4) selected PDAC tissues samples was generated.
The mean fiber length (22.4 µm) was used as the interval by which the distance to microscopic tumor borderline was segmented. The analysis was performed in an individual area up to a maximal distance of 246.4 µm (eleven segments/areas of 22.4 µm). In these eleven areas, the angular distribution of the collagen fibers was analyzed and the relative fraction (R) of fibers having an angular range from 0° to 15° (aligned parallel to tumor cell borderline) was calculated. The ratio between individual R values and the mean (plateaued) R value from five distant areas (
) was calculated using the formula:
and was used for the definition of the extension of individual stroma regions. The areas showing a change in collagen orientation of at least 5% (ratio > 0.05) were assigned as tumor-distant stroma regions. If the ratio was <0.05, the area was assigned as a peritumoral stroma region. The determination of the above stroma regions is illustrated in Figure 6B.
2.4.3. Detailed Analysis of Collagen and T-Cells in Different PDAC Stroma Regions
For gross analysis of T-cell infiltration, the local density of CD3+ T-cells was assessed semi-quantitatively by a primary investigator (E.M.K) using the scale: 0 = absent, 1 = low, 2 = moderate, 3 = high, and 4 = very high infiltration, as previously described [
18] (
Figure S1D). PDAC G1 tumors were not considered for further comparative analysis of T-cell infiltration because of low sample number.
After identification of the expansion of individual peritumoral stroma regions, peritumoral and tumor-cell-distant ROIs of binary images of T-cell reconstructions were generated in ImageJ (macro DrawRectangularROIs). The number of generated ROIs varied between 2 and 12 for both peritumoral and tumor-cell-distant ROIs per SHG image. The size of the generated ROIs corresponded to the X and Y dimensions of the individual peritumoral stroma region. The collagen fibers of the individual ROIs were analyzed using CT-FIRE and CurveAlign and the mean values of the five collagen parameters were determined for each PDAC tissue. The T-cell area in each ROI was measured in ImageJ in an automated way.
2.4.4. T-Cell Distribution in PDAC Stroma
PDAC specimens showing distinct T-cell infiltration were used for the analysis. The total time required for analysis of single images was very different. Twelve images (12 different patients) requiring the lowest time for image processing were selected for the analysis.
The areas of the individual peritumoral stroma regions of PDAC images and the areas of the tumor clusters in the peritumoral and tumor-cell-distant stroma regions were determined in ImageJ. In the binary images of T-cell reconstructions, the total area of CD3+ T-cells per image and the area of CD3+ T-cells inside and outside the individual peritumoral stroma regions were determined. The T-cell coefficients and T-cell densities of the two PDAC stroma regions were calculated using the four formulas below:
2.5. Cell Culture and Activation of PBMLs
Isolated peripheral blood mononuclear leukocytes (PBMLs) were isolated from the human blood of healthy donors using density gradient centrifugation with Biocoll (Biochrom GmbB, Germany). The cells were routinely cultivated in RPMI 1640 (cc-pro, Oberdorla, Germany) supplemented with 10% fetal calf serum (FCS) (cc-pro), 2 mM L-glutamine, 20 U/mL penicillin, 0.1 mg/mL streptomycin (cc-pro), 1 mM sodium pyruvate (Biochrom AG, Berlin, Germany), and 0.05 mM β–mercaptoethanol (Life Technologies, Darmstadt, Germany) at 37 °C in a humidified atmosphere with 5% CO2.
For activation, PBMLs were stimulated with 12.5 µg/mL Concanavalin A (Calbiochem, Darmstadt, Germany) and 50 U/mL interleukin-2 (IL-2) (PeproTech, Hamburg, Germany) for day 1, and further with IL-2 for days 2–6. The activated cells were collected and used on day 6. To obtain the CD3+ population, mainly consisting of T-cells, the cells were labeled with PE-conjugated anti-CD3 mAb (clone HIT3a, BD Biosciences, Heidelberg, Germany) and isotypic mAb (clone G155-178, BD) was used as a control. The percentage of CD3+ cells was determined using a flow cytometer (FACS Canto II, BD Biosciences, Heidelberg, Germany) and FlowJo V.10.1 software (LLC, Ashland, OR, USA). The fraction of CD3+ cells was 70–80% (
Figure S1C).
2.6. T-Cell Migration in Collagen Matrix with Various Alignments
For Boyden chamber assays, phenol red-free RPMI medium (MP Biomedicals, Solon, USA) supplemented with 1 mM sodium pyruvate (Biochrom, Berlin, Germany), 0.03 mM bovine serum albumin (fraction V, Carl Roth), 2 mM L-glutamine, 20 U/mL penicillin, 0.1 mg/mL streptomycin (cc-pro), and 0.05 mM 2-mercaptoethanol (Life Technologies) was used. The cells were labeled for 45 min at 37 °C with 4 µM calcein AM (Santa-Cruz, Dallas, TX, USA) and seeded in the upper wells (1 × 10⁵/well) of HTS Transwell-96 plates (Corning, Kaiserslautern, Germany). Migration was stimulated using 0–10,000 ng/mL SDF-1α, MIP-1β, or IP-10 (all from PeproTech) and measured after 3 h as fluorescence intensity in the lower wells using a spectrofluorimeter (FLUOstar OPTIMA, BMG Labtech, Ortenberg, Germany). This experiment was repeated four times.
For the 3D collagen matrix, T-cells were fluorescently labeled using mouse anti-human CD3 (clone HIT3A, Biolegend) followed by Alexa Fluor 568-conjugated secondary anti-mouse IgG (Abcam). Approximately 1 × 10
6 CD3+ T-cells were dissolved in a 200 μL solution consisting of concentrated RPMI-1640 medium (Sigma-Aldrich, Steinheim, Germany), supplemented with bovine serum albumin fraction V (BSA, Carl Roth) and 4-(2-hydroxyethyl)-1-piperazineethanesulfonic acid (HEPES, Carl Roth), 0.34 M sodium hydroxide, FITC-conjugated bovine collagen type I (Sigma-Aldrich), rat collagen type I (collagen R, 0.2% solution, Serva, Heidelberg, Germany), and magnetic beads (∅1 µm, chemicell, Berlin, Germany or ThermoFisher Scientific, Walham, MA, USA) (
Table S3). The final collagen concentration was 0.95 or 1.5 mg/mL. The microfluidic chamber (μ-Slide VI, Ibidi, Martinsried, Germany) was filled with 90 μL/channel of the collagen/T-cell suspension. Additionally, SDF-1α (100 ng/mL), MIP-1β (100 ng/mL), or IP-10 (500 ng/mL) was added to some channels. The alignment of the fibers in the collagen matrices was achieved by generating a magnetic field using a cylindrical magnet (Conrad Electronics, Hirschau, Germany or Magnetladen GmbH, Schlangen, Germany) for 5 min each. The local magnetic flux density (4 mm distance from the magnet) was measured using Teslameter (CYHT208, ChenYang Technologies, Finsing, Germany) and was 45.5 and 50.0 mT for preparation of 0.95 and 1.5 mg/mL collagen, respectively. The collagen with T-cell suspension was polymerized at 37 °C and 5% CO
2 atmosphere.
For the recordings of the collagen matrices as well as the time-lapse videos of the T-cells, the Nikon A1R confocal microscope (Nikon Instruments, Düsseldorf, Germany) with a 20× immersion-free objective (Nikon, Plan Apo λ NA 0.75) was used. For imaging, the microfluidic chamber was placed into the temperature-controlled (37 °C) chamber (Tokai Hit, Shizuoka, Japan). Fluorescent collagens and T-cells were detected using excitations of 488 and 525 nm, and emissions of 525 and 595 nm, respectively. Time-lapse recording (2 images/min) of four neighboring fields (total surface 1.4 mm2) was performed for 30 min. The experiments were repeated six times, from which the data of T-cell migration without SDF-1α (22 or 23 channels for 0.95 or 1.5 mg/mL collagen, respectively) and with SDF-1α (18 or 22 channels for 0.95 or 1.5 mg/mL collagen, respectively) were collected.
Time-lapse sequences were analyzed using ImageJ. The customized plugin Manual Tracking was used to determine the migration trajectories of single T-cells. The T-cell velocity was analyzed using the Chemotaxis and Migration software tool (Ibidi). The axial orientation of T-cell migration was measured as an integral value from single steps of individual T-cell trajectories. CT-FIRE and CurveAlign were run on fused confocal images to describe the collagen parameter in the in vitro model. Dependent on the local alignment coefficient, the collagen matrix was assigned to one of three groups: non-aligned, partially aligned, or aligned collagen (alignment coefficient <0.40, 0.40–0.60, or >0.60, respectively).
2.7. Statistics
Statistical analysis was performed using the SPSS software (IBM, New York, NY, USA). The alignment coefficient of collagen fibers in the pancreatic tissue was compared using the t-test and Bonferroni–Holm correction. Differences in individual collagen parameters (alignment coefficient, length, diameter, straightness coefficient, and density) between different groups were compared using the Mann–Whitney U test and Bonferroni–Holm correction. A value of p < 0.05 was considered significant. Pearson’s correlation coefficient (r) was used to measure the strength of linear association between T-cell density and parameters of collagen organization in tissue as well as between collagen alignment and axial orientation of T-cell migration in vitro.
4. Discussion
In the present study, the collagen organization in normal pancreas, chronic pancreatitis, and pancreatic cancer and its potential influence on the distribution of infiltrating T-cells was investigated. Two features of collagen organization, mean fiber diameter and straightness, were at the same range between different tissue types and also showed low individual deviations. The mean fiber length was also at the same range, although single fibers were very long. Because there were no differences, the above-mentioned parameters can hardly be expected to change T-cell migration. Other features, such as collagen density, alignment, and spatial orientation, showed higher individual heterogeneity and are discussed below.
In a normal pancreas tissue, the stroma is formed during body growth and no significant remodeling is expected under healthy conditions. Therefore, stromal collagen in a normal pancreas displays a well-aligned and generally homogeneous structure of any determined parameters. Chronic pancreatitis showed the same homogeneous collagen organization as a normal pancreas. The microenvironmental changes in chronic pancreatitis develop slowly and, therefore, the collagen network in progressing fibrosis follows the same organization patterns as in the normal pancreas.
In contrast to the normal pancreas, pancreatic cancer (PDAC and ACC) showed very heterogeneous patterns of collagen organization, although some common principles have also been found. Both PDAC and ACC may be considered as dynamic systems with continuously changing microenvironments, including spatial extension and active ECM production and remodeling. As expected, it had consequences for the collagen organization and resulted in an inhomogeneous collagen presentation, especially for fiber length, collagen density, and alignment. All these parameters could be important as a mechanical barrier for leukocytes; however, no significant differences in mean values between the normal pancreas, chronic pancreatitis, and pancreatic cancer were found. The only significantly increased collagen alignment observed was in chronic pancreatitis and may be the result of the high collagen productivity of cells in the fibrotic tissues.
A group of PDAC samples showed a ubiquitous collagen organization, whereas other samples showed highly individual patterns. It could only reflect the inhomogeneity of local microenvironmental conditions (see above) influencing collagen production.
Previous studies have analyzed the prognostic relevance of collagen organization and related it to changes in tumor invasion; in PDAC, high collagen alignment has been shown to be a negative prognostic factor [
28]. Increased collagen fiber width is a negative prognostic factor in gastric cancer [
29]. It has also been shown that the orientation of collagen bundles perpendicular to the tumor boundary (so called “TACS-3 signature”) facilitates local tumor invasion and represents a prognostic factor in human breast cancer [
37,
38]. This signature is of functional relevance to tumor cell invasion in breast cancer, but is not universal for other cancer types. Furthermore, in contrast to renal cell carcinoma [
39], stromal collagen organization was not different in tumors of different grades of differentiation.
Previous studies have established that pancreatic cancer induces T-cell immune responses; however, infiltrating T-cells are mainly “trapped” in the tumor stroma [
16]. This definition was obtained using a steady-state view on histological slides. In the present study, we also found that a majority of the infiltrating T-cells were identified in the stroma and did not establish direct contact with the tumor cells. However, as it has been shown in a model of pancreatic cancer, intrastromal T-cells are actually actively migrating [
40]. Therefore, the term “trapping”, that might mean “immobilization”, is not appropriate because it does not reflect the actual dynamic of T-cell behavior.
Among the different parameters of collagen organization, collagen alignment and its directional orientation were proposed to be important factors that could guide T-cell migration and distribution. In the present study, only the specific angular ranges of collagen fibers were dependent on the distance to the tumor stroma border by which peritumoral and tumor-cell-distant stroma regions were determined. We propose that this difference can mainly be caused by stroma compression through the spatial expansion of tumor cells. Interestingly, no relationship was found between the T-cell densities in the peritumoral and tumor-cell-distant stroma regions. It demonstrates that the spatial orientation of collagen did not change T-cell distribution in the stroma of pancreatic cancer.
T-cell migration was also analyzed in differently aligned and differently dense collagens in an in vitro model. Although the phenotype of in vitro activated T-cells is different to that of tumor-infiltrating lymphocytes, this model could be representative of studies of the mechanical interaction between aligned collagen fibers and migrating T-cells. The rigid nucleus defines the smallest size of gaps or pores that can be breached by T-cells during migration [
30,
41]. The final structure and porosity of the matrix are dependent on several factors, including the origin of the collagen, its concentration, and the temperature of the polymerization process [
30]. As shown in our previous study, 1.5 mg/mL collagen strongly inhibited the entrance of T-cells into the matrix, whereas collagen at a lower concentration (1 mg/mL) supported the effective invasion of migrating T-cells [
18]. In the present study, no relationship was found between the angular orientation of T-cell migration and collagen alignment both in soft and dense collagen matrices. Although chemokines (SDF-1α, IP-10, and MIP-1β) strongly attracted T-cells in a collagen-free system, they showed no effect on the velocity and orientation of T-cell migration in the collagen matrix. These results are consistent with data from a previous study, which demonstrated that collagen alignment guides the direction of mesenchymal, but not of amoeboid-like cell migration [
42].
Recently, Pruitt et al. reported a study on the guidance of activated T-cells by aligned collagen [
43]. In this study, the authors prepared the matrix from collagen solution which was allowed to nucleate (to polymerize) for 2 h on ice and injected into the narrow microfluidic channel [
43]. Because polymerized collagen matrix is very fragile [
44], any further handling such as injection damages the integrity of the collagen network and may produce collagen gel with a ruptured structure. This could also be the reason why T-cell migration was observed even in very dense collagen gels (3 mg/mL), which are usually unbreachable by T-cells [
30]. We believe that a more appropriate model was used in the present study because collagen polymerization occurred simultaneously with collagen alignment.
Finally, the present study described the unique workflow, which included a complex of histological, microscopic, and image processing operations. The above operation algorithm enabled a more accurate analysis of pancreatic stroma collagen organization compared to the ones reported in any previous studies [
45,
46]. The workflow includes the processing of SHG images and analysis of collagen parameters using the ImageJ, CT-FIRE, and CurveAlign tools. This procedure has been previously described and utilized in numerous studies for the quantification of collagen organization [
28,
29,
39]. On the other hand, machine-learning-based bioimage analysis (ilastik) [
36] was used for pixel classification and segmentation of tumor clusters and T-cell areas and was additionally supported by several self-generated macro tools. This part of the workflow was created specifically for the aims of the present study. As shown in the present study, the procedure was applicable at different micro-regional levels, such as analysis of the whole slide surface, identification and analysis of the total surface in peritumoral and tumor-cell-distant stroma regions, and detailed analysis of selected regions of interest (ROIs). Furthermore, it excluded the majority of optical- and processing-related artefacts and enabled a very exact quantitation of T-cell infiltration using the determination of local T-cell areas, the calculation of T-cell density, and T-cell coefficient. The computer-aided determination of T-cell areas is superior for the exact calculation of T-cell density and can be used even for very dense T-cell infiltrates in which the precise counting of single T-cells would be almost unachievable. The present workflow provides a much more accurate analysis of collagen density in relation to tumor and T-cell area than the gross method reported in our previous study [
18]. This study did not confirm the significance of collagen density for specific T-cell distributions in the stroma of pancreatic cancer.
The low number of tissue samples could be a limitation of the present study; however, the total PDAC cohort (n = 32) should be sufficient for the characterization of collagen organization in this tumor type. Despite the use of machine-learning-based bioimage analysis, the workflow part of pixel classification and area analysis was a time- and resource-consuming procedure that in the present study could only be performed on a limited sample number. Nevertheless, the final number (n = 12) provided the information with the highest accuracy, and the data were conclusive for the described analyses.
To summarize, in contrast with migrating tumor cells, collagen alignment does not force T-cells into directional migration, nor does it influence intratumoral T-cell distribution. From this point of view, the results of the present study do not support the rationale of remodeling of stroma collagen organization for improvement of direct T-cell–tumor cell contact in PDAC. The proposed tissue and image processing and analysis workflow may represent an excellent tool for the measurement of individual collagen organization in cancer patients.


 ,
, 
