Article

Mutations in Epigenetic Regulation Genes in Gastric Cancer

by
Marina V. Nemtsova
1,2,
Alexey I. Kalinkin
2,
Ekaterina B. Kuznetsova
1,2,
Irina V. Bure
1,
Ekaterina A. Alekseeva
1,2,
Igor I. Bykov
3,
Tatiana V. Khorobrykh
3,
Dmitry S. Mikhaylenko
1,2,
Alexander S. Tanas
2 and
Vladimir V. Strelnikov
2,*
1
Laboratory of Medical Genetics, I.M. Sechenov First Moscow State Medical University, 119991 Moscow, Russia
2
Laboratory of Epigenetics, Research Centre for Medical Genetics, 115522 Moscow, Russia
3
Department No. 1, Medical Faculty, Faculty Surgery, I.M. Sechenov First Moscow State Medical University, 119991 Moscow, Russia
*
Author to whom correspondence should be addressed.
Cancers 2021, 13(18), 4586; https://doi.org/10.3390/cancers13184586
Submission received: 6 August 2021 / Revised: 8 September 2021 / Accepted: 9 September 2021 / Published: 13 September 2021
(This article belongs to the Special Issue Novel Biomarkers of Gastrointestinal Cancer)

Abstract

:

Simple Summary

Epigenetic mechanisms, such as DNA methylation/demethylation, covalent modifications of histone proteins, and chromatin remodeling, create specific patterns of gene expression. Epigenetic deregulations are associated with oncogenesis, relapse of the disease and metastases, and can serve as a useful clinical marker. We assessed the clinical relevance of integrity of the genes coding for epigenetic regulator proteins by mutational profiling of 25 genes in 135 gastric cancer (GC) samples. Overall, mutations in the epigenetic regulation genes were found to be significantly associated with reduced overall survival of patients in the group with metastases and in the group with tumors with signet ring cells. We have also discovered mutual exclusivity of somatic mutations in the KMT2D, KMT2C, ARID1A, and CHD7 genes in our cohort. Our results suggest that mutations in epigenetic regulation genes may be valuable clinical markers and deserve further exploration in independent cohorts.

Abstract

We have performed mutational profiling of 25 genes involved in epigenetic processes on 135 gastric cancer (GC) samples. In total, we identified 79 somatic mutations in 49/135 (36%) samples. The minority (n = 8) of mutations was identified in DNA methylation/demethylation genes, while the majority (n = 41), in histone modifier genes, among which mutations were most commonly found in KMT2D and KMT2C. Somatic mutations in KMT2D, KMT2C, ARID1A and CHD7 were mutually exclusive (p = 0.038). Mutations in ARID1A were associated with distant metastases (p = 0.03). The overall survival of patients in the group with metastases and in the group with tumors with signet ring cells was significantly reduced in the presence of mutations in epigenetic regulation genes (p = 0.036 and p = 0.041, respectively). Separately, somatic mutations in chromatin remodeling genes correlate with low survival rate of patients without distant metastasis (p = 0.045) and in the presence of signet ring cells (p = 0.0014). Our results suggest that mutations in epigenetic regulation genes may be valuable clinical markers and deserve further exploration in independent cohorts.

Graphical Abstract

1. Introduction

Gastric cancer (GC) is the 5th most common tumor in the world, and is the 3rd leading cause of cancer-related deaths worldwide. In 2018, more than 1,000,000 new GC patients were identified [1].
Recently, knowledge about the molecular mechanisms of gastric carcinogenesis has been intensively expanded. By using genome-wide approaches, The Cancer Genome Atlas (TCGA) Research Network divided GC into four molecular subtypes: Epstein-Barr associated (EBV), microsatellite instability (MSI), genomically stable (GS), and chromosomal instable (CIN) [2]. Next-generation sequencing (NGS) technologies have allowed identification of genes with an increased frequency of somatic mutations in different types of tumors. Those are the driver genes of carcinogenesis. Being used as targets for a therapy, such genes allow effective treatment of patients. However, GC is not enriched with mutations in known driver genes. Therefore, the targeted drugs that are useful in the treatment of other types of tumors are not effective in GC. Despite the intensive search for new drugs for cancer therapy, only trastuzumab and ramucirumab targeting HER2 and VEGFR2, respectively, are currently approved for GC treatment. Therefore, the search for novel genes with an increased somatic mutation frequency in GC is urgent to identify new clinical and prognostic markers, as well as new targets for treatment.
Epigenetic mechanisms, including DNA methylation/demethylation, covalent modifications of histone proteins (methylation, adenylation, phosphorylation, etc.), chromatin remodeling, and the action of non-coding RNAs create stable and clear patterns of gene expression during cell life. Epigenetic mechanism deregulations are associated with carcinogenesis, relapse of the disease, and metastasis, and can also serve as a useful clinical marker and a marker of response to therapy [3]. Application of NGS allowed identification of tumors without mutations in the known cancer driver genes that are, however, characterized by mutations in genes encoding epigenetic factors and chromatin-modifying enzymes. Today, deregulation of epigenetic mechanisms in different types of tumors has been confirmed, but its causes are insufficiently studied [4,5].
Somatic mutation profiling of epigenetic regulation genes will help to identify causes of epigenetic deregulation in GC and to suggest potential targets for successful therapy.
Using an NGS panel of 25 genes (DNMT1, MBD1, TET1, DNMT3A, DNMT3B, EZH2, KDM6A, EP300, JARID1B, CREBBP, HDAC2, SIRT1, SMARCB1, SMARCA2, SMARCA4, ARID1A, ARID2, BRD7, PBRM1, CHD5, CHD7, CHD4, KMT2A, KMT2D and KMT2C), we performed somatic mutation profiling in 135 tumor samples obtained from patients with GC.

2. Materials and Methods

2.1. Patients and Tumor Samples

The study included 135 patients with locally advanced GC who were treated in N.N. Burdenko Faculty Surgery Clinic, I.M. Sechenov First Moscow State Medical University from 2007 to 2015. The study was conducted in accordance with the Declaration of Helsinki and was approved by the Institutional Ethics Committee of I.M. Sechenov First Moscow State Medical University. Written informed consent was obtained from each participant in this study. All patients underwent surgical treatment, and resected tumor samples, as well as non-malignant gastric mucosa samples, were used in the study. GC was confirmed in all patients by morphological examination of the surgical material. For TNM staging, ESMO Clinical Practice Guidelines for diagnosis, treatment, and follow-up for gastric cancer [6] were used. The distribution of patients in clinical groups is presented in Table 2.

2.2. Mutation Screening by NGS

A total of 5 to 7, 10 μm paraffin sections were manually dissected to ensure that each sample contained at least 70% of neoplastic cells. Genomic DNA was isolated from archived samples using a QIAamp DNA FFPE Tissue Kit (Qiagen, Hilden, Germany), as recommended by the manufacturer.
Deep sequencing was performed using the Ion Torrent platform (ThermoFisher, Waltham, MA, USA) following established protocol [7]. The protocol includes the preparation of libraries of genomic DNA fragments, clonal emulsion PCR, sequencing, and bioinformatic analysis of obtained results. DNA fragment libraries were prepared using Ion Ampliseq ultra-multiplex PCR technology.
An epigenetic regulation genes panel with 1376 primer pairs was designed to amplify all coding regions, noncoding regions of the terminal exons, and putative splice site gene regions for 25 human genes: DNMT1, MBD1, TET1, DNMT3A, DNMT3B, EZH2, KDM6A, EP300, JARID1B, CREBBP, HDAC2, SIRT1, SMARCB1, SMARCA2, SMARCA4, ARID1A, ARID2, BRD7, PBRM1, CHD5, CHD7, CHD4, KMT2A, KMT2D and KMT2C. The panel was designed by using the Ion Ampliseq Designer v. 7.03 (ThermoFisher, Waltham, MA, USA). The total length of human genome sequences covered by the panel was 250,900 bp. The panel reached 98.09% coverage by design; this applies to exons and 25 bp flanking intron sequences. The information of the panel is shown in Tables S3 and S4. The selection of epigenetic regulation genes for the panel was based on the estimation of the frequency of their somatic mutations in GC, obtained from the COSMIC database and from the literature. Genes reported to be mutated in >3.5% of GC samples were included in the panel.
Multiplex PCR and subsequent stages of the fragment library preparation were performed using an Ion AmpliSeq Library Kit 2.0 (ThermoFisher, Waltham, MA, USA), according to the manufacturer’s protocol. Aliquots from the prepared libraries were subjected to clonal amplification on microspheres in the emulsion on the Ion Chef Instrument (ThermoFisher, Waltham, MA, USA). Sequencing was performed on the Ion S5 genomic sequencer according to the manufacturer’s protocol (ThermoFisher, Waltham, MA, USA) with the targeted sequencing depth of 1000×. The results were analyzed with Torrent Suite software consisting of Base Caller (the primary analysis of the sequencing results); Torrent Mapping Alignment Program—TMAP (alignment of the sequences to the reference genome GRCh37/hg19); and Torrent Variant Caller (analysis of variations in nucleotide sequences) with the cut-off for variant allele frequency set at 0.1, and minimum read depth of the variant allele set at 5. Genetic variants were annotated with ANNOVAR software [8]. Visual data analysis, manual filtering of sequencing artifacts, and sequence alignment were performed using the Integrative Genomics Viewer (IGV) [9].

2.3. Sanger Sequencing

Sanger sequencing was performed in order to (1) validate mutations detected by NGS screening and (2) distinguish somatic vs. germline mutations. For the second purpose, DNA samples extracted from archived non-malignant gastric mucosa of the same patients were used. The direct sequencing of individual PCR products from primers that flank areas of specific mutations were performed on the automatic genetic analyzer ABI PRISM 3500 (ThermoFisher, Waltham, MA, USA) according to the manufacturer’s protocols.

2.4. Statistical Analysis

Samples were compared using Fisher’s exact test. For more than 3 groups comparison Chi-squared test was used. Overall survival probability (OS) was calculated by the Kaplan–Meier product-limit method from the date of surgery till death by any cause and compared statistically using Mantel–Haenszel (log-rank) test. A groupwise mutual exclusivity test was carried out using the DISCOVER (Discrete Independence Statistic Controlling for Observations with Varying Rates) method, which is based on overall tumor-specific alteration rates to decide if alterations co-occur more or less than expected by chance and preventing spurious associations in co-occurrence detection with increasing statistical power to detect mutual exclusivities [10]. All calculations were conducted using R version 3.6.3 [R Core Team (2020). R: A language and environment for statistical computing. R Foundation for Statistical Computing, Vienna, Austria. URL https://www.R-project.org/ accessed on 7 August 2021].

2.5. Pathogenicity Prediction for Novel Mutations
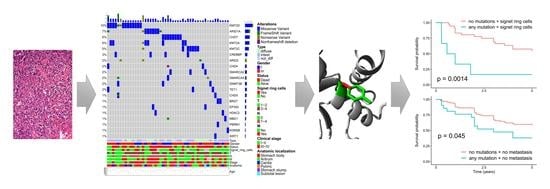
To predict the pathogenicity of identified novel missense variants, a combination of PolyPhen2, PROVEAN, SIFT, and MutPred2 tools was used. I-Mutant 3.0 software was used to calculate the stability of the mutant protein. Loss of protein function effects were assessed with MutPred-LOF software. The effect of nonsynonymous substitutions on the structure was illustrated using the Project HOPE3D portal.

3. Results

3.1. The Spectrum of Detected Somatic Mutations

Using a targeted NGS panel for 25 epigenetic regulation genes, we performed mutational profiling in 135 tumor samples obtained from patients with GC. Our panel included the DNMT1, MBD1, TET1, DNMT3A, DNMT3B genes that control DNA methylation/demethylation; the EZH2, UTX, EP300, JARID1B, CREBBP, HDAC2, SIRT1, KMT2A, KMT2D, and KMT2C genes encoding histone modifiers; and the SMARCB1, SMARCA2, SMARCA4, ARID1A, ARID2, BRD7, PBRM1, CHD5, CHD7, CHD4 genes responsible for chromatin remodeling. Mapped data depth and coverage for each sample are presented in Table S5. For the analysis, we selected missense substitutions that were not annotated in the ClinVar, COSMIC, dbSNP databases and/or substitutions with a population frequency of MAF < 0.0005, as well as nonsense mutations and frameshift mutations. A total of 79 different mutations found in our cohort fulfilled the selection criteria. The variant allele frequency, total read depth, reference, and variant allele read depths, etc., for each of these mutations, are presented in Table S1. No appropriate mutations were found in the DNMT1, DNMT3A, EZH2, UTX, SMARCB1 and SIRT1 genes. The identified mutations and their characteristics are presented in Table 1.
In total, we revealed 79 somatic mutations that fulfilled the selection criteria in 49/135 (36%) samples, and no mutations were found in the remaining samples. Among the identified variants, 29/79 were not annotated in dbSNP, 32/79 were not mentioned in gnomAD Exomes, and 68/79 were not mentioned in ClinVar.
The largest number of mutations was determined in histone modifier genes (41), and in chromatin remodeling genes (37). The smallest number was in DNA methylation/demethylation genes (8). Taking into consideration variation in the gene size, we normalized the mutation numbers in these three groups. Of the genes under study, histone modifier genes contained collectively 24,207 codons; chromatin remodeling genes, 16,891 codons, and DNA methylation/demethylation genes, 6188 codons. Thus, frequencies of mutations in these three groups were 0.0017, 0.0022, and 0.0013 per codon, respectively. These figures support a somewhat lower somatic mutation burden on the DNA methylation/demethylation genes, although the differences were not statistically significant. The distribution of variants in the epigenetic regulation genes in our patient samples was as follows: KMT2D-16, ARID1A-9, KMT2A-8, KMT2C-8, CHD7-7, CHD5-5, CHD4, CREBBP-4 each, ARID2, SMARCA2, SMARCA4, DNMT3B and TET1-3 each, HDAC2, EP300, BRD7 and MBD1-2 each, and PBRM1, JARID1B-1. In 23/49 samples, a combination of more than one mutation in different genes was demonstrated, but mutations in KMT2D, KMT2C, ARID1A, and CHD7 were significantly rarely found in one and the same sample (p = 0.038).

3.2. Pathogenicity Analysis of the Detected Mutations by Prediction Programs

For all novel mutations that fulfilled the selection criteria, pathogenicity analysis was performed by using prediction programs. By in silico analysis of pathogenicity for somatic alterations, we determined that 15/63 alterations were pathogenic according to more than two prediction tools. PolyPhen2-HumDiv predicted 26 of those as ‘Probably damaging’, and the other 15 were ‘Possibly Damaging’, whereas PolyPhen2-HumVar predicted 17 alterations as ‘Probably damaging’, 11 alterations as ‘Possibly damaging’, while other 35 alterations were ‘Benign’. However, it should be noticed that PolyPhen2-HumVar is more effective in mutations pathogenicity prediction for Mendelian disorders. 26/63 somatic alterations were predicted as ‘Deleterious’ by PROVEAN prediction tool; 42/63 variants were indicated as ‘Damaging’ by SIFT.
MutPred2 and MutPred-LOF are machine learning approaches, which incorporate genetic and molecular information to predict whether the alteration is pathogenic or not. We assigned a threshold value of 0.68 for pathogenic, as recommended by developers, because it yields a false positive rate of 10%. With this assumption, 11/63 somatic missense variants were predicted as pathogenic, as well as and 10/16 nonsense and frameshift variants, by MutPred-LOF with a cut-off value of 0.50 (as recommended for MutPred-LOF).
I-Mutant 3.0 predicts protein stability changes based on a protein sequence or protein structure by using a support vector machine training algorithm. The I-Mutant 3.0 predicted a decrease in protein structure stability for 44 somatic alterations and an increase for the other 19 (Table S2).

3.3. Analysis of Clinical Significance of Mutations in Epigenetic Regulation Genes

The distribution of mutations in our patient cohort aligned to clinical features is shown in Figure 1.
We found no associations of overall somatic mutation status (absence of mutations vs. presence of at least one mutation) of epigenetic regulation genes with gender, age, tumor size, lymph node metastases, stage, anatomical localization, Lauren type, distant metastases, and presence of signet ring cells (Table 2). As for individual genes, we have only discovered that mutations in ARID1A were associated with distant metastases (p = 0.03).
In the analysis of survival using the Kaplan–Meier method, we found that the overall survival of patients in the group with metastases and the group of tumors with signet ring cells was significantly reduced in the presence of mutations in the epigenetic regulation genes (p = 0.036 and p = 0.042, respectively) comparing with patients without mutations (Figure 2).
Somatic mutations in the chromatin remodeling genes correlate with a low survival rate of patients in the absence of distant metastases (p = 0.045) and with the presence of signet ring cells in tumors (p = 0.0014) (Figure 3).
For the group of histone-modifying genes, no significant clinical correlations were found. The group with mutations in the DNA methylation/demethylation genes included only 8 patients and was too small to perform statistical analysis.

4. Discussion

Somatic mutations in epigenetic regulation genes are not very common in GC and were determined only in 36% samples (49/135) in our study. Mutations were most rarely detected in genes regulating DNA methylation/demethylation. We have not found any somatic mutations in DNMT1 and DNMT3A. Besides, the group of patients with mutations in the DNA methylation-related genes (MBD1, TET1, DNMT3B) was the smallest one with only 8 out of 135 patients. Such a low frequency may be a result of the cancer type being investigated. Chai-Jin Lee et al. demonstrated that frequencies of somatic mutations in genes associated with DNA methylation and demethylation (DNMT1, DNMT3A, MBD1, MBD4, TET1, TET2 and TET3) significantly varied in different types of cancers. Thus, in myeloid leukemia samples, the frequency of DNMT1 and DNMT3A mutations was high, whereas, in glioblastoma, renal cell carcinoma, and colon carcinoma, the total mutation rate was less than 9% [11]. The low frequency of mutations in the DNA methylation drivers in solid tumors is consistent with our results. Many studies have been published demonstrating DNA methylation as a clinical marker of carcinogenesis; however, the role of somatic mutations in genes regulating methylation/demethylation in solid tumors has not yet been sufficiently investigated. Moreover, although we did not find any DNMT3A mutations in our samples, they were identified in other solid tumors. In 1.2% of papillary thyroid carcinoma cases, mutations and/or loss of DNMT3A expression were associated with aggressive clinical course and poor outcome [12].
In our work, the largest number of mutations was detected in histone modification genes (52%, 41/79), with 16 mutations in KMT2D, 8 in KMT2C, and 8 in KMT2A. The proteins encoded by these KMT2 (histone-lysine N-methyltransferases subclass 2) genes were components of a COMPASS-like complex that performs mono-, di-, and trimethylation of lysine 4 (H3K4) in histone 3 and is associated with transcription activation, facilitating access of transcription factors to the promoter and enhancer regions of genes [13]. The functions of COMPASS complexes are vitally important for the normal development of an organism, and mutations in genes encoding their protein components are associated with carcinogenesis [14]. KMT2C and KMT2D proteins restrain cell proliferation and could be considered tumor suppressors [15]. In addition to lysine methylation associated with transcription activation, methyltransferases KMT2C and KMT2D play an important role in the maintenance of genomic stability and DNA repair [16]. Besides, these proteins, together with PTIP (PAX transactivation-domain interacting protein), a subunit of the KMT2C/KMT2D complexes, were found to increase the instability and induce the degradation of the MRE11-dependent replication fork in BRCA-deficient cells [17].
The KMT2D and KMT2C genes are among the most frequently mutated in cancers, which is also confirmed by our study. Mutations were detected in various types of solid tumors, such as melanoma, urothelial carcinoma, lung cancer, as well as in esophageal and stomach cancers [18].
In our study, KMT2D mutations had the highest frequency of 12% and were distributed throughout the gene (Figure 4). Mutations of the KMT2D gene are mainly localized in the central part of the gene coding sequence, which corresponds to the protein region between the PHD-finger domain and the SET domain. This is also in concordance with the data obtained by other authors [19].
According to the analysis by pathogenicity prediction programs, one of the novel somatic missense mutations that we identified in the KMT2D gene, p.R3727C, was determined as pathogenic by almost all prediction tools. This substitution results in disruption of the leucine zipper motif, which was necessary for the protein–protein interactions or dimerization [20]. Disruption of the leucine zipper motif seriously alters the function of proteins, which leads to a deregulation of protein interactions and blocking transcription. Directed alterations of the leucine zipper motif are currently created in synthetic proteins that are used as antitumor drugs [21].
The analysis of pathogenicity of unannotated mutations identified by us in KMT2C revealed three mutations (p.R973G, p.M959I, p.C1953Y) that were pathogenic according to three or more prediction tools. The first two of them were located in the PHD-finger domain of the gene, and p.C1953Y was located in the disorder domain. Disorder domains are characterized by high instability, and substitutions in this region can change the protein conformation. Recent studies have demonstrated that around 20% of mutations in cancers are located in these regions, causing abnormalities of protein conformations and functions [22]. Mutations in KMT2C in diffuse GC are associated with epithelial–mesenchymal transition (EMT) and acquisition of the mesenchymal phenotype by cells and are also markers of a poor prognosis [23]. Mutation distribution along the KMT2C gene is shown in Figure 5.
In our study, mutations in the KMT2D and KMT2C were significantly rarely combined in one sample (p = 0.038). There is a hypothesis that mutually exclusive genomic events are functionally related by common biological pathways, and mutually exclusive genes act on the same downstream effectors, thereby demonstrating functional redundancy. Therefore, the aberration of one of these genes is enough to completely disrupt their common pathways [24]. The KMT2D and KMT2C are components of similar COMPASS complexes that perform the same function. Deregulation of either KMT2C or KMT2D separately can serve as a driver mutation at the early stages of carcinogenesis, leading to changes in the epigenomic landscape. As was demonstrated for bladder cancer, tumor cells with low KMT2C activity experienced a deficiency of DNA repair mediated by homologous recombination and suffer from endogenous DNA damage and genomic instability, and their treatment with the PARP1/2 inhibitor olaparib leads to synthetic lethality [16]. The high frequency of KMT2D and KMT2C mutations in GC and its associations with repair processes allows considering them as targets for tumor treatment using PARP inhibitors, causing the lethality of tumor cells.
We compared our result on mutual exclusivity of KMT2D and KMT2C mutations with other GC mutation databases. Three datasets were acquired using cBioPortal (http://cbioportal.org accessed on 7 August 2021): Gastric Cancer (OncoSG, 2018), Stomach Adenocarcinoma (Pfizer and UHK), and TCGA PanCancer Stomach Adenocarcinoma (STAD). Visual analysis suggested that KMT2D and KMT2C mutations in these datasets were not mutually exclusive (Figure 6). For statistical analysis, we retained only sequenced samples with mutation data (without Copy-Number Alterations) in all three studies. For the groupwise mutual exclusive test, p-values were as follows: 0.088 for Onco SG, 0.016 for TCGA STAD, and 0.5 for the Pfizer study. Using the wFisher p-value combination method [25] with sample size for each experiment, we obtained the p-value of the mutual exclusive test under the nominal significance level of 0.05 (Figure 6a). Another interesting observation was that considering missense mutations only, mutations in KMT2D and KMT2C visually were almost mutually exclusive in these three datasets, as they were in our study (Figure 6b), although calculated differences did not approach a significance level of 0.05, which we attributed to the sample sizes. In this respect, we paid attention to the studies of bigger sample size, though of another cancer localization, namely, Breast Cancer METABRIC, Nature 2012, and Nat Commun 2016 (2509 samples) and Breast Cancer MSK, Cancer Cell 2018 (1918 samples), and in these datasets, we witnessed obvious mutual exclusivity of somatic mutations in KMT2D, KMT2C, and ARID1A. Although this may be a cancer type-specific observation, we altogether cannot rule out sample size effect and/or peculiarities of mutation detection/interpretation in different studies.
The ARID1A and CHD7 genes that are related to chromatin remodeling were often mutated in our patient samples. The ARID1A is often mutated in esophageal and gastric cancers and is the canonical cancer gene according to the Cosmic Cancer Gene Census [26]. The proteins encoded by the ARID1A, SMARCA1, SMARCA2, and SMARCA4 are subunits of the conservative multisubunit SWI/SNF complex, which uses the energy of ATP hydrolysis to mobilize nucleosomes and remodel chromatin. The expression of these genes is often deregulated in the esophagus and gastric cancers [27].
ARID1A substitutions that we identified in gastric tumors, not annotated in human mutation databases, namely p.R2236C, p.Q1415H, and p.P1710L, are of interest since they can lead to deregulation of molecular mechanisms important for cancer progression. According to the results of in silico analysis, the p.R2236C substitution results in aberration of ADP-ribosylation, which is important for the DNA damage repair, as well as for the formation of an allosteric site at p.R2233 that can be used to bind therapeutic agents. Today, the search and targeting of allosteric sites are one of the strategies in the development of antitumor drugs [28].
ARID1A:p.Q1415H and ARID1A:p.P1710L amino acid substitutions demonstrate an overall predicted loss of O- and C-linked glycosylation. Post-translational modifications, such as glycosylation, affect the transport, stability, and folding of the protein, changing its biochemical and biophysical properties. Numerous studies confirmed that changes in protein glycosylation have a great impact on carcinogenesis and contribute to the appearance of more aggressive cell phenotypes [29].
Recent studies demonstrated that mutations in genes and abnormal expression of the ISO/SNF complex proteins that participate in chromatin remodeling were associated with a more aggressive course of the disease, as well as with EBV and MSI subtypes of GC [30]. In our study, somatic mutations in the chromatin remodeling genes were also found to be associated with worse overall survival in patients (without distant metastases, p = 0.045; and in the presence of signet ring cells, an indicator of the aggressive course in GC, p = 0.00011). H. Takeshima et al. investigated the role of chromatin remodelers in GC and suggested that deregulations of chromatin remodeling occur at an early stage of gastric carcinogenesis and are involved in the formation of the field cancerization [31].
Investigation of GC using NGS previously revealed that 47% of gastric adenocarcinomas were characterized by mutations of chromatin remodeling genes, and somatic mutations of ARID1A had a high frequency, as it was in our study. It was shown that gastrointestinal tumors with ARID1A mutations demonstrated high immune activity [32]. Gastric carcinomas with somatic ARID1A mutations were characterized by a more intense PD-L1 expression than tumors without mutations. PD-L1 overexpression contributes to a more active response to immunotherapy and a better prognosis of survival for patients with mutations in ARID1A compared to tumors with wild-type ARID1A. ARID1A mutations can serve as a biomarker for the identification of patients with gastrointestinal cancer who are sensitive to immunotherapy [33]. Clinically, the loss of ARID1A expression was correlated with larger tumor size, deeper invasion, lymph node metastasis, and a poor prognosis [34]. In line with these observations, in our study, mutations in ARID1A were associated with distant metastases (p = 0.03).

5. Conclusions

As a result of somatic mutation profiling of epigenetic regulation genes in GC, we have revealed associations of the presence of such mutations in tumors with a decrease in patient survival and the risk of developing distant metastasis, making the presence of mutations a marker of a poor prognosis. Studying mutations in epigenetic regulation genes can also contribute to the development of new approaches to drug therapy for GC treatment, adding to them PARP inhibitors for the treatment of tumors with mutations in genes of the KMT2 family and immunotherapy for the treatment of tumors with ARID1A mutations. According to our results, this may be a significant group of patients, as the total frequency of mutations in the chromatin remodeling genes and histone modifiers in our sample were approximately 25% of all patients with mutations in epigenetic regulation genes.

Supplementary Materials

The following are available online at https://www.mdpi.com/article/10.3390/cancers13184586/s1, Table S1: variant allele frequency, total read depth, reference, and variant allele read depths for each mutation, Table S2: in silico analysis of somatic mutations found in gastric cancer samples, Tables S3 and S4: designed coverage of the NGS panel, Table S5: mapped data depth and coverage for each sample.

Author Contributions

Conceptualization, M.V.N.; data curation, M.V.N. and I.V.B.; funding acquisition, M.V.N.; investigation, M.V.N., A.I.K., I.I.B. and T.V.K.; methodology, E.B.K. and E.A.A.; software, A.I.K. and A.S.T.; supervision, M.V.N.; validation, E.B.K. and D.S.M.; visualization, A.I.K. and V.V.S.; writing—review and editing, I.V.B. and V.V.S. All authors have read and agreed to the published version of the manuscript.

Funding

This work was supported by the Russian Foundation for Basic Research (project 18-29-09020) and the Ministry of Science and Higher Education of the Russian Federation.

Institutional Review Board Statement

The study was conducted according to the guidelines of the Declaration of Helsinki, and approved by the Ethics Committee of Sechenov First Moscow State Medical University (Sechenov University), 13 July 2016 (protocol 04-19).

Informed Consent Statement

Informed consent was obtained from all subjects involved in the study.

Data Availability Statement

The data presented in this study are available in the article and supplementary files.

Conflicts of Interest

The authors declare no conflict of interest. The funders had no role in the design of the study; in the collection, analyses, or interpretation of data; in the writing of the manuscript, or in the decision to publish the results.

References

  1. Bray, F.; Ferlay, J.; Soerjomataram, I.; Siegel, R.L.; Torre, L.A.; Jemal, A. Global Cancer Statistics 2018: GLOBOCAN Estimates of Incidence and Mortality Worldwide for 36 Cancers in 185 Countries. CA Cancer J. Clin. 2018, 68, 394–424. [Google Scholar] [CrossRef] [Green Version]
  2. Cancer Genome Atlas Research Network. Comprehensive Molecular Characterization of Gastric Adenocarcinoma. Nature 2014, 513, 202–209. [Google Scholar] [CrossRef] [PubMed] [Green Version]
  3. Thomas, M.; Marcato, P. Epigenetic Modifications as Biomarkers of Tumor Development, Therapy Response, and Recurrence across the Cancer Care Continuum. Cancers 2018, 10, 101. [Google Scholar] [CrossRef] [PubMed] [Green Version]
  4. You, J.S.; Jones, P.A. Cancer Genetics and Epigenetics: Two Sides of the Same Coin? Cancer Cell 2012, 22, 9–20. [Google Scholar] [CrossRef] [PubMed] [Green Version]
  5. Nemtsova, M.V.; Mikhaylenko, D.S.; Kuznetsova, E.B.; Bykov, I.I.; Zamyatnin, A.A. Inactivation of Epigenetic Regulators Due to Mutations in Solid Tumors. Biochemistry 2020, 85, 735–748. [Google Scholar] [CrossRef] [PubMed]
  6. Smyth, E.C.; Verheij, M.; Allum, W.; Cunningham, D.; Cervantes, A.; Arnold, D. Gastric Cancer: ESMO Clinical Practice Guidelines for Diagnosis, Treatment and Follow-Up. Ann. Oncol. 2016, 27, v38–v49. [Google Scholar] [CrossRef] [PubMed]
  7. Scarpa, A.; Sikora, K.; Fassan, M.; Rachiglio, A.M.; Cappellesso, R.; Antonello, D.; Amato, E.; Mafficini, A.; Lambiase, M.; Esposito, C.; et al. Molecular Typing of Lung Adenocarcinoma on Cytological Samples Using a Multigene Next Generation Sequencing Panel. PLoS ONE 2013, 8, e80478. [Google Scholar] [CrossRef] [Green Version]
  8. Wang, K.; Li, M.; Hakonarson, H. ANNOVAR: Functional Annotation of Genetic Variants from High-Throughput Sequencing Data. Nucleic Acids Res. 2010, 38, e164. [Google Scholar] [CrossRef]
  9. Robinson, J.T.; Thorvaldsdóttir, H.; Winckler, W.; Guttman, M.; Lander, E.S.; Getz, G.; Mesirov, J.P. Integrative Genomics Viewer. Nat. Biotechnol. 2011, 29, 24–26. [Google Scholar] [CrossRef] [Green Version]
  10. Cerami, E.; Gao, J.; Dogrusoz, U.; Gross, B.E.; Sumer, S.O.; Aksoy, B.A.; Jacobsen, A.; Byrne, C.J.; Heuer, M.L.; Larsson, E.; et al. The CBio Cancer Genomics Portal: An Open Platform for Exploring Multidimensional Cancer Genomics Data. Cancer Discov. 2012, 2, 401–404. [Google Scholar] [CrossRef] [Green Version]
  11. Lee, C.-J.; Ahn, H.; Jeong, D.; Pak, M.; Moon, J.H.; Kim, S. Impact of Mutations in DNA Methylation Modification Genes on Genome-Wide Methylation Landscapes and Downstream Gene Activations in Pan-Cancer. BMC Med. Genom. 2020, 13, 27. [Google Scholar] [CrossRef] [PubMed]
  12. Siraj, A.K.; Pratheeshkumar, P.; Parvathareddy, S.K.; Bu, R.; Masoodi, T.; Iqbal, K.; Al-Rasheed, M.; Al-Dayel, F.; Al-Sobhi, S.S.; Alzahrani, A.S.; et al. Prognostic Significance of DNMT3A Alterations in Middle Eastern Papillary Thyroid Carcinoma. Eur. J. Cancer 2019, 117, 133–144. [Google Scholar] [CrossRef]
  13. Fagan, R.J.; Dingwall, A.K. COMPASS Ascending: Emerging Clues Regarding the Roles of MLL3/KMT2C and MLL2/KMT2D Proteins in Cancer. Cancer Lett. 2019, 458, 56–65. [Google Scholar] [CrossRef] [PubMed]
  14. Herz, H.-M.; Hu, D.; Shilatifard, A. Enhancer Malfunction in Cancer. Mol. Cell 2014, 53, 859–866. [Google Scholar] [CrossRef] [PubMed] [Green Version]
  15. Chen, C.; Liu, Y.; Rappaport, A.R.; Kitzing, T.; Schultz, N.; Zhao, Z.; Shroff, A.S.; Dickins, R.A.; Vakoc, C.R.; Bradner, J.E.; et al. MLL3 Is a Haploinsufficient 7q Tumor Suppressor in Acute Myeloid Leukemia. Cancer Cell 2014, 25, 652–665. [Google Scholar] [CrossRef] [PubMed] [Green Version]
  16. Rampias, T.; Karagiannis, D.; Avgeris, M.; Polyzos, A.; Kokkalis, A.; Kanaki, Z.; Kousidou, E.; Tzetis, M.; Kanavakis, E.; Stravodimos, K.; et al. The Lysine-specific Methyltransferase KMT 2C/MLL 3 Regulates DNA Repair Components in Cancer. EMBO Rep. 2019, 20, 6821. [Google Scholar] [CrossRef] [PubMed]
  17. Poreba, E.; Lesniewicz, K.; Durzynska, J. Aberrant Activity of Histone–Lysine N-Methyltransferase 2 (KMT2) Complexes in Oncogenesis. Int. J. Mol. Sci. 2020, 21, 9340. [Google Scholar] [CrossRef]
  18. Gao, J.; Aksoy, B.A.; Dogrusoz, U.; Dresdner, G.; Gross, B.; Sumer, S.O.; Sun, Y.; Jacobsen, A.; Sinha, R.; Larsson, E.; et al. Integrative Analysis of Complex Cancer Genomics and Clinical Profiles Using the CBioPortal. Sci. Signal. 2013, 6, pl1. [Google Scholar] [CrossRef] [Green Version]
  19. Ding, B.; Yan, L.; Zhang, Y.; Wang, Z.; Zhang, Y.; Xia, D.; Ye, Z.; Xu, H. Analysis of the Role of Mutations in the KMT 2D Histone Lysine Methyltransferase in Bladder Cancer. FEBS Open Bio 2019, 9, 693–706. [Google Scholar] [CrossRef] [Green Version]
  20. Manna, P.R.; Dyson, M.T.; Stocco, D.M. Role of Basic Leucine Zipper Proteins in Transcriptional Regulation of the Steroidogenic Acute Regulatory Protein Gene. Mol. Cell Endocrinol. 2009, 302, 1–11. [Google Scholar] [CrossRef] [Green Version]
  21. Inamoto, I.; Shin, J.A. Peptide Therapeutics That Directly Target Transcription Factors. Pept. Sci. 2019, 111, e24048. [Google Scholar] [CrossRef] [Green Version]
  22. Mészáros, B.; Hajdu-Soltész, B.; Zeke, A.; Dosztányi, Z. Mutations of Intrinsically Disordered Protein Regions Can Drive Cancer but Lack Therapeutic Strategies. Biomolecules 2021, 11, 381. [Google Scholar] [CrossRef]
  23. Cho, S.-J.; Yoon, C.; Lee, J.H.; Chang, K.K.; Lin, J.-X.; Kim, Y.-H.; Kook, M.-C.; Aksoy, B.A.; Park, D.J.; Ashktorab, H.; et al. KMT2C Mutations in Diffuse-Type Gastric Adenocarcinoma Promote Epithelial-to-Mesenchymal Transition. Clin. Cancer Res. 2018, 24, 6556–6569. [Google Scholar] [CrossRef] [Green Version]
  24. Deng, Y.; Luo, S.; Deng, C.; Luo, T.; Yin, W.; Zhang, H.; Zhang, Y.; Zhang, X.; Lan, Y.; Ping, Y.; et al. Identifying Mutual Exclusivity across Cancer Genomes: Computational Approaches to Discover Genetic Interaction and Reveal Tumor Vulnerability. Brief. Bioinform. 2019, 20, 254–266. [Google Scholar] [CrossRef] [PubMed]
  25. Yoon, S.; Baik, B.; Park, T.; Nam, D. Powerful P-Value Combination Methods to Detect Incomplete Association. Sci. Rep. 2021, 11, 6980. [Google Scholar] [CrossRef] [PubMed]
  26. Dietlein, F.; Weghorn, D.; Taylor-Weiner, A.; Richters, A.; Reardon, B.; Liu, D.; Lander, E.S.; Van Allen, E.M.; Sunyaev, S.R. Identification of Cancer Driver Genes Based on Nucleotide Context. Nat. Genet. 2020, 52, 208–218. [Google Scholar] [CrossRef]
  27. Schallenberg, S.; Bork, J.; Essakly, A.; Alakus, H.; Buettner, R.; Hillmer, A.M.; Bruns, C.; Schroeder, W.; Zander, T.; Loeser, H.; et al. Loss of the SWI/SNF-ATPase Subunit Members SMARCF1 (ARID1A), SMARCA2 (BRM), SMARCA4 (BRG1) and SMARCB1 (INI1) in Oesophageal Adenocarcinoma. BMC Cancer 2020, 20, 12. [Google Scholar] [CrossRef]
  28. Ye, F.; Huang, J.; Wang, H.; Luo, C.; Zhao, K. Targeting Epigenetic Machinery: Emerging Novel Allosteric Inhibitors. Pharmacol. Ther. 2019, 204, 107406. [Google Scholar] [CrossRef] [PubMed]
  29. Peixoto, A.; Relvas-Santos, M.; Azevedo, R.; Santos, L.L.; Ferreira, J.A. Protein Glycosylation and Tumor Microenvironment Alterations Driving Cancer Hallmarks. Front. Oncol. 2019, 9, 380. [Google Scholar] [CrossRef] [PubMed] [Green Version]
  30. Huang, S.-C.; Ng, K.-F.; Chang, I.Y.-F.; Chang, C.-J.; Chao, Y.-C.; Chang, S.-C.; Chen, M.-C.; Yeh, T.-S.; Chen, T.-C. The Clinicopathological Significance of SWI/SNF Alterations in Gastric Cancer Is Associated with the Molecular Subtypes. PLoS ONE 2021, 16, e0245356. [Google Scholar] [CrossRef]
  31. Takeshima, H.; Niwa, T.; Takahashi, T.; Wakabayashi, M.; Yamashita, S.; Ando, T.; Inagawa, Y.; Taniguchi, H.; Katai, H.; Sugiyama, T.; et al. Frequent Involvement of Chromatin Remodeler Alterations in Gastric Field Cancerization. Cancer Lett. 2015, 357, 328–338. [Google Scholar] [CrossRef] [PubMed]
  32. Katona, B.W.; Rustgi, A.K. Gastric Cancer Genomics: Advances and Future Directions. Cell Mol. Gastroenterol. Hepatol. 2017, 3, 211–217. [Google Scholar] [CrossRef] [PubMed] [Green Version]
  33. Li, L.; Li, M.; Jiang, Z.; Wang, X. ARID1A Mutations Are Associated with Increased Immune Activity in Gastrointestinal Cancer. Cells 2019, 8, 678. [Google Scholar] [CrossRef] [PubMed] [Green Version]
  34. Yamamoto, H.; Watanabe, Y.; Maehata, T.; Morita, R.; Yoshida, Y.; Oikawa, R.; Ishigooka, S.; Ozawa, S.-I.; Matsuo, Y.; Hosoya, K.; et al. An Updated Review of Gastric Cancer in the Next-Generation Sequencing Era: Insights from Bench to Bedside and Vice Versa. World J. Gastroenterol. 2014, 20, 3927–3937. [Google Scholar] [CrossRef]
Figure 1. Spectrum of epigenetic regulation genes somatic mutations in gastric cancer. Gene names are marked according to functions of the encoded proteins: histone modifiers, blue; chromatin remodeling, red; DNA methylation/demethylation, magenta.
Cancers 13 04586 g001
Figure 2. Overall survival in patients with and without somatic mutations of the epigenetic regulation genes in their gastric tumors, and (a) with distant metastases; (b) with the presence of signet ring cells in tumors.
Cancers 13 04586 g002
Figure 3. Overall survival in patients with and without somatic mutations of the chromatin remodeling genes in their gastric tumors, and (a) with distant metastases; (b) with the presence of signet ring cells in tumors.
Cancers 13 04586 g003
Figure 4. Distribution of the KMT2D mutations detected in this study, along the gene.
Cancers 13 04586 g004
Figure 5. Distribution of the KMT2C mutations detected in this study, along the gene.
Cancers 13 04586 g005
Figure 6. Analysis of mutual exclusivity of KMT2D and KMT2C mutations on the data presented in this article and in other gastric cancer mutation databases. Portions of samples without mutations in KMT2D or KMT2C are shown in grey; (a) analysis of all types of mutations, excluding amplification and deep deletions, portions of samples with mutations in KMT2D or KMT2C are colored black; (b) analysis of missense mutations only, portions of samples with missense mutations in KMT2D or KMT2C are colored blue.
Cancers 13 04586 g006
Table 1. Somatic mutations detected in epigenetic regulation genes in 135 gastric tumors.
Gene/MutationPosition According
to hg19
rsIDMAF (gnomAD Exomes)ClinVar# of Cases
1ARID1A:exon1:c.G544A:p.A182T chr1:27023438---1
2ARID1A:exon16:c.G3902A:p.S1301Nchr1:27100106rs989613588A = 4 × 10⁻⁶Not Reported1
3ARID1A:exon18:c.G4245C:p.Q1415Hchr1:27100963--Not Reported1
4ARID1A:exon20:c.C6706T:p.R2236Cchr1:27107095rs763691986T = 2 × 10⁻⁵Not Reported1
5ARID1A:exon20:c.C5483G:p.S1828Xchr1:27105872--Not Reported1
6ARID1A:exon20:c.C5129T:p.P1710Lchr1:27105518--Not Reported1
7ARID1A:exon2:c.G1330A:p.G444Schr1:27056334rs541301347A = 2.4 × 10⁻⁵Not Reported1
8ARID1A:exon20:c.5881_5887del:p.S1961fschr1:27106270--Not Reported1
9ARID1A:exon18:c.4713_4714del:p.N1571fschr1:27101431--Not Reported1
10ARID2:exon1:c.53_57del:p.A18fschr12:46123672--Not Reported1
11ARID2:exon8:c.C820T:p.R274Xchr12:46230571--Likely pathogenic1
12ARID2:exon8:c.C985T:p.Q329Xchr12:46230736--Not Reported1
13SMARCA2:exon7:c.C734T:p.T245Mchr9:2192726rs753433101A = 3 × 10⁻⁵Not Reported1
14SMARCA2:exon7:c.A1256G:p.K419Rchr9:2056754--Not Reported1
15SMARCA2:exon7:c.G1202A:p.R401Hchr9:2056700rs745500947T = 8 × 10⁻⁶Not Reported1
16SMARCA4:exon18:c.C2738T:p.P913Lchr19:11132522rs778175819T = 4 × 10⁻⁶Not Reported1
17SMARCA4:exon3:c.C430T:p.Q144Xchr19:11096939--Not Reported1
18SMARCA4:exon3:c.583delC:p.P195fschr19:11097092--Not Reported1
19KDM5B:exon17:c.C2392T:p.R798Wchr1:202711581rs1189771603A = 2.8 × 10⁻⁵Not Reported1
20CHD4:exon28:c.C4216T:p.R1406Cchr12:6692034--Not Reported1
21CHD4:exon4:c.417_419del:p.139_140delchr12:6711145rs71584865del(TCC)3 =
8 × 10⁻⁶
Not Reported2
22CHD4:exon4:c.C421G:p.P141Achr12:6710929--Not Reported1
23CHD5:exon2:c.119delT:p.F40fschr1:6228298--Not Reported1
24CHD5:exon15:c.C2257A:p.L753Mchr1:6202367--Not Reported1
25CHD5:exon7:c.G910A:p.A304Tchr1:6211176rs768430028T = 1.3 × 10⁻⁴Not Reported2
26CHD5:exon2:c.A156T:p.K52Nchr1:6228261rs964095593A = 3 × 10⁻⁵Not Reported1
27CHD7:exon31:c.G6112A:p.D2038Nchr8:61765396rs747846723A = 6 × 10⁻⁵Uncertain Significance1
28CHD7:exon35:c.A7819G:p.S2607Gchr8:61773673rs1424434796G = 5 × 10⁻⁶Not Reported2
29CHD7:exon22:c.G4859A:p.R1620Qchr8:61757431rs768497646A = 2.9 × 10⁻⁵ Not Reported1
30CHD7:exon1:c.G749A:p.R250Hchr8:61654740rs767475667A = 6 × 10⁻⁵Not Reported1
31CHD7:exon22:c.G5017A:p.D1673Nchr8:61757589rs769563309A = 2.4 × 10⁻⁵Not Reported1
32CHD7:exon29:c.G5828A:p.R1943Qchr8:61764740rs753723769A = 2.8 × 10⁻⁵Uncertain Significance1
33EP300:exon3:c.A752G:p.N251Schr22:41521890rs142009367G = 2.2 × 10⁻⁴Benign2
34HDAC2:exon13:c.C1430A:p.T477Nchr6:114262878rs1341257540-Not Reported1
35HDAC2:exon6:c.G511A:p.V171Ichr6:114274569--Not Reported1
36 CREBBP:exon30:c.C6335T:p.P2112Lchr16:3778599rs587783512A = 1.6 × 10⁻⁵Uncertain Significance1
37CREBBP:exon2:c.C458T:p.P153Lchr16:3900638rs146538907A = 3.35 × 10⁻⁴Likely Benign1
38CREBBP:exon3:c.C922T:p.P308Schr16:3860657--Not Reported1
39CREBBP:exon18:c.A3421C:p.K1141Qchr16:3807998--Not Reported1
40BRD7:exon7:c.A871G:p.S291Gchr16:50368638rs200218240C = 1.6 × 10⁻⁴Not Reported1
41BRD7:exon5:c.C571T:p.Q191Xchr16:50383954--Not Reported1
42PBRM1:exon17:c.C2032T:p.R678Cchr3:52643864rs1422119249-Not Reported1
43KMT2A:exon27:c.T9737C:p.I3246Tchr11:118376344rs1259638674C = 3 × 10⁻⁵Not Reported1
44KMT2A:exon27:c.C9947T:p.A3316Vchr11:118376554rs201447376T = 1.3 × 10⁻⁴Not Reported1
45KMT2A:exon27:c.G10181A:p.G3394Echr11:118376788rs782460936A = 3 × 10⁻⁵Not Reported1
46KMT2A:exon21:c.G5726A:p.W1909Xchr11:118368712--Not Reported1
47KMT2A:exon27:c.G9247A:p.V3083Ichr11:118375854--Not Reported1
48KMT2A:exon30:c.A10984G:p.S3662Gchr11:118380746rs201724738G = 5.6 × 10⁻⁵Not Reported1
49KMT2A:exon36:c.G11903A:p.R3968Qchr11:118392871rs369182428A = 3 × 10⁻⁵Not Reported1
50KMT2A:exon30:c.A10975G:p.S3659Gchr11:118380746rs201724738G = 1 × 10⁻⁴Not Reported1
51KMT2C:exon43:c.G9987A:p.M3329Ichr7:151860675rs200804156T = 6 × 10⁻⁵Not Reported1
52KMT2D:exon10:c.T2284C:p.S762Pchr12:49445182--Not Reported1
53KMT2C:exon10:c.C1384T:p.Q462Xchr7:151949716--Not Reported1
54KMT2C:exon36:c.C6836T:p.P2279Lchr7:151878109rs150844259A = 6 × 10⁻⁵Not Reported1
55KMT2C:exon36:c.A6919G:p.R2307Gchr7:151878026rs772283102C = 2.4 × 10⁻⁵ Not Reported1
56KMT2C:exon36:c.G5858A:p.C1953Ychr7:151879087--Not Reported1
57KMT2C:exon18:c.A2917G:p.R973Gchr7:151927067rs60244562-Not Reported2
58KMT2C:exon18:c.G2877A:p.M959Ichr7:151927107rs4024402-Not Reported1
59KMT2D:exon31:c.A7954C:p.M2652Lchr12:49433599rs147706410G = 4.5 × 10⁻⁴Likely Benign1
60KMT2D:exon41:c.G13780C:p.A4594Pchr12:49424443rs545972414G = 2.5 × 10⁻⁴Not Reported2
61KMT2D:exon28:c.C5921T:p.T1974Mchr12:49436060rs777415982A = 6 × 10⁻⁵Not Reported1
62KMT2D:exon48:c.G14893A:p.A4965Tchr12:49420856rs200747934T = 1.53 × 10⁻⁴Uncertain Significance2
63KMT2D:exon39:c.G12686A:p.R4229Qchr12:49445262rs753607446T = 3.2 × 10⁻⁵Not Reported1
64KMT2D:exon31:c.T7829C:p.L2610Pchr12:49433724rs200998047G = 1.85 × 10⁻⁴ Uncertain Significance1
65KMT2D:exon31:c.6673delG:p.E2225fschr12:49434880--Not Reported1
66KMT2D:exon31:c.C7516T:p.L2506Fchr12:49434037rs749670394A = 4 × 10⁻⁶Not Reported1
67KMT2D:exon39:c.C11179T:p.R3727Cchr12:49427309rs566069597A = 3.6 × 10⁻⁵Not Reported1
68KMT2D:exon10:c.C1628T:p.S543Lchr12:49445838rs776242478A = 8 × 10⁻⁶Not Reported1
69KMT2D:exon31:c.G8026T:p.E2676Xchr12:49433527--Not Reported1
70KMT2D:exon31:c.C7136T:p.A2379Vchr12:49434417rs200842315A = 6 × 10⁻⁵Likely benign1
71KMT2D:exon39:c.C11495G:p.S3832Cchr12:49426993--Not Reported1
72MBD1:exon9:c.G796A:p.E266Kchr18:47801382rs142015383T = 5 × 10⁻⁴Not Reported1
73MBD1:exon8:c.734delC:p.P245fschr18:47801527rs1173827934-Not Reported1
74TET1:exon4:c.G2407A:p.A803Tchr10:70404893rs765094207A = 2.4 × 10⁻⁵Not Reported1
75TET1:exon2:c.G320A:p.R107Qchr10:70332415rs1419371452A = 8 × 10⁻⁶Not Reported1
76TET1:exon4:c.G3476A:p.R1159Qchr10:70405962rs140289196A = 2.2 × 10⁻⁴Not Reported1
77DNMT3B:exon19:c.G2138A:p.R713Qchr20:31390243rs747182299A = 3 × 10⁻⁵Likely Pathogenic1
78DNMT3B:exon6:c.A680G:p.Y227Cchr20:31379501--Not Reported1
79DNMT3B:exon17:c.G1855A:p.E619Kchr20:31388054rs576798456A = 8 × 10⁻⁶Not Reported1
Table 2. Clinical characteristics of patients and their distribution by groups with mutations (mut+) and without mutations (mut−) in epigenetic regulation genes.
ParametersTotal Cases Mut−Mut+p-Value *
135 8649
Age<503522131
>501006436
Sexm835132 0.58
f5235 17
Survival
status
Alive5942 17 0.14
Dead76 44 32
5-year
survival
status
Alive60 42 180.19
Dead6940 29
<5 years follow-up642
TT1-2 49 3316 0.46
T3-4 84 51 33
is 2 2 -
NN0 56 3719 0.71
N1-3 79 49 30
MM0 89 59 30 0.55
M1 4225 17
Unknown4--
Lauren classificationDiffuse 59 4118 0.26
Intestinal 64 38 26
Not Differentiate 12 7 5
StageI-II 57 39 18 0.36
III-IV 76 45 31
Unknown2--
Anatomical localization Stomach body 75 52 230.10
Antrum36 22 14
Cardia20 11 8
Stomach stump3 03
Subtotal lesion101
Pyloric1 10
Signet ring cells yes 42 29 130.69
no 89 57 32
Unknown404
* patients group with mutations in epigenetic regulation genes (mut+) vs. without mutations (mut−).
Publisher’s Note: MDPI stays neutral with regard to jurisdictional claims in published maps and institutional affiliations.

