Article

A DOCK1 Gene-Derived Circular RNA Is Highly Expressed in Luminal Mammary Tumours and Is Involved in the Epithelial Differentiation, Growth, and Motility of Breast Cancer Cells

1
Laboratory of Molecular Biology, Istituto di Ricerche Farmacologiche Mario Negri IRCCS, 20156 Milano, Italy
2
Centre for Cancer Biology, An Alliance of SA Pathology and University of South Australia, Adelaide, SA 5000, Australia
3
Institute of Oncology Research, USI, University of Southern Switzerland, 6500 Bellinzona, Switzerland
4
Department of Medicine, The University of Adelaide, Adelaide, SA 5005, Australia
*
Author to whom correspondence should be addressed.
Mami Kurosaki, Mineko Terao and Dawei Liu share the first authorship.
Cancers 2021, 13(21), 5325; https://doi.org/10.3390/cancers13215325
Submission received: 8 September 2021 / Revised: 19 October 2021 / Accepted: 20 October 2021 / Published: 23 October 2021
(This article belongs to the Section Molecular Cancer Biology)

Abstract

:

Simple Summary

In the present study, we define the expression of 15 selected circular RNAs, using a panel of 18 breast cancer cell lines recapitulating the heterogeneity of tumors and consisting of three distinct groups according to the mesenchymal/epithelial phenotype. We identify circDOCK1-1 generated from the DOCK1 gene as an important regulator of the epithelial differentiation of mammary tumour cells. In addition, our high-throughput transcriptomic studies provide information on the genes that are regulated by circDOCK1-1, casting new light on the gene networks involved in the processes underlying the development of mammary tumours. Our results further indicate that circDOCK1-1 controls cell–cell adhesion and consequently random as well as directional motility. Besides their interest from a basic point of view, the data generated may be of translational relevance, as they suggest that strategies aimed at increasing the amounts or at stimulating the activity of circDOCK1-1 may be of significance for the treatment of a subset of triple-negative breast cancer patients.

Abstract

Circular RNAs are regulatory molecules involved in numerous cellular processes and may be involved in tumour growth and diffusion. Here, we define the expression of 15 selected circular RNAs, which may control the process of epithelial-to-mesenchymal transition, using a panel of 18 breast cancer cell lines recapitulating the heterogeneity of these tumours and consisting of three groups according to the mesenchymal/epithelial phenotype. A circular RNA from the DOCK1 gene (hsa_circ_0020397) shows low/undetectable levels in triple-negative mesenchymal cell lines, while its content is high in epithelial cell lines, independent of estrogen receptor or HER2 positivity. RNA-sequencing experiments performed on the triple-negative/mesenchymal MDA-MB-231 and MDA-MB-157 cell lines engineered to overexpress hsa_circ_0020397 demonstrate that the circRNA influences the expression of 110 common genes. Pathway analysis of these genes indicates that overexpression of the circular RNA differentiates the two mesenchymal cell lines along the epithelial pathway and increases cell-to-cell adhesion. This is accompanied by growth inhibition and a reduction in the random/directional motility of the cell lines. The upregulated AGR2, ENPP1, and PPP1R9A genes as well as the downregulated APOE, AQP3, CD99L2, and IGFBP4 genes show an opposite regulation by hsa_circ_0020397 silencing in luminal CAMA1 cells. The results provide novel insights into the role played by specific circular RNAs in the generation/progression of breast cancer.

1. Introduction

Circular RNAs are covalent circles of single-stranded RNA that are generated from non-canonical back-splicing of pre-mRNAs and non-coding RNAs [1,2,3]. Circular RNAs are a largely overlooked class of regulatory molecules, as they are difficult to identify and quantitate with the traditional methods used for the analysis of RNA-sequencing (RNA-seq) data [4]. Nevertheless, recent advances in the field indicate that circular RNAs may be involved in numerous biological processes and are likely to be key regulators of multiple aspects of the cell and tissue homeostasis [5]. In particular, circular RNAs are likely to play a significant role in the homeostasis of the tumour cell [6,7], since they are involved in the control of cell cycle [8], tumorigenesis, and chemoresistance [9,10]. This is predominantly the consequence of the fact that circular RNAs modulate the activity of regulatory proteins and RNAs, such as transcription factors [11] and microRNAs [12,13,14]. Indeed, there is emerging evidence indicating that one of the main mechanisms underlying the regulatory action of circular RNAs is related to the ability of these molecules to act as sponges and to sequester microRNAs [15]. Despite this background, there are relatively few studies focussing on the involvement of circular RNAs in the development and progression of solid tumours, with particular reference to breast cancer [15,16,17], a very heterogeneous type of tumour consisting of a large collection of different diseases [18,19,20,21].
In the present study, we focus our interest on a small set of circular RNAs that may be involved in the process of epithelial-to-mesenchymal transition (EMT) [22] and we define their profile of expression in a relatively large panel of cell lines recapitulating the heterogeneity of the disease [23]. One of the 126 circular RNAs predicted to derive from the DOCK1 gene (hsa_circ_0020397; circDOCK1-1 throughout the text) shows the most interesting profile, as it is expressed at low/undetectable levels in triple-negative mesenchymal cell lines, while its content is high in epithelial cell lines. The whole-genome RNA-sequencing (RNA-seq) data obtained from two triple-negative mesenchymal cell lines engineered to overexpress circDOCK1-1 indicate that this circular RNA controls the expression of genes involved in epithelial differentiation and cell adhesion. Among these genes, the upregulated AGR2, ENPP1, and PPP1R9A as well as the downregulated APOE, AQP3, CD99L2, and IGFBP4 are of particular interest. In fact, the seven abovementioned genes show an opposite behaviours upon circDOCK1 silencing in luminal CAMA1 cells. From a functional point of view, forced expression of circDOCK1-1 in two mesenchymal breast cancer cell lines causes a growth inhibitory effect and a significant reduction in the random/directional motility of both cell lines.

2. Materials and Methods

2.1. Reagents, Biological, and Computational Resources

All the reagents, the list of the cell lines, and their phenotypic characteristics/source are available in Supplementary Materials. Some of the analyses presented in the study required the use of the TCGA (The Cancer Genome Atlas) dataset of the National Cancer Institute (https://www.cancer.gov/about-nci/organization/ccg/research/structural-genomics/tcga, accessed on 12 May 2021) and the CCLE (Cancer Cell Line Encyclopedia) of the Broad Institute (https://sites.broadinstitute.org/ccle, accessed on 12 May 2021), as indicated in the appropriate sections of the manuscript.

2.2. Generation of circDOCK1-1-Overexpressing and Knock-Out Cells

The methodologies used for the generation of the MDA-MB-231 and MDA-MB-157 cells characterized by forced expression of circDOCK1-1 and the CAMA1 cells genetically engineered for circDOCK1-1 silencing are described in the Supplementary Methods section of the Supplementary Materials.

2.3. Measurement of the Selected circRNAs and Corresponding Linear mRNAs

Total RNA was extracted using the miRNeasy Mini Kit (Qiagen, Hilden, Germany). The RNA was reverse transcribed using the Maxima H Minus cDNA Synthesis Master Mix (Thermo Fisher Scientific, Waltham, MA, USA) and it was amplified with a Taqman Universal Master Mix (Applied Biosystems, Waltham, MA, USA), using specific Taqman probes (Applied Biosystems). Some of the mRNAs were determined with the SYBR Green PCR Kit (Qiagen) using oligonucleotides as primers. circRNAs were reverse transcribed with the Quantitect Reverse Transcription Kit (Qiagen). The corresponding cDNAs were amplified using the SYBR Green PCR Kit (Qiagen). A list of the Taqman probes and the structure of specific oligonucleotide primers is available in the Supplementary Materials.

2.4. Western Blot Analyses

Whole-cell protein extracts were prepared according to previously described methods [20]. Aliquots of the protein extracts (10 µg) were separated on PAGE and transferred to nitrocellulose membranes. Protein bands were detected with specific antibodies, as detailed in the Supplementary Materials.

2.5. Cell Proliferation, Single-Cell Motility, and Wound-Healing Assays

The growth rate of cells was determined with the sulforhodamine B assay. Single-cell motility was examined with a previously described method [24], while wound-healing assays were performed using the method of Jonkman [25].

2.6. RNA-Sequencing Studies

For the RNA-seq analysis of the circDOCK1-overexpressing MDA-MB-231 and MDA-MB-157 cells and the respective pVOID controls, three biological replicates of each cell line were grown in the presence of G418. For the silencing experiments, three biological replicates of cells were treated for 4 days in the presence/absence of doxycycline. Total RNA was extracted with the miRNeasy Mini Kit (Qiagen). cDNA libraries were prepared with the Illumina TruSeq RNAlibrary kit (Illumina, San Diego, CA, USA) and sequenced on the Illumina NextSeq500 with paired-end 150 base-pair-long reads. The RNA-seq data were analysed as described [23] and deposited in the EMBL-EBI Arrayexpress database (Accession No: E-MTAB-10819). The quality of the sequencing data was assessed with the use of FastQC. Sequence alignments to the reference human genome (GRCh38) were performed with the “Spliced Transcripts Alignment to a Reference” (STAR) software (v.2.5.2a). Gene expression was quantitated with the use of the annotations available in Gencode (version 27). Raw counts were processed in the R-statistical environment and differential expression analysis was conducted with the DESeq2 pipeline [26]. Genes endowed with low mean normalized counts were filtered out by the Independent Filtering feature embedded in DESeq2 (alpha = 0.05). Statistical enrichment of gene sets was assessed with the use of the HALLMARK collection.

2.7. Statistical Analyses

The details regarding the statistical tests for the analysis of the quantitative data presented are available in the text or figure legends. All the analyses were performed using two-tailed statistical tests. The statistical treatments performed on the RNA-seq data are detailed in the above RNA-Sequencing Studies paragraph.

3. Results

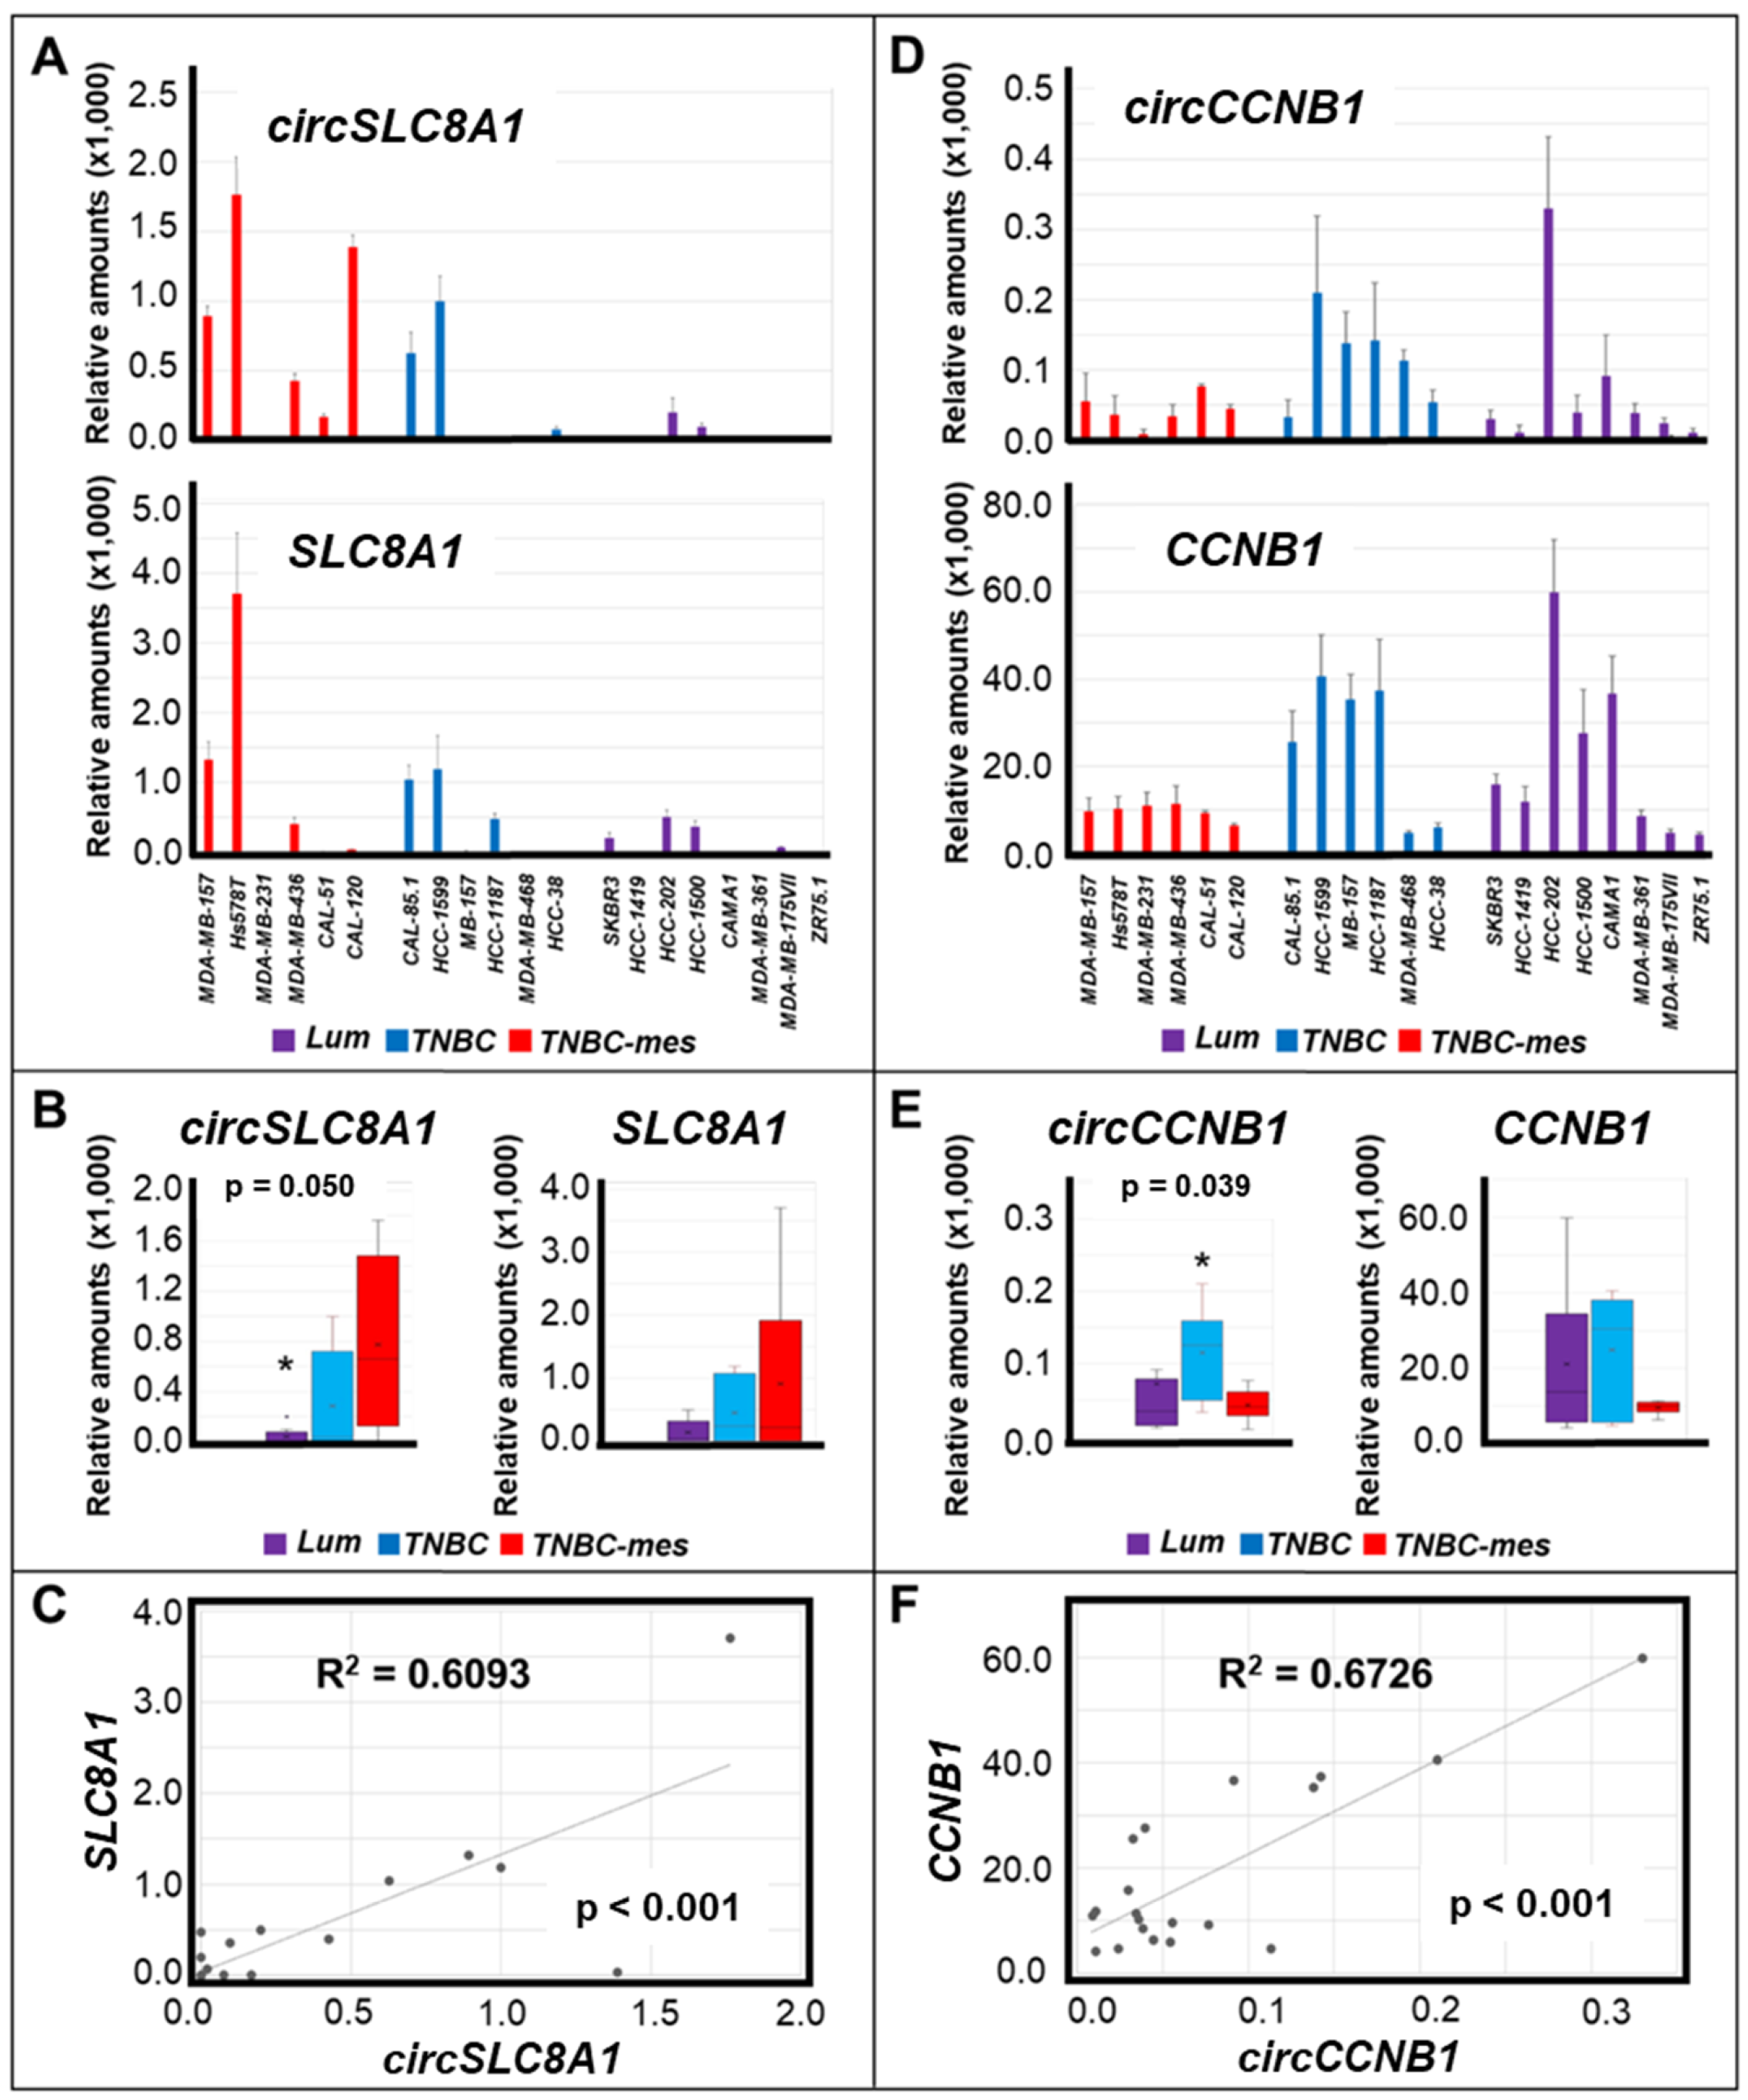
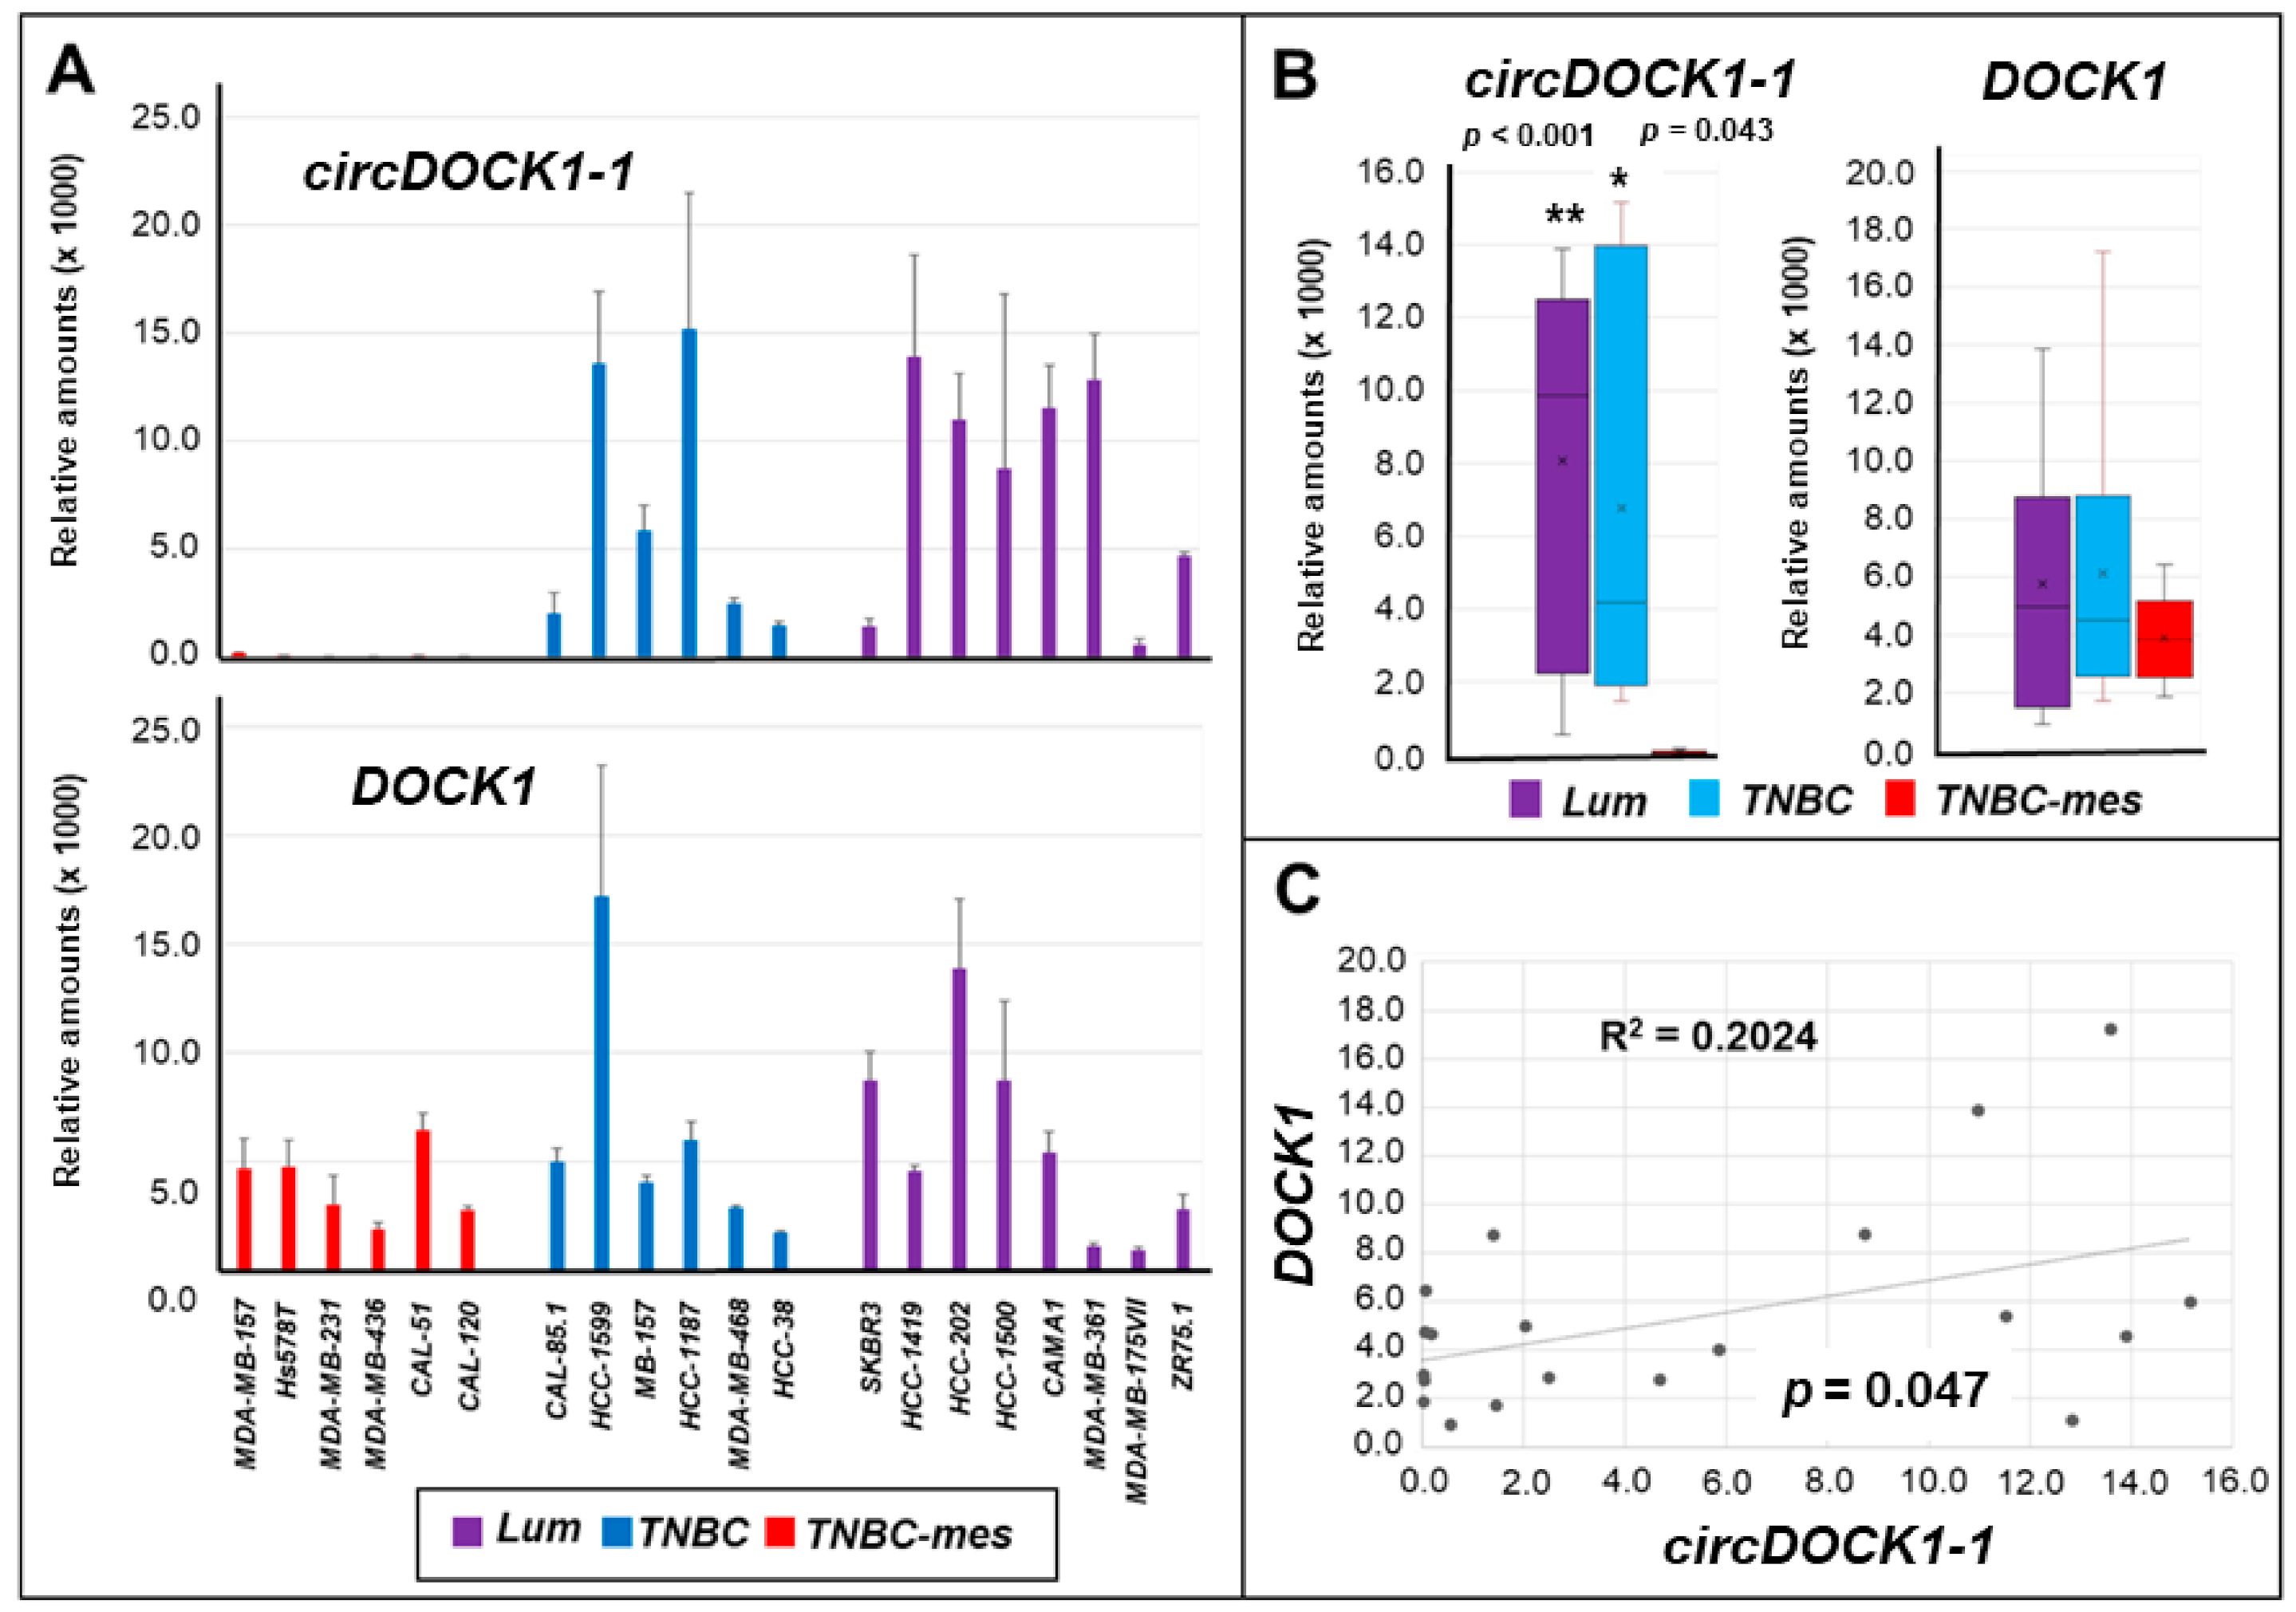
3.1. Expression of Selected circRNAs in Breast Cancer Cell Lines

To identify circRNAs potentially involved in the progression of breast cancer, we previously performed RNA-seq studies in HMLE (immortalized-human-mammary-epithelial) cells subjected to EMT by exposure to TGFβ (mesHMLE) [1]. Relative to the parental HMLE counterparts, mesHMLE cells showed upregulation of 11 circRNAs and downregulation of 4 circRNAs (Table 1).
We evaluated the expression of the selected circRNAs in 20 breast cancer cell lines recapitulating the heterogeneity of mammary tumours. The panel of cells consisted of three distinct groups, as indicated by principal component analysis (PCA) of the transcriptomic data obtained in each cell line by RNA-seq (Table S1 and Figure S1). The Lum group contained eight cell lines characterized by a luminal phenotype (Supplementary Materials): (a) oestrogen receptor-negative/progesterone receptor-negative/HER2-positive SKBR-3, HCC-202, and HCC-1419 cells; (b) oestrogen receptor-positive/progesterone receptor-negative/HER2-positive MDA-MB-361 cells; (c) oestrogen receptor-positive/progesterone receptor-negative/HER2-negative MDA-MB-175VII and ZR75.1 cells; and (d) oestrogen receptor-positive/progesterone receptor-positive/HER2-negative CAMA1 and HCC-1500 cells. The basal gene expression profiles separated the remaining cell lines, which are characterized by a triple-negative phenotype into two sub-groups, showing an epithelial (6 cell lines; TNBC) and a mesenchymal (6 cell lines; TNBC-mes) morphology (Supplementary Materials). ssGSEA of the RNA-seq data indicated that the gene expression profiles of TNBC-mes cells show a general up regulation of the EMT gene networks relative to the TNBC counterparts (Figure S2).
Within the group of 11 circRNAs showing upregulation in mesHMLE cells (Table 1), circSLC8A1 and circCCNB1 were found to be differentially expressed in the Lum, TNBC, and TNBC-mes groups (Figure 1). The levels of circSLC8A1 were significantly higher in TNBC-mes than in Lum cell lines (Figure 1A,B).
In our panel of cell lines, the amounts of circSLC8A1 and the linear SLC8A1 transcript were quantitatively correlated (Figure 1C). As for circCCNB1, TNBC cells were found to contain larger amounts of this RNA than the TNBC-mes counterparts (Figure 1D,E). Once again, the levels of circCCNB1 and linear CCNB1 RNAs were correlated (Figure 1F). The expression of all other circRNAs, which are upregulated in mesHMLE cells (circPVRL3, circSHPRH, circVEGFC, circBMPR2, circASXL1, circSMARCA5, circATXN2, circRTN4, and circSETD3), did not show any difference in Lum, TNBC, and TNBC-mes cells (Figures S3–S6). In conclusion, circSLC8A1 is the only upregulated circRNA whose expression profile in our breast cancer cell lines was found to be consistent with what is expected from the data obtained in HMLE and mesHMLE cells.
When we considered the four circRNAs characterized by downregulation in mesHMLE cells, circGNB1, circFGD6, and circTNFRSF21 showed variable, albeit similar, levels of expression in Lum, TNBC, and TNBC-mes cell. lines (Figures S7 and S8). A superimposable expression pattern is evident in the case of the linear GNB1, FGD6, and TNFRSF21 mRNAs.
As for circDOCK1-1, this is one of the 126 circular RNAs that can be produced from the DOCK1 (Dedicator of Cytokinesis 1) gene (hsa_circ_0020397; Table S2). In fact, DOCK1 is a very complex gene located on chromosome 10, consisting of 52 exons and coding for a series of variant proteins, which are guanine nucleotide exchange factors for the small Rho family G proteins [27,28,29]. The encoded proteins regulate the small GTPase Rac and influence various biological processes, including phagocytosis, cell migration, and proliferation. circDOCK1-1 is generated by back-splicing of exon 27 to exon 2. We assumed the intervening exons 3–26 are spliced to also be included in circDOCK1-1, as illustrated in Figure S9, but because the circRNA is only identified by the sequence across the back-splice junction, this remains to be confirmed. Lum and TNBC cells were found to express significant amounts of circDOCK1-1 (Figure 2A,B). In contrast, the TNBC-mes counterparts did not produce detectable levels of this circular-RNA, which is entirely consistent with circDOCK1-1 downregulation in mesHMLE cells. The lack of circDOCK1-1 expression in TNBC-mes cells is not due to the absence of the linear DOCK1 transcript, whose quantities were substantially similar in the TNBC-mes, Lum, and TNBC cellular subtypes (Figure 2A,B). In this case, too, a significant (p = 0.047), though low, correlation between the expression levels of circDOCK1-1 RNA and the corresponding linear transcript in the various cell lines was observed (Figure 2C).

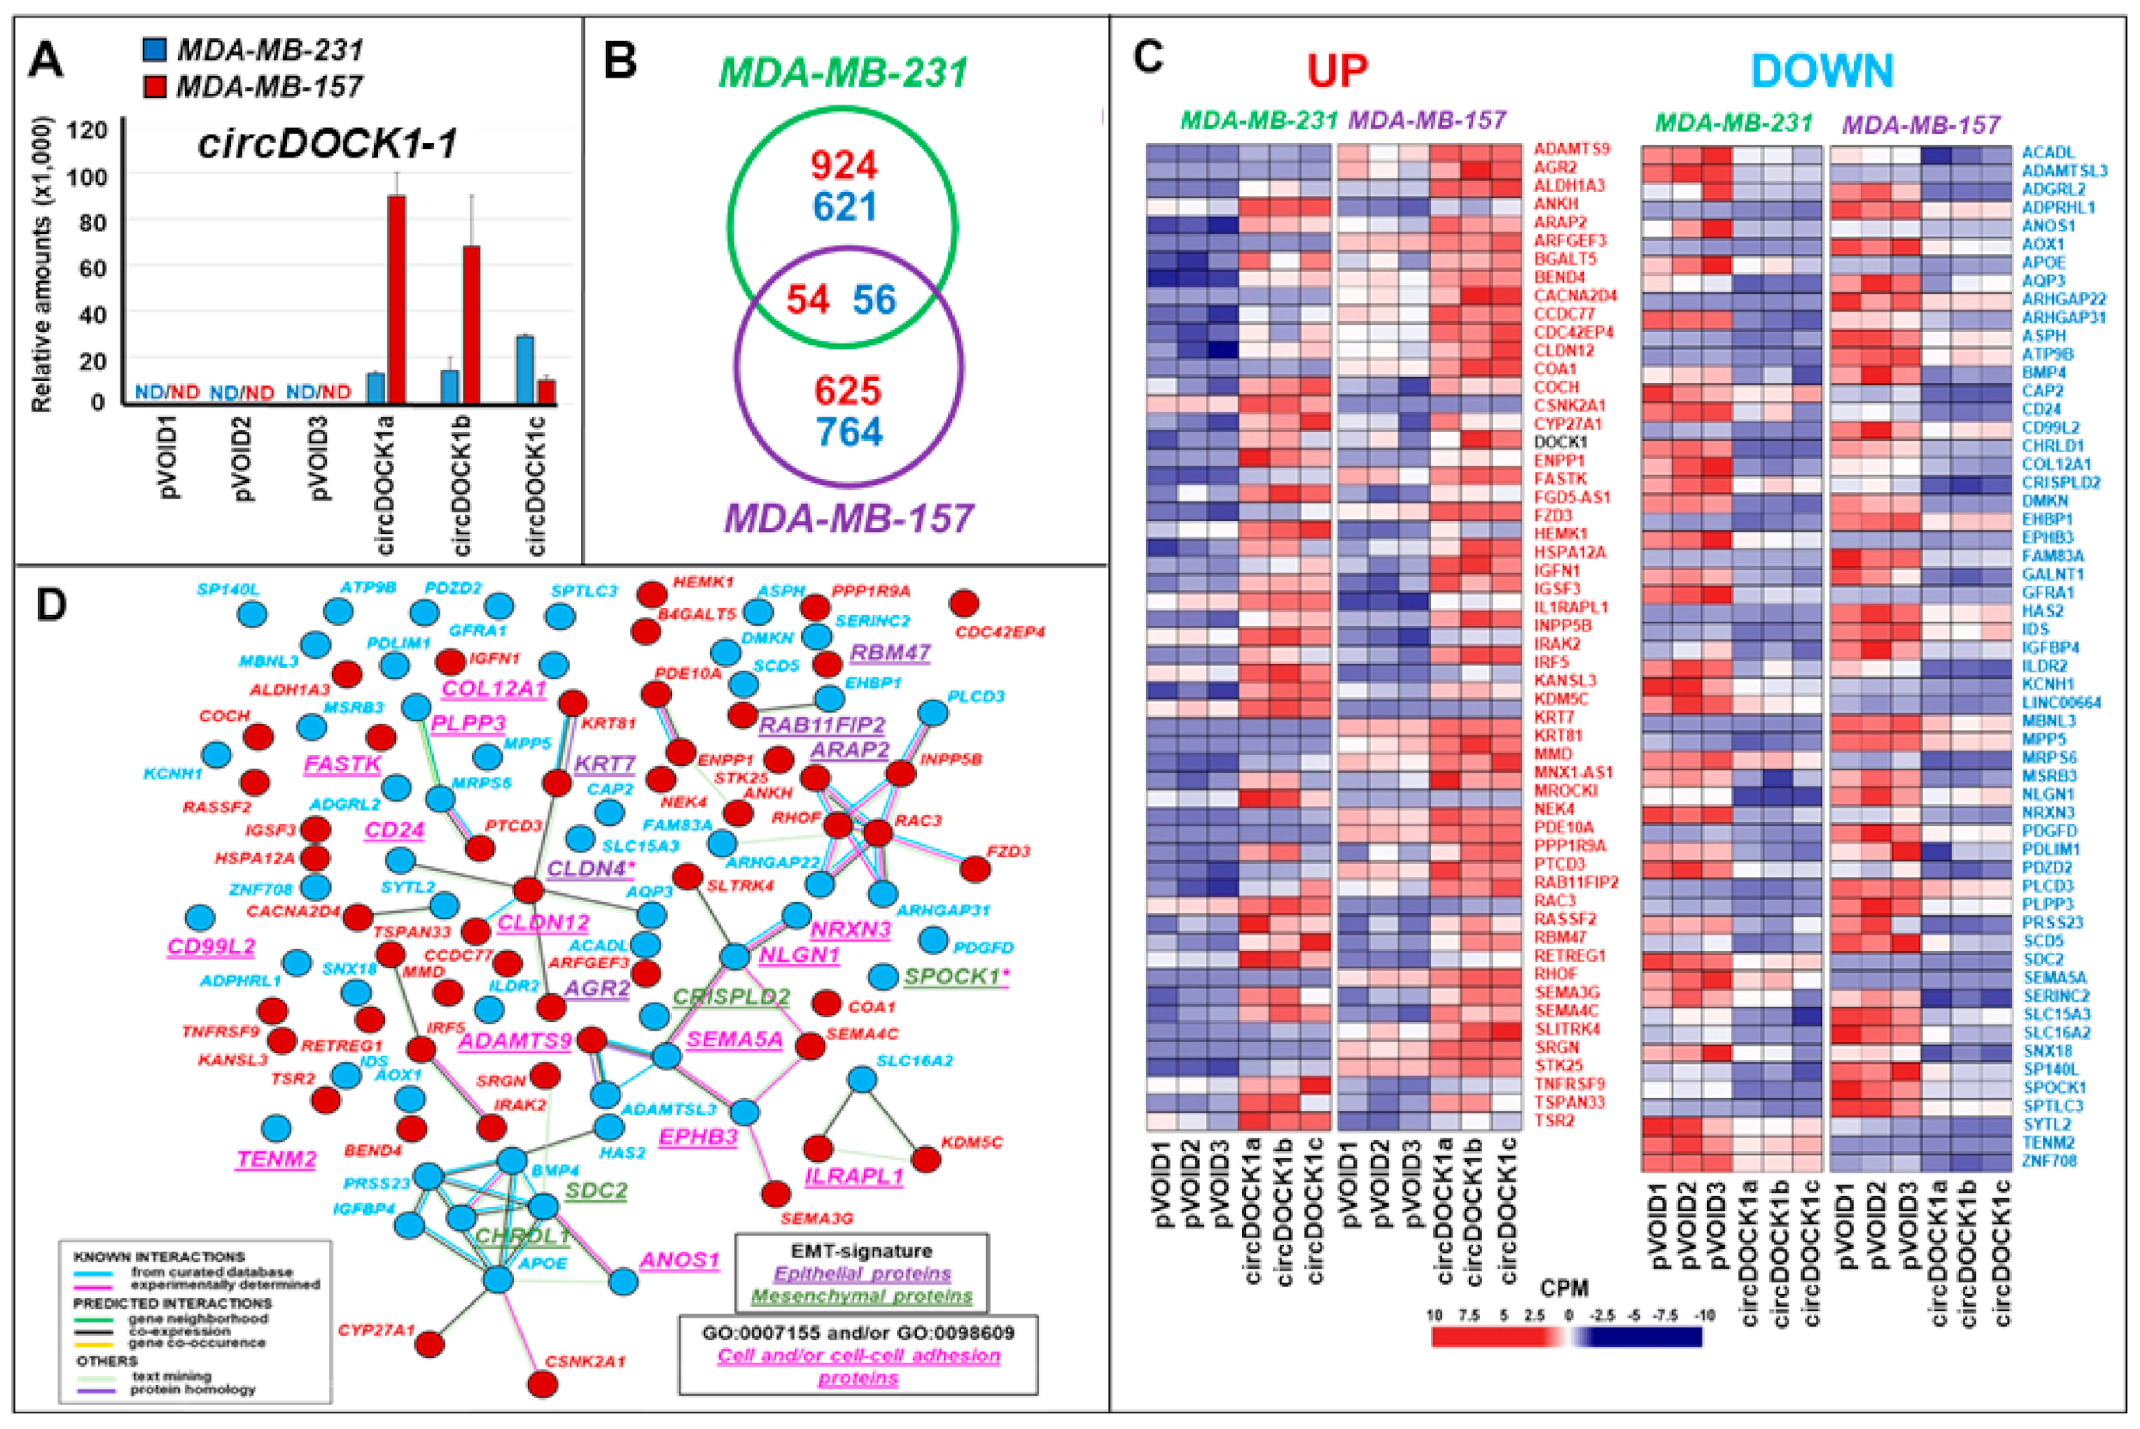
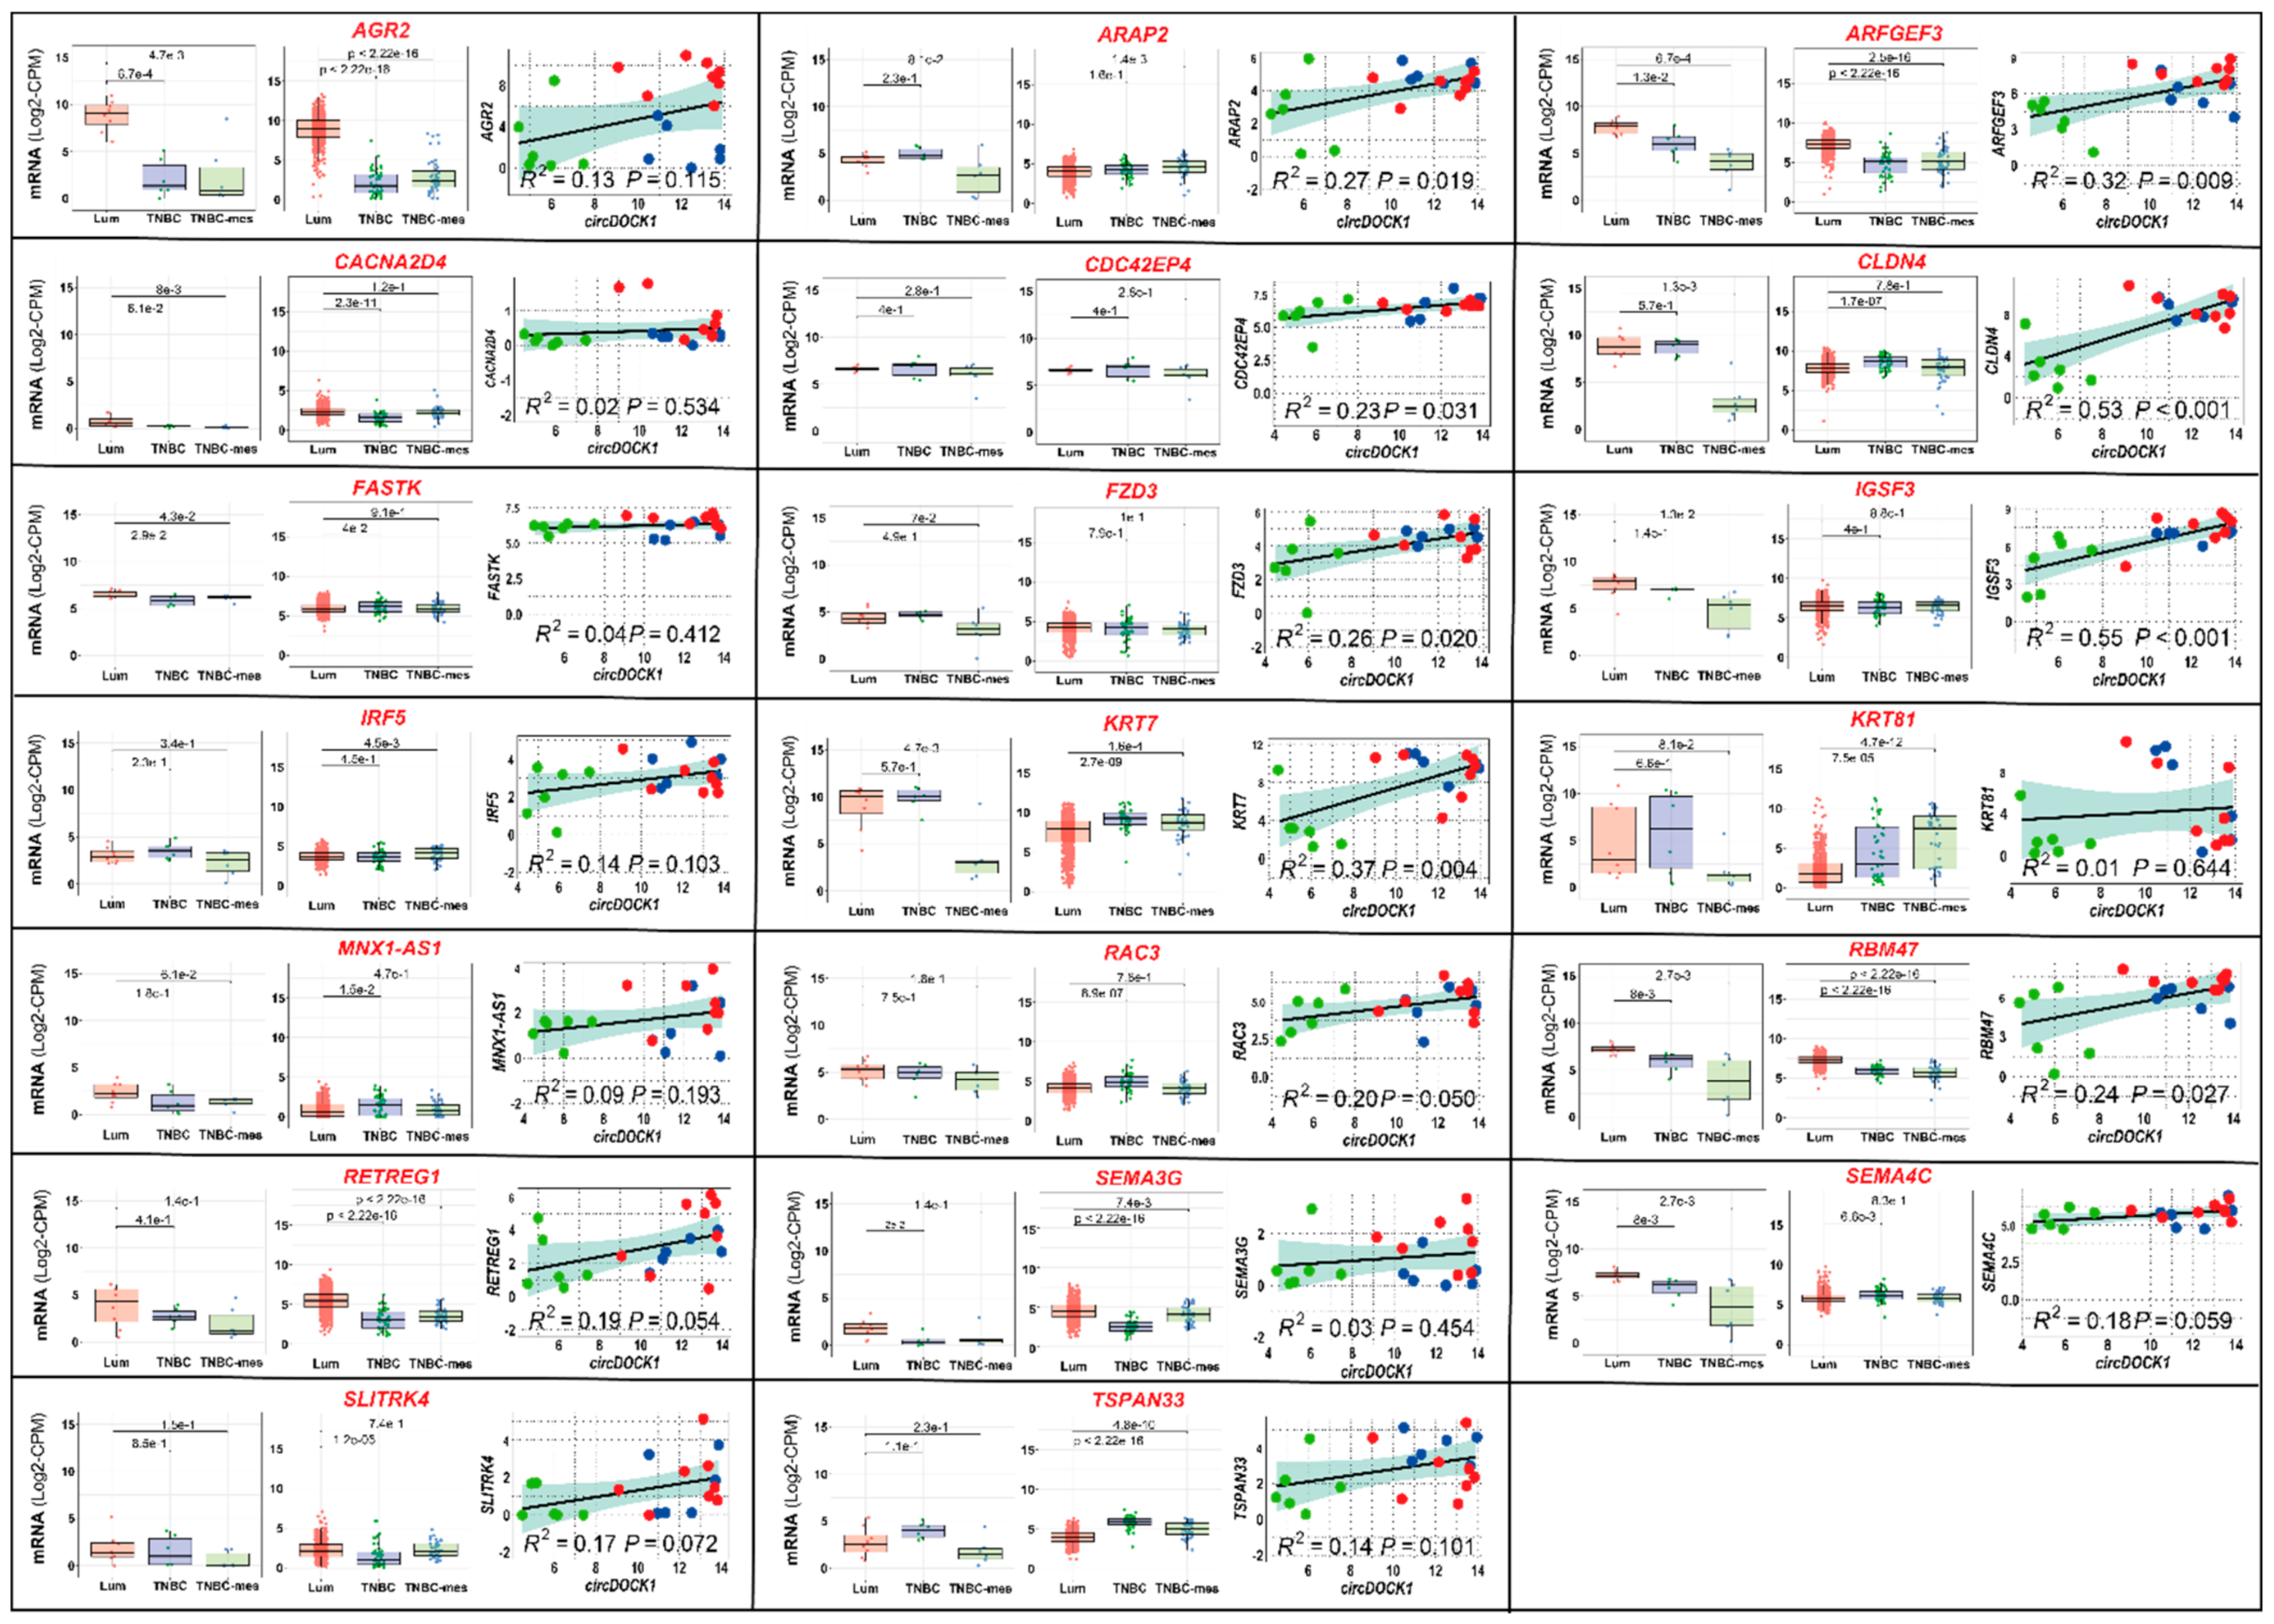
3.2. Transcriptomic Perturbations Afforded by circDOCK1-1 Overexpression in TNBC-Mes Cells

The results obtained suggest that circDOCK1-1 exerts an onco-suppressive activity in triple-negative breast cancer cells. To directly support this idea, we transfected the TNBC-mes MDA-MB-231 and MDA-MB-157 cell lines with a circDOCK1-1 construct and the corresponding empty vector (pVOID) as a negative control. Following selection in G418, we isolated three independent empty vector and circDOCK1-1-overexpressing cell clones (pVOID1; pVOID2; pVOID3; circDOCK1a; circDOCK1b; circDOCK1c) for each cell line. As expected, the pVOID-transfected MDA-MB-231 and MDA-MB-157 cells did not express detectable amounts of circDOCK1-1 (Figure 3A). In contrast, the MDA-MB-231 and MDA-MB-157 cells transfected with the circRNA construct produced levels of circDOCK1-1 that are similar to those detected in Lum and TNBC cell lines.
We subjected the MDA-MB-231- and MDA-MB-157-derived cells to RNA-seq analysis. In both MDA-MB-231 and MDA-MB-157 cells, where more than 24,000 RNAs were identified, circDOCK1-1 overexpression caused limited perturbations on the gene expression profiles (Figure 3B). In MDA-MB-231 cells, circDOCK1-1 was found to upregulate 978 and downregulate 677 transcripts (Table S3 and Figure S10A). In MDA-MB-157 cells, circDOCK1-1 upregulates 679 and downregulates 820 mRNAs (Table S3 and Figure S10B). The RNA-seq results were validated in both MDA-MB-231 and MDA-MB-157 for two upregulated (CYP27A1; SEMA3G) and two downregulated (IGFBP4; SDC2) genes using PCR (Figure S11). circDOCK1-1 overexpression upregulates 54 (including DOCK1) and downregulates 56 of these mRNAs in both MDA-MB-231 and MDA-MB-157 (Figure 3C and Table S3). Using the STRING database (https://string-db.org, accessed on 10 April 2021), we defined 10 “protein-interaction-networks”, five of which contain gene products involved in cell adhesion and cell–cell interactions (Figure 3D). This is consistent with the ssGSEA data that we obtained with the 110 genes regulated by circDOCK1-1 in both MDA-MB-231 and MDA-MB-157 cells (Table S3) that show an enrichment of elements belonging to the GO:0007155 (Cell Adhesion) and GO:0098609 (Cell-cell Adhesion) Gene Ontology pathways.
As the ssGSEA results further indicate that the two top enriched pathways (GO:0010769 and GO:0022604) control cell morphogenesis and differentiation, we evaluated whether circDOCK1-1 overexpression is associated with the induction of an epithelial phenotype. For this purpose, we investigated the epithelial/mesenchymal nature of the gene products commonly regulated by circDOCK1-1 in MDA-MB-231 and MDA-MB-157 cells, using the EMT gene signatures determined in breast cancer [30]. circDOCK1-1 caused a significant induction (Figure 3D) of various mRNAs coding for proteins annotated as epithelial (AGR2, ARAP2, CLDN4, KRT7, RAB11FIP2, and RBM47; see Supplementary Materials for the full name of the genes), whereas it downregulated different transcripts whose protein products are annotated as mesenchymal (CHRDL1, SDC2, CRISPLD2, and SPOCK1) (Figure 3D).
To confirm the data, we evaluated the expression of the up-/downregulated transcripts in TNBC-mes/TNBC/Lum cell lines and established correlations between the levels of these mRNAs and circDOCK1-1 in each cell line. As for the upregulated transcripts, the levels of 20 mRNAs, including AGR2, ARAP2, CLDN4, KRT7, and RBM47, tended to be lower in TNBC-mes than Lum cell lines (Figure 4, left box-plots). In 15 cases, this was accompanied by a significant direct correlation (R2 > 0.1) with circDOCK1 expression in TNBC-mes, TNBC, and Lum cell lines (Figure 4, right diagrams). Moreover, the expression profiles of AGR2, ARFGEF3, CACNA2D4, CDC42EP4, FZD3, RBM47, RETREG1, and SEMA3G reflect the situation observed in primary mammary tumours (Figure 4, middle box-plots; TCGA RNA-seq data). Finally, the amounts of the 11 mRNAs tend to be larger in TNBC-mes than Lum cell lines (Figure S12), while 22 genes are characterized by similar levels of expression in TNBC-mes and Lum cell lines (Figure S13).
As for the transcripts that are downregulated by circDOCK1-1 in MDA-MB-231 and MDA-MB-157 cells, the levels of 25 mRNAs tended to be higher in TNBC-mes than Lum cell lines (Figure 5, left boxplots). For the majority of these transcripts, the situation reflects what is observed in primary breast cancer specimens (Figure 5, middle boxplots). Only four of these mRNAs (ADGRL2, APOE, HAS2, and SDC2) are devoid of a significant inverse correlation with circDOCK1 (Figure 5, right diagrams; R2 < 0.1). In contrast, the levels of six mRNAs tend to be lower in TNBC-mes than Lum cells (Figure S14), while 24 transcripts show similar levels in TNBC-mes and Lum cells (Figure S15).
Overall, the results obtained support the idea that approximately one-third of the genes that are upregulated by circDOCK1-1 overexpression show higher levels in Lum and/or TNBC cells relative to the TNBC-mes counterparts, while a similar proportion of circDOCK1-1 downregulated genes are characterized by an opposite expression profile. The data are consistent with a potential involvement of this set of genes in the process of epithelial differentiation triggered by circDOCK1-1.

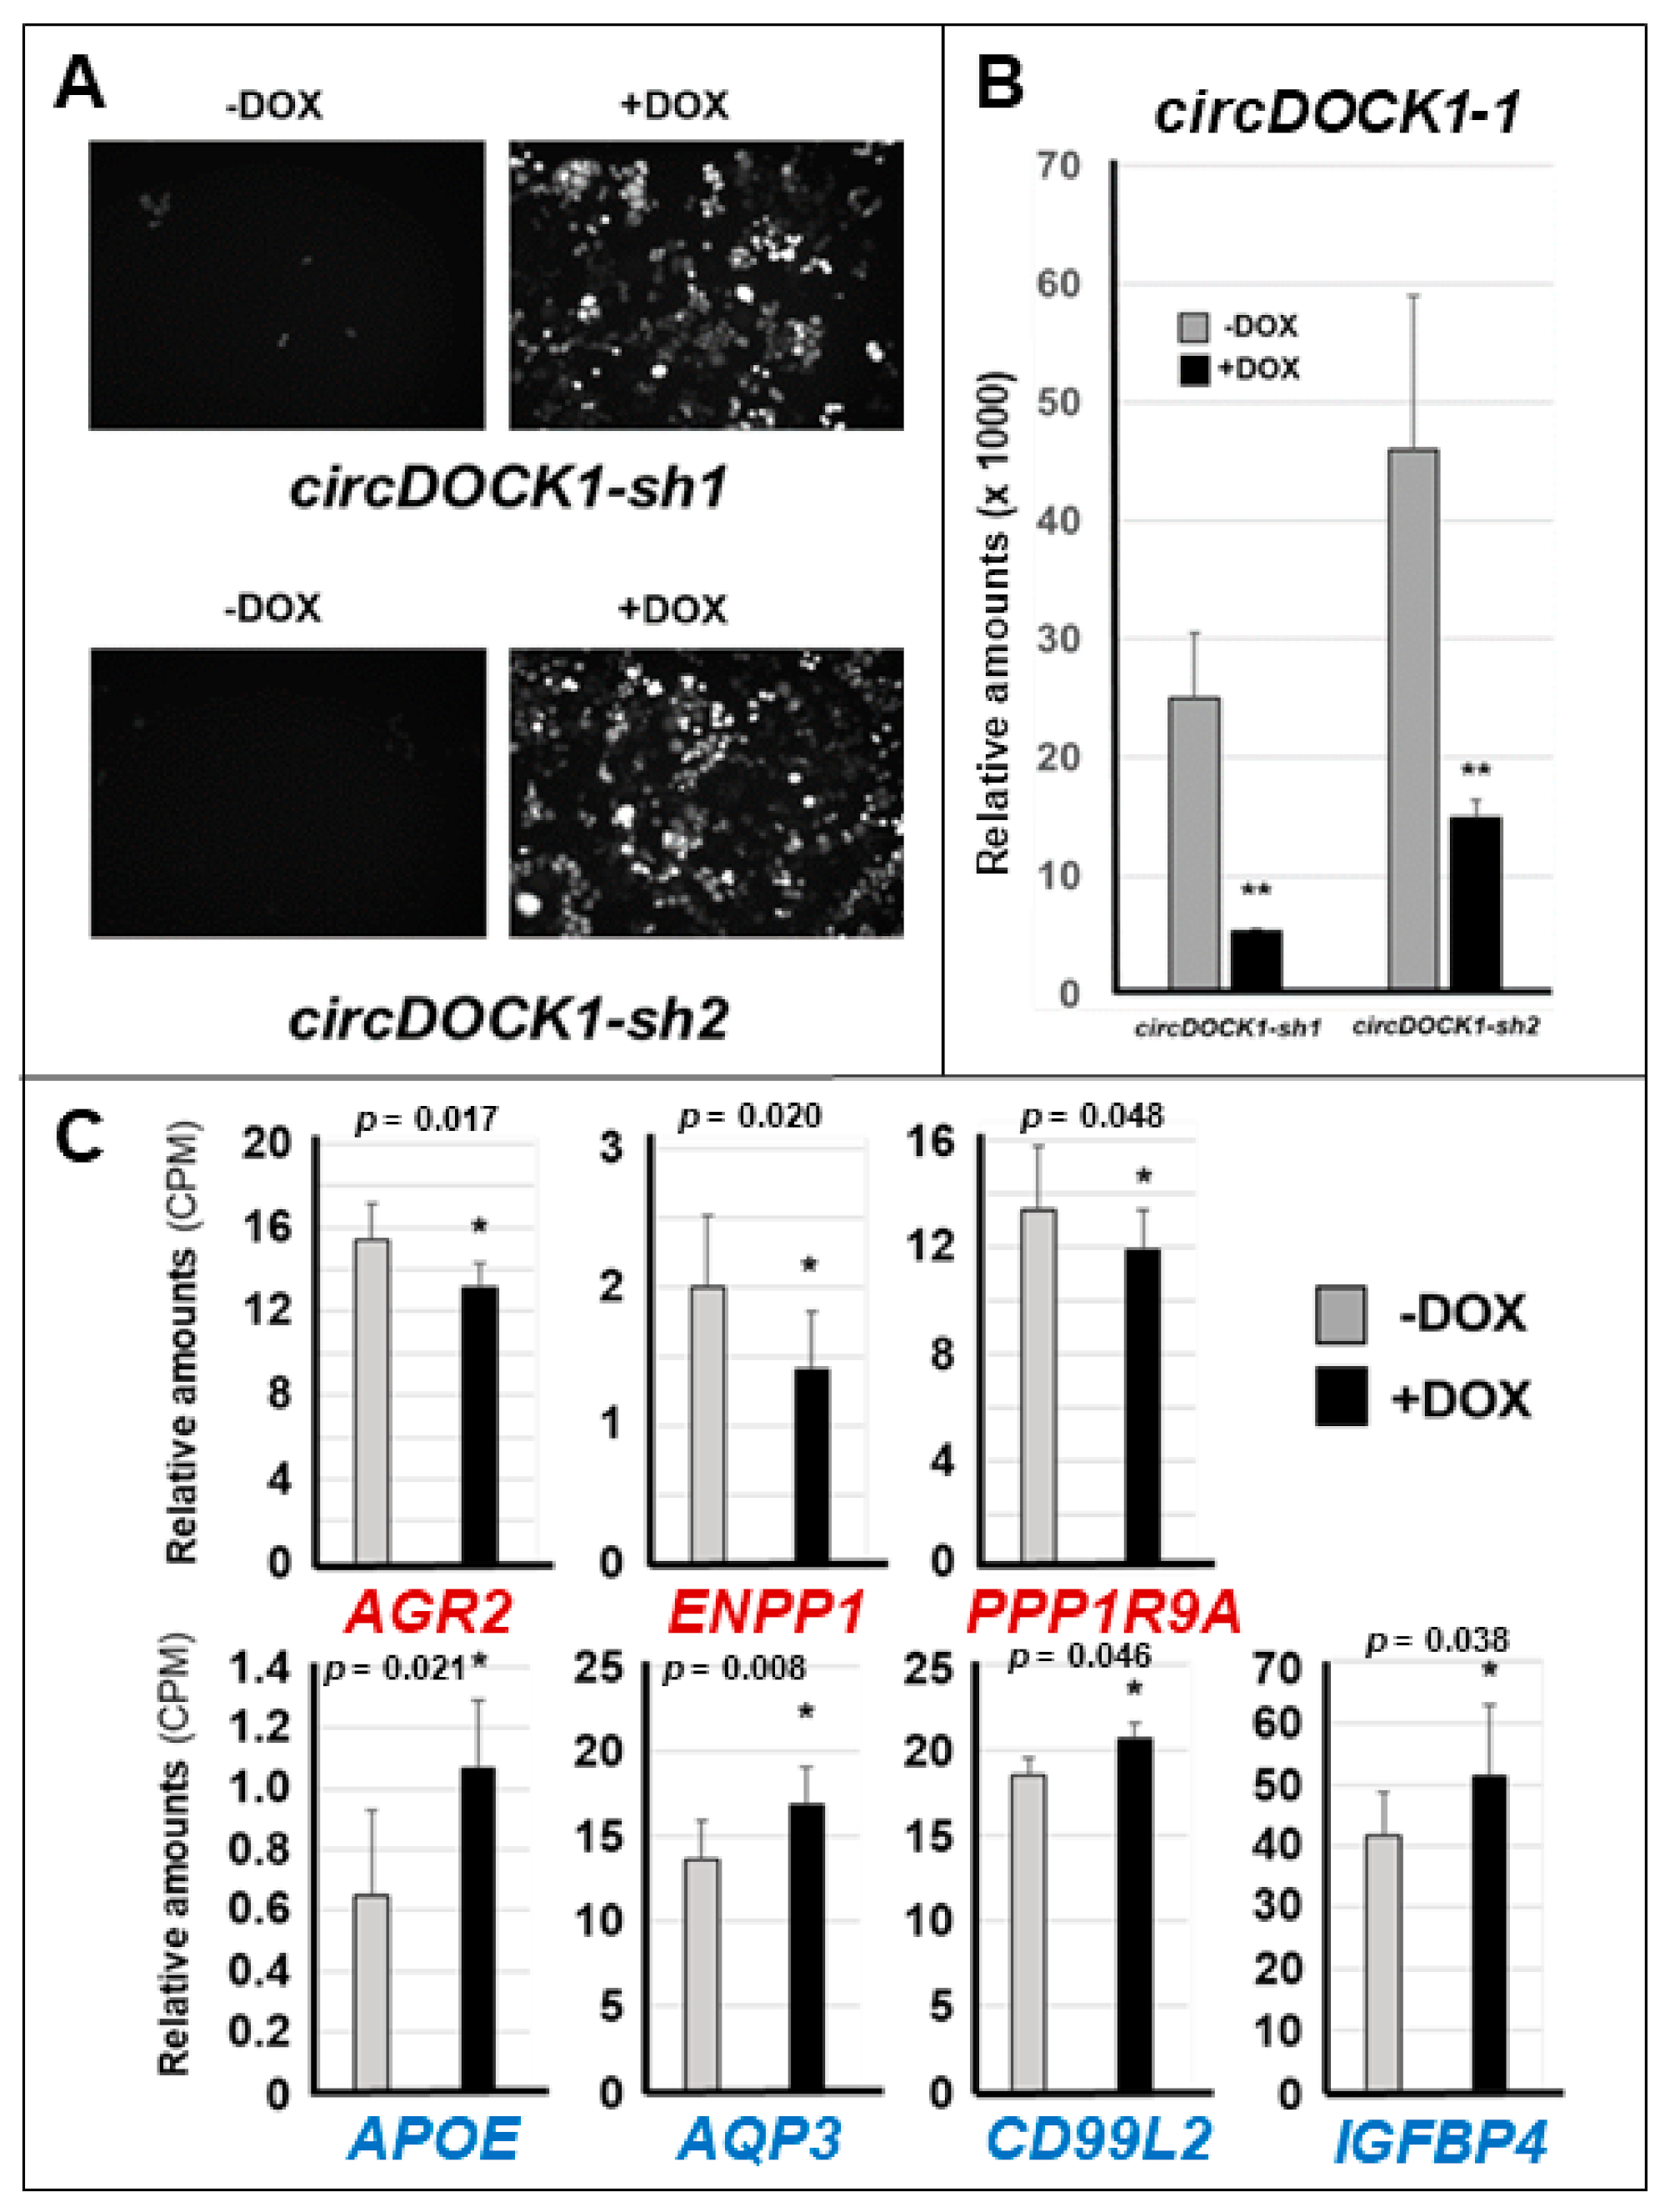
3.3. Effects of circDOCK1-1 Knockdown on the Gene Expression Profiles of Luminal CAMA-1 Cells

To obtain insights into the influence played by the luminal/mesenchymal phenotypes on the expression of circDOCK1-1-regulated genes, we silenced circDOCK1-1 in Lum CAMA-1 cells, which produce large amounts of endogenous circDOCK1-1 (Figure 2). CAMA-1 cells were infected with retroviral constructs containing two independent doxycycline (DOX)-inducible shRNAs targeting circDOCK1-1. Following infection, we isolated two puromycin-resistant CAMA-1 cell populations (circDOCK-sh1 and circDOCK-sh2) expressing each construct (Figure 6A). In these cellular populations, the production of the two shRNAs was monitored by the RFP (Red-Fluorescent-Protein) marker, whose expression is also DOX inducible (Figure 6A). As expected, DOX caused a significant downregulation of the circDOCK1-1 RNA in circDOCK-sh1 and circDOCK-sh2 cells (Figure 6B).
The two circDOCK-sh1 and circDOCK-sh2 cell lines were used to conduct RNA-seq studies in the presence/absence of DOX. The data obtained demonstrate that DOX upregulates 527 and downregulates 490 out of the 21,965 RNAs, which can be identified in the two cell lines (unadjusted p-value ≤ 0.05; Table S4). Among the 110 mRNAs whose expression is modulated by circDOCK1-1 overexpression in MDA-MB-231 or MDA-MB-157 cells, only AGR2, ENPP1, PPP1R9A, APOE, AQP3, CD99L2, and IGFBP4 show a reversed regulation in circDOCK1-1-silenced CAMA1 cells (Figure 6C). Indeed, AGR2, ENPP1, and PPP1R9A are up- and downregulated, respectively, by circDOCK1-1 overexpression and circDOCK1-1 silencing, while the opposite is true in the case of APOE, AQP3, CD99L2, and IGFBP4. AGR2, ENPP1, PPP1R9A APOE, AQP3, and IGFBP4 are part of various common gene networks involved in cell differentiation and development (Table S3). This is consistent with the involvement of the corresponding gene products in the processes of epithelial differentiation activated by circDOCK1 in mesenchymal MDA-MB-157 and MDA-MB-231 cells. To define potential off-target effects, we measured the levels of DOCK1 mRNA in CAMA1 cells exposed to vehicle (−DOX) and DOX (+DOX). We did not observe any significant difference in the expression levels of the DOCK1 transcript (−DOX = 128.8 ± 5.3 CPM; +DOX = 117.2 ± 16.2 CPM; p-value (+DOX vs. −DOX = 0.146). These data support the idea that circDOCK1-1 knockdown does not lead to significant off-target effects.

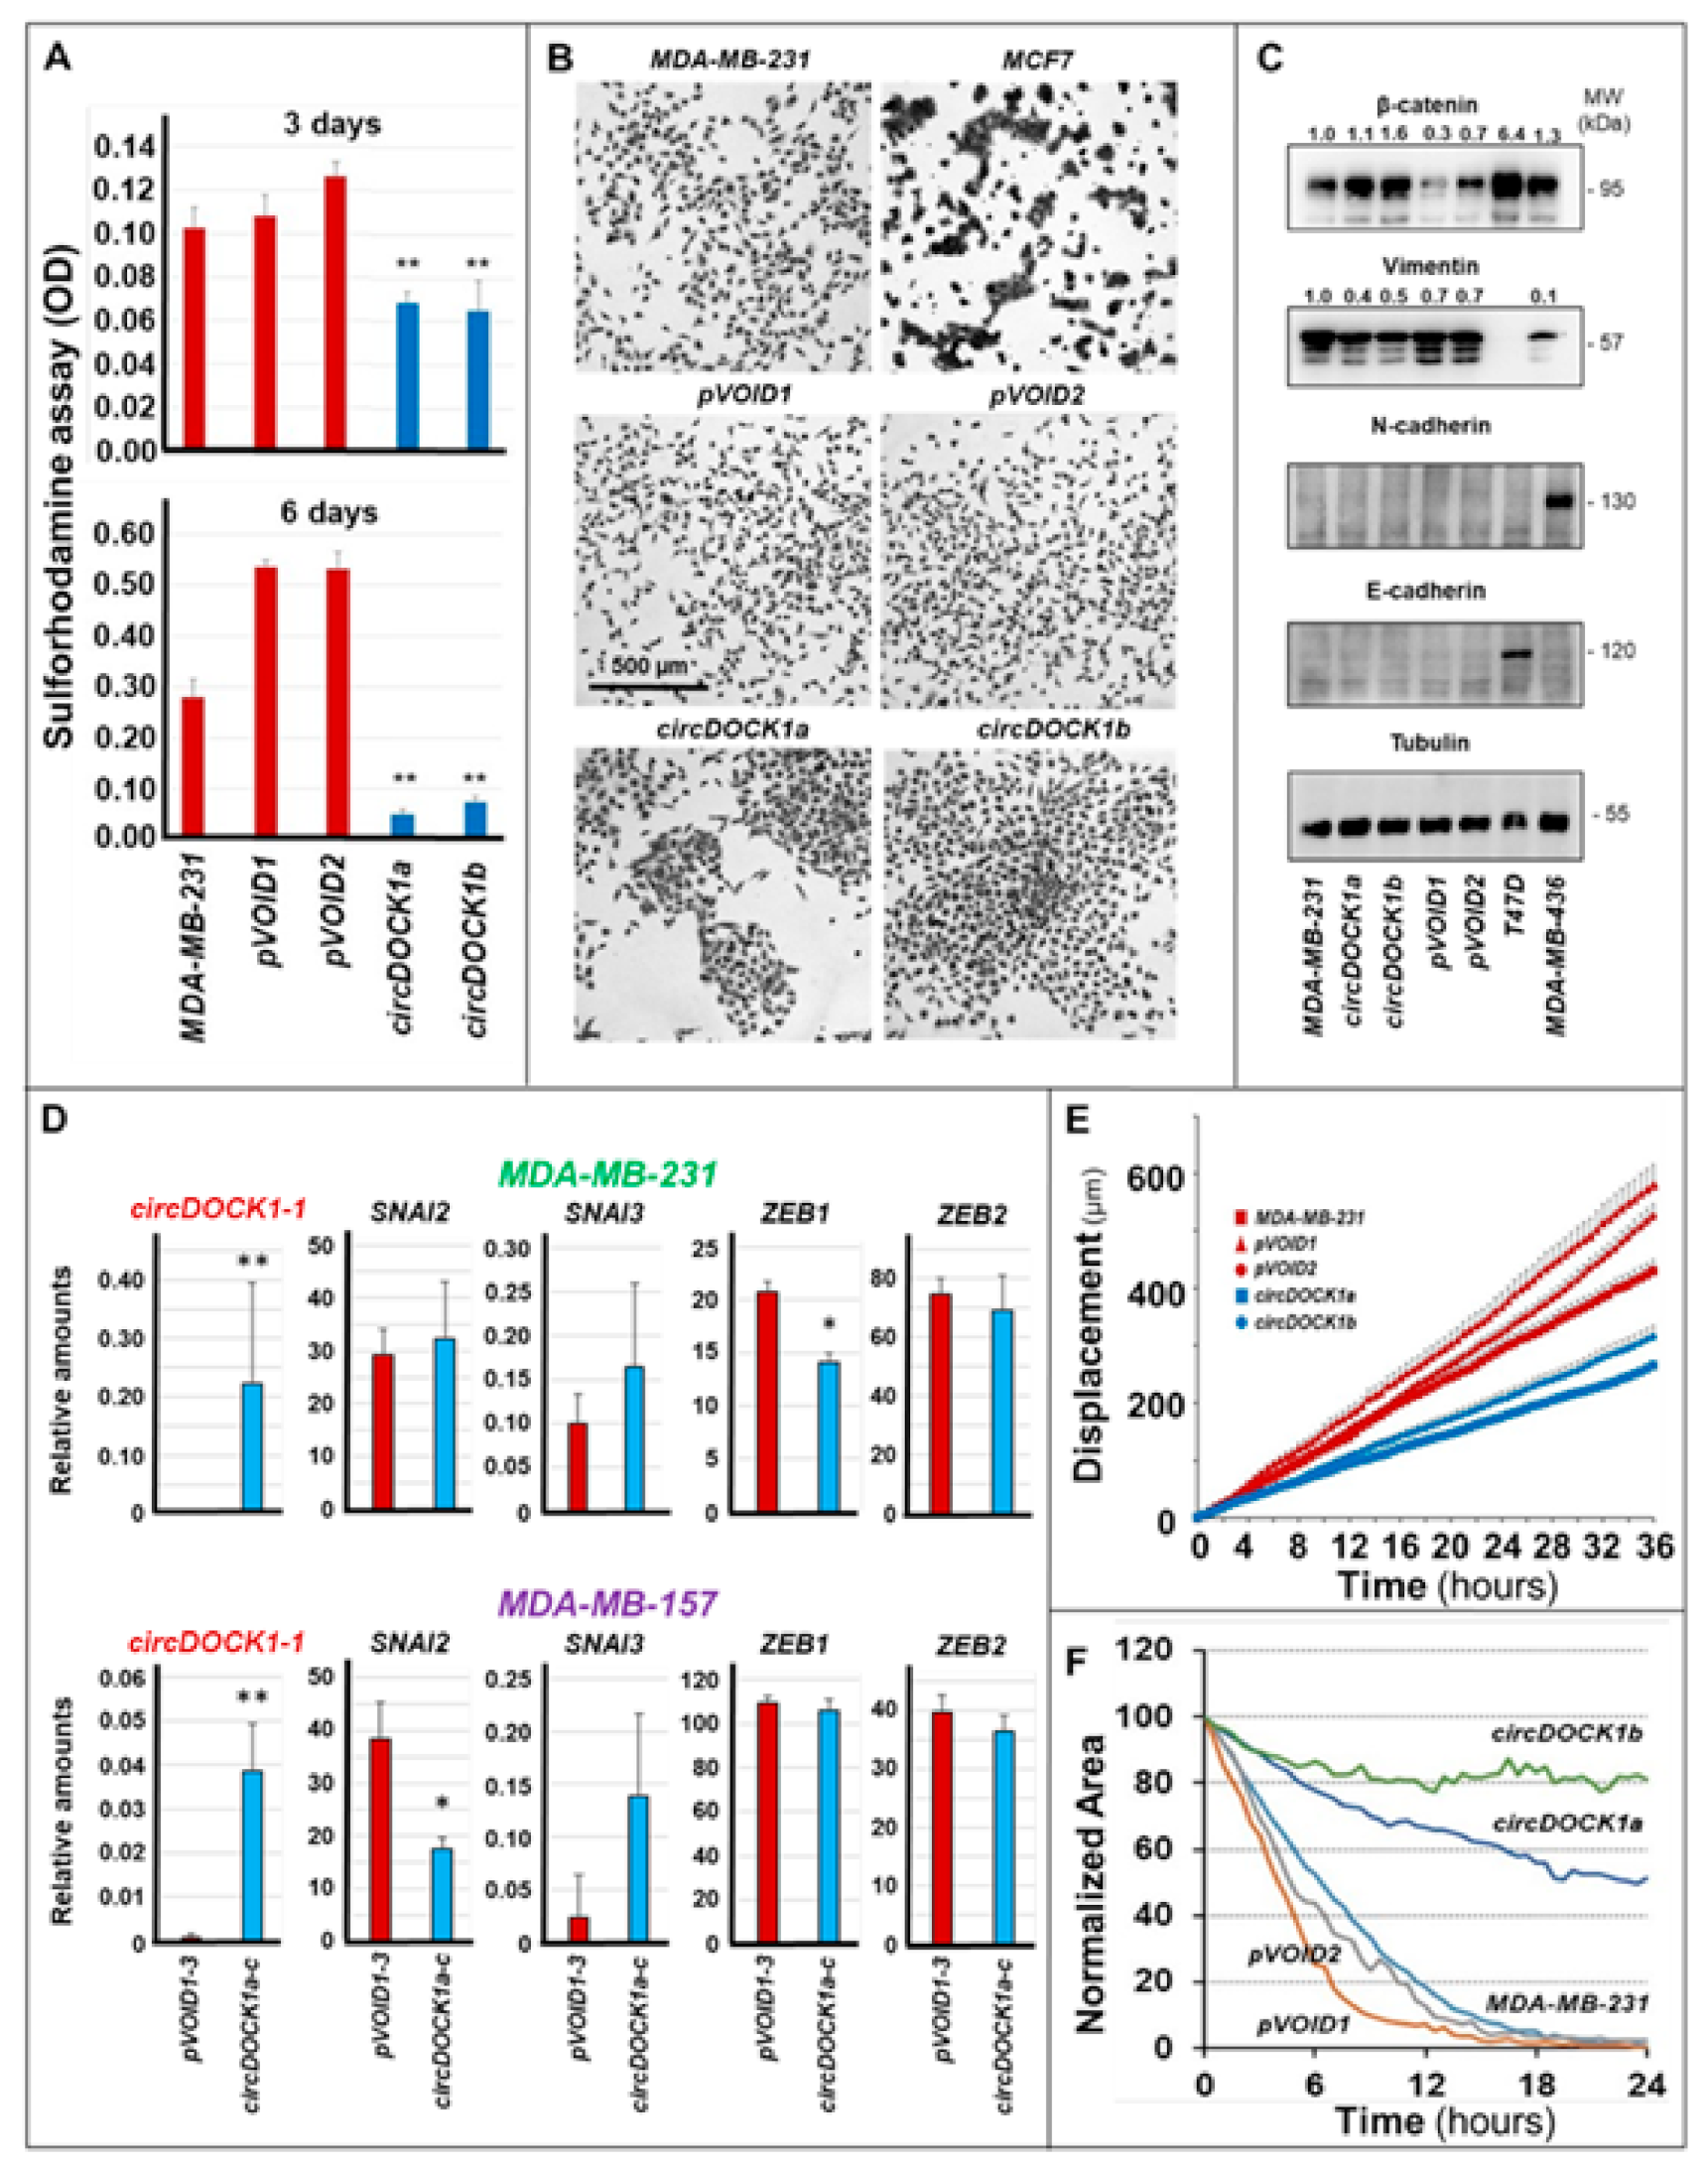
3.4. Involvement of circDOCK1-1 in the Growth, Differentiation, and Motility of Breast Cancer Cells

The data obtained in breast cancer cells indicate that circDOCK1-1 is involved in the generation/maintenance of the epithelial phenotype, which is characterized by a decrease in the proliferation rate and motility as well as an increase in cell–cell interactions relative to the mesenchymal counterpart. Thus, we evaluated the effects of circDOCK1-1 in our genetically engineered MDA-MB-231 cells. In basal conditions, control pVOID1/pVOID2 and parental MDA-MB-231 cells show similar growth rates (Figure 7A). In the same situation, the basal growth of circDOCK1a and circDOCK1b cells overexpressing circDOCK1-1 is substantially reduced. In addition, pVOID1/pVOID2 and parental MDA-MB-231 cells grow in a scattered fashion and show the characteristic elongated structure of mesenchymal cells (Figure 7B). In contrast, circDOCK1a and circDOCK1b cells tend to form aggregates due to increased cell–cell interactions and show an epithelial-like morphology, which is typical of breast cancer Lum cells, as exemplified by the MCF7 cell line.
The results described above support the concept that circDOCK1-1 overexpression in TNBC-mes cells activates a process of epithelial differentiation. Consistent with this idea, β-catenin, an epithelial protein often upregulated in luminal breast cancer [31,32], was significantly induced by circDOCK1-1 overexpression in MDA-MB-231 cells (Figure 7C). Although MDA-MB-231 cells do not express detectable amounts of the mesenchymal marker, N-cadherin, it is interesting to notice that circDOCK1a/circDOCK1b cells showed lower levels of vimentin, another mesenchymal marker protein [33], than pVOID1/pVOID2 cells (Figure 7C). This is consistent with the idea that circDOCK1-1 is indeed inducing an epithelial phenotype. Nevertheless, the process of epithelial differentiation ignited by the circular RNA in the TNBC-mes cell line is likely to be incomplete, as E-cadherin, a late epithelial markers [34], was undetectable in either pVOID1/pVOID2 or circDOCK1a/circDOCK1b cells (Figure 7C). Moreover, endogenous circDOCK1-1 is unlikely to induce an epithelial phenotype via downregulation of any of the four transcription factors that activate EMT, i.e., SNAI2, SNAI3, ZEB1, and ZEB2 [35,36,37]. Indeed, the RNA-seq data indicate that circDOCK1-1 does not alter the expression of SNAI3 and ZEB2 in either the MDA-MB-231 or the MDA-MB-157 cellular context, while it downregulates SNAI2 only in MDA-MB231 cells and ZEB1 only in MDA-MB-157 cells (Figure 7D).
Epithelial differentiation and increased cell–cell interactions are generally accompanied by effects on random and directional motility, which are primary determinants of the invasive/metastatic behaviour of mesenchymal breast cancer cells. Consistent with the observed effects of circDOCK1-1 on differentiation/adhesion, circDOCK1a/circDOCK1b cells showed a significant reduction in random motility relative to the parental MDA-MB-231 cells and pVOID1/pVOID2 controls (Figure 7E), as indicated by time-lapse assays. A similar decrease in the directional motility of circDOCK1a and circDOCK1b cells was observed when the various MDA-MB-231-derived cell populations were subjected to wound-healing assays. Indeed, the wound was entirely closed by parental and pVOID1/pVOID2 cells within 24 h, while less than 50% and 20% of the wound area was filled by circDOCK1a/circDOCK1b cells (Figure 7F). The results obtained on random and directional motility were validated by similar studies performed with an independent MDA-MB-231 clone transfected with circDOCK1-1 (circDOCK1c) and empty (pVOID3) vectors (Figure S16A,B).

4. Discussion

A better definition of the role played by specific circular RNAs in the growth and progression of solid tumours with particular reference to the different types of breast cancer is of great relevance. In fact, this type of information is likely to provide new clues for the design of innovative strategies in the context of the stratified/personalized treatment of mammary tumours, which are a highly heterogeneous collection of different diseases.
In the present study, we identified one of the 126 circular RNAs (Table S2; http://www.circbase.org/, accessed on 12 May 2021) that originate from the DOCK1 gene (circDOCK1-1; hsa_circ_0020397) as a positive regulator of the epithelial differentiation of mammary tumour cells. Indeed, the data obtained in a large panel of cell lines, recapitulating the heterogeneity of breast cancer, indicate that circDOCK1-1 is undetectable in cultures of TNBC cells with a mesenchymal phenotype (TNBC-mes), while it is highly expressed in Lum and TNBC cells characterized by an epithelial phenotype.
Forced expression of circDOCK1-1 in two representative TNBC-mes cell lines (MDA-MB-231; MDA-MB-157) caused the upregulation of genes encoding epithelial proteins and the downregulation of genes encoding mesenchymal proteins. Our RNA-seq data indicate that circDOCK1-1 induces and maintains certain traits of the epithelial phenotype in breast cancer cells via the direct or indirect regulation of approximately 100 target genes.
A significant proportion of the genes up- and downregulated by circDOCK1-1 in MDA-MB-231 and MDA-MB-157 cells code for proteins that control cell-to-cell contacts and cell adhesion, two parameters that are generally increased in luminal/epithelial relative to mesenchymal breast cancer cells. Among the genes upregulated by circDOCK1 in the two TNBC-mes cells and belonging to the protein-interactome networks identified (Figure 3D), ARAP2 and IRF5 are of particular interest. ARAP2 codes for an epithelial protein involved in the formation of focal adhesions [38]. ARAP2 upregulation suggests that circDOCK1-1 stimulates the generation of focal adhesions, which connect the actin cytoskeleton with the extracellular matrix and play a critical role in cell survival, proliferation, and movement. IRF5 is a transcription factor and its loss increases the motility and contributes to the activation of the metastatic behaviour of breast cancer cells [39,40]. Among the downregulated genes, EPHB3 (EPH-receptor-B3) is of particular relevance. EPHB3 is an ephrin-binding membrane receptor, which facilitates cell adhesion [41], enhancing the migration and promoting the metastatic behaviour of lung cancer cells [42]. In addition, high EPHB3 levels are associated with poor survival in breast cancer patients, which supports its oncogenic and pro-metastatic properties [43]. To restrict the number of genes that may be causally involved in circDOCK1-1-induced epithelial differentiation, we performed silencing experiments in a Lum cell-line (CAMA-1) characterized by high levels of circDOCK1-1 expression. The RNA-seq studies performed in this model resulted in the identification of seven genes: AGR2, ENPP1, PPP1R9A, APOE, AQP3, CD99L2, and IGFBP4, whose expression pattern is opposite to that observed upon circDOCK1-1 overexpression. circDOCK1-1 knockdown increases the levels of the AGR2, ENPP1, and PPP1R9A transcripts, while it decreases the amounts of the APOE, AQP3, CD99L2, and IGFBP4 mRNAs. AGR2, APOE, AQP3, and CD99L2 may be of particular interest for the epithelial differentiating action exerted by circDOCK1-1 in TNBC-mes breast cancer cells. AGR2 is a protein disulfide isomerase [44] and it is expressed almost exclusively in luminal breast tumours [45], where it is positively regulated by the oestrogen receptor. In the mammary gland, AGR2 is believed to promote lobulo-alveolar development, which is consistent with the role exerted in the intestine, where the protein is implicated in maintaining the epithelial barrier [46]. APOE controls the differentiation and morphogenesis of neuronal cells [47], while AQP3 may have a role in kidney development [48]. CD99L2 is encoded by one of the six mesenchymal genes, which are part of an EMT signature in ovarian carcinoma [49]. In mesenchymal-like ovarian cancer cells, silencing of CD99L2 causes colony compaction, indicating that the protein plays a negative role in cell-to-cell adhesion.
As for the potential mechanisms underlying the regulatory action of circDOCK1-1 on the expression of a large number of target genes identified in our study, protein and microRNA sponging effects may be considered. Indeed, one of the hypothesized mechanisms underlying the gene regulatory action of circular RNAs is related to the ability of these molecules to act as sponges for specific proteins and microRNAs [50,51]. To obtain initial insights into the problem, we focused our attention on microRNAs that may exert a regulatory action on the AGR2, ENPP1, and PPP1R9A genes, which are upregulated by forced expression and silencing of circDOCK1-1. In fact, our data are consistent with the idea that circDOCK1-1 may be a direct regulator of these genes in breast cancer cells. To predict microRNAs that may bind each of the three mRNAs mentioned above and circDOCK1-1 contemporaneously, we used an in silico approach (http://mirdb.org/mirdb/custom.html, accessed on 10 September 2021). The results of this analysis (Table S5) indicate that the AGR2, ENPP1, and PPP1R9A mRNAs have the potential to bind four, eight, and four microRNAs, which can interact with the circDOCK1-1 RNA as well. Noticeably, the transcriptomic results available in the CCLE and TCGA databases support the idea that the only microRNAs for which there is evidence of expression in breast cancer cell lines or tissues are hsa-mir-539-3p and hsa-miR-545-3p. Thus, circDOCK1-1 may increase the expression of AGR2, ENPP1, and PPP1R9A transcripts via a sponging effect exerted on hsa-mir-539-3p, hsa-miR-545-3p, and/or some of the other microRNAs identified in Table S5 Clearly, further functional studies are needed to confirm the hypothesized molecular mechanism of action and the potential involvement of microRNAs in the process of epithelial differentiation activated by circDOCK1-1 in TNBC-mes breast cancer cells.
Taken together, the results obtained in this study suggest that circDOCK1-1 is endowed with antioncogenic properties in breast cancer, as it seems to favour epithelial differentiation and reduce the proliferation as well as the motility/invasiveness of tumour cells characterized by a mesenchymal phenotype. To the best of our knowledge, no data are available on the expression levels or functional activity of any of the 126 circDOCK1 RNAs, including circDOCK1-1, in triple-negative breast cancer. However, a certain amount of relevant data on the functional role played by circDOCK1 RNAs in other types of tumours is present in the scientific literature. As an example, Zhang et al. recently reported that circDOCK1-1 expression is high in colorectal cancer cells and forced expression of the circular RNA increased the viability and invasive properties of cells derived from this tumour, suggesting a pro-oncogenic action [52]. This may support the idea that the role played by circDOCK1-1 in regulating the homeostasis of cancer cells is tumour type specific. To further complicate the issue, it should be noticed that another member of the DOCK1 family of circular RNAs, i.e., hsa_circ_0020394 (see Table S2), has been shown to promote the progression of bladder cancer via the has-miR-132-3p/SOX5 signalling pathway [53]. All this is likely to spur interest in the conduction of studies aimed at elucidating the physio-pathological function of circDOCK1-1 and other members of this circular-RNA family in breast cancer and other tumour types.

5. Conclusions

The results of the study are of basic interest, as they provide novel insights into the role played by specific circRNAs in the generation and progression of breast cancer. In fact, our data identified circDOCK1-1 as an important regulator of the epithelial differentiation of mammary tumour cells. In addition, the high-throughput transcriptomic studies performed provide information on the number and type of genes that are regulated by circDOCK1-1, casting new light on the gene networks involved in the processes underlying the development of mammary tumours. Our results further indicate that circDOCK1-1 controls cell–cell adhesion and consequently random as well as directional motility. Besides their interest from a basic point of view, the data generated may be of translational relevance, as they suggest that strategies aimed at increasing the amounts or at stimulating the activity of circDOCK1-1 may be of significance for the treatment of a subset of triple-negative breast cancer patients.

Supplementary Materials

The following are available online at https://www.mdpi.com/article/10.3390/cancers13215325/s1, Supplementary Methods, Figure S1: Principal Component Analysis of the RNA-seq data obtained in a panel of selected breast cancer cell-lines, Figure S2: Morphological features of representative cell-lines belonging to the Lum, TNBC and TNBC-mes groups, Figure S3: Clustering of the breast cancer cell-lines according to single-sample GSEA, Figure S4: Breast cancer cell-lines expression profiles of the circRNAs up-regulated in HMLE-mes cells, Figure S5: Expression of circPVRL2, circSHPRH, circVEGFC circRNAs and PVRL2, SHPRH, VEGFC linear mRNAs in our panel of breast cancer cell-lines, Figure S6: Expression of circBMPR2, circASXL1, circSMARCA5 circRNAs and BMPR2, ASXL1, SMARCA5 mRNAs in our panel of breast cancer cell-lines, Figure S7: Expression of circATXN2, circRTN4, circSETD3 circRNAs and ATXN2, RTN4, SETD3 mRNAs in breast cancer cell-lines, Figure S8: Breast cancer cell-lines expression profiles of the circRNAs down-regulated in HMLE-mes cells, Figure S9: Expression of circGNB1, circFGD6, circTNFRSF21 circRNAs and GNB1, FGD6, TNFRSF21 mRNAs in breast cancer cell-lines, Figure S10: Effects of circDOCK1 over-expression on the gene expression profiles of the MDA-MB231 and MDA-MB-157 cell-lines, Figure S11: Validation of the RNA-seq results on two up-regulated and two down-regulated genes by PCR analysis, Figure S12: Expression profiles of some of the genes up-regulated by circDOCK1 in breast cancer cell-lines and tumor specimens, Figure S13: Expression profiles of some of the genes up-regulated by circDOCK1 in breast cancer cell-lines and tumor specimens, Figure S14: Expression profiles of some of the genes down-regulated by circDOCK1in breast cancer cell-lines and tumor specimens, Figure S15: Expression profiles of some of the genes down-regulated by circDOCK1 in breast cancer cell-lines and tumor specimens, Figure S16: Effects of circDOCK1 over-expression on random motility and wound-healing, Table S1: RNA-seq analysis of the breast cancer cell-lines grown under basal conditions, Table S2: RNA-seq analysis of the perturbations afforded by forced expression of circDOCK1 in the MDA-MB-231 and MDA-MB-157 breast cancer cell-lines, Table S3: RNA-seq analysis of the perturbations afforded by circDOCK1 silencing in the CAMA1 breast cancer cell-line, Table S4: List of microRNAs predicted to interact with circDOCK1, Table S5: microRNAs predicted to bind the circDOCK1-1 RNA, the AGR2, ENPP1 and the PPP1R9A mRNAs.

Author Contributions

Conceptualization, M.T., E.G. and G.J.G.; methodology, M.K., D.L., G.P., M.G. and M.T.; resources, M.K.; validation, D.L., E.G. and M.T.; software, M.B. and L.G. formal analysis, M.B. and L.G.; investigation, M.K., M.T., D.L., A.Z., M.G. and G.P.; data curation, M.B., D.L. and L.G.; writing—original draft preparation, E.G.; writing—review and editing, E.G., M.T., D.L. and G.J.G.; supervision, M.T., E.G. and G.J.G.; project administration, E.G.; funding acquisition, E.G. and G.J.G. All authors have read and agreed to the published version of the manuscript.

Funding

Grants from the Associazione Italiana per la Ricerca contro il Cancro (AIRC) and the Fondazione Italo Monzino to EG and the National Breast Cancer Foundation to G.J.G and E.G. were fundamental for the completion of this work.

Institutional Review Board Statement

Not applicable.

Informed Consent Statement

Not applicable.

Data Availability Statement

All the data presented are available in the manuscript and/or Supplementary Files provided. As indicated in the Materials and Methods section, the RNA-seq data have been deposited in the publicly available EMBL-EBI Arrayexpress database (Accession No: E-MTAB-10819).

Acknowledgments

We would like to thank Monica Lupi (Department of Oncology, Istituto di Ricerche Farmacologiche Mario Negri IRCCS for the help provided in the design and conduction of the cell motility experiments.

Conflicts of Interest

The authors declare no conflict of interest. Principal Component Analysis of the RNA-seq data obtained in a panel of selected breast cancer cell-lines.

References

  1. Conn, S.J.; Pillman, K.A.; Toubia, J.; Conn, V.M.; Salmanidis, M.; Phillips, C.A.; Roslan, S.; Schreiber, A.W.; Gregory, P.A.; Goodall, G.J. The RNA Binding Protein Quaking Regulates Formation of CircRNAs. Cell 2015, 160, 1125–1134. [Google Scholar] [CrossRef] [Green Version]
  2. Jeck, W.R.; Sharpless, N.E. Detecting and Characterizing Circular RNAs. Nat. Biotechnol. 2014, 32, 453–461. [Google Scholar] [CrossRef]
  3. Liu, D.; Conn, V.; Goodall, G.J.; Conn, S.J. A Highly Efficient Strategy for Overexpressing circRNAs. Methods Mol. Biol. 2018, 1724, 97–105. [Google Scholar] [CrossRef]
  4. Kristensen, L.S.; Andersen, M.S.; Stagsted, L.V.W.; Ebbesen, K.K.; Hansen, T.B.; Kjems, J. The Biogenesis, Biology and Characterization of Circular RNAs. Nat. Rev. Genet. 2019, 20, 675–691. [Google Scholar] [CrossRef]
  5. Jiao, S.; Wu, S.; Huang, S.; Liu, M.; Gao, B. Advances in the Identification of Circular RNAs and Research Into circRNAs in Human Diseases. Front. Genet. 2021, 12, 665233. [Google Scholar] [CrossRef]
  6. Garlapati, P.; Ling, J.; Chiao, P.J.; Fu, J. Circular RNAs Regulate Cancer-Related Signaling Pathways and Serve as Potential Diagnostic Biomarkers for Human Cancers. Cancer Cell Int. 2021, 21, 317. [Google Scholar] [CrossRef]
  7. Goodall, G.J.; Wickramasinghe, V.O. RNA in Cancer. Nat. Rev. Cancer 2021, 21, 22–36. [Google Scholar] [CrossRef]
  8. Du, W.W.; Yang, W.; Liu, E.; Yang, Z.; Dhaliwal, P.; Yang, B.B. Foxo3 Circular RNA Retards Cell Cycle Progression via Forming Ternary Complexes with P21 and CDK2. Nucleic Acids Res. 2016, 44, 2846–2858. [Google Scholar] [CrossRef] [Green Version]
  9. Guarnerio, J.; Bezzi, M.; Jeong, J.C.; Paffenholz, S.V.; Berry, K.; Naldini, M.M.; Lo-Coco, F.; Tay, Y.; Beck, A.H.; Pandolfi, P.P. Oncogenic Role of Fusion-CircRNAs Derived from Cancer-Associated Chromosomal Translocations. Cell 2016, 166, 1055–1056. [Google Scholar] [CrossRef] [Green Version]
  10. Yang, W.; Du, W.W.; Li, X.; Yee, A.J.; Yang, B.B. Foxo3 Activity Promoted by Non-Coding Effects of Circular RNA and Foxo3 Pseudogene in the Inhibition of Tumor Growth and Angiogenesis. Oncogene 2016, 35, 3919–3931. [Google Scholar] [CrossRef]
  11. Zhang, Y.; Zhang, X.-O.; Chen, T.; Xiang, J.-F.; Yin, Q.-F.; Xing, Y.-H.; Zhu, S.; Yang, L.; Chen, L.-L. Circular Intronic Long Noncoding RNAs. Mol. Cell 2013, 51, 792–806. [Google Scholar] [CrossRef] [Green Version]
  12. Fontemaggi, G.; Turco, C.; Esposito, G.; Di Agostino, S. New Molecular Mechanisms and Clinical Impact of CircRNAs in Human Cancer. Cancers 2021, 13, 3154. [Google Scholar] [CrossRef]
  13. Hansen, T.B.; Jensen, T.I.; Clausen, B.H.; Bramsen, J.B.; Finsen, B.; Damgaard, C.K.; Kjems, J. Natural RNA Circles Function as Efficient MicroRNA Sponges. Nature 2013, 495, 384–388. [Google Scholar] [CrossRef]
  14. Zhu, Y.; Ma, C.; Lv, A.; Kou, C. Circular RNA circ_0010235 sponges miR-338-3p to play oncogenic role in proliferation, migration and invasion of non-small-cell lung cancer cells through modulating KIF2A. Ann. Med. 2021, 53, 693–706. [Google Scholar] [CrossRef]
  15. Memczak, S.; Jens, M.; Elefsinioti, A.; Torti, F.; Krueger, J.; Rybak, A.; Maier, L.; Mackowiak, S.D.; Gregersen, L.H.; Munschauer, M.; et al. Circular RNAs Are a Large Class of Animal RNAs with Regulatory Potency. Nature 2013, 495, 333–338. [Google Scholar] [CrossRef]
  16. He, X.; Xu, T.; Hu, W.; Tan, Y.; Wang, D.; Wang, Y.; Zhao, C.; Yi, Y.; Xiong, M.; Lv, W.; et al. Circular RNAs: Their Role in the Pathogenesis and Orchestration of Breast Cancer. Front. Cell Dev. Biol. 2021, 9, 647736. [Google Scholar] [CrossRef]
  17. Zeng, Y.; Zou, Y.; Gao, G.; Zheng, S.; Wu, S.; Xie, X.; Tang, H. The biogenesis, function and clinical significance of circular RNAs in breast cancer. Cancer Biol. Med. 2021. [Google Scholar] [CrossRef]
  18. Prat, A.; Perou, C.M. Deconstructing the Molecular Portraits of Breast Cancer. Mol. Oncol. 2011, 5, 5–23. [Google Scholar] [CrossRef]
  19. Lüönd, F.; Tiede, S.; Christofori, G. Breast Cancer as an Example of Tumour Heterogeneity and Tumour Cell Plasticity during Malignant Progression. Br. J. Cancer 2021, 125, 164–175. [Google Scholar] [CrossRef] [PubMed]
  20. Anderson, W.F.; Rosenberg, P.S.; Prat, A.; Perou, C.M.; Sherman, M.E. How Many Etiological Subtypes of Breast Cancer: Two, Three, Four, or More? J. Natl. Cancer Inst. 2014, 106, dju165. [Google Scholar] [CrossRef] [Green Version]
  21. Guido, L.P.; Gomez-Fernandez, C. Advances in the Molecular Taxonomy of Breast Cancer. Arch. Med. Res. 2020, 51, 777–783. [Google Scholar] [CrossRef]
  22. Neumann, D.P.; Goodall, G.J.; Gregory, P.A. Regulation of Splicing and Circularisation of RNA in Epithelial Mesenchymal Plasticity. Semin. Cell Dev. Biol. 2018, 75, 50–60. [Google Scholar] [CrossRef]
  23. Bolis, M.; Paroni, G.; Fratelli, M.; Vallerga, A.; Guarrera, L.; Zanetti, A.; Kurosaki, M.; Garattini, S.K.; Gianni’, M.; Lupi, M.; et al. All-Trans Retinoic Acid Stimulates Viral Mimicry, Interferon Responses and Antigen Presentation in Breast-Cancer Cells. Cancers 2020, 12, 1169. [Google Scholar] [CrossRef]
  24. Paroni, G.; Zanetti, A.; Barzago, M.M.; Kurosaki, M.; Guarrera, L.; Fratelli, M.; Troiani, M.; Ubezio, P.; Bolis, M.; Vallerga, A.; et al. Retinoic Acid Sensitivity of Triple-Negative Breast Cancer Cells Characterized by Constitutive Activation of the Notch1 Pathway: The Role of Rarβ. Cancers 2020, 12, E3027. [Google Scholar] [CrossRef]
  25. Jonkman, J.E.N.; Cathcart, J.A.; Xu, F.; Bartolini, M.E.; Amon, J.E.; Stevens, K.M.; Colarusso, P. An Introduction to the Wound Healing Assay Using Live-Cell Microscopy. Cell Adhes. Migr. 2014, 8, 440–451. [Google Scholar] [CrossRef] [Green Version]
  26. Wingett, S.W.; Andrews, S. FastQ Screen: A Tool for Multi-Genome Mapping and Quality Control. F1000Research 2018, 7, 1338. [Google Scholar] [CrossRef]
  27. Hasegawa, H.; Kiyokawa, E.; Tanaka, S.; Nagashima, K.; Gotoh, N.; Shibuya, M.; Kurata, T.; Matsuda, M. DOCK180, a major CRK-binding protein, alters cell morphology upon translocation to the cell membrane. Mol. Cell. Biol. 1996, 16, 1770–1776. [Google Scholar] [CrossRef] [Green Version]
  28. Kiyokawa, E.; Hashimoto, Y.; Kobayashi, S.; Sugimura, H.; Kurata, T.; Matsuda, M. Activation of Rac1 by a Crk SH3-binding protein, DOCK180. Genes Dev. 1998, 12, 3331–3336. [Google Scholar] [CrossRef] [Green Version]
  29. Côté, J.F.; Vuori, K. Identification of an evolutionarily conserved superfamily of DOCK180-related proteins with guanine nucleotide exchange activity. J. Cell Sci. 2002, 115, 4901–4913. [Google Scholar] [CrossRef] [Green Version]
  30. Deshmukh, A.P.; Vasaikar, S.V.; Tomczak, K.; Tripathi, S.; den Hollander, P.; Arslan, E.; Chakraborty, P.; Soundararajan, R.; Jolly, M.K.; Rai, K.; et al. Identification of EMT Signaling Cross-Talk and Gene Regulatory Networks by Single-Cell RNA Sequencing. Proc. Natl. Acad. Sci. USA 2021, 118, e2102050118. [Google Scholar] [CrossRef]
  31. Cai, J.; Guan, H.; Fang, L.; Yang, Y.; Zhu, X.; Yuan, J.; Wu, J.; Li, M. MicroRNA-374a Activates Wnt/β-Catenin Signaling to Promote Breast Cancer Metastasis. J. Clin. Investig. 2013, 123, 566–579. [Google Scholar] [CrossRef] [PubMed] [Green Version]
  32. Sheng, Y.; Cao, M.; Liu, Y.; He, Y.; Zhang, G.; Du, Y.; Gao, F.; Yang, C. Hyaluronan Synthase 2 (HAS2) Regulates Cell Phenotype and Invadopodia Formation in Luminal-like Breast Cancer Cells. Mol. Cell. Biochem. 2021, 476, 3383–3391. [Google Scholar] [CrossRef] [PubMed]
  33. Satelli, A.; Li, S. Vimentin in Cancer and Its Potential as a Molecular Target for Cancer Therapy. Cell. Mol. Life Sci. 2011, 68, 3033–3046. [Google Scholar] [CrossRef] [PubMed] [Green Version]
  34. Morel, A.-P.; Lièvre, M.; Thomas, C.; Hinkal, G.; Ansieau, S.; Puisieux, A. Generation of Breast Cancer Stem Cells through Epithelial-Mesenchymal Transition. PLoS ONE 2008, 3, e2888. [Google Scholar] [CrossRef] [PubMed]
  35. Adhikary, A.; Chakraborty, S.; Mazumdar, M.; Ghosh, S.; Mukherjee, S.; Manna, A.; Mohanty, S.; Nakka, K.K.; Joshi, S.; De, A.; et al. Inhibition of Epithelial to Mesenchymal Transition by E-Cadherin up-Regulation via Repression of Slug Transcription and Inhibition of E-Cadherin Degradation: Dual Role of Scaffold/Matrix Attachment Region-Binding Protein 1 (SMAR1) in Breast Cancer Cells. J. Biol. Chem. 2014, 289, 25431–25444. [Google Scholar] [CrossRef] [PubMed] [Green Version]
  36. Li, Y.; Zhao, Z.; Xu, C.; Zhou, Z.; Zhu, Z.; You, T. HMGA2 Induces Transcription Factor Slug Expression to Promote Epithelial-to-Mesenchymal Transition and Contributes to Colon Cancer Progression. Cancer Lett. 2014, 355, 130–140. [Google Scholar] [CrossRef]
  37. Leong, K.G.; Niessen, K.; Kulic, I.; Raouf, A.; Eaves, C.; Pollet, I.; Karsan, A. Jagged1-Mediated Notch Activation Induces Epithelial-to-Mesenchymal Transition through Slug-Induced Repression of E-Cadherin. J. Exp. Med. 2007, 204, 2935–2948. [Google Scholar] [CrossRef] [Green Version]
  38. Chen, P.-W.; Jian, X.; Yoon, H.-Y.; Randazzo, P.A. ARAP2 Signals through Arf6 and Rac1 to Control Focal Adhesion Morphology. J. Biol. Chem. 2013, 288, 5849–5860. [Google Scholar] [CrossRef] [PubMed] [Green Version]
  39. Bi, X.; Hameed, M.; Mirani, N.; Pimenta, E.M.; Anari, J.; Barnes, B.J. Loss of Interferon Regulatory Factor 5 (IRF5) Expression in Human Ductal Carcinoma Correlates with Disease Stage and Contributes to Metastasis. Breast Cancer Res. 2011, 13, R111. [Google Scholar] [CrossRef] [Green Version]
  40. Pimenta, E.; Barnes, B.J. A Conserved Region within Interferon Regulatory Factor 5 Controls Breast Cancer Cell Migration through a Cytoplasmic and Transcription-Independent Mechanism. Mol. Cancer 2015, 14, 32. [Google Scholar] [CrossRef] [Green Version]
  41. Miao, H.; Strebhardt, K.; Pasquale, E.B.; Shen, T.-L.; Guan, J.-L.; Wang, B. Inhibition of Integrin-Mediated Cell Adhesion but Not Directional Cell Migration Requires Catalytic Activity of EphB3 Receptor Tyrosine Kinase: Role of Rho family small GTPases. J. Biol. Chem. 2005, 280, 923–932. [Google Scholar] [CrossRef] [Green Version]
  42. Ji, X.-D.; Li, G.; Feng, Y.-X.; Zhao, J.-S.; Li, J.-J.; Sun, Z.-J.; Shi, S.; Deng, Y.-Z.; Xu, J.-F.; Zhu, Y.-Q.; et al. EphB3 Is Overexpressed in Non-Small-Cell Lung Cancer and Promotes Tumor Metastasis by Enhancing Cell Survival and Migration. Cancer Res. 2011, 71, 1156–1166. [Google Scholar] [CrossRef] [Green Version]
  43. Mu, X.; Huang, O.; Jiang, M.; Xie, Z.; Chen, D.; Zhang, X. Prognostic Value of Ephrin B Receptors in Breast Cancer: An Online Survival Analysis Using the Microarray Data of 3554 patients. Oncol. Lett. 2019, 18, 742–750. [Google Scholar] [CrossRef] [PubMed] [Green Version]
  44. Galligan, J.J.; Petersen, D.R. The Human Protein Disulfide Isomerase Gene Family. Hum. Genomics 2012, 6, 6. [Google Scholar] [CrossRef] [Green Version]
  45. Lacambra, M.D.; Tsang, J.Y.S.; Ni, Y.-B.; Chan, S.-K.; Tan, P.H.; Tse, G.M. Anterior Gradient 2 Is a Poor Outcome Indicator in Luminal Breast Cancer. Ann. Surg. Oncol. 2015, 22, 3489–3496. [Google Scholar] [CrossRef]
  46. Zheng, W.; Rosenstiel, P.; Huse, K.; Sina, C.; Valentonyte, R.; Mah, N.; Zeitlmann, L.; Grosse, J.; Ruf, N.; Nürnberg, P.; et al. Evaluation of AGR2 and AGR3 as Candidate Genes for Inflammatory Bowel Disease. Genes Immun. 2006, 7, 11–18. [Google Scholar] [CrossRef] [Green Version]
  47. Zhou, X.; Fu, A.K.; Ip, N.Y. APOE Signaling in Neurodegenerative Diseases: An Integrative Approach Targeting APOE Coding and Noncoding Variants for Disease Intervention. Curr. Opin. Neurobiol. 2021, 69, 58–67. [Google Scholar] [CrossRef]
  48. Xing, L.; Wen, J.-G.; Frøkiær, J.; Djurhuus, J.C.; Nørregaard, R. Ontogeny of the Mammalian Kidney: Expression of Aquaporins 1, 2, 3, and 4. World J. Pediatr. 2014, 10, 306–312. [Google Scholar] [CrossRef]
  49. Huang, R.Y.-J.; Kuay, K.T.; Tan, T.Z.; Asad, M.; Tang, H.M.; Ng, A.H.C.; Ye, J.; Chung, V.Y.; Thiery, J.P. Functional Relevance of a Six Mesenchymal Gene Signature in Epithelial-Mesenchymal Transition (EMT) Reversal by the Triple Angiokinase Inhibitor, Nintedanib (BIBF1120). Oncotarget 2015, 6, 22098–22113. [Google Scholar] [CrossRef] [Green Version]
  50. Tay, Y.; Rinn, J.; Pandolfi, P.P. The multilayered complexity of ceRNA crosstalk and competition. Nature 2014, 505, 344–352. [Google Scholar] [CrossRef] [Green Version]
  51. Bezzi, M.; Guarnerio, J.; Pandolfi, P.P. A circular twist on microRNA regulation. Cell Res. 2017, 27, 1401–1402. [Google Scholar] [CrossRef] [PubMed] [Green Version]
  52. Zhang, X.-L.; Xu, L.-L.; Wang, F. Hsa_circ_0020397 regulates colorectal cancer cell viability, apoptosis and invasion by promoting the expression of the miR-138 targets TERT and PD-L1. Cell Biol. Int. 2017, 41, 1056–1064. [Google Scholar] [CrossRef] [PubMed]
  53. Liu, P.; Li, X.; Guo, X.; Chen, J.; Li, C.; Chen, M.; Liu, L.; Zhang, X.; Zu, X. Circular RNA DOCK1 promotes bladder carcinoma progression via modulating circDOCK1/hsa-miR-132-3p/Sox5 signalling pathway. Cell Prolif. 2019, 52, e12614. [Google Scholar] [CrossRef] [PubMed] [Green Version]
Figure 1. Expression of circSLC8A1 and circCCNB1 RNAs as well as the corresponding linear SLC8A1 and CCNB1 mRNAs in breast cancer cell lines. (A) Total RNA was extracted from the indicated cell lines and the levels of circSLC8A1 RNA (upper graph) and SLC8A1 mRNA (lower graph) were measured by PCR in the indicated cell lines. Each value is the mean ± SD of 3 independent cultures. (B) The panel illustrates the box plots generated from the median expression levels of circSLC8A1 RNA and SLC8A1 mRNA determined in Lum, TNBC, and TNBC-mes cell lines and it summarizes the results shown in (A). * Significantly lower in the Lum relative to the TNBC-mes group, as indicated (p = 0.050; Student’s T-test). (C) The panel illustrates the correlations between the mean expression of circSLC8A1 RNA and SLC8A1 mRNA in each cell line. The calculated R2 correlation value (Pearson method) and the correlation p-value are indicated. (D) Total RNA was extracted from the indicated cell lines and the levels of circCCNB1 RNA (upper graph) and CCNB1 mRNA (lower graph) were measured by PCR in the indicated cell lines. Each value is the mean ± SD of 3 independent cultures. (E) The panel illustrates the box plots generated from the median expression levels of circCCNB1 RNA and CCNB1 mRNA determined in Lum, TNBC, and TNBC-mes cell lines and it summarizes the results shown in (D). * Significantly higher in the TNBC relative to the TNBC-mes group, as indicated (p = 0.039; Student’s T-test). (F) The panel illustrates the correlations between the mean expression of circCCNB1 RNA and CCNB1 mRNA in each cell line. The calculated R2 correlation value (Pearson method) and the correlation p-value are indicated.
Cancers 13 05325 g001
Figure 2. Expression of circDOCK1-1 RNA and the corresponding linear DOCK1 mRNA in breast cancer cell lines. Total RNA was extracted from the indicated cell lines and the levels of circDOCK1-1 RNA (upper graph) and DOCK1 mRNA (lower graph) were measured by PCR in the indicated cell lines (A). Each value is the mean ± SD of 3 independent cultures. (B) The panel illustrates the box plots generated from the median expression levels of circDOCK1-1 RNA and DOCK1 mRNA determined in Lum, TNBC, and TNBC-mes cell lines and it summarizes the results shown in (A). ** Significantly higher in the Lum relative to the TNBC-mes group, as indicated (p < 0.001; Student’s T-test). * Significantly higher in the TNBC relative to the TNBC-mes group (p = 0.043; Student’s t-test). (C) The panel illustrates the correlations between the mean expression of circDOCK1-1 RNA and DOCK1 mRNA in each cell line. The calculated R2 correlation value (Pearson method) and the correlation p-value are indicated.
Cancers 13 05325 g002
Figure 3. Transcriptomic effects of circDOCK1-1 overexpression in MDA-MB-231 and MDA-MB-157 cells. Three independent MDA-MB-231 and MDA-MB-157 cell clones stably transfected with the circDOCK1-1 expression plasmid (circDOCK1a; circDOCK1b; circDOCK1c) and the corresponding empty vector (pVOID1; pVOID2; pVOID3) were isolated and used for the experiments presented in the various panels of the figure. (A) The column graph shows the levels of the circDOCK1-1 RNA determined by RT-PCR analysis of the total RNA extracted from the indicated cell populations using a specific Taqman assay. ND = not detectable. (B) The Venn diagram shows the number of genes significantly up- and downregulated by circDOCK1-1 overexpression in MDA-MB-231 and MDA-MB-157 cells. Upregulated genes are marked in red and downregulated genes are marked in blue, as indicated. (C) The heat maps show the expression levels of the indicated genes measured in 3 independent clones of MDA-MB-157 and MDA-MB-231 cells transfected with a plasmid construct, allowing the expression of the circDOCK1-1 RNA and the corresponding void vector. The results were obtained using RNA-seq following isolation of total RNA and are expressed in CPM (Counts Per Million reads). The levels of DOCK1 are shown and marked in black, as they represent an internal control of the experiment. In fact, the DOCK1 reads are expected to increase in circDOCK1-1 infected cells. (D) The panel shows the interactomic network of the proteins whose coding transcripts are upregulated (red circles) and downregulated (blue circles) in both MDA-MB-231 and MDA-MB-157 cells overexpressing circDOCK1-1. The proteins marked in violet are predominantly expressed in breast cancer tissues and cells characterized by an epithelial phenotype, while those marked in green are predominantly expressed in the mesenchymal counterparts, as indicated. The proteins involved in cell adhesion are marked in pink. The type of predicted interactions among the various proteins is also indicated by the coloured lines. CLDN* = CLDN is both an epithelial protein as well as a cell and cell/cell adhesion protein. SPOCK1* = SPOCK1 is both a mesenchymal protein as well as a cell and cell/cell adhesion protein.
Cancers 13 05325 g003
Figure 4. Expression profiles of some of the circDOCK1-1 upregulated genes in breast cancer cell lines and tumour specimens. The indicated mRNAs and single non-coding RNA (MNX-AS1) are coded by some of the genes that are commonly upregulated in MDA-MB-231 and MDA-MB-157 cells overexpressing circDOCK1-1, according to our RNA-seq data. These RNAs are characterized by a trend towards higher expression levels in the Lum vs. TNBC-mes cell lines belonging to our panel of 18 cell lines (left diagrams of each panel; the p-values of the indicated comparisons are shown, Wilcoxon test). The expression profiles of the RNAs that can be determined from the RNA-seq data obtained from the breast cancer specimens available in the TCGA database are also illustrated (middle diagrams of each panel; the p-values of the indicated comparisons are shown, Wilcoxon test). The right diagrams of each panel show the quantitative correlations between the levels of the indicated mRNA and circDOCK1-1 in each breast cancer cell line considered. TNBC-mes, TNBC and Lum cell lines are indicated by the green, blue, and red dots, respectively. The calculated R2 correlation value (Pearson method) and the correlation p-value are indicated.
Cancers 13 05325 g004
Figure 5. The expression profiles of some of the circDOCK1-1 downregulated genes in breast cancer cell lines and tumour specimens. The indicated mRNAs are encoded by some of the genes that are commonly downregulated in MDA-MB-231 and MDA-MB-157 cells overexpressing circDOCK1-1, according to our RNA-seq data. These mRNAs are characterized by a trend towards lower expression levels in the Lum vs. TNBC-mes cell lines belonging to our panel of 18 cell lines (left diagrams of each panel; the p-values of the indicated comparisons are shown, Wilcoxon test). The expression profiles of the mRNAs that can be determined from the RNA-seq data obtained from the breast cancer specimens available in the TCGA database are also illustrated (middle diagrams of each panel; the p-values of the indicated comparisons are shown, Wilcoxon test). The right diagrams of each panel show the quantitative correlations between the levels of the indicated mRNA and circDOCK1-1 in each breast cancer cell line considered. TNBC-mes, TNBC, and Lum cell lines are indicated by the green, blue, and red dots, respectively. The calculated R2 correlation value (Pearson method) and the correlation p-value are indicated.
Cancers 13 05325 g005
Figure 6. Effects of circDOCK1-1 silencing in CAMA-1 cells on the expression of genes whose expression is modulated by circDOCK1-1 overexpression. Luminal CAMA-1 cells were infected with a retroviral construct, which allows doxycyclin (DOX)-dependent silencing of circDOCK1-1. Following infection, two independent cell populations (circDOCK1-sh1 and circ-DOCK1-sh2) were isolated. (A) The figures show that the two cell populations express significant levels of the circDOCK1-1 targeting constructs only following exposure to DOX, as indicated by the positivity of cells to the Red Fluorescent Protein. (B) The column diagram shows the level of circDOCK1-1 expression as determined by RT-PCR analysis with a specific Taqman assay. ** Significantly lower than the corresponding vehicle-treated (−DOX) sample (p < 0.01 following Student’s t-test). No significant difference was observed between the −DOX circDOCK1-sh1 and circ-DOCK1-sh2 groups. (C) The column graphs shows: (1) the levels of the indicated mRNAs that are significantly upregulated by circDOCK1-1 overexpression in both MDA-MB-231 and MDA-MB-157 cells and are marked in red (AGR2, MPP1, and PPP1R9A); (2) the levels of the indicated mRNAs that are significantly downregulated by circDOCK1-1 overexpression in both MDA-MB-231 and MDA-MB-157 cells and are marked in blue (APOE, AQP3, CD99L2, and IGFBP4). The results were obtained using RNA-seq following isolation of total RNA from triplicate cultures of the two cell populations exposed to vehicle or DOX and are expressed in CPM (counts per million reads). * Significantly different. The p-values of the −DOX vs. +DOX comparisons (Student’s t-test; N = 6) are shown.
Cancers 13 05325 g006
Figure 7. Effects of circDOCK1-1 overexpression on cell proliferation, morphology, EMT, random motility, and wound healing. Parental MDA-MB-231 as well as three derived cell populations stably transfected with a plasmid allowing the expression of circDOCK1-1 (circDOCK1a; circDOCK1b; circDOCK1c) and the corresponding void vector (pVOID1; pVOID2; pVOID3) were used for the experiments described in the various panels. (A) The proliferation of parental MDA-MB-231, pVOID1, pVOID2, circDOCK1a, and circDOCK1b cells was evaluated with the sulforhodamine assay. ** Significantly lower than parental MDA-MB-231, pVOID1, and pVOID2 (p < 0.001 Student’s t-test). (B) The images show the morphology of logarithmically growing parental MDA-MB-231, pVOID1, pVOID2, circDOCK1a, and circDOCK1b cells grown in optimal conditions on plastic dishes. Luminal MCF7 cells grown in the presence of oestradiol were used as a positive control for the luminal phenotype. (C) Total cellular extracts obtained from parental MDA-MB-231, pVOID1, pVOID2, circDOCK1a, and circDOCK1b cells grown under basal conditions were used to perform Western blot experiments with specific antibodies recognizing the indicated proteins. Protein extracts of the luminal T47D and the mesenchymal MDA-MB-436 cell lines were used as external controls for the experiments. The same amount of protein was loaded in each lane as indicated by the levels of tubulin shown. The numbers above each lane of the β-catenin and vimentin Western blots indicate the relative levels of the two proteins after densitometric analysis of the bands taking the values determined in parental MDA-MB-231 cells 1.0. All the values were normalized for the corresponding amounts of tubulin. (D) The diagrams illustrate the expression levels of the indicated mRNAs coding for proteins playing a positive action in the process of epithelial-to-mesenchymal transition (EMT) determined from the RNA-seq data obtained in the indicated pVOID1, pVOID2, pVOID3, circDOCK1a, circDOCK1b, and circDOCK1c populations. Each value is the Mean ± SD of the three indicated cell populations. ** Significantly different from the corresponding pVOID value (circDOCK1-1 in MDA-MB-231 cells, p < 0.001; circDOCK1-1 in MDA-MB-157 cells, p < 0.001; Student’s t-test). * Significantly different from the corresponding pVOID value (ZEB1 in MDA-MB-231 cells, p = 0.028; SNAI2 in MDA-MB-157 cells, p = 0.012; Student’s t-test). (E) The diagrams illustrate the random motility curves determined in parental MDA-MB-231, pVOID1, pVOID2, circDOCK1a, and circDOCK1b cells by time-lapse microscopy at the indicated time points. The motility curves of circDOCK1a and circDOCK1b cells are significantly lower than the corresponding curves generated from the data obtained with parental MDA-MB-231, pVOID1, and pVOID2 cells (p < 0.001 following two-way ANOVA Bonferroni post-test). (F) The diagrams show the wound-healing curves determined in parental MDA-MB-231, pVOID1, pVOID2, circDOCK1a, and circDOCK1b cells by time-lapse microscopy at the indicated time points. The values indicate the void area contained between the margins of the healing. The curves obtained with circDOCK1a and circDOCK1b cells indicate that the closure of the wound was slower than what was observed with parental MDA-MB-231, pVOID1 and pVOID2 cells (p < 0.001 following two-way ANOVA Bonferroni post-test).
Cancers 13 05325 g007
Table 1. Differential expression of specific circRNA in mammary gland epithelial cells following EMT. The expression of the indicated circRNA was determined after RNA-seq analysis of total RNA extracted from the human mammary gland epithelial cell line, control HMLE cells, and HMLE cells exposed to TGFβ (HMLE-mes) to induce EMT (epithelial-to-mesenchymal transition). The results are expressed as the mean counts determined in 2 independent samples as shown. The identification codes and the structural characteristics of the indicated circRNAs were obtained from the circBASE website (http://www.circbase.org/, accessed on 12 May 2021).
Circular RNACirc IDLocationExons
(no)
Size
(nt)
HMLE
(Mean-Counts)
HMLE-mes
(Mean-Counts)
HMLE-mes/HMLE
(Fold Change)
circPVRL3hsa_circ_0066776chr3: 110830876-1108451822-5 (4)909ND (0;0)51 (68;34)ND
circSHPRHhsa_circ_0001649chr6: 146209155-1462161132-5 (4)440ND (0;0)18 (21;16)ND
circVEGFChsa_circ_0004496chr4: 177632652-1776509004-6 (3)5575 (11;0)65 (91;39)13.0
circBMPR2hsa_circ_0003218chr2: 203329531-2033324122-3 (2)34221 (37;5)102 (133;72)4.9
circCCNB1hsa_circ_0001495chr5: 68470703-684713646-7 (2)37820 (24;16)90 (114;66)4.5
circSLC8A1hsa_circ_0000994chr2: 40655612-406574449 (1)183267 (52;82)271 (206;337)4.0
circASXL1hsa_circ_0001136chr20: 30954186-309569262-3 (2)195101 (134;69)375 (643;107)3.7
circSMARCA5hsa_circ_0001445chr4: 144464661-14446512515-16 (2)26947 (72;22)174 (154;195)3.7
circATXN2hsa_circ_0002457chr12:111990083-11199372321-24 (4)32021 (35;8)68 (85;51)3.2
circRTN4hsa_circ_0001006chr2: 55209650-552148345-6 (2)34748 (47;49)152 (152;152)3.2
circSETD3hsa_circ_0000567chr14: 99924615-999321508-12 (5)68390 (115;65)256 (209;304)2.8
circDOCK1-1hsa_circ_0020397chr10:128768965-1289260282-27 (26)2738172 (211;134)7 (12;3)0.04
circGNB1hsa_circ_0008702chr1: 1747194-17706778-11 (4)29838 (36;40)13 (19;8)0.3
circFGD6hsa_circ_0141065chr12: 95602618-9560504320 (1)242566 (57;74)27 (29;25)0.4
circTNFRSF21hsa_circ_0001610chr6: 47251673-472543314-5 (2)114758 (65;52)27 (22; 32)0.5
Publisher’s Note: MDPI stays neutral with regard to jurisdictional claims in published maps and institutional affiliations.

