
Lamellipodin-RICTOR Signaling Mediates Glioblastoma Cell Invasion and Radiosensitivity Downstream of EGFR

 , and
, and 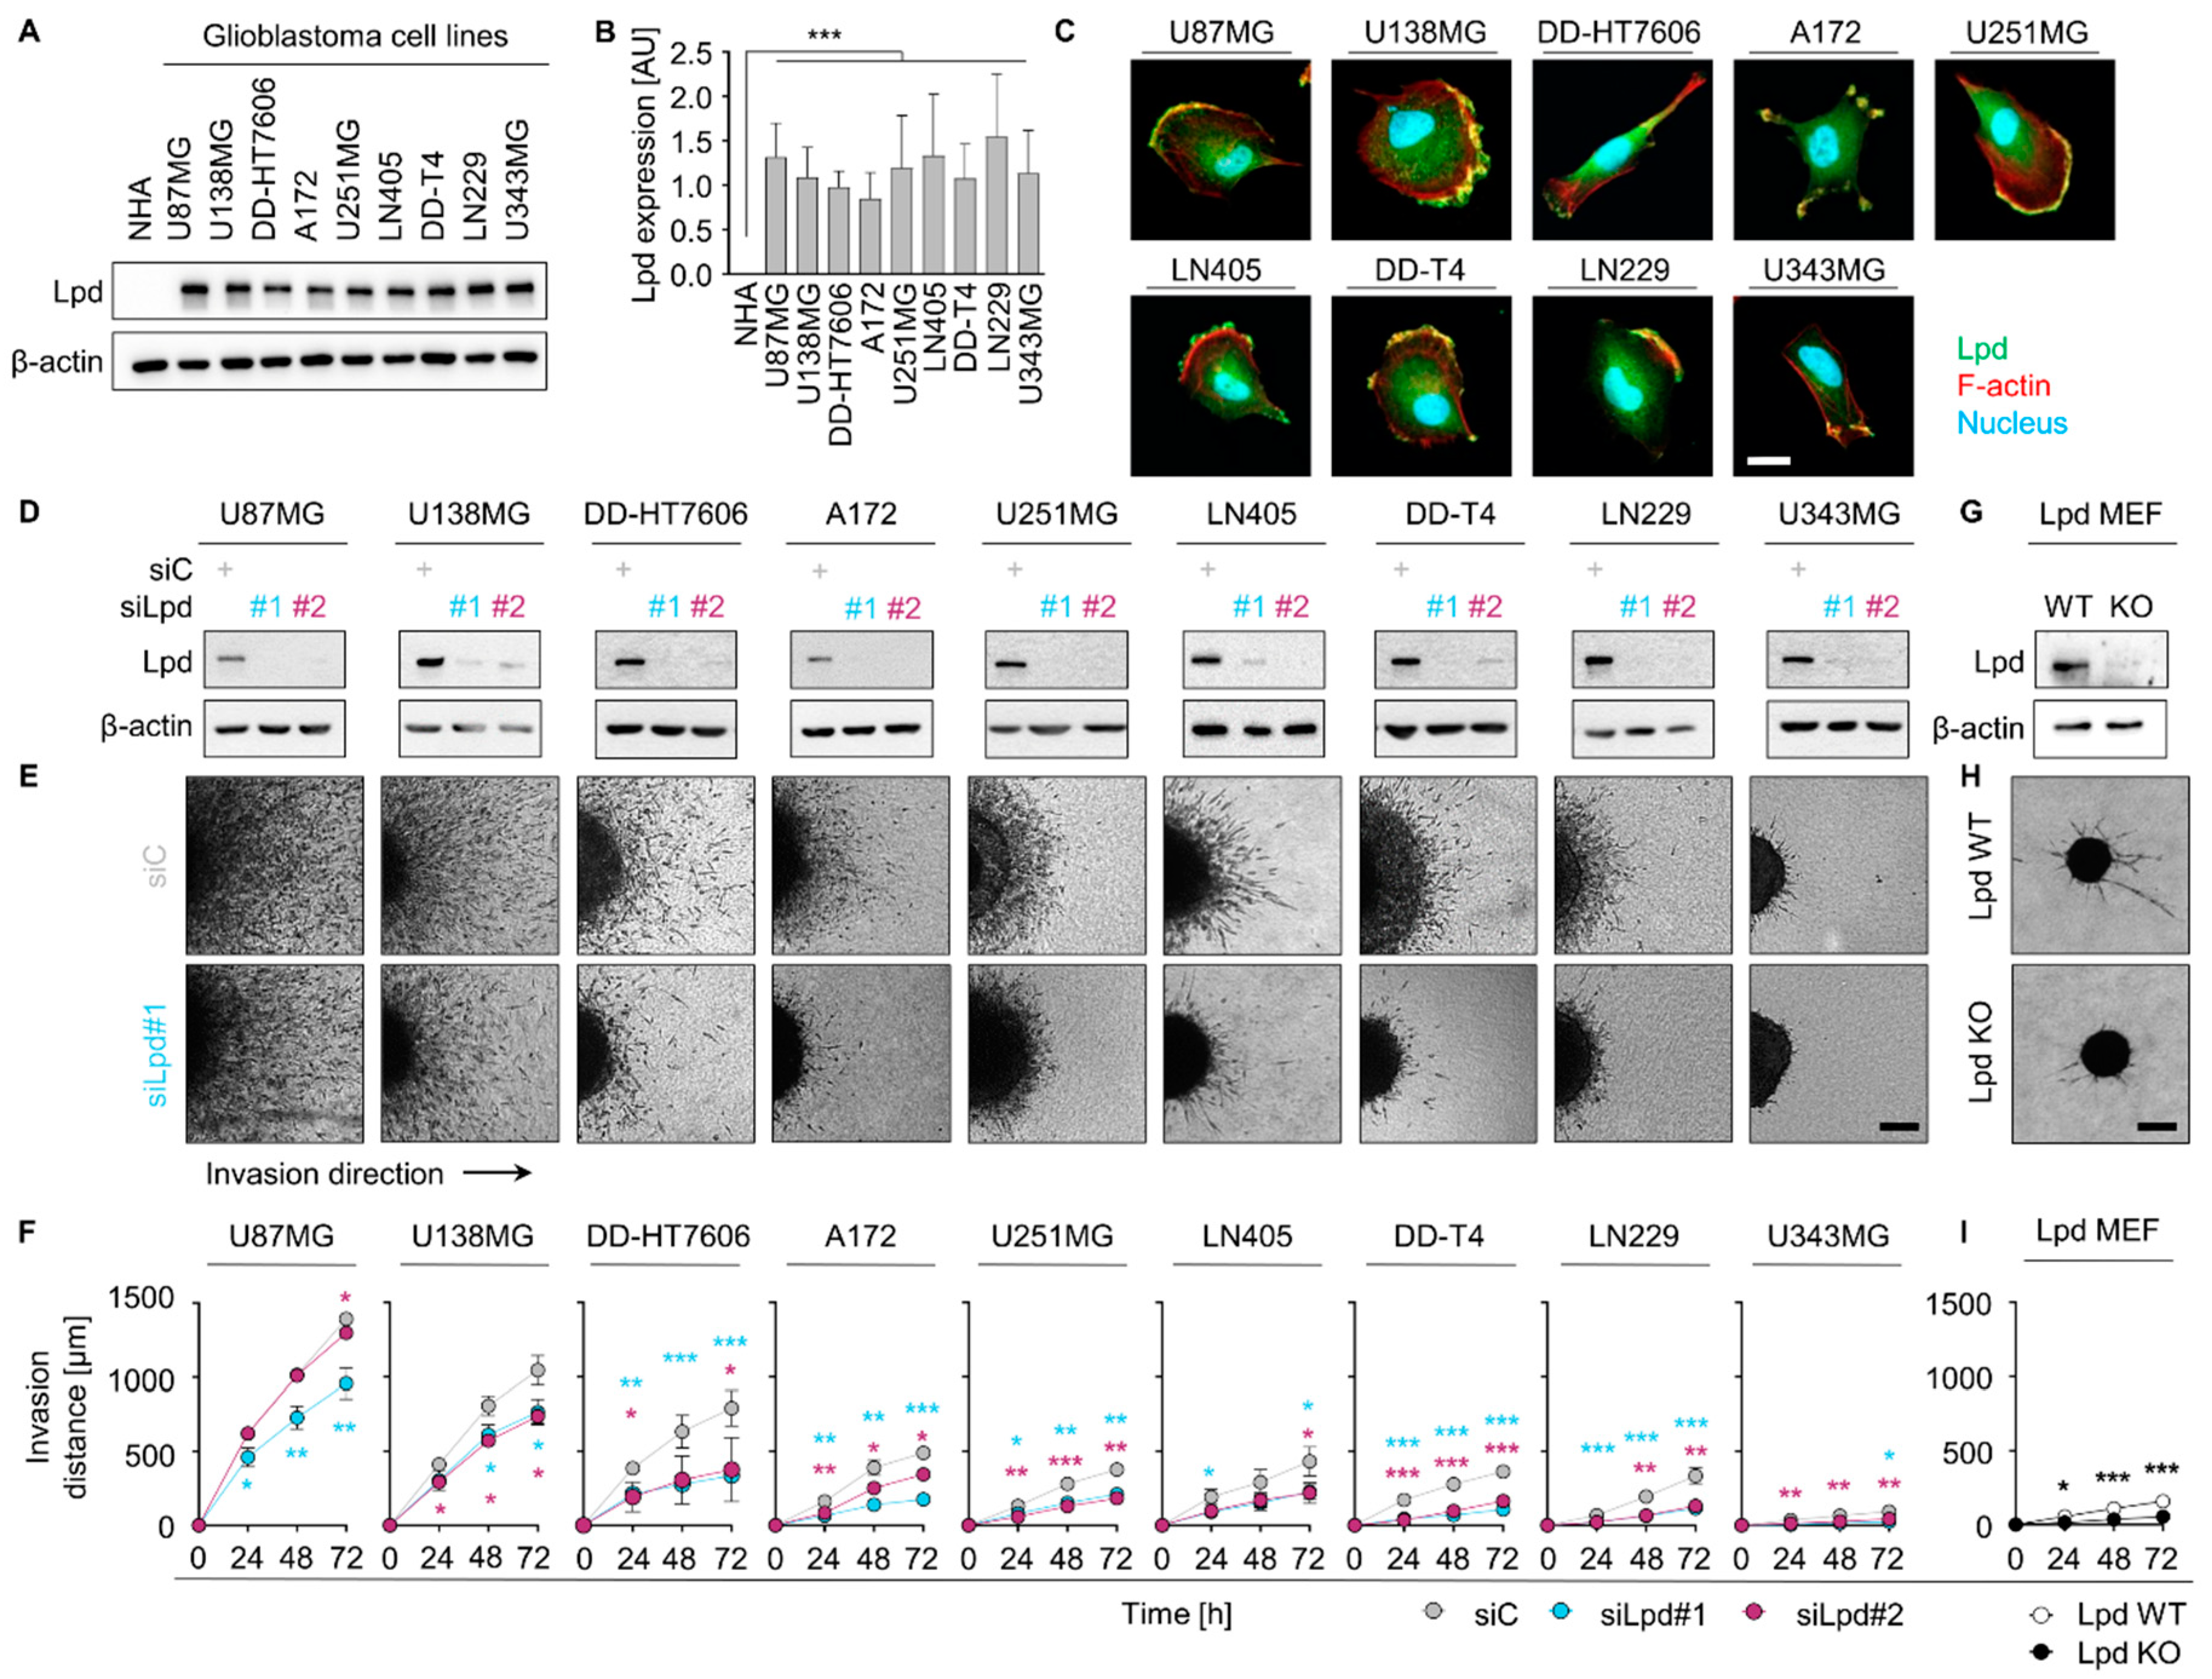
Abstract
:Simple Summary
Abstract
1. Introduction
2. Results
2.1. Lamellipodin Promotes Glioblastoma Cell Invasiveness
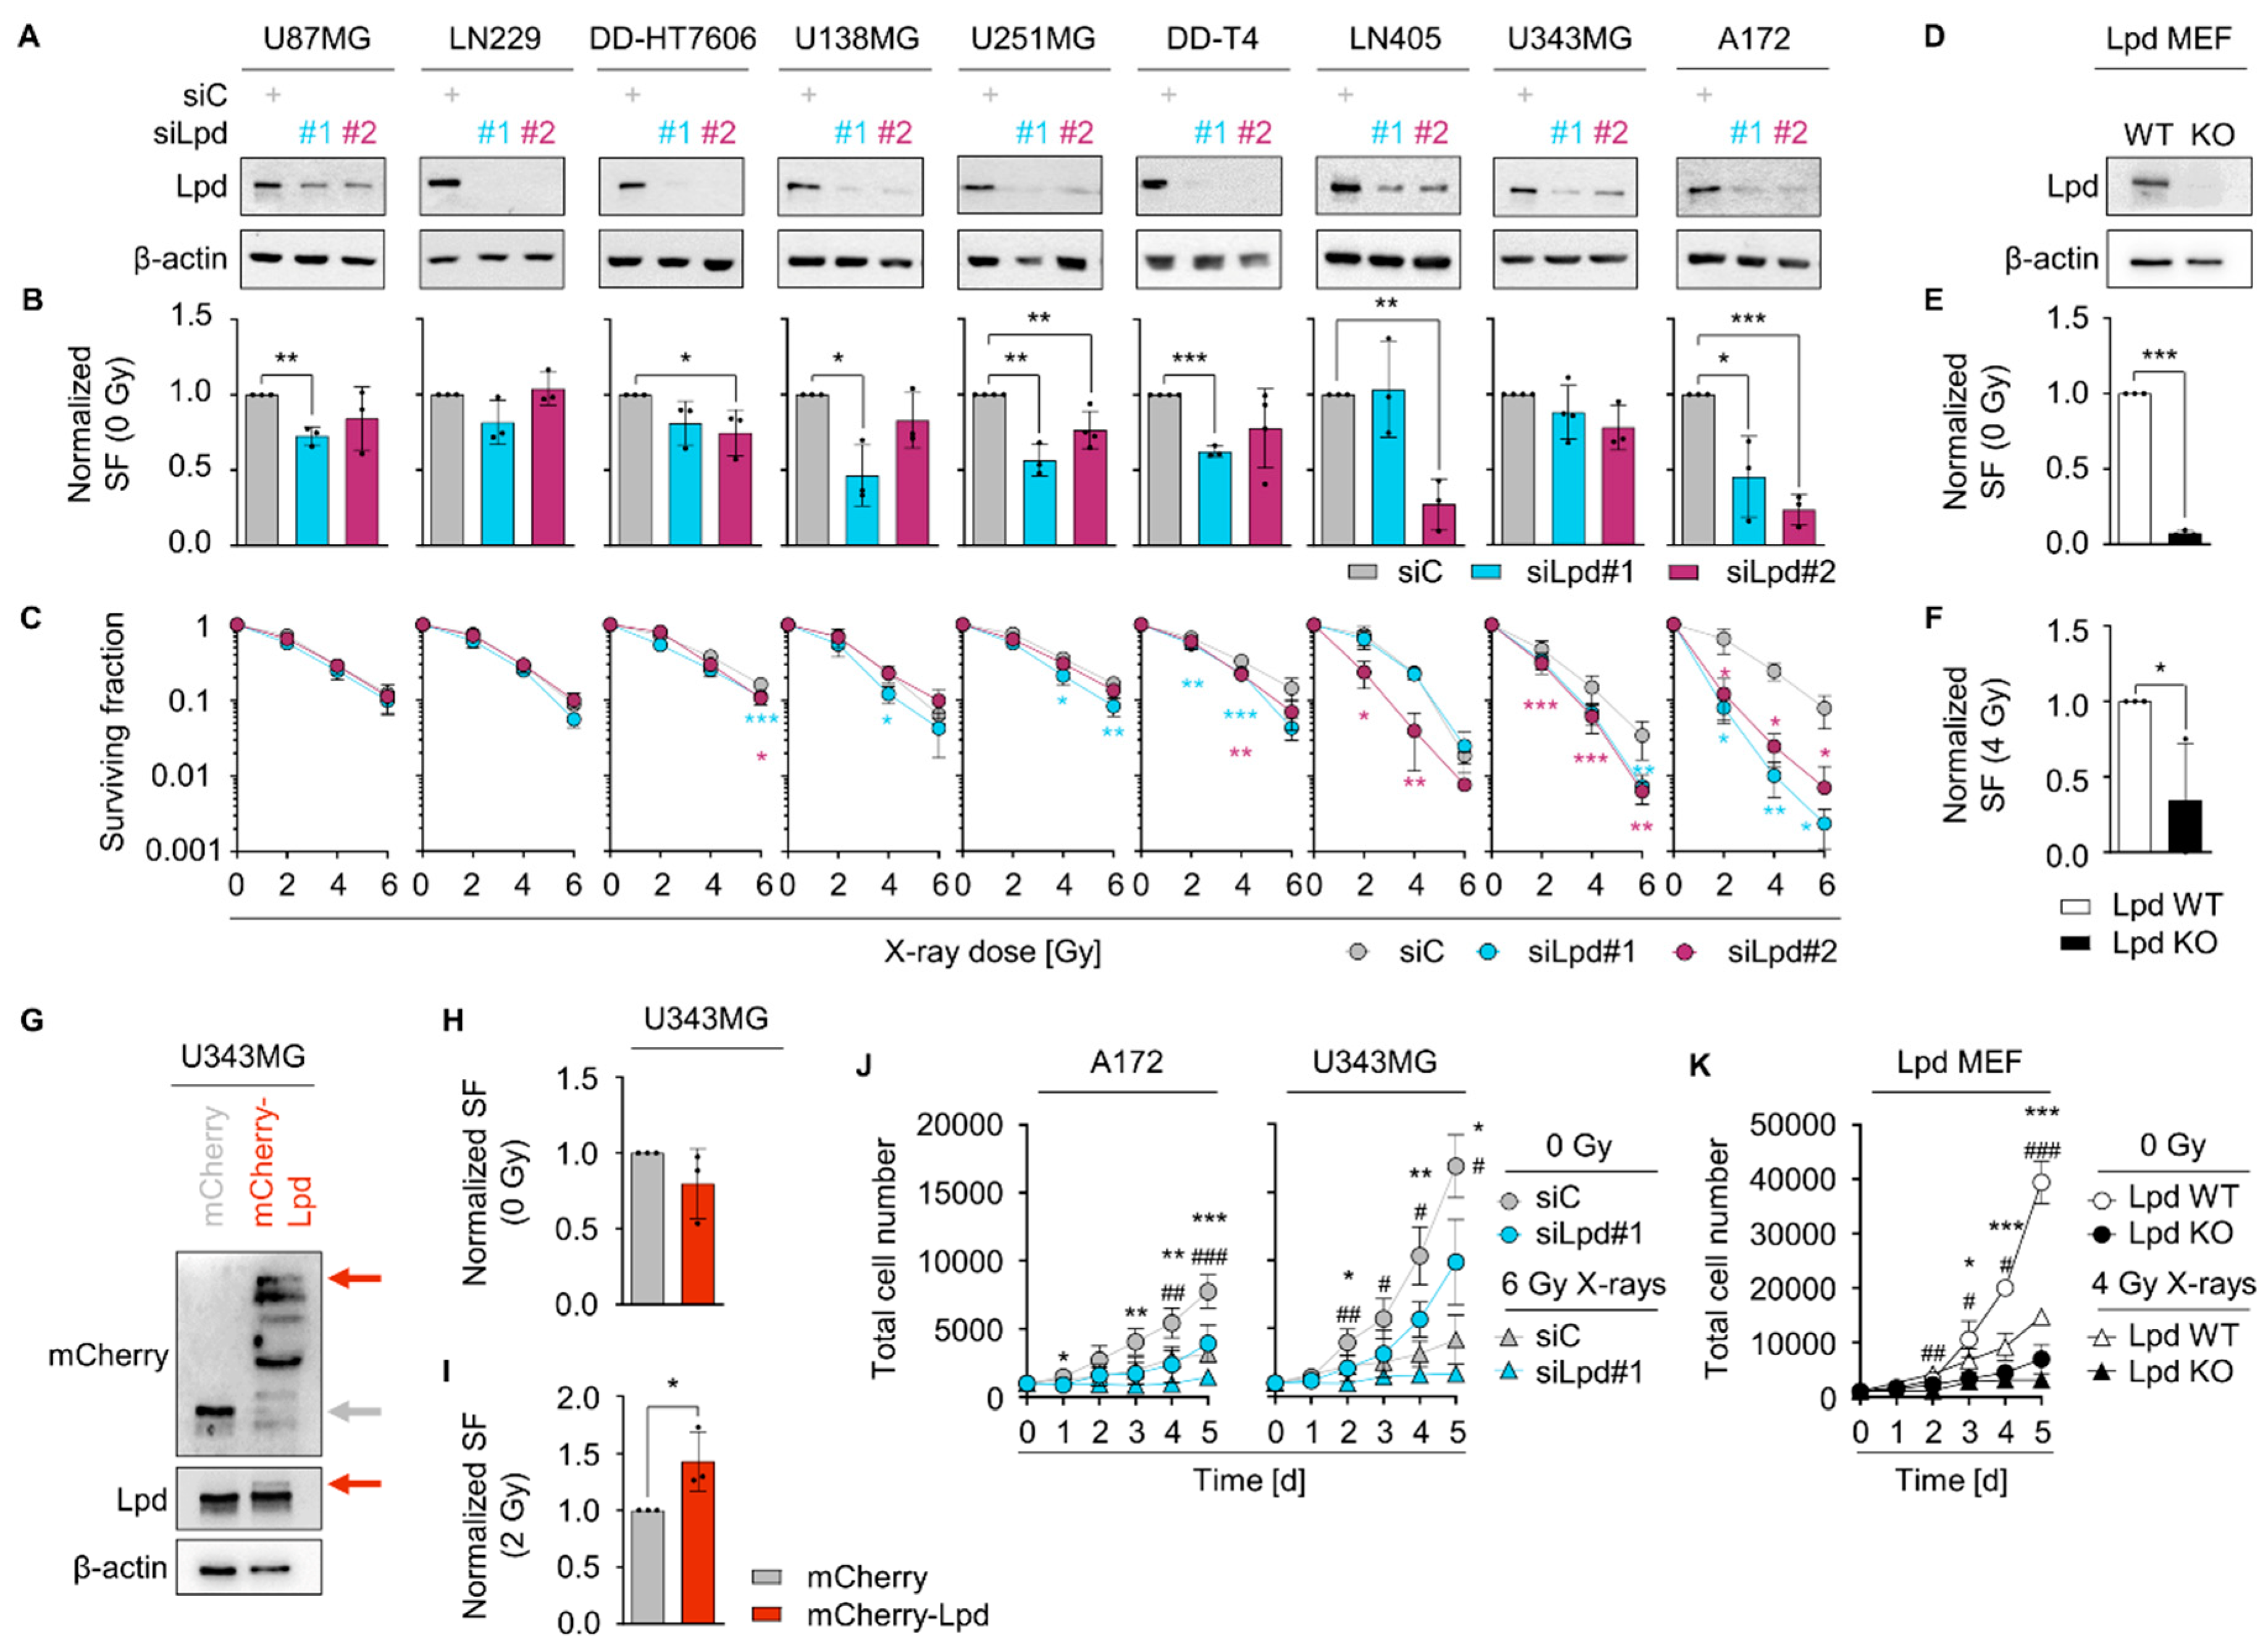
2.2. Lamellipodin Facilitates Radiation Survival and Promotes Proliferation of Glioblastoma Cells
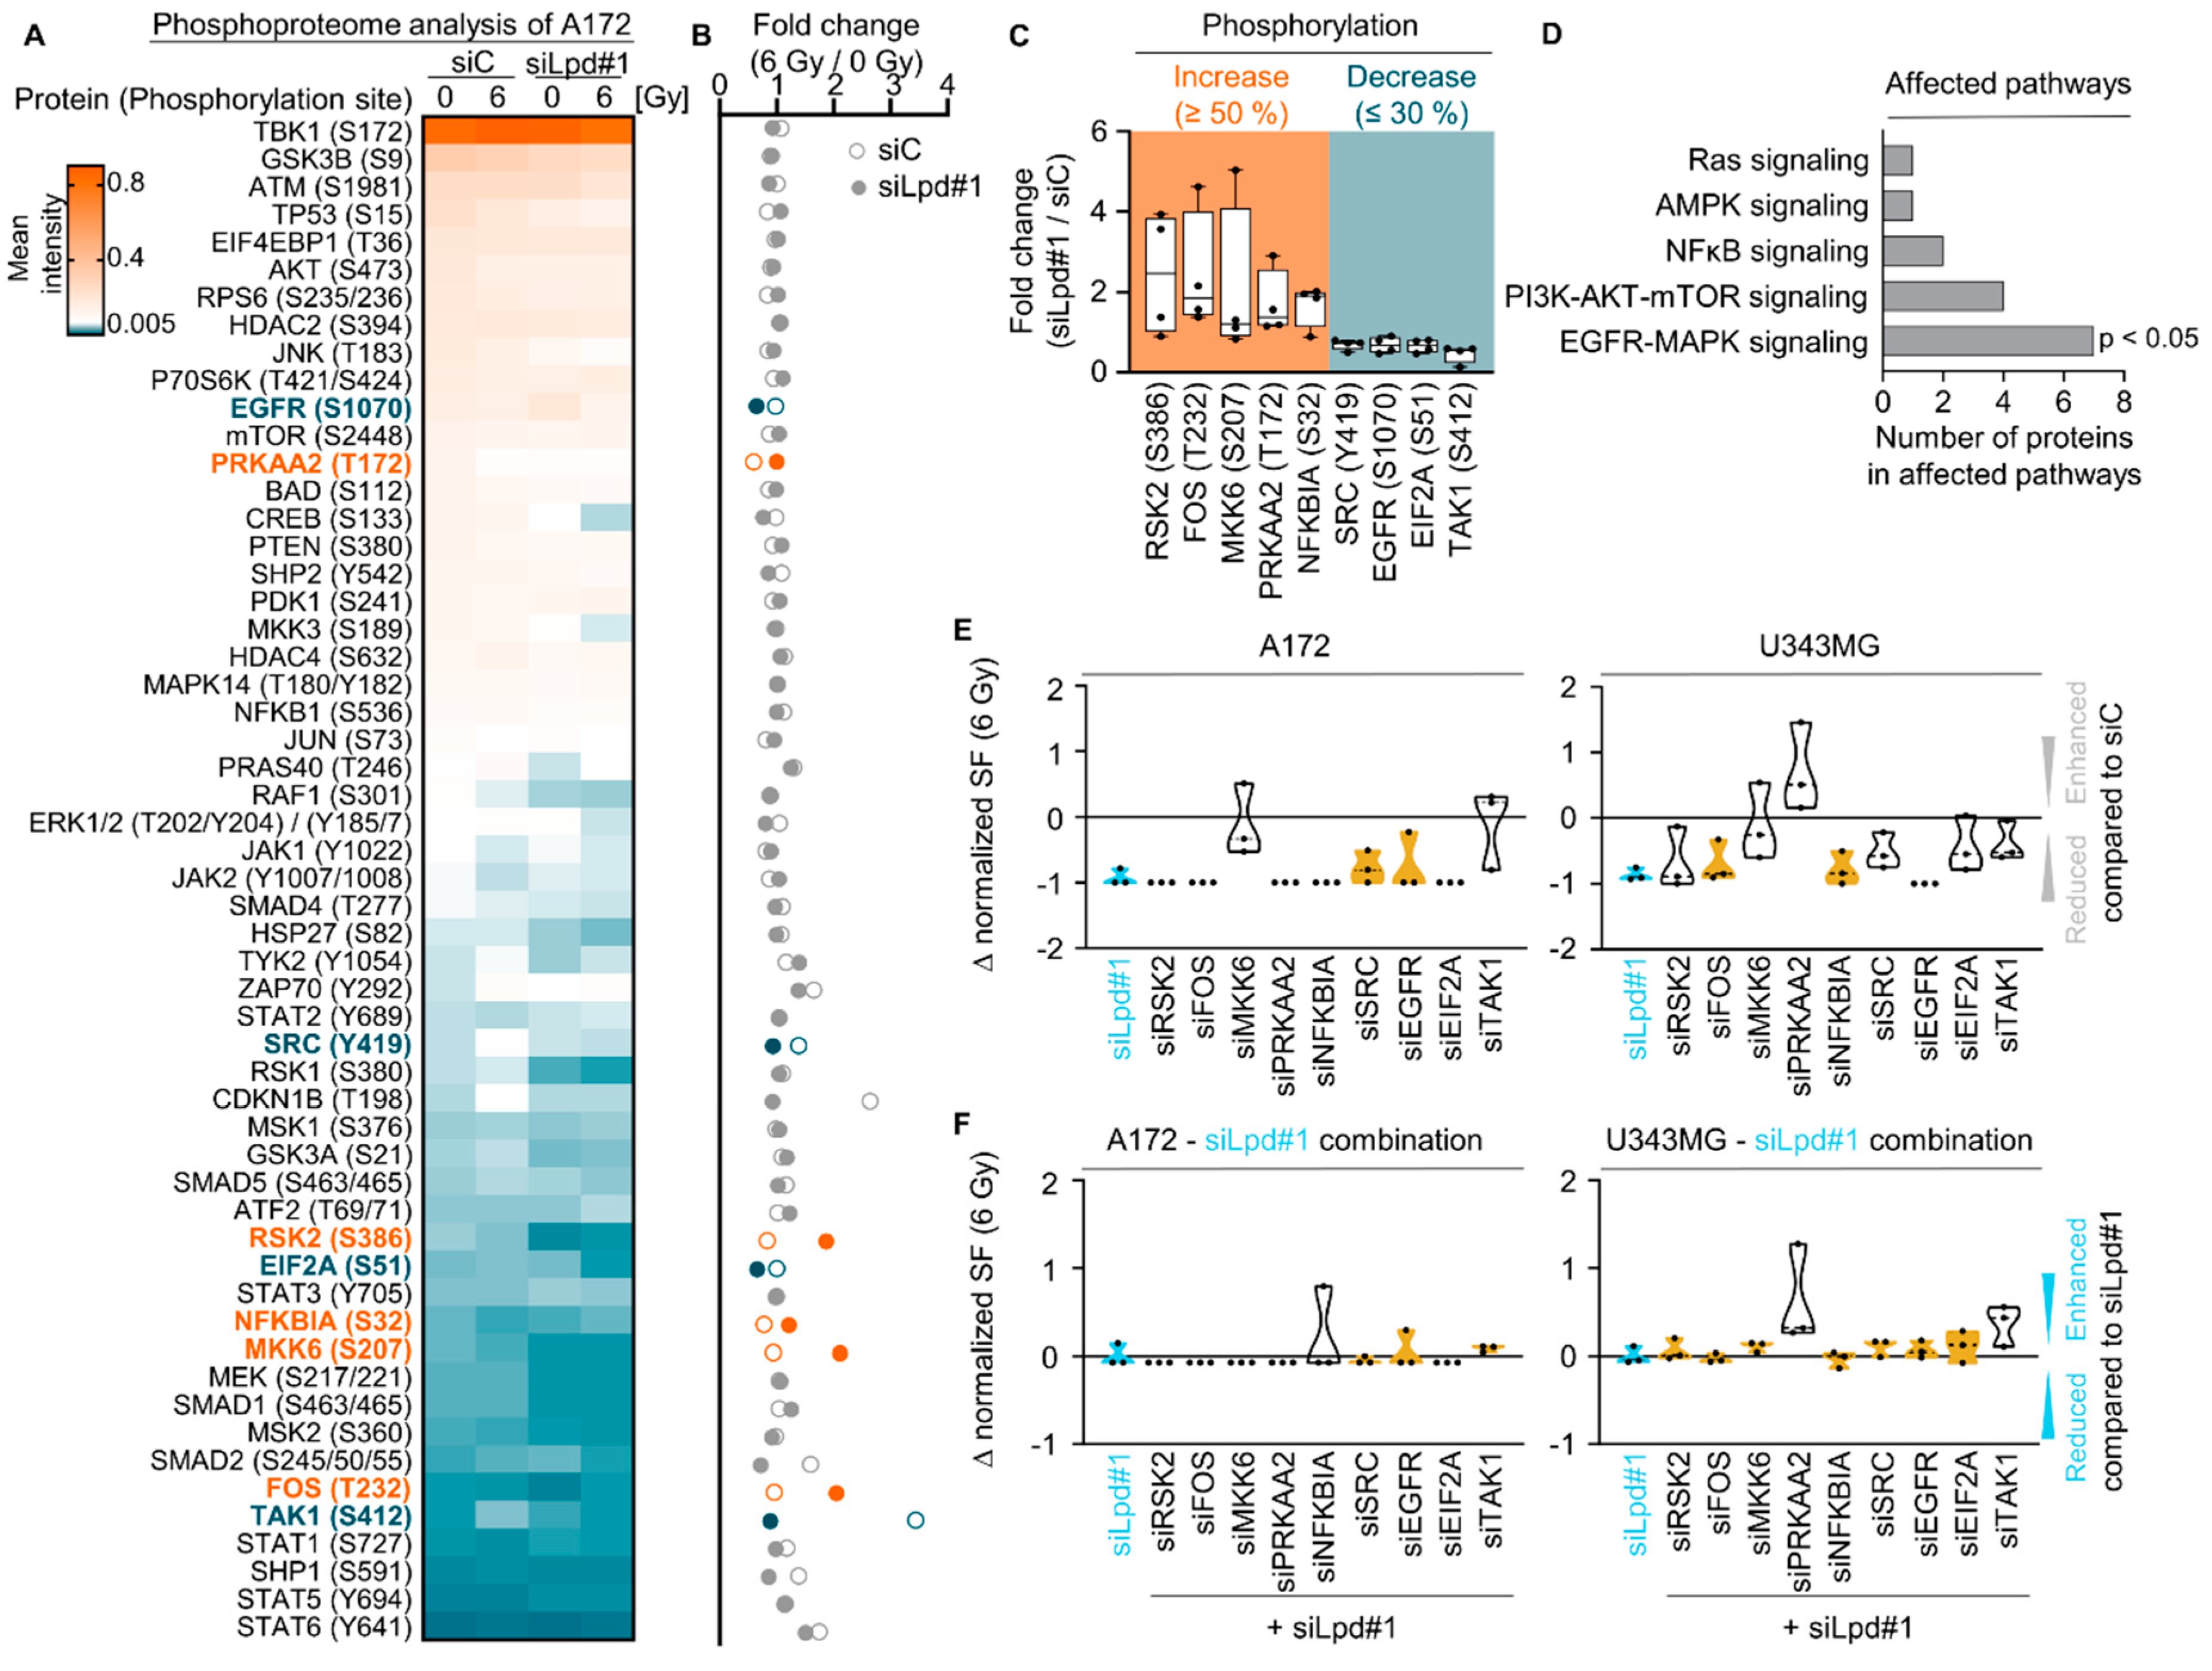
2.3. Lamellipodin Knockdown Enhances Glioblastoma Radiosensitivity via the EGFR-MAPK Signaling Axis
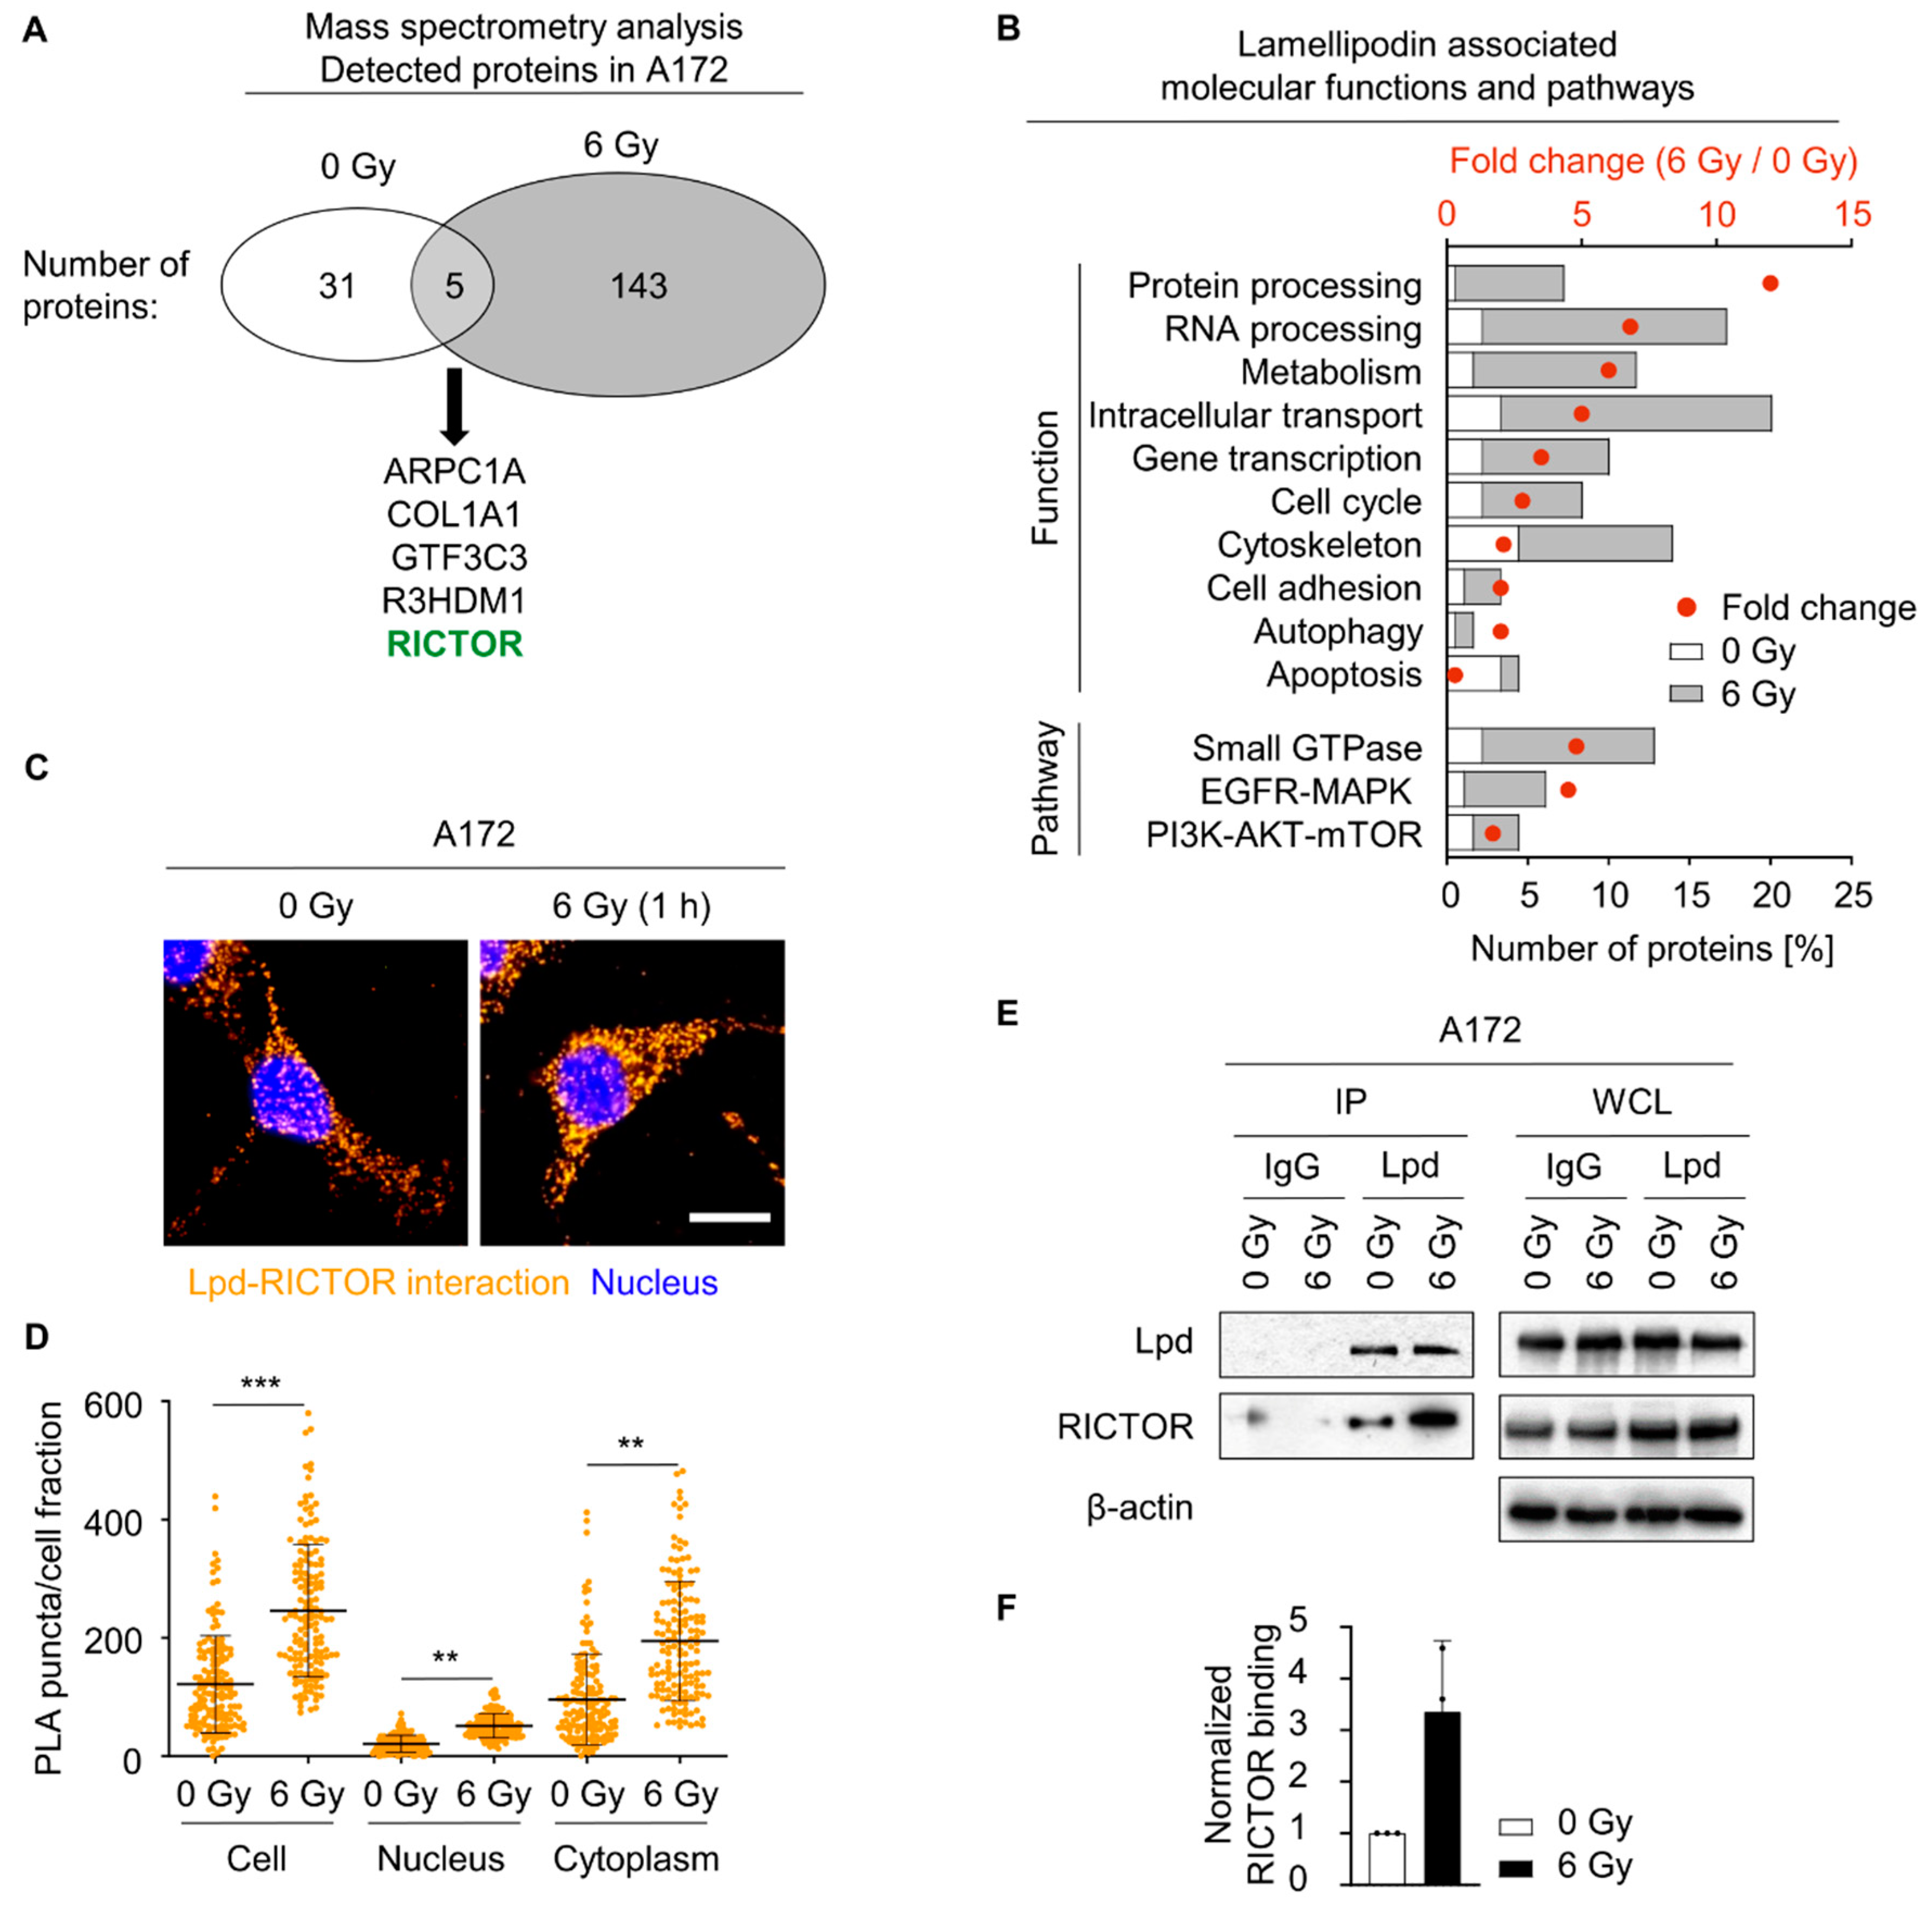
2.4. Lamellipodin Forms a Protein Complex with RICTOR
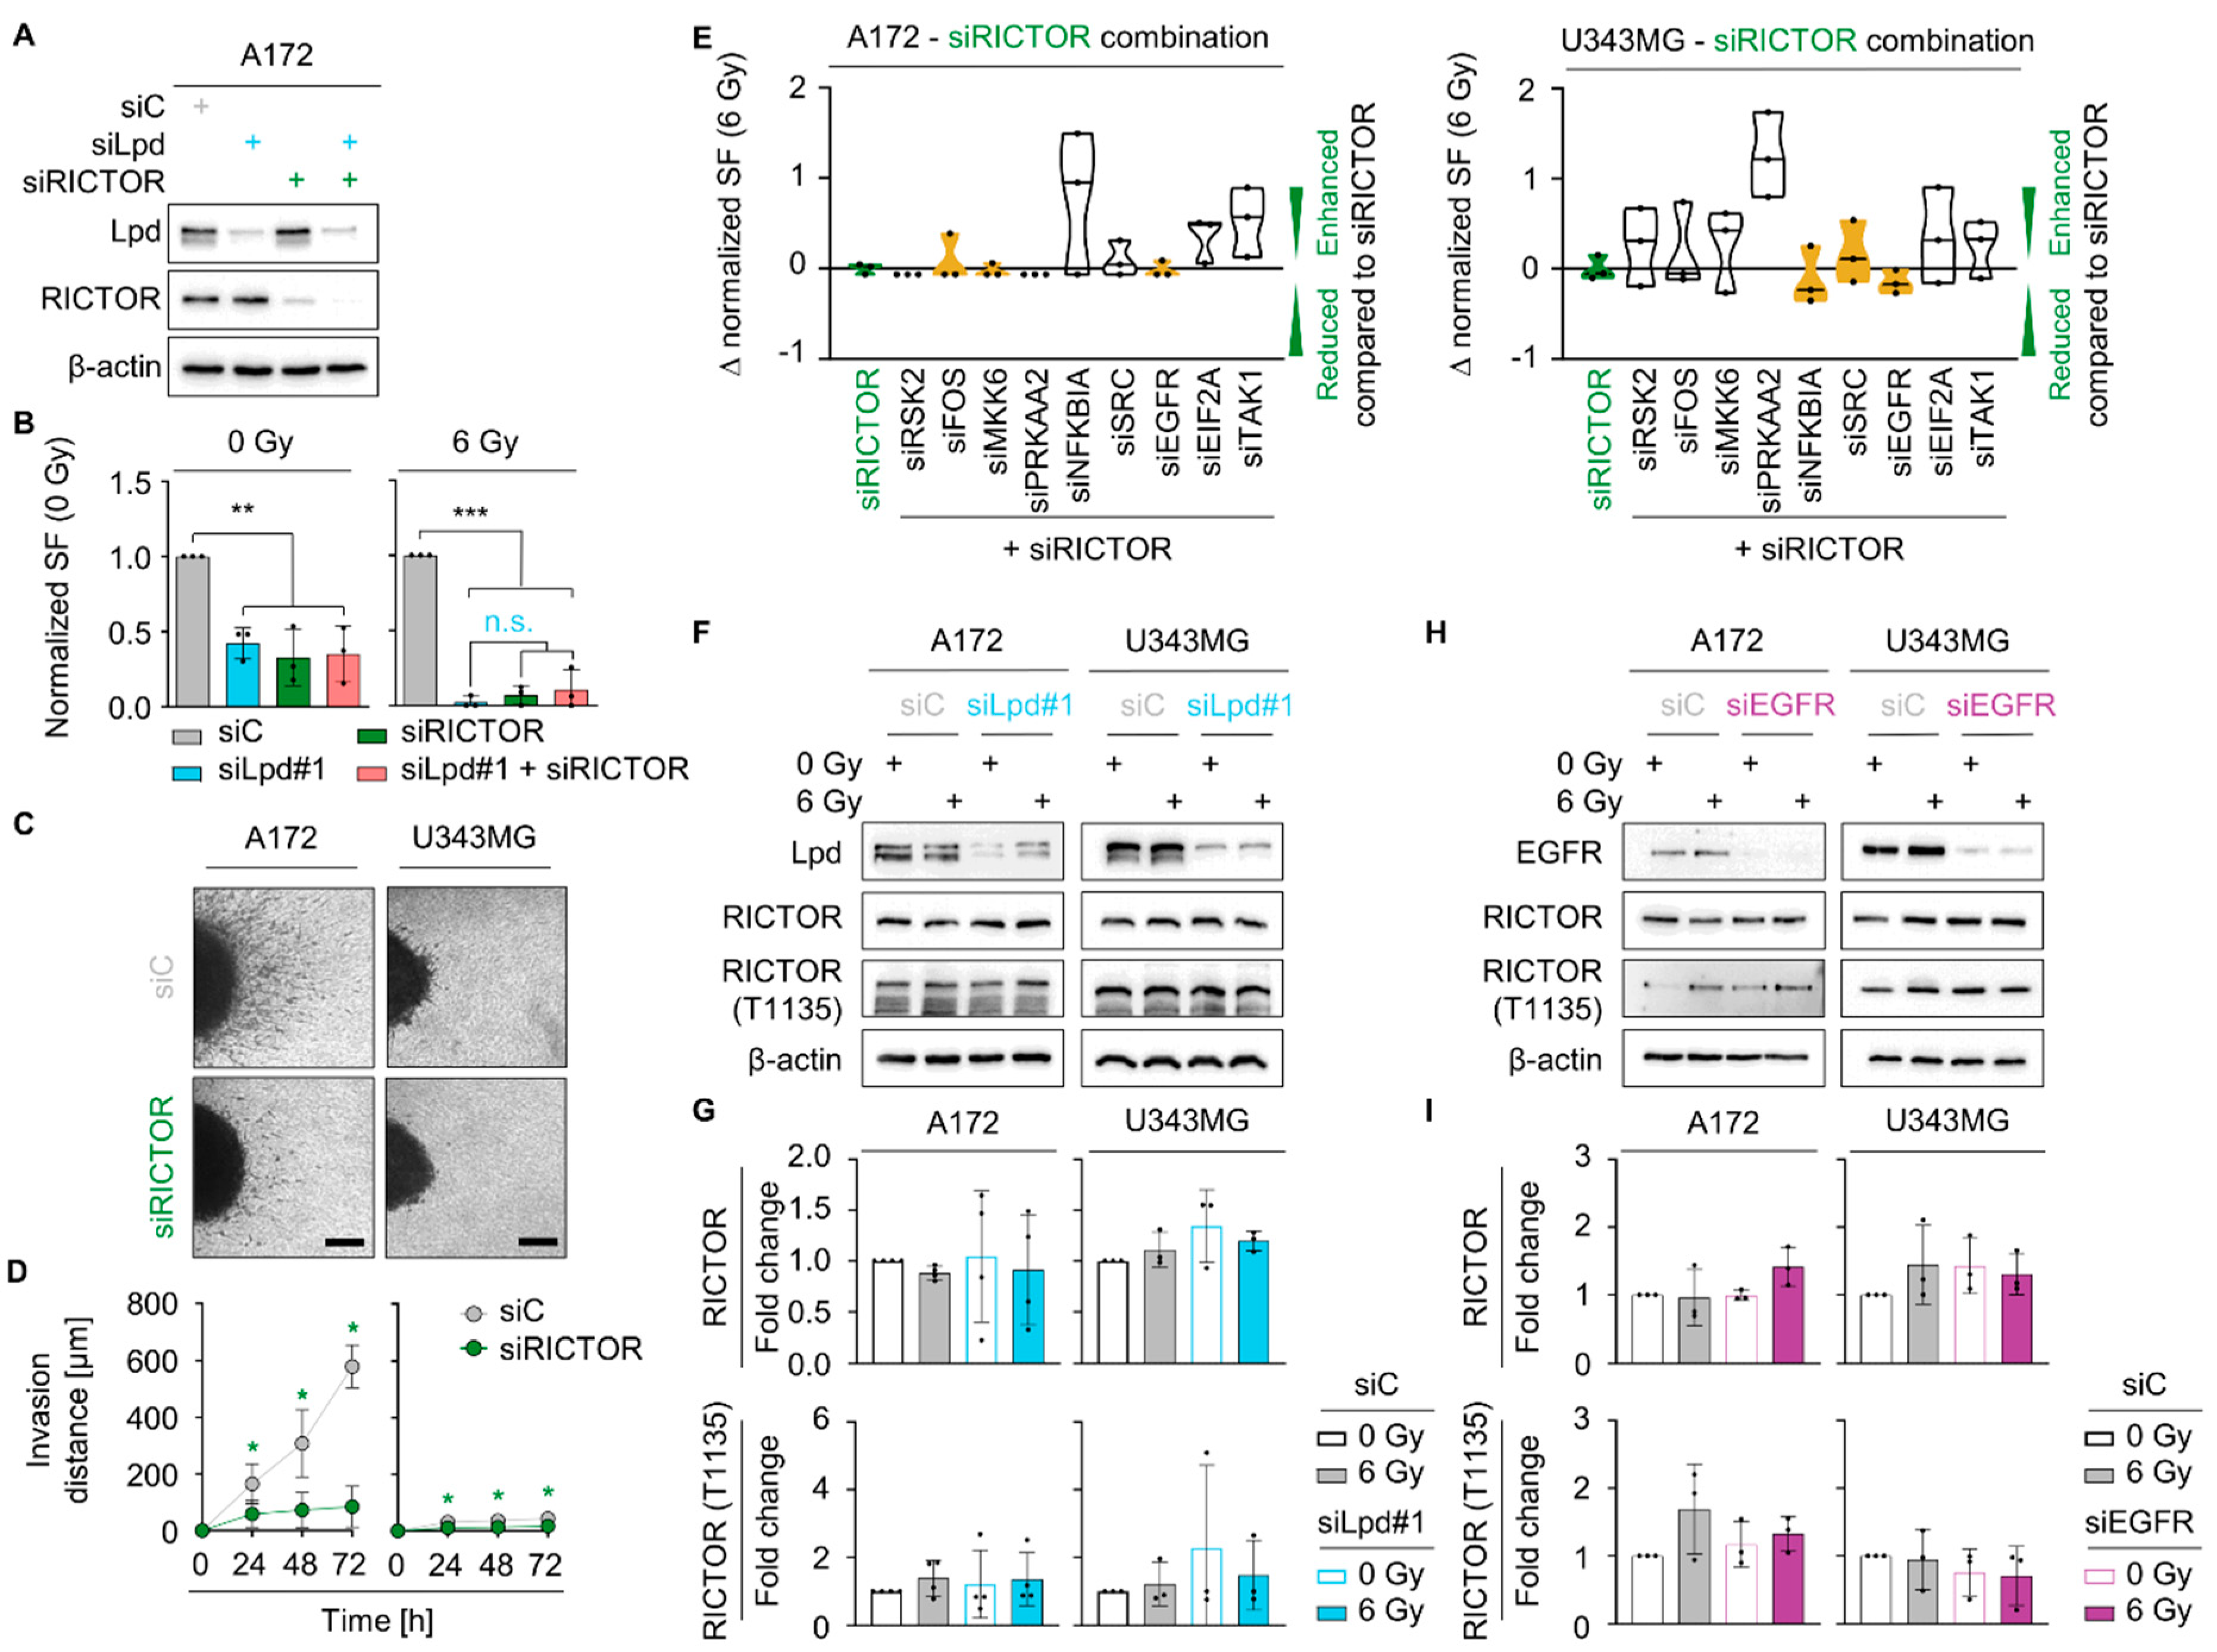
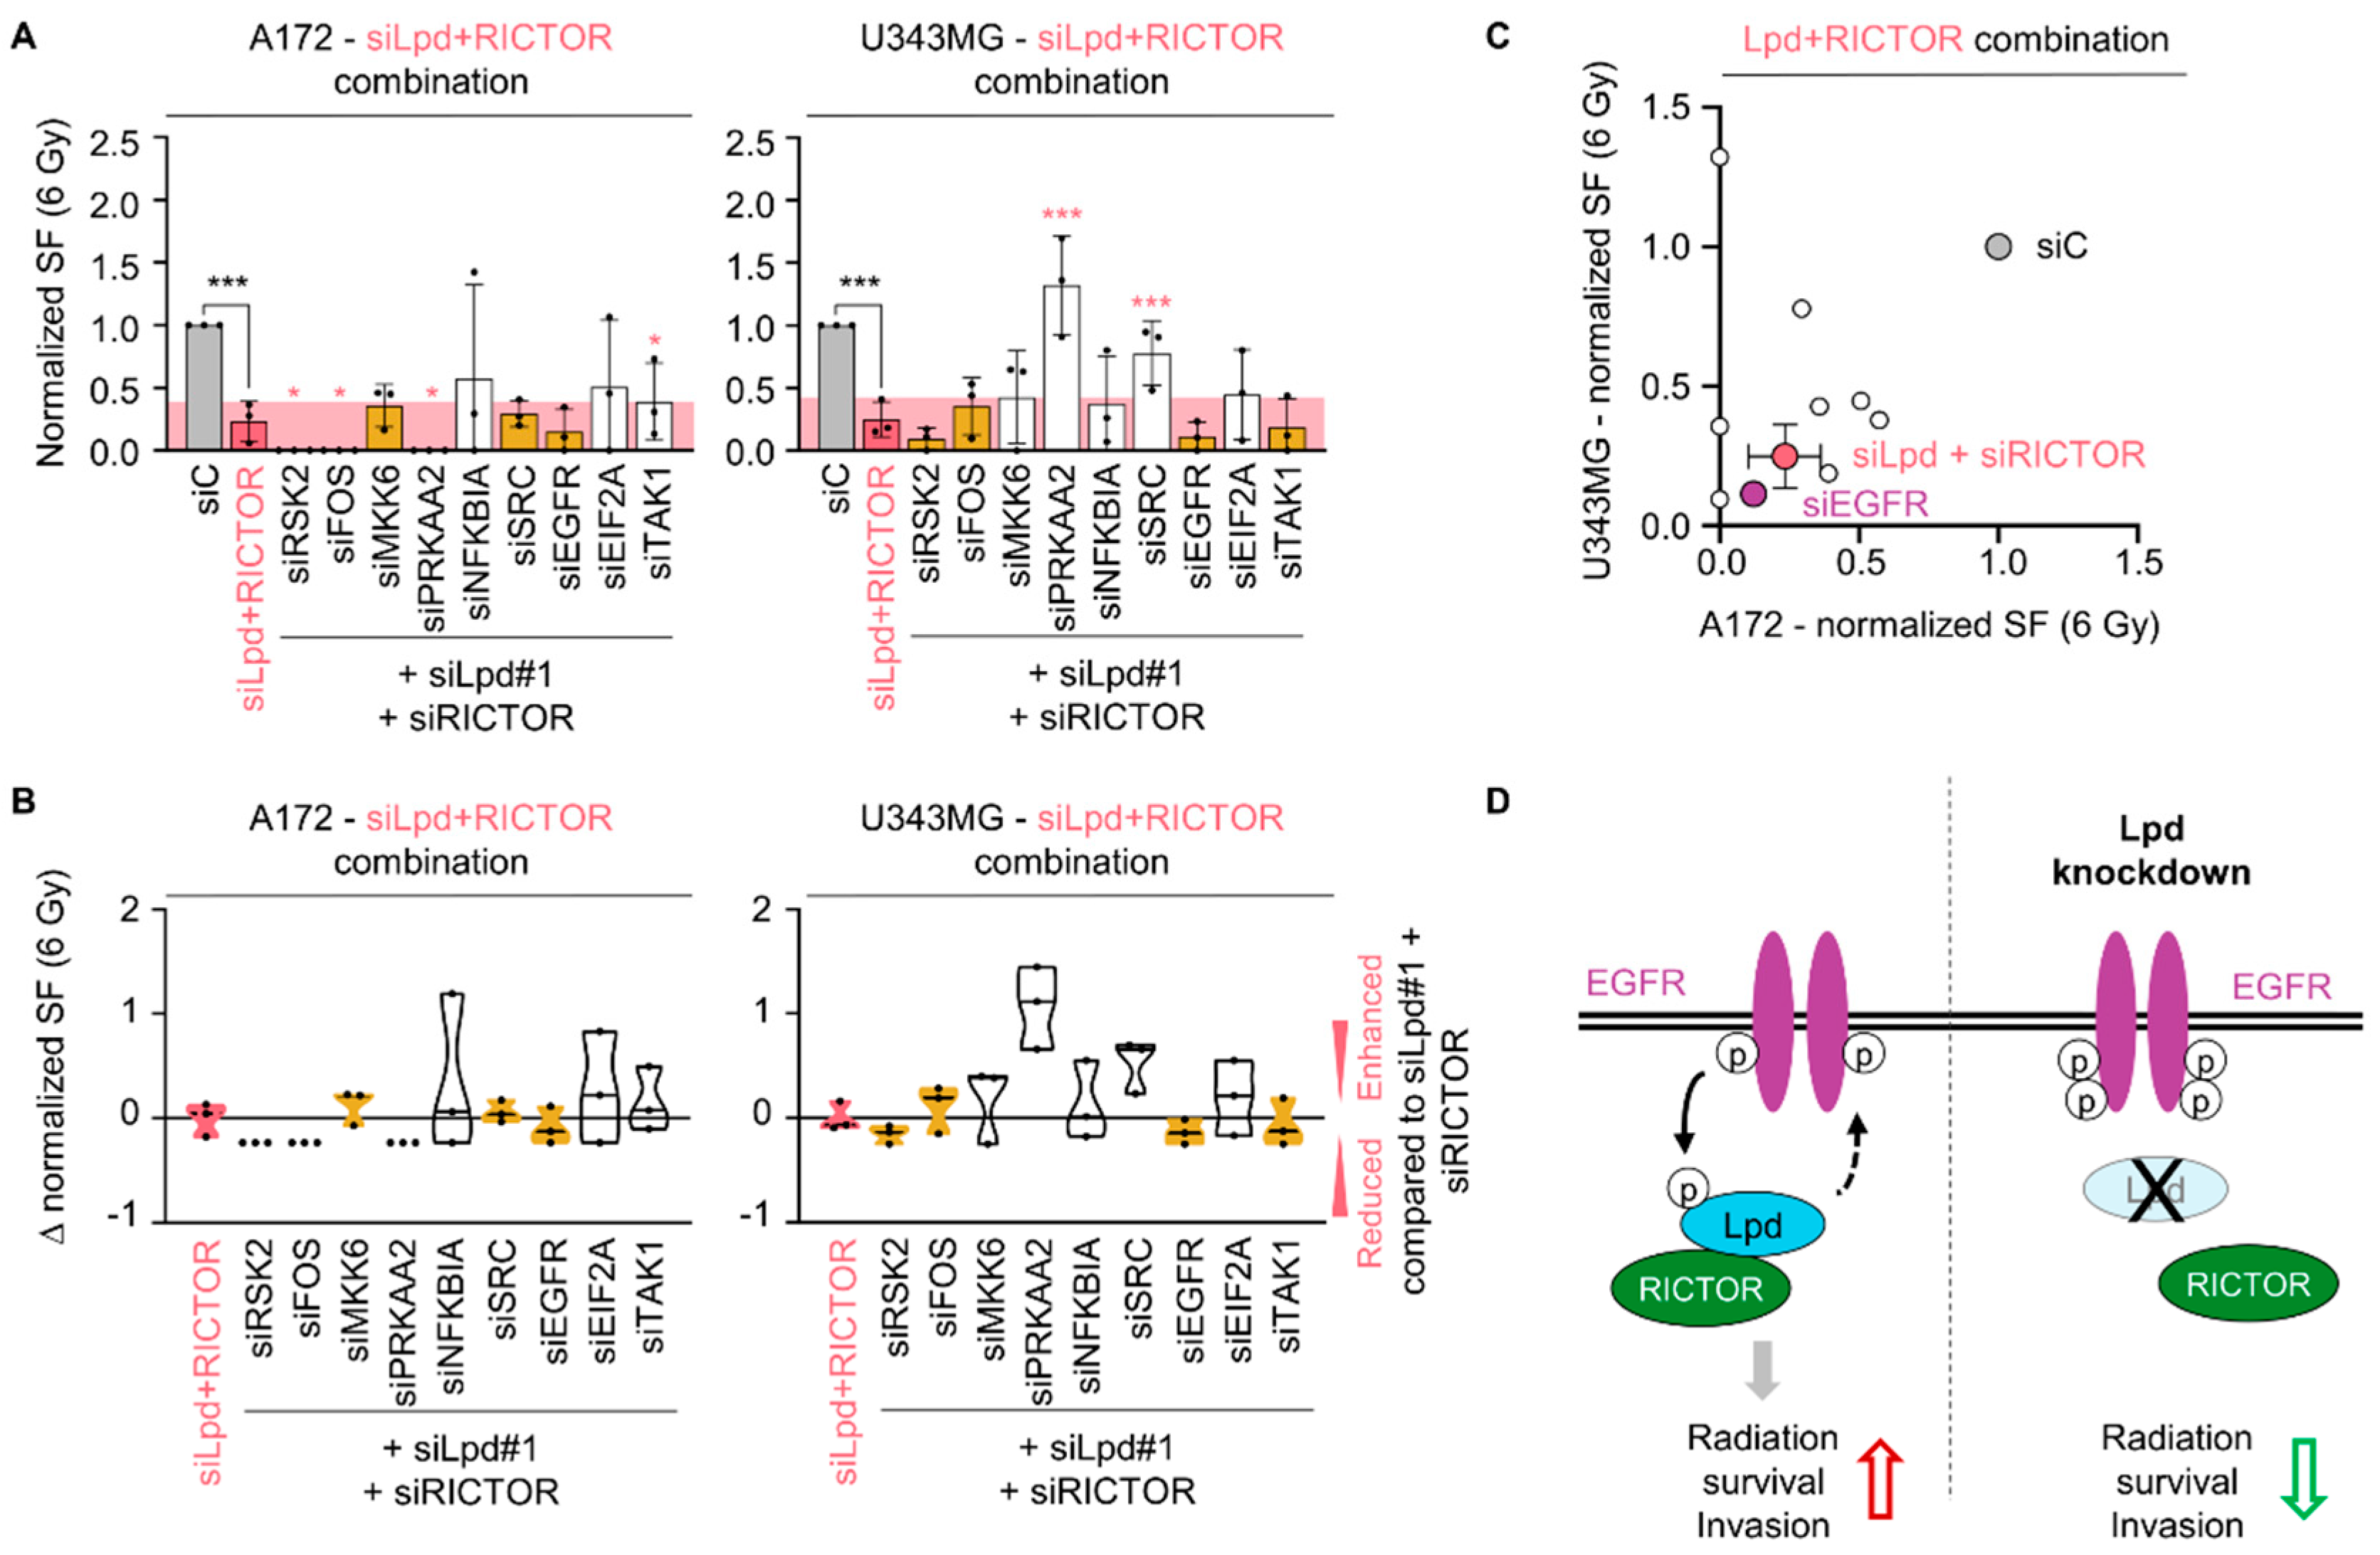
2.5. Lamellipodin and RICTOR Jointly Regulate Glioblastoma Radiosensitivity and Invasion
3. Discussion
4. Materials and Methods
4.1. Cell Lines
4.2. Small Interfering RNA (siRNA) and Transfection
4.3. Lamellipodin Plasmid and Transfection
4.4. 3D Spheroid Invasion Assay
4.5. Colony Formation Assay
4.6. Radiation Exposure
4.7. Proliferation Assay
4.8. Total Protein Extracts and Western Blotting
4.9. Immunoprecipitation and Mass Spectrometry Analysis
4.10. Proximity Ligation Assay
4.11. Immunofluorescence Staining and Microscopy
4.12. Phosphoarray Analysis
4.13. Statistical Analysis
5. Conclusions
Supplementary Materials
Author Contributions
Funding
Institutional Review Board Statement
Informed Consent Statement
Data Availability Statement
Acknowledgments
Conflicts of Interest
References
- Stupp, R.; Hegi, M.E.; Mason, W.P.; van den Bent, M.J.; Taphoorn, M.J.; Janzer, R.C.; Ludwin, S.K.; Allgeier, A.; Fisher, B.; Belanger, K.; et al. Effects of radiotherapy with concomitant and adjuvant temozolomide versus radiotherapy alone on survival in glioblastoma in a randomised phase III study: 5-year analysis of the EORTC-NCIC trial. Lancet Oncol. 2009, 10, 459–466. [Google Scholar] [CrossRef]
- Louis, D.N.; Perry, A.; Reifenberger, G.; von Deimling, A.; Figarella-Branger, D.; Cavenee, W.K.; Ohgaki, H.; Wiestler, O.D.; Kleihues, P.; Ellison, D.W. The 2016 world health organization classification of tumors of the central nervous system: A summary. Acta Neuropathol. 2016, 131, 803–820. [Google Scholar] [CrossRef] [Green Version]
- Stupp, R.; Mason, W.P.; van den Bent, M.J.; Weller, M.; Fisher, B.; Taphoorn, M.J.; Belanger, K.; Brandes, A.A.; Marosi, C.; Bogdahn, U.; et al. Radiotherapy plus concomitant and adjuvant temozolomide for glioblastoma. N. Engl. J. Med. 2005, 352, 987–996. [Google Scholar] [CrossRef] [PubMed]
- Weller, M.; Wick, W.; Aldape, K.; Brada, M.; Berger, M.; Pfister, S.M.; Nishikawa, R.; Rosenthal, M.; Wen, P.Y.; Stupp, R.; et al. Glioma. Nat. Rev. Dis. Primers 2015, 1, 15017. [Google Scholar] [CrossRef] [PubMed]
- Verhaak, R.G.; Hoadley, K.A.; Purdom, E.; Wang, V.; Qi, Y.; Wilkerson, M.D.; Miller, C.R.; Ding, L.; Golub, T.; Mesirov, J.P.; et al. Integrated genomic analysis identifies clinically relevant subtypes of glioblastoma characterized by abnormalities in PDGFRA, IDH1, EGFR, and NF1. Cancer Cell 2010, 17, 98–110. [Google Scholar] [CrossRef] [PubMed] [Green Version]
- Ciriello, G.; Miller, M.L.; Aksoy, B.A.; Senbabaoglu, Y.; Schultz, N.; Sander, C. Emerging landscape of oncogenic signatures across human cancers. Nat. Genet. 2013, 45, 1127–1133. [Google Scholar] [CrossRef] [Green Version]
- Carbonell, W.S.; DeLay, M.; Jahangiri, A.; Park, C.C.; Aghi, M.K. β1 integrin targeting potentiates antiangiogenic therapy and inhibits the growth of bevacizumab-resistant glioblastoma. Cancer Res. 2013, 73, 3145–3154. [Google Scholar] [CrossRef] [Green Version]
- Vehlow, A.; Klapproth, E.; Storch, K.; Dickreuter, E.; Seifert, M.; Dietrich, A.; Bütof, R.; Temme, A.; Cordes, N. Adhesion- and stress-related adaptation of glioma radiochemoresistance is circumvented by β1 integrin/JNK co-targeting. Oncotarget 2017, 8, 49224–49237. [Google Scholar] [CrossRef] [PubMed] [Green Version]
- Vehlow, A.; Klapproth, E.; Jin, S.; Hannen, R.; Hauswald, M.; Bartsch, J.W.; Nimsky, C.; Temme, A.; Leitinger, B.; Cordes, N. Interaction of discoidin domain receptor 1 with a 14-3-3-Beclin-1-Akt1 complex modulates glioblastoma therapy sensitivity. Cell Rep. 2019, 26, 3672–3683.e3677. [Google Scholar] [CrossRef] [PubMed] [Green Version]
- Stommel, J.M.; Kimmelman, A.C.; Ying, H.; Nabioullin, R.; Ponugoti, A.H.; Wiedemeyer, R.; Stegh, A.H.; Bradner, J.E.; Ligon, K.L.; Brennan, C.; et al. Coactivation of receptor tyrosine kinases affects the response of tumor cells to targeted therapies. Science 2007, 318, 287–290. [Google Scholar] [CrossRef] [PubMed]
- Brennan, C.W.; Verhaak, R.G.; McKenna, A.; Campos, B.; Noushmehr, H.; Salama, S.R.; Zheng, S.; Chakravarty, D.; Sanborn, J.Z.; Berman, S.H.; et al. The somatic genomic landscape of glioblastoma. Cell 2013, 155, 462–477. [Google Scholar] [CrossRef]
- Bieńkowski, M.; Piaskowski, S.; Stoczyńska-Fidelus, E.; Szybka, M.; Banaszczyk, M.; Witusik-Perkowska, M.; Jesień-Lewandowicz, E.; Jaskólski, D.J.; Radomiak-Załuska, A.; Jesionek-Kupnicka, D.; et al. Screening for EGFR amplifications with a novel method and their significance for the outcome of glioblastoma patients. PLoS ONE 2013, 8, e65444. [Google Scholar] [CrossRef]
- Li, J.; Liang, R.; Song, C.; Xiang, Y.; Liu, Y. Prognostic significance of epidermal growth factor receptor expression in glioma patients. Onco Targets Ther. 2018, 11, 731–742. [Google Scholar] [CrossRef] [PubMed] [Green Version]
- Pelloski, C.E.; Lin, E.; Zhang, L.; Yung, W.K.; Colman, H.; Liu, J.L.; Woo, S.Y.; Heimberger, A.B.; Suki, D.; Prados, M.; et al. Prognostic associations of activated mitogen-activated protein kinase and Akt pathways in glioblastoma. Clin. Cancer Res. 2006, 12, 3935–3941. [Google Scholar] [CrossRef] [Green Version]
- Tilak, M.; Holborn, J.; New, L.A.; Lalonde, J.; Jones, N. Receptor tyrosine kinase signaling and targeting in glioblastoma multiforme. Int. J. Mol. Sci. 2021, 22, 1831. [Google Scholar] [CrossRef]
- Michael, M.; Vehlow, A.; Navarro, C.; Krause, M. c-Abl, Lamellipodin, and Ena/VASP proteins cooperate in dorsal ruffling of fibroblasts and axonal morphogenesis. Curr. Biol. 2010, 20, 783–791. [Google Scholar] [CrossRef] [PubMed] [Green Version]
- Lagarrigue, F.; Vikas Anekal, P.; Lee, H.S.; Bachir, A.I.; Ablack, J.N.; Horwitz, A.F.; Ginsberg, M.H. A RIAM/lamellipodin-talin-integrin complex forms the tip of sticky fingers that guide cell migration. Nat. Commun. 2015, 6, 8492. [Google Scholar] [CrossRef] [Green Version]
- Watanabe, N.; Bodin, L.; Pandey, M.; Krause, M.; Coughlin, S.; Boussiotis, V.A.; Ginsberg, M.H.; Shattil, S.J. Mechanisms and consequences of agonist-induced talin recruitment to platelet integrin alphaIIbbeta3. J. Cell Biol. 2008, 181, 1211–1222. [Google Scholar] [CrossRef] [PubMed] [Green Version]
- Vehlow, A.; Soong, D.; Vizcay-Barrena, G.; Bodo, C.; Law, A.L.; Perera, U.; Krause, M. Endophilin, Lamellipodin, and Mena cooperate to regulate F-actin-dependent EGF-receptor endocytosis. Embo J. 2013, 32, 2722–2734. [Google Scholar] [CrossRef] [PubMed] [Green Version]
- Krause, M.; Leslie, J.D.; Stewart, M.; Lafuente, E.M.; Valderrama, F.; Jagannathan, R.; Strasser, G.A.; Rubinson, D.A.; Liu, H.; Way, M.; et al. Lamellipodin, an Ena/VASP ligand, is implicated in the regulation of lamellipodial dynamics. Dev. Cell 2004, 7, 571–583. [Google Scholar] [CrossRef] [PubMed] [Green Version]
- Law, A.L.; Vehlow, A.; Kotini, M.; Dodgson, L.; Soong, D.; Theveneau, E.; Bodo, C.; Taylor, E.; Navarro, C.; Perera, U.; et al. Lamellipodin and the Scar/WAVE complex cooperate to promote cell migration in vivo. J. Cell Biol. 2013, 203, 673–689. [Google Scholar] [CrossRef] [PubMed] [Green Version]
- Hansen, S.D.; Mullins, R.D. Lamellipodin promotes actin assembly by clustering Ena/VASP proteins and tethering them to actin filaments. eLife 2015, 4, e06585. [Google Scholar] [CrossRef] [PubMed]
- Lyulcheva, E.; Taylor, E.; Michael, M.; Vehlow, A.; Tan, S.; Fletcher, A.; Krause, M.; Bennett, D. Drosophila pico and its mammalian ortholog lamellipodin activate serum response factor and promote cell proliferation. Dev. Cell 2008, 15, 680–690. [Google Scholar] [CrossRef] [PubMed]
- Chan Wah Hak, L.; Khan, S.; Di Meglio, I.; Law, A.L.; Lucken-Ardjomande Häsler, S.; Quintaneiro, L.M.; Ferreira, A.P.A.; Krause, M.; McMahon, H.T.; Boucrot, E. FBP17 and CIP4 recruit SHIP2 and lamellipodin to prime the plasma membrane for fast endophilin-mediated endocytosis. Nat. Cell Biol. 2018, 20, 1023–1031. [Google Scholar] [CrossRef] [PubMed]
- Dimchev, G.; Amiri, B.; Humphries, A.C.; Schaks, M.; Dimchev, V.; Stradal, T.E.B.; Faix, J.; Krause, M.; Way, M.; Falcke, M.; et al. Lamellipodin tunes cell migration by stabilizing protrusions and promoting adhesion formation. J. Cell Sci. 2020, 133, jcs239020. [Google Scholar] [CrossRef] [PubMed]
- Chang, C.; Adler, C.E.; Krause, M.; Clark, S.G.; Gertler, F.B.; Tessier-Lavigne, M.; Bargmann, C.I. MIG-10/lamellipodin and AGE-1/PI3K promote axon guidance and outgrowth in response to slit and netrin. Curr. Biol. 2006, 16, 854–862. [Google Scholar] [CrossRef] [Green Version]
- Yoshinaga, S.; Ohkubo, T.; Sasaki, S.; Nuriya, M.; Ogawa, Y.; Yasui, M.; Tabata, H.; Nakajima, K. A phosphatidylinositol lipids system, lamellipodin, and Ena/VASP regulate dynamic morphology of multipolar migrating cells in the developing cerebral cortex. J. Neurosci. 2012, 32, 11643–11656. [Google Scholar] [CrossRef] [Green Version]
- Beder, L.B.; Gunduz, M.; Ouchida, M.; Fukushima, K.; Gunduz, E.; Ito, S.; Sakai, A.; Nagai, N.; Nishizaki, K.; Shimizu, K. Genome-wide analyses on loss of heterozygosity in head and neck squamous cell carcinomas. Lab. Investig. 2003, 83, 99–105. [Google Scholar] [CrossRef] [PubMed] [Green Version]
- Otsuka, T.; Kohno, T.; Mori, M.; Noguchi, M.; Hirohashi, S.; Yokota, J. Deletion mapping of chromosome 2 in human lung carcinoma. Genes Chromosomes Cancer 1996, 16, 113–119. [Google Scholar] [CrossRef]
- Takita, J.; Yang, H.W.; Chen, Y.Y.; Hanada, R.; Yamamoto, K.; Teitz, T.; Kidd, V.; Hayashi, Y. Allelic imbalance on chromosome 2q and alterations of the caspase 8 gene in neuroblastoma. Oncogene 2001, 20, 4424–4432. [Google Scholar] [CrossRef] [Green Version]
- Eppert, K.; Wunder, J.S.; Aneliunas, V.; Tsui, L.C.; Scherer, S.W.; Andrulis, I.L. Altered expression and deletion of RMO1 in osteosarcoma. Int. J. Cancer 2005, 114, 738–746. [Google Scholar] [CrossRef]
- Kurozumi, S.; Joseph, C.; Sonbul, S.; Aleskandarany, M.A.; Pigera, M.; Alsaleem, M.; Alsaeed, S.; Kariri, Y.; Nolan, C.C.; Diez-Rodriguez, M.; et al. Clinicopathological and prognostic significance of Ras association and pleckstrin homology domains 1 (RAPH1) in breast cancer. Breast Cancer Res. Treat. 2018, 172, 61–68. [Google Scholar] [CrossRef] [PubMed]
- Carmona, G.; Perera, U.; Gillett, C.; Naba, A.; Law, A.L.; Sharma, V.P.; Wang, J.; Wyckoff, J.; Balsamo, M.; Mosis, F.; et al. Lamellipodin promotes invasive 3D cancer cell migration via regulated interactions with Ena/VASP and SCAR/WAVE. Oncogene 2016, 35, 5155–5169. [Google Scholar] [CrossRef] [PubMed]
- Taylor, E.; Alqadri, N.; Dodgson, L.; Mason, D.; Lyulcheva, E.; Messina, G.; Bennett, D. MRL proteins cooperate with activated Ras in glia to drive distinct oncogenic outcomes. Oncogene 2017, 36, 4311–4322. [Google Scholar] [CrossRef] [PubMed] [Green Version]
- Vehlow, A.; Cordes, N. Invasion as target for therapy of glioblastoma multiforme. Biochim. Biophys. Acta 2013, 1836, 236–244. [Google Scholar] [CrossRef] [PubMed]
- Bashir, T.; Cloninger, C.; Artinian, N.; Anderson, L.; Bernath, A.; Holmes, B.; Benavides-Serrato, A.; Sabha, N.; Nishimura, R.N.; Guha, A.; et al. Conditional astroglial Rictor overexpression induces malignant glioma in mice. PLoS ONE 2012, 7, e47741. [Google Scholar] [CrossRef] [PubMed] [Green Version]
- Tanaka, K.; Babic, I.; Nathanson, D.; Akhavan, D.; Guo, D.; Gini, B.; Dang, J.; Zhu, S.; Yang, H.; De Jesus, J.; et al. Oncogenic EGFR signaling activates an mTORC2-NF-κB pathway that promotes chemotherapy resistance. Cancer Discov. 2011, 1, 524–538. [Google Scholar] [CrossRef] [Green Version]
- Bae, Y.H.; Ding, Z.; Das, T.; Wells, A.; Gertler, F.; Roy, P. Profilin1 regulates PI(3,4)P2 and lamellipodin accumulation at the leading edge thus influencing motility of MDA-MB-231 cells. Proc. Natl. Acad. Sci. USA 2010, 107, 21547–21552. [Google Scholar] [CrossRef] [PubMed] [Green Version]
- Alexander, S.; Friedl, P. Cancer invasion and resistance: Interconnected processes of disease progression and therapy failure. Trends Mol. Med. 2012, 18, 13–26. [Google Scholar] [CrossRef] [PubMed]
- Skinner, H.D.; Giri, U.; Yang, L.; Woo, S.H.; Story, M.D.; Pickering, C.R.; Byers, L.A.; Williams, M.D.; El-Naggar, A.; Wang, J.; et al. Proteomic Profiling Identifies PTK2/FAK as a Driver of Radioresistance in HPV-negative Head and Neck Cancer. Clin. Cancer Res. 2016, 22, 4643–4650. [Google Scholar] [CrossRef] [Green Version]
- Hauck, C.R.; Sieg, D.J.; Hsia, D.A.; Loftus, J.C.; Gaarde, W.A.; Monia, B.P.; Schlaepfer, D.D. Inhibition of focal adhesion kinase expression or activity disrupts epidermal growth factor-stimulated signaling promoting the migration of invasive human carcinoma cells. Cancer Res. 2001, 61, 7079–7090. [Google Scholar]
- Deville, S.S.; Vehlow, A.; Förster, S.; Dickreuter, E.; Borgmann, K.; Cordes, N. The Intermediate Filament Synemin Regulates Non-Homologous End Joining in an ATM-Dependent Manner. Cancers 2020, 12, 1717. [Google Scholar] [CrossRef] [PubMed]
- Noetzel, E.; Rose, M.; Sevinc, E.; Hilgers, R.D.; Hartmann, A.; Naami, A.; Knüchel, R.; Dahl, E. Intermediate filament dynamics and breast cancer: Aberrant promoter methylation of the Synemin gene is associated with early tumor relapse. Oncogene 2010, 29, 4814–4825. [Google Scholar] [CrossRef] [PubMed] [Green Version]
- Ceccarelli, M.; Barthel, F.P.; Malta, T.M.; Sabedot, T.S.; Salama, S.R.; Murray, B.A.; Morozova, O.; Newton, Y.; Radenbaugh, A.; Pagnotta, S.M.; et al. Molecular profiling reveals biologically discrete subsets and pathways of progression in diffuse glioma. Cell 2016, 164, 550–563. [Google Scholar] [CrossRef] [PubMed] [Green Version]
- Aksamitiene, E.; Kiyatkin, A.; Kholodenko, B.N. Cross-talk between mitogenic Ras/MAPK and survival PI3K/Akt pathways: A fine balance. Biochem. Soc. Trans. 2012, 40, 139–146. [Google Scholar] [CrossRef] [PubMed]
- An, Z.; Aksoy, O.; Zheng, T.; Fan, Q.W.; Weiss, W.A. Epidermal growth factor receptor and EGFRvIII in glioblastoma: Signaling pathways and targeted therapies. Oncogene 2018, 37, 1561–1575. [Google Scholar] [CrossRef]
- Weernink, P.A.; Rijksen, G. Activation and translocation of c-Src to the cytoskeleton by both platelet-derived growth factor and epidermal growth factor. J. Biol. Chem. 1995, 270, 2264–2267. [Google Scholar] [CrossRef] [PubMed] [Green Version]
- Chen, Z.; Oh, D.; Dubey, A.K.; Yao, M.; Yang, B.; Groves, J.T.; Sheetz, M. EGFR family and Src family kinase interactions: Mechanics matters? Curr. Opin. Cell Biol. 2018, 51, 97–102. [Google Scholar] [CrossRef] [PubMed]
- Caswell, P.T.; Chan, M.; Lindsay, A.J.; McCaffrey, M.W.; Boettiger, D.; Norman, J.C. Rab-coupling protein coordinates recycling of alpha5beta1 integrin and EGFR1 to promote cell migration in 3D microenvironments. J. Cell Biol. 2008, 183, 143–155. [Google Scholar] [CrossRef] [Green Version]
- Francavilla, C.; Rigbolt, K.T.; Emdal, K.B.; Carraro, G.; Vernet, E.; Bekker-Jensen, D.B.; Streicher, W.; Wikström, M.; Sundström, M.; Bellusci, S.; et al. Functional proteomics defines the molecular switch underlying FGF receptor trafficking and cellular outputs. Mol. Cell 2013, 51, 707–722. [Google Scholar] [CrossRef] [PubMed] [Green Version]
- Bae, Y.H.; Mui, K.L.; Hsu, B.Y.; Liu, S.L.; Cretu, A.; Razinia, Z.; Xu, T.; Puré, E.; Assoian, R.K. A FAK-Cas-Rac-lamellipodin signaling module transduces extracellular matrix stiffness into mechanosensitive cell cycling. Sci. Signal. 2014, 7, ra57. [Google Scholar] [CrossRef] [PubMed] [Green Version]
- Gorai, S.; Paul, D.; Haloi, N.; Borah, R.; Santra, M.K.; Manna, D. Mechanistic insights into the phosphatidylinositol binding properties of the pleckstrin homology domain of lamellipodin. Mol. Biosyst. 2016, 12, 747–757. [Google Scholar] [CrossRef] [PubMed]
- Furnari, F.B.; Cloughesy, T.F.; Cavenee, W.K.; Mischel, P.S. Heterogeneity of epidermal growth factor receptor signalling networks in glioblastoma. Nat. Rev. Cancer 2015, 15, 302–310. [Google Scholar] [CrossRef] [PubMed] [Green Version]
- Weller, M.; Butowski, N.; Tran, D.D.; Recht, L.D.; Lim, M.; Hirte, H.; Ashby, L.; Mechtler, L.; Goldlust, S.A.; Iwamoto, F.; et al. Rindopepimut with temozolomide for patients with newly diagnosed, EGFRvIII-expressing glioblastoma (ACT IV): A randomised, double-blind, international phase 3 trial. Lancet Oncol. 2017, 18, 1373–1385. [Google Scholar] [CrossRef] [Green Version]
- Westphal, M.; Heese, O.; Steinbach, J.P.; Schnell, O.; Schackert, G.; Mehdorn, M.; Schulz, D.; Simon, M.; Schlegel, U.; Senft, C.; et al. A randomised, open label phase III trial with nimotuzumab, an anti-epidermal growth factor receptor monoclonal antibody in the treatment of newly diagnosed adult glioblastoma. Eur. J. Cancer 2015, 51, 522–532. [Google Scholar] [CrossRef] [PubMed]
- Jebali, A.; Dumaz, N. The role of RICTOR downstream of receptor tyrosine kinase in cancers. Mol. Cancer 2018, 17, 39. [Google Scholar] [CrossRef] [PubMed]
- Zhao, D.; Jiang, M.; Zhang, X.; Hou, H. The role of RICTOR amplification in targeted therapy and drug resistance. Mol. Med. 2020, 26, 20. [Google Scholar] [CrossRef] [Green Version]
- Masui, K.; Tanaka, K.; Ikegami, S.; Villa, G.R.; Yang, H.; Yong, W.H.; Cloughesy, T.F.; Yamagata, K.; Arai, N.; Cavenee, W.K.; et al. Glucose-dependent acetylation of Rictor promotes targeted cancer therapy resistance. Proc. Natl. Acad. Sci. USA 2015, 112, 9406–9411. [Google Scholar] [CrossRef] [PubMed] [Green Version]
- Katreddy, R.R.; Bollu, L.R.; Su, F.; Xian, N.; Srivastava, S.; Thomas, R.; Dai, Y.; Wu, B.; Xu, Y.; Rea, M.A.; et al. Targeted reduction of the EGFR protein, but not inhibition of its kinase activity, induces mitophagy and death of cancer cells through activation of mTORC2 and Akt. Oncogenesis 2018, 7, 5. [Google Scholar] [CrossRef] [PubMed] [Green Version]
- Serrano, I.; McDonald, P.C.; Lock, F.E.; Dedhar, S. Role of the integrin-linked kinase (ILK)/Rictor complex in TGFβ-1-induced epithelial-mesenchymal transition (EMT). Oncogene 2013, 32, 50–60. [Google Scholar] [CrossRef] [PubMed] [Green Version]
- Gao, D.; Wan, L.; Inuzuka, H.; Berg, A.H.; Tseng, A.; Zhai, B.; Shaik, S.; Bennett, E.; Tron, A.E.; Gasser, J.A.; et al. Rictor forms a complex with Cullin-1 to promote SGK1 ubiquitination and destruction. Mol. Cell 2010, 39, 797–808. [Google Scholar] [CrossRef] [Green Version]
- Zhang, F.; Zhang, X.; Li, M.; Chen, P.; Zhang, B.; Guo, H.; Cao, W.; Wei, X.; Cao, X.; Hao, X.; et al. mTOR complex component Rictor interacts with PKCzeta and regulates cancer cell metastasis. Cancer Res. 2010, 70, 9360–9370. [Google Scholar] [CrossRef] [PubMed] [Green Version]
- McDonald, P.C.; Oloumi, A.; Mills, J.; Dobreva, I.; Maidan, M.; Gray, V.; Wederell, E.D.; Bally, M.B.; Foster, L.J.; Dedhar, S. Rictor and integrin-linked kinase interact and regulate Akt phosphorylation and cancer cell survival. Cancer Res. 2008, 68, 1618–1624. [Google Scholar] [CrossRef] [Green Version]
- Sarbassov, D.D.; Ali, S.M.; Kim, D.H.; Guertin, D.A.; Latek, R.R.; Erdjument-Bromage, H.; Tempst, P.; Sabatini, D.M. Rictor, a novel binding partner of mTOR, defines a rapamycin-insensitive and raptor-independent pathway that regulates the cytoskeleton. Curr. Biol. 2004, 14, 1296–1302. [Google Scholar] [CrossRef] [PubMed] [Green Version]
- Hagan, G.N.; Lin, Y.; Magnuson, M.A.; Avruch, J.; Czech, M.P. A Rictor-Myo1c complex participates in dynamic cortical actin events in 3T3-L1 adipocytes. Mol. Cell. Biol. 2008, 28, 4215–4226. [Google Scholar] [CrossRef] [PubMed] [Green Version]
- Morrison Joly, M.; Williams, M.M.; Hicks, D.J.; Jones, B.; Sanchez, V.; Young, C.D.; Sarbassov, D.D.; Muller, W.J.; Brantley-Sieders, D.; Cook, R.S. Two distinct mTORC2-dependent pathways converge on Rac1 to drive breast cancer metastasis. Breast Cancer Res. 2017, 19, 74. [Google Scholar] [CrossRef] [PubMed] [Green Version]
- Diz-Muñoz, A.; Thurley, K.; Chintamen, S.; Altschuler, S.J.; Wu, L.F.; Fletcher, D.A.; Weiner, O.D. Membrane tension acts through PLD2 and mTORC2 to limit actin network assembly during neutrophil migration. PLoS Biol. 2016, 14, e1002474. [Google Scholar] [CrossRef] [Green Version]
- Yan, H.; Zhang, B.; Li, S.; Zhao, Q. A formal model for analyzing drug combination effects and its application in TNF-alpha-induced NFkappaB pathway. BMC Syst. Biol. 2010, 4, 50. [Google Scholar] [CrossRef] [PubMed] [Green Version]
- Cox, J.; Hein, M.Y.; Luber, C.A.; Paron, I.; Nagaraj, N.; Mann, M. Accurate proteome-wide label-free quantification by delayed normalization and maximal peptide ratio extraction, termed MaxLFQ. Mol. Cell. Proteom. 2014, 13, 2513–2526. [Google Scholar] [CrossRef] [PubMed] [Green Version]
- Joshi-Tope, G.; Gillespie, M.; Vastrik, I.; D’Eustachio, P.; Schmidt, E.; de Bono, B.; Jassal, B.; Gopinath, G.R.; Wu, G.R.; Matthews, L.; et al. Reactome: A knowledgebase of biological pathways. Nucleic Acids Res. 2005, 33, D428–D432. [Google Scholar] [CrossRef] [PubMed] [Green Version]
- Kanehisa, M.; Sato, Y.; Kawashima, M.; Furumichi, M.; Tanabe, M. KEGG as a reference resource for gene and protein annotation. Nucleic Acids Res. 2016, 44, D457–D462. [Google Scholar] [CrossRef] [Green Version]
- Eke, I.; Deuse, Y.; Hehlgans, S.; Gurtner, K.; Krause, M.; Baumann, M.; Shevchenko, A.; Sandfort, V.; Cordes, N. β₁Integrin/FAK/cortactin signaling is essential for human head and neck cancer resistance to radiotherapy. J. Clin. Investig. 2012, 122, 1529–1540. [Google Scholar] [CrossRef] [PubMed] [Green Version]
- Shannon, P.; Markiel, A.; Ozier, O.; Baliga, N.S.; Wang, J.T.; Ramage, D.; Amin, N.; Schwikowski, B.; Ideker, T. Cytoscape: A software environment for integrated models of biomolecular interaction networks. Genome Res. 2003, 13, 2498–2504. [Google Scholar] [CrossRef] [PubMed]


Publisher’s Note: MDPI stays neutral with regard to jurisdictional claims in published maps and institutional affiliations. |
© 2021 by the authors. Licensee MDPI, Basel, Switzerland. This article is an open access article distributed under the terms and conditions of the Creative Commons Attribution (CC BY) license (https://creativecommons.org/licenses/by/4.0/).
Share and Cite
Moritz, S.; Krause, M.; Schlatter, J.; Cordes, N.; Vehlow, A. Lamellipodin-RICTOR Signaling Mediates Glioblastoma Cell Invasion and Radiosensitivity Downstream of EGFR. Cancers 2021, 13, 5337. https://doi.org/10.3390/cancers13215337
Moritz S, Krause M, Schlatter J, Cordes N, Vehlow A. Lamellipodin-RICTOR Signaling Mediates Glioblastoma Cell Invasion and Radiosensitivity Downstream of EGFR. Cancers. 2021; 13(21):5337. https://doi.org/10.3390/cancers13215337
Chicago/Turabian StyleMoritz, Stefanie, Matthias Krause, Jessica Schlatter, Nils Cordes, and Anne Vehlow. 2021. "Lamellipodin-RICTOR Signaling Mediates Glioblastoma Cell Invasion and Radiosensitivity Downstream of EGFR" Cancers 13, no. 21: 5337. https://doi.org/10.3390/cancers13215337