Article

An Immunohistochemical Evaluation of Tumor-Associated Glycans and Mucins as Targets for Molecular Imaging of Pancreatic Ductal Adenocarcinoma

by
Ruben D. Houvast
1,
Kira Thijse
1,
Jesse V. Groen
1,
JiaXin Chua
2,
Mireille Vankemmelbeke
2,
Lindy G. Durrant
2,3,
J. Sven D. Mieog
1,
Bert A. Bonsing
1,
Alexander L. Vahrmeijer
1,
Peter J. K. Kuppen
1,
A. Stijn L. P. Crobach
4 and
Cornelis F. M. Sier
1,5,*
1
Department of Surgery, Leiden University Medical Center, 2333 ZA Leiden, The Netherlands
2
Scancell Limited, University of Nottingham Biodiscovery Institute, University Park, Nottingham NG7 2RD, UK
3
Division of Cancer and Stem Cells, School of Medicine, University of Nottingham Biodiscovery Institute, University Park, Nottingham NG7 2RD, UK
4
Department of Pathology, Leiden University Medical Center, 2333 ZA Leiden, The Netherlands
5
Percuros BV, 2333 CL Leiden, The Netherlands
*
Author to whom correspondence should be addressed.
Cancers 2021, 13(22), 5777; https://doi.org/10.3390/cancers13225777
Submission received: 22 October 2021 / Revised: 10 November 2021 / Accepted: 15 November 2021 / Published: 18 November 2021
(This article belongs to the Special Issue Combination and Innovative Therapies for Pancreatic Cancer)

Abstract

:

Simple Summary

Distinguishing pancreatic cancer from healthy tissue before and during surgery can be enhanced by using molecular tracers directed at molecules on tumor cells allowing high-contrast visualization of tumor tissue, eventually improving diagnosis and surgical removal. Albeit sugar molecules and proteins carrying a large amount of sugars-mucins- have gained significant interest as tumor-specific targets, their relative presence on structures surrounding tumor tissues and lymph node metastases is unknown. The current study shows that the presence of several, but not all, investigated sugar molecules and mucins on pancreatic cancer cells is higher compared to surrounding tissues. Moreover, given their abundance on tumor cells in lymph nodes and their absence on normal lymph nodes, all investigated targets are high-potential targets for visualization of lymph node metastases. This study paves the way for the development of molecular tracers against the targets evaluated herein to allow improvement of pancreatic cancer treatment.

Abstract

Targeted molecular imaging may overcome current challenges in the preoperative and intraoperative delineation of pancreatic ductal adenocarcinoma (PDAC). Tumor-associated glycans Lea/c/x, sdi-Lea, sLea, sLex, sTn as well as mucin-1 (MUC1) and mucin-5AC (MU5AC) have gained significant interest as targets for PDAC imaging. To evaluate their PDAC molecular imaging potential, biomarker expression was determined using immunohistochemistry on PDAC, (surrounding) chronic pancreatitis (CP), healthy pancreatic, duodenum, positive (LN+) and negative lymph node (LN) tissues, and quantified using a semi-automated digital image analysis workflow. Positive expression on PDAC tissues was found on 83% for Lea/c/x, 94% for sdi-Lea, 98% for sLea, 90% for sLex, 88% for sTn, 96% for MUC1 and 67% for MUC5AC, where all were not affected by the application of neoadjuvant therapy. Compared to PDAC, all biomarkers were significantly lower expressed on CP, healthy pancreatic and duodenal tissues, except for sTn and MUC1, which showed a strong expression on duodenum (sTn tumor:duodenum ratio: 0.6, p < 0.0001) and healthy pancreatic tissues (MUC1 tumor:pancreas ratio: 1.0, p > 0.9999), respectively. All biomarkers are suitable targets for correct identification of LN+, as well as the distinction of LN+ from LN tissues. To conclude, this study paves the way for the development and evaluation of Lea/c/x-, sdi-Lea-, sLea-, sLex- and MUC5AC-specific tracers for molecular imaging of PDAC imaging and their subsequent introduction into the clinic.

Graphical Abstract

1. Introduction

Pancreatic ductal adenocarcinoma (PDAC) is the seventh leading cause of cancer-related mortality in the Western world, with a dismal 5-year survival of only 9% [1]. As 80–90% of patients present with locally advanced or metastatic disease, radical surgical resection, which is the only curative therapy, is often not feasible. Extensive preoperative imaging using endoscopic ultrasound (EUS), magnetic resonance imaging (MRI) and positron emission tomography/computed tomography (PET/CT) is crucial for accurate selection and stratification of patients for surgery. Nevertheless, 20–47% of patients who qualify for surgery present with an irresectable disease at the time of surgery [2,3], whereas R1 (microscopic residual disease) resections are reported in up to 80% of patients, both of which are associated with worse overall survival [4,5,6]. On the other hand, approximately 7% of resections for suspected pancreatic cancer are performed for benign diseases, such as chronic pancreatitis (CP) [7]. Considering the abundance of desmoplasia in both PDAC and CP, which may be further induced by the application of neoadjuvant therapy (NAT), distinguishing malignant from healthy or benign tissue is challenging in both a preoperative and real-time intraoperative setting [8,9,10]. By facilitating high-contrast visualization of tumor cells, targeted molecular imaging may play a key role in overcoming these challenges, potentially avoiding resection for benign and irresectable disease, while simultaneously aiming to increase radical resection rates in resectable patients.
Within the continuing search for novel targets for molecular imaging, tumor-associated glycans and mucins have gained significant interest (reviewed in [11]). In cancer, many proteins and lipids are aberrantly glycosylated, which results in the appearance of truncated O-glycans, such as sialyl-Thomsen-Nouveau (sTn) and Lewis glycans, such as sialyl-Lewisa (sLea) and sialyl-Lewisx (sLex), Lewisa/c/x (Lea/c/x), sialyl-di-Lewisa (sdi-Lea) and related glyco-epitopes [12,13,14,15]. Some of these structures, such as sLea and sLex, are involved in tumor progression, both directly and indirectly by applying conformational changes to their carrier protein [16,17].
In reference to glycans, mucins, which are high-molecular-weight proteins that are extensively coated with O-glycans, seem interesting tumor-specific targets based on their high expression on tumor tissues, low abundance in healthy tissues and pivotal roles in carcinogenesis [18,19] Especially, transmembrane mucin-1 (MUC1) and secreted mucin-5AC (MUC5AC), which are both, directly and indirectly, involved in tumor progression via their truncated sTn glycans, are considered promising targets for PDAC targeting [18]. As a result of mucin overexpression, tumor-associated glycans become strongly amplified on the outermost layer of multiple proteins simultaneously, making them a set of high-potential molecular imaging targets with advantages for targeting beyond proteins [11,20]. Although the aforementioned tumor-associated O-glycans and mucins are strongly expressed on pancreatic cancers cells, their relative expression on (surrounding) chronic pancreatitis as well as on healthy pancreas and duodenum and metastatic lymph nodes, which defines their molecular imaging suitability, is underexplored.
Therefore, the current study aims to evaluate and compare the potential of tumor-associated glycans Lea/c/x, sdi-Lea, sLea, sLex and sTn, and mucins MUC1 and MUC5AC for molecular imaging of PDAC using a semi-automated, machine learning-based digital image analysis workflow.

2. Materials and Methods

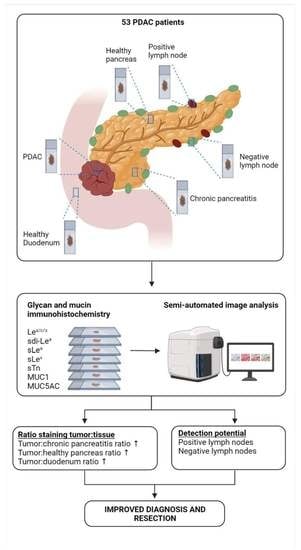
2.1. Patient and Tissue Selection

Medical records and pathology reports from patients who underwent pancreatic resection in the Leiden University Medical Center (LUMC) between August 2011 and July 2020 were retrospectively reviewed. Patients older than 18 years diagnosed with PDAC or CP were considered suitable for inclusion in the study. Representative formalin-fixed paraffin-embedded tissue blocks containing PDAC, CP, healthy pancreatic, healthy duodenum, LN+ and LN tissues were obtained from the Pancreas Biobank of the LUMC. All tissue samples were assessed by a hepatopancreaticobiliary pathologist (A.S.L.P.C.) before inclusion in the study. Both peritumoral pancreatitis and primary CP tissues were categorized as CP. Clinicopathological data were retrospectively collected from hospital records. R1 resection was defined as the presence of tumor cells at ≤1 mm from the surgical margin. Pathological T (pT) and pathological N (pN) stages were defined according to the 8th edition of the AJCC/UICC TNM staging system for pancreatic cancer. The study protocol was approved by the Gastroenterology Biobank Review Committee (protocol reference: 2020-16) and local medical ethical review committee (protocol reference: B20.052). The research was conducted in accordance with the Dutch code of conduct for responsible use of human tissue in medical research. Tissue samples and patient data were used anonymously and in compliance with the Declaration of Helsinki (1964).

2.2. Monoclonal Antibodies and Reagents

Lea/c/x, sdi-Lea, sLea, sLex, sTn, MUC1 and MUC5AC were selected based on their expected specificity for PDAC. The primary and secondary mAbs and other reagents are listed in Table S1.

2.3. Immunohistochemistry (IHC)

The 4-μm-thick formalin-fixed paraffin-embedded tissue sections were placed on glass slides. The sections were deparaffinized in xylene for 15 min, rehydrated in a series of 100%, 50%, 25% ethanol dilutions and rinsed in demineralized water. Next, endogenous peroxidase was blocked for 20 min using 0.3% hydrogen peroxide in demineralized water. Antigen retrieval was subsequently performed as described in Table S1. After cooling in phosphate-buffered saline (PBS, pH 7.4), sections were incubated overnight in a humidified chamber at room temperature with 150 μL primary antibody using a predetermined optimal dilution (see Table S1). Next, slides were washed three times in PBS for 5 min and incubated with appropriate secondary antibodies, followed by an additional washing step. Staining was visualized through incubation with 3,3-diaminobenzidine tetrahydrochloride solution (DAB, K3468, Agilent Technologies, Inc., Santa Clara, CA, USA) for 10 min at room temperature. Sections were then counterstained with Mayer’s hematoxylin solution (Sigma-Aldrich, Saint Louis, MO, USA). After dehydration in an incubator for 1 h at 37 °C, slides were mounted with Pertex (Leica Microsystems, Wetzlar, Germany).

2.4. Semi-Automated Imaging Analysis

Whole slide images of tissue sections were captured using a PANNORAMIC® 250 Flash III DX scanner (3DHISTECH Ltd., Budapest, Hungary) and imported into QuPath v.0.2.3 [21]. All tissue slides were scanned using similar settings to exclude variability during image analysis. A detailed description and graphic representation of the object classifier training, validation and semi-automated image analysis workflow is included in the Supplementary Materials. Briefly, random forest object classifiers for PDAC, pancreatic (healthy pancreas and CP), healthy duodenal, positive lymph node (LN+) and negative lymph node (LN) tissue classes were built for each biomarker [22]. QuPath parameters used for automated cell detection are listed in Table S2. Object classifiers were trained until they provided detection of their respective cell type with a sensitivity, specificity, positive predictive value (PPV), negative predictive value (NPV) and accuracy of ≥85%, as depicted in Figure S1. Next, tissue class-, biomarker-specific scripts allowing semi-automated cell detection, segmentation, object classifier application and classification of DAB staining intensity were generated as shown in Figure S2. DAB staining intensity was classified as negative, low (1+), moderate (2+) or strong (3+). Next, PDAC, CP, healthy pancreas, healthy duodenum, LN+ and LN regions were then annotated on the full cohort by a pathologist (A.S.L.P.C.), after which the respective script was run (Figure S2). Staining was quantified using the H-score (formula: 1 × (% cells 1+) + 2 × (% cells 2+) + 3 × (% cells 3+), range: 0–300). Immunohistochemical staining with an H-score ≥ 51 was regarded positive [23].

2.5. Statistical Analysis

Statistical analysis and graph generation were performed using IBM SPSS statistics (version 25, IBM Corporation, Somer, NY, USA) and GraphPad Prism (version 8, GraphPad Software, La Jolla, CA, USA). Baseline characteristics between groups were compared using a Chi-square test for categorical data, an unpaired t-test for normally distributed data or Mann–Whitney U test for nonparametric data. Mean H-scores were compared using one-way ANOVA with Bonferroni correction (≥3 groups) or an unpaired t-test (2 groups). Receiver operating characteristic (ROC) curves were drawn to calculate area under the curve (AUC) for LN+ vs. LN detection based on H-score. Differences with a p-value < 0.05 were considered statistically significant.

3. Results

3.1. Patient Characteristics

Tissues from 53 patients primarily diagnosed with PDAC and 9 patients diagnosed with CP were obtained. The clinicopathological data of this cohort are summarized in Table 1. Of the PDAC cohort, 22 patients received NAT, of which 15 patients received chemoradiotherapy and 7 patients received chemotherapy. NAT patients were significantly younger (p = 0.033) had significantly lower pN stages (p < 0.001), smaller tumors (p = 0.024) and lower serum CA19-9 levels (p = 0.007) compared to PDAC patients who did not receive NAT. Slides containing PDAC tissue were not available for 5 patients. In total, tissue blocks containing 48 PDAC, 28 CP, 31 healthy pancreatic, 10 healthy duodenal, 27 LN+ and 41 LN tissues derived of 62 patients (53 PDAC and 9 CP patients) were included in the study.

3.2. Object Classifier Training and Validation

To prepare the scripts for semi-automated image analysis, thirty-five tissue class-, biomarker-specific object classifiers were trained and validated as described in the Supplementary Materials. Briefly, after extensive training, sensitivity, specificity, PPV, NPV and accuracy were above the predetermined threshold of 85% for all object classifiers separately, allowing highly accurate detection and classification of its cell type of interest (Table S3).

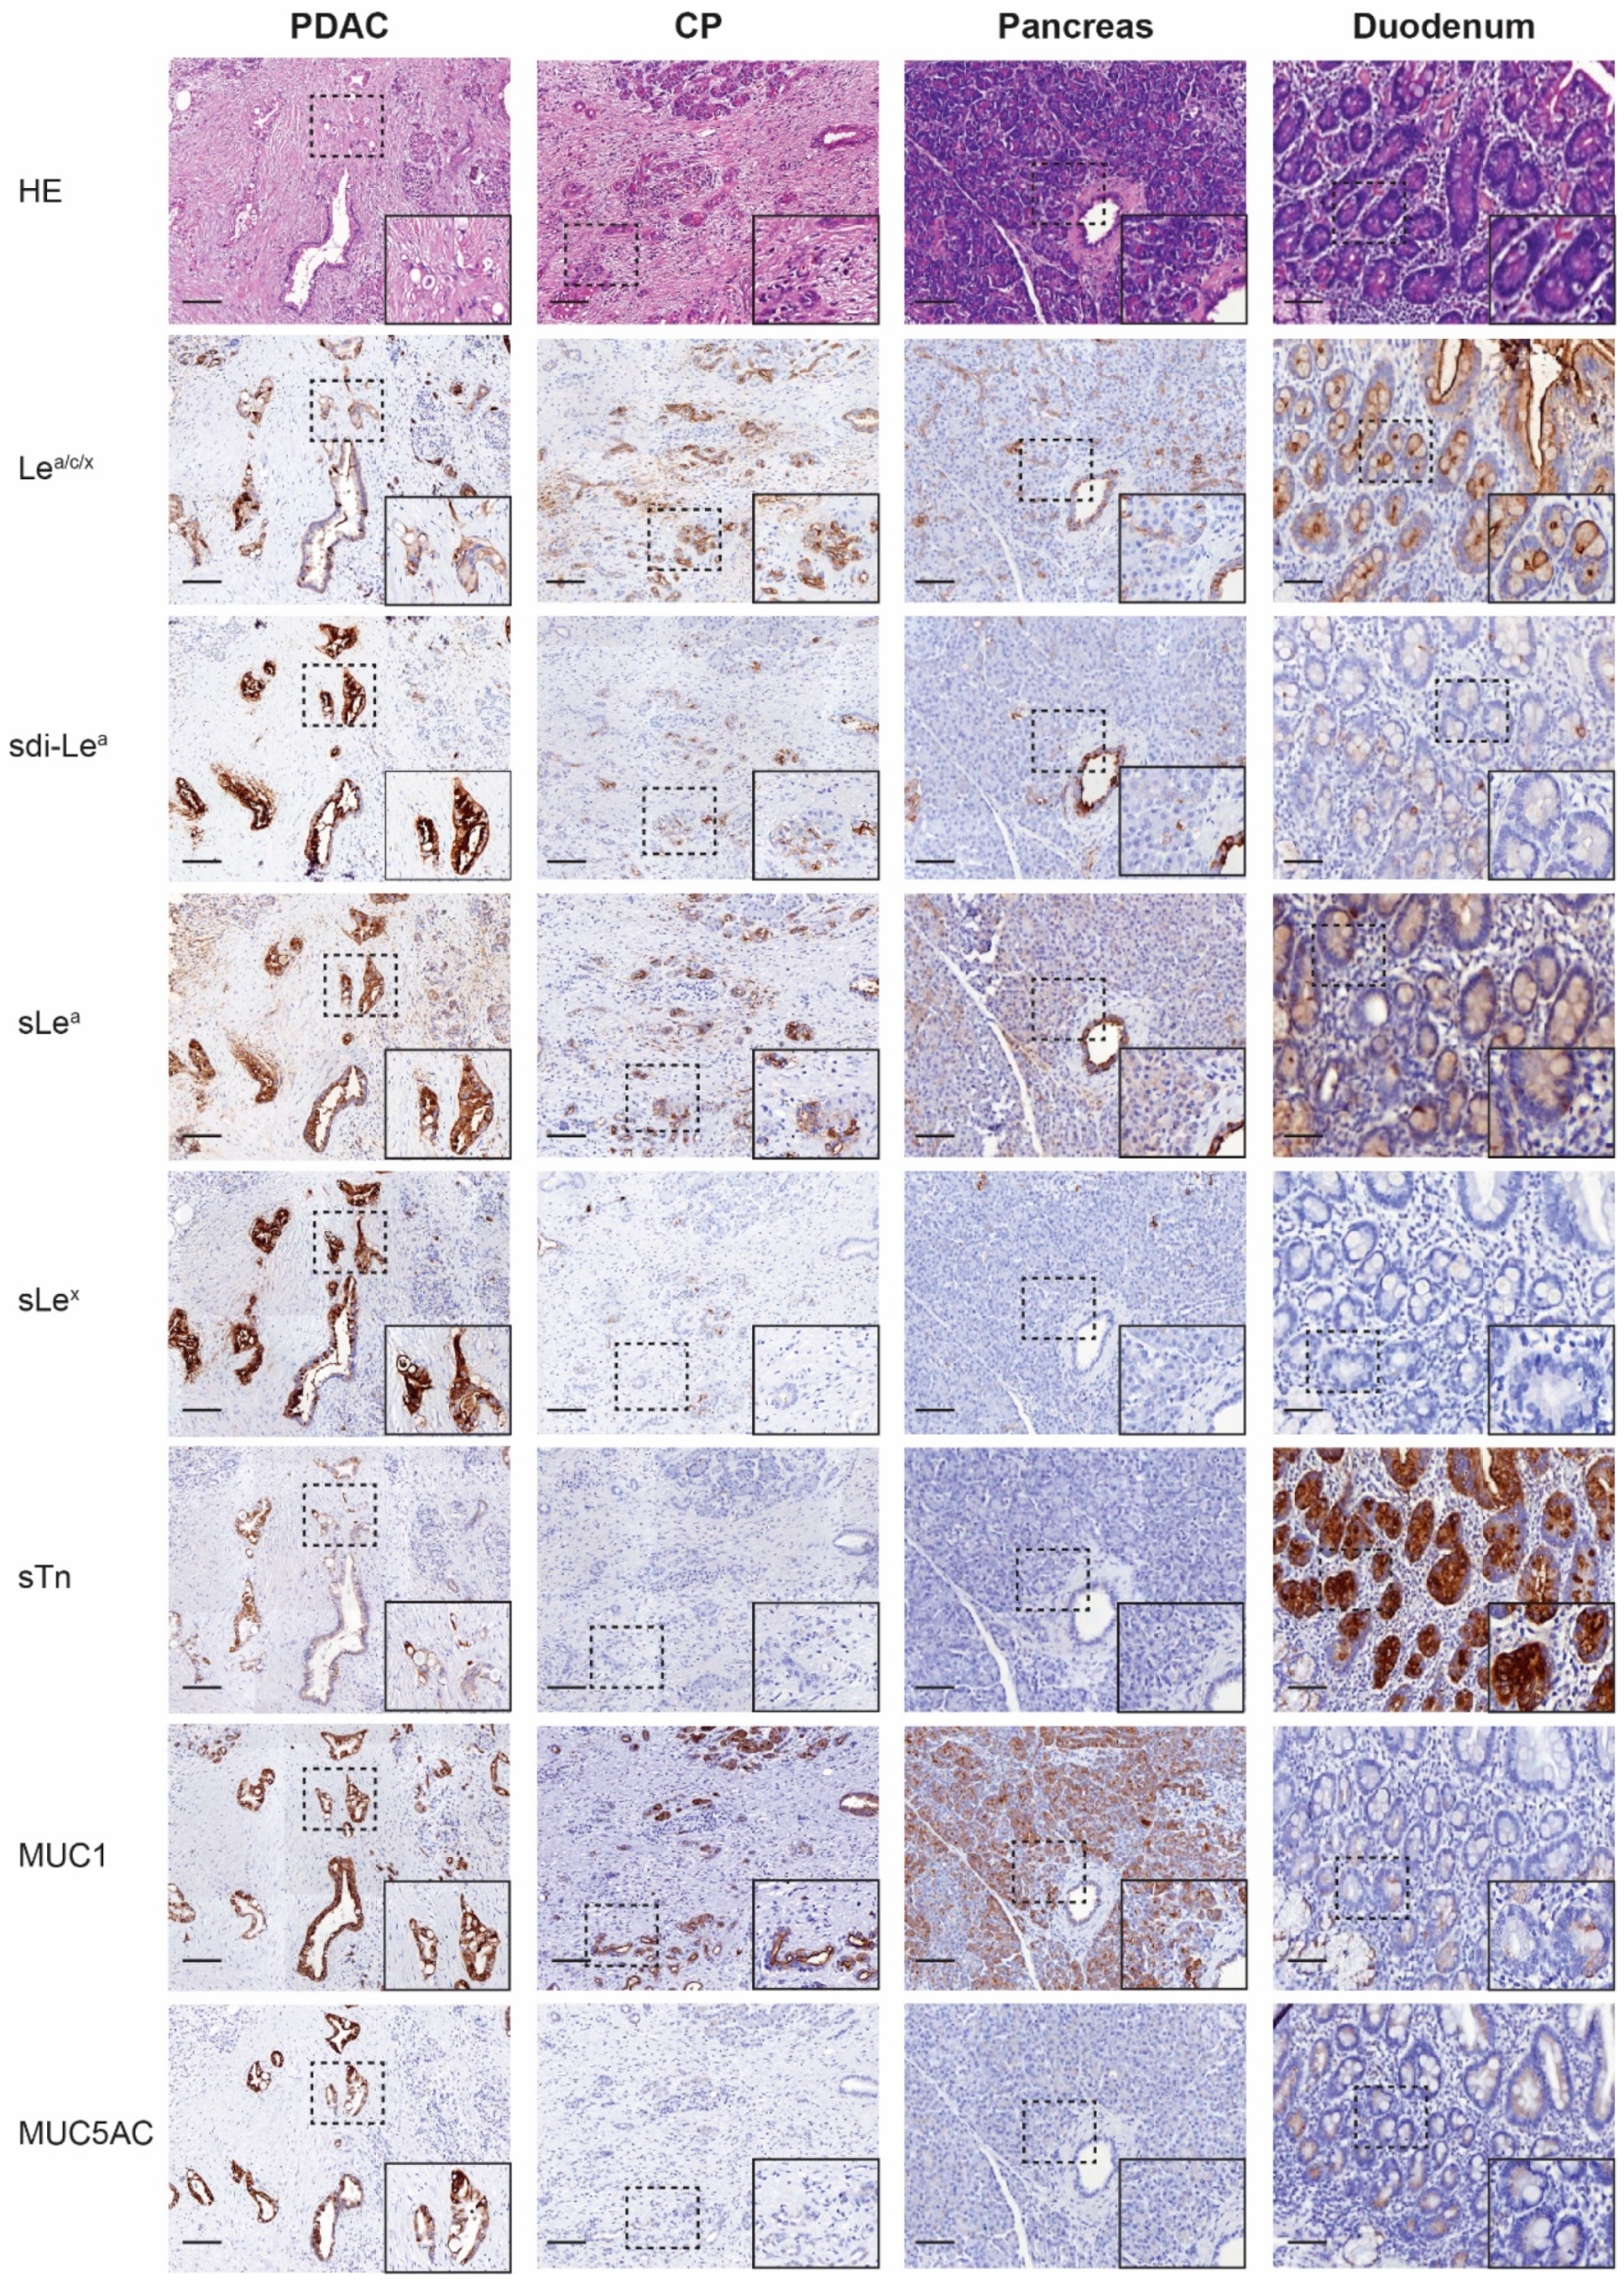
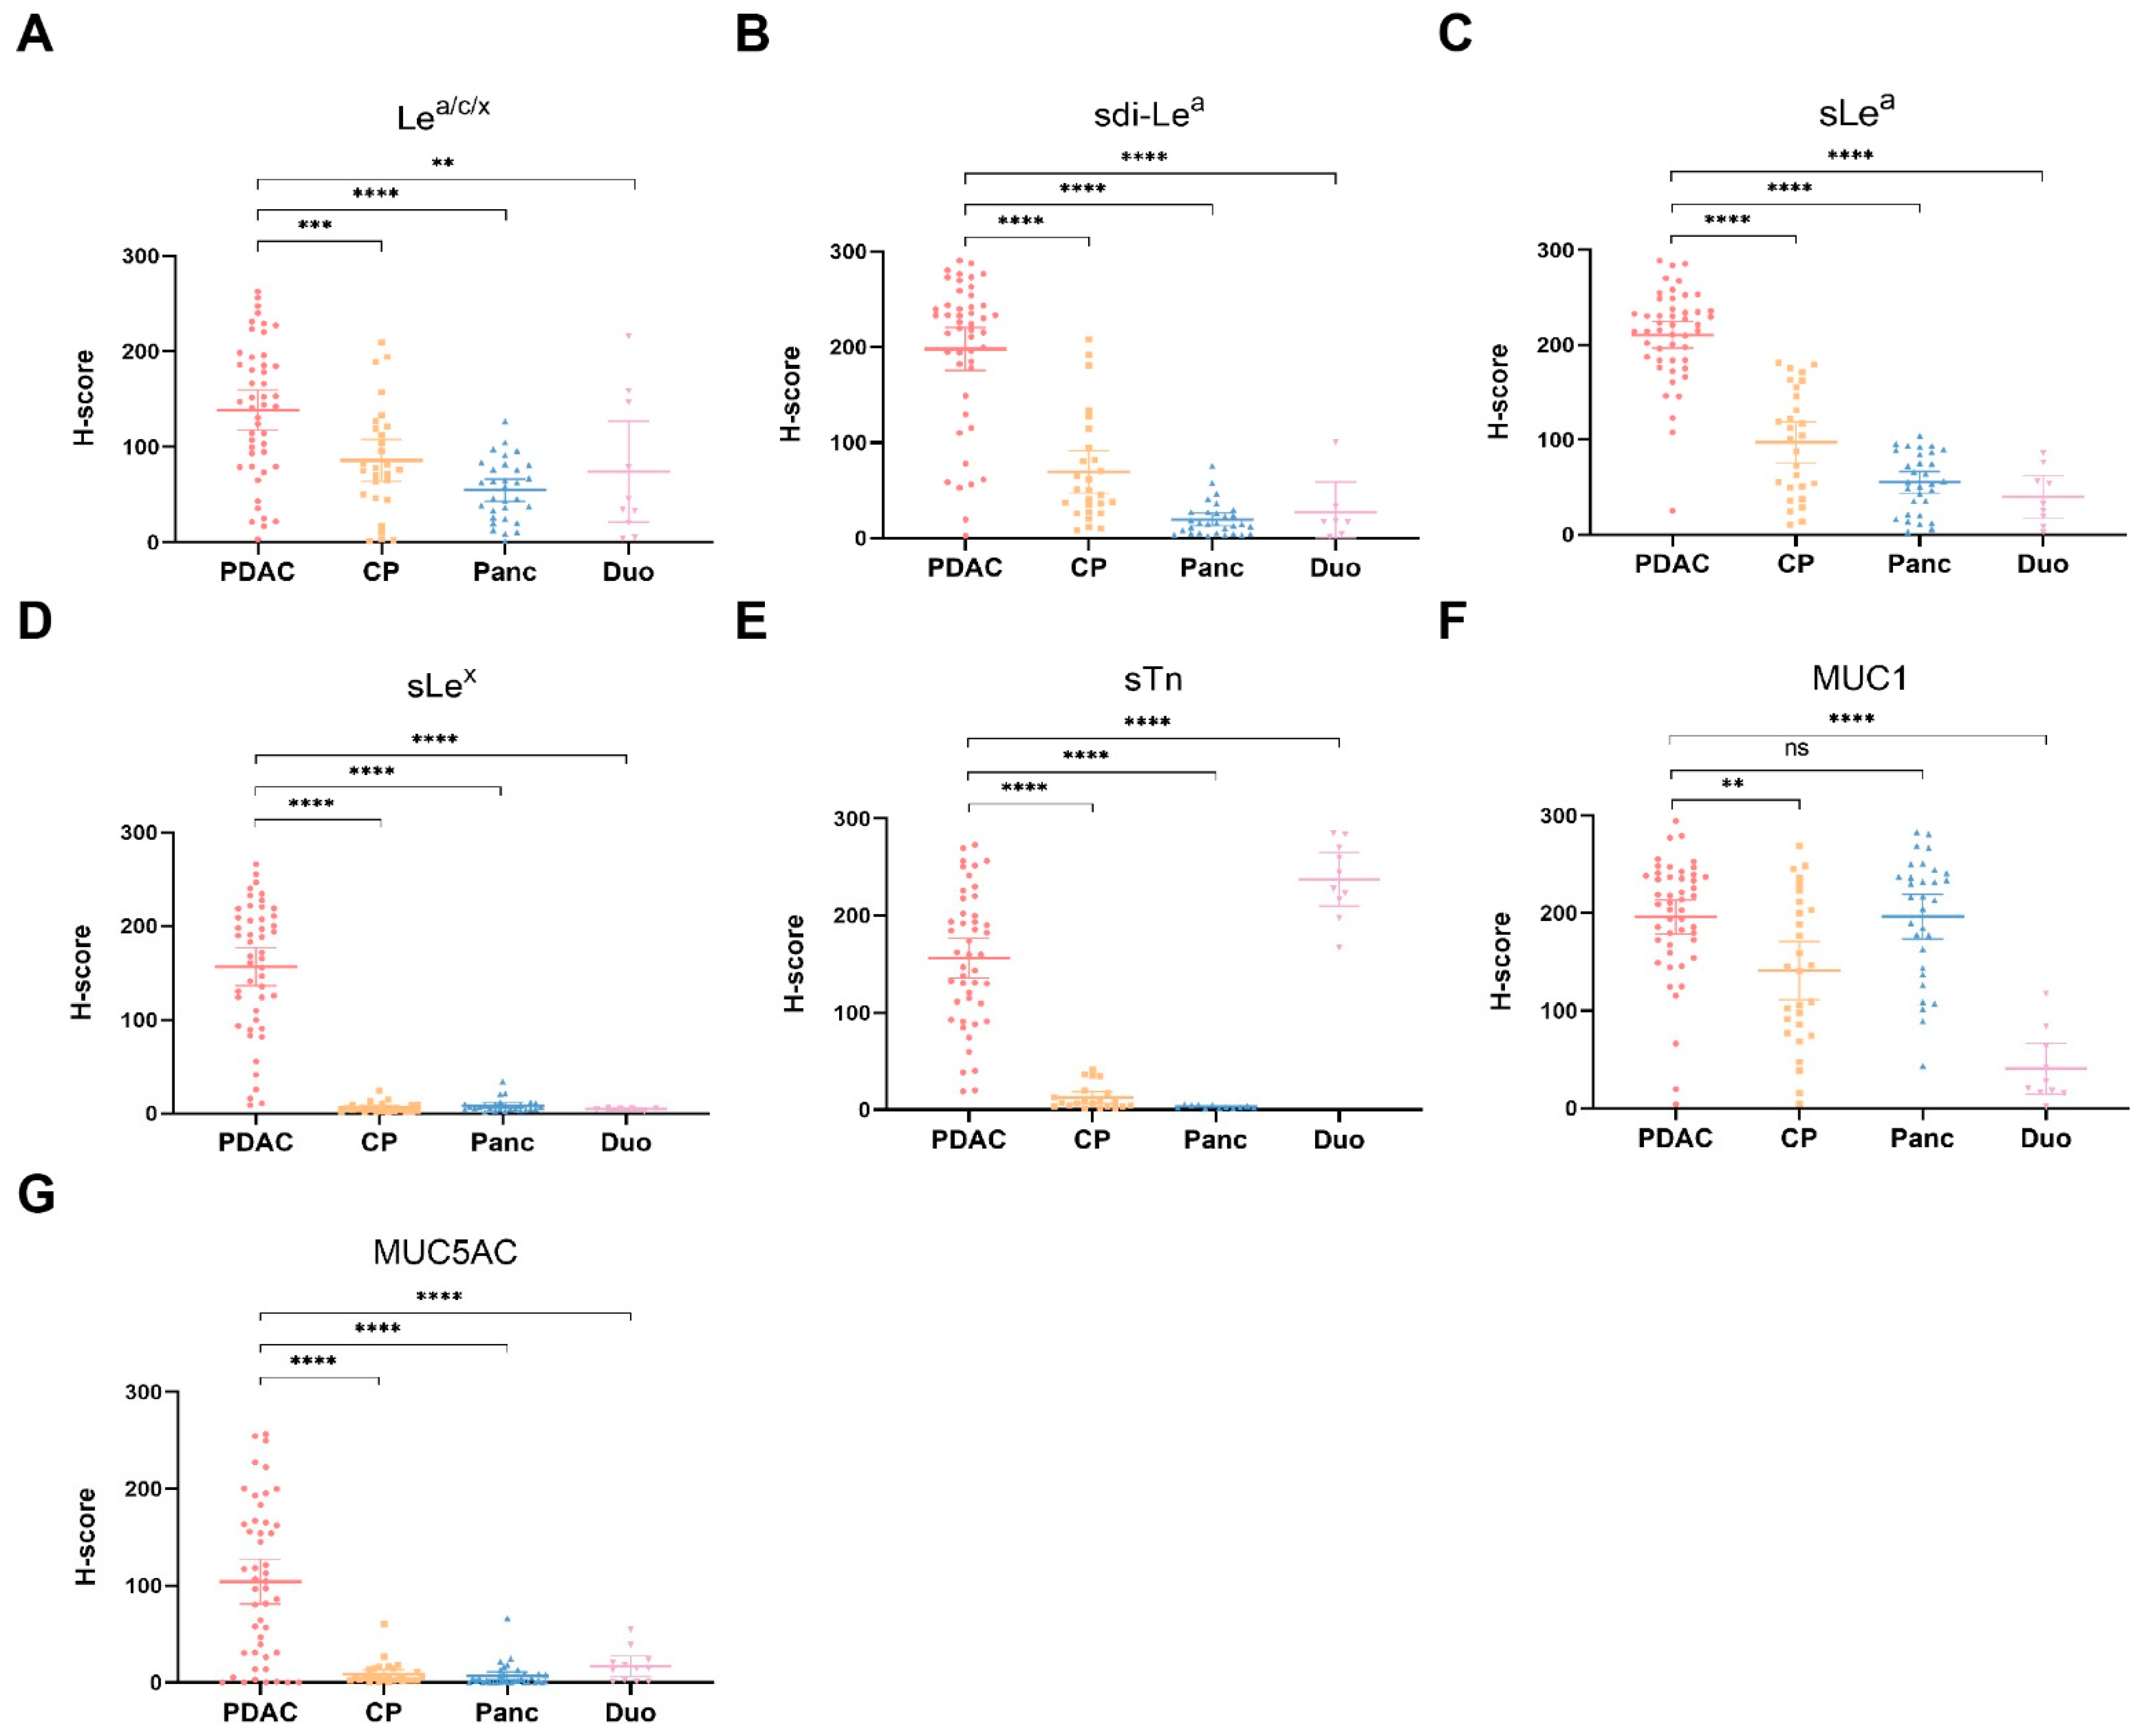
3.3. Biomarker Expression on PDAC, CP, Healthy Pancreatic and Duodenal Tissues

The cohort was stained for Lea/c/x, sdi-Lea, sLea, sLex, sTn, MUC1 and MUC5AC (Figure 1), followed by semi-automated imaging analysis. H-scores scatter plots showing IHC staining of all biomarkers on PDAC, CP, healthy pancreatic and duodenal tissues are depicted in Figure 2.
Positive biomarker expression on PDAC tissues was found on 83% for Lea/c/x (40/48), 94% for sdi-Lea (45/48), 98% for sLea (47/48), 90% for sLex (43/48), 88% for sTn (42/48), 96% for MUC1 (46/48) and 67% for MUC5AC (32/48), as shown in Table 2. Categorized IHC staining distributions on PDAC tissues and biomarker expression for each PDAC case separately are represented in Table 3 and in heatmap format in Figure S3, respectively. All biomarkers were highly expressed on tumor tissues and showed a tumor-specific, membranous staining pattern of PDAC cells. Lea/c/x, sdi-Lea, sLea and sTn showed a more heterogenous staining distribution, while sLex, MUC1 and MUC5AC staining was slightly more homogenous. Moreover, strong luminal staining was occasionally observed for Lea/c/x, sdi-Lea, sLea and sLex, but not for MUC1 and MUC5AC.
In CP, staining was homogenous and mainly located on acinar and ductal cells of the pancreas. Low to moderate staining was observed for Lea/c/x, sdi-Lea, sLea and MUC1, while sLex, sTn and MUC5AC expression was virtually absent. For all biomarkers, expression in CP was significantly lower than in PDAC, although tumor:CP ratios of only 1.7 and 1.4 were observed for Lea/c/x and MUC1, respectively (Table 2).
Low to moderate Lea/c/x, sdi-Lea and sLea expression was found in healthy acinar cells, while MUC1 was highly expressed. As for CP, expression in healthy pancreatic tissue was mainly located on acinar and ductal cells. sLex, sTn and MUC5AC expression was virtually absent. Compared to PDAC, a significantly lower healthy pancreas expression was found for all biomarkers (p < 0.0001), except for MUC1 (tumor:pancreas ratio: 1.0, p > 0.9999).
In healthy duodenal tissues, low to moderate expression of Lea/c/x, sdi-Lea, sLea and MUC1 on cells of the glandular epithelium was observed, in which Lea/c/x expression was more abundant relative to sdi-Lea, sLea and MUC1. Moreover, strong sTn staining was observed. Of note, occasional staining of Brunner’s glands was present for sLea, sLex, sTn, MUC1, MUC5AC, but to a lesser extent for Lea/c/x and sdi-Lea. Expression on healthy duodenal tissue was significantly lower compared to PDAC for all biomarkers (p < 0.0001), except for sTn (tumor:duodenum ratio: 0.6, p < 0.0001), as shown in Table 2.

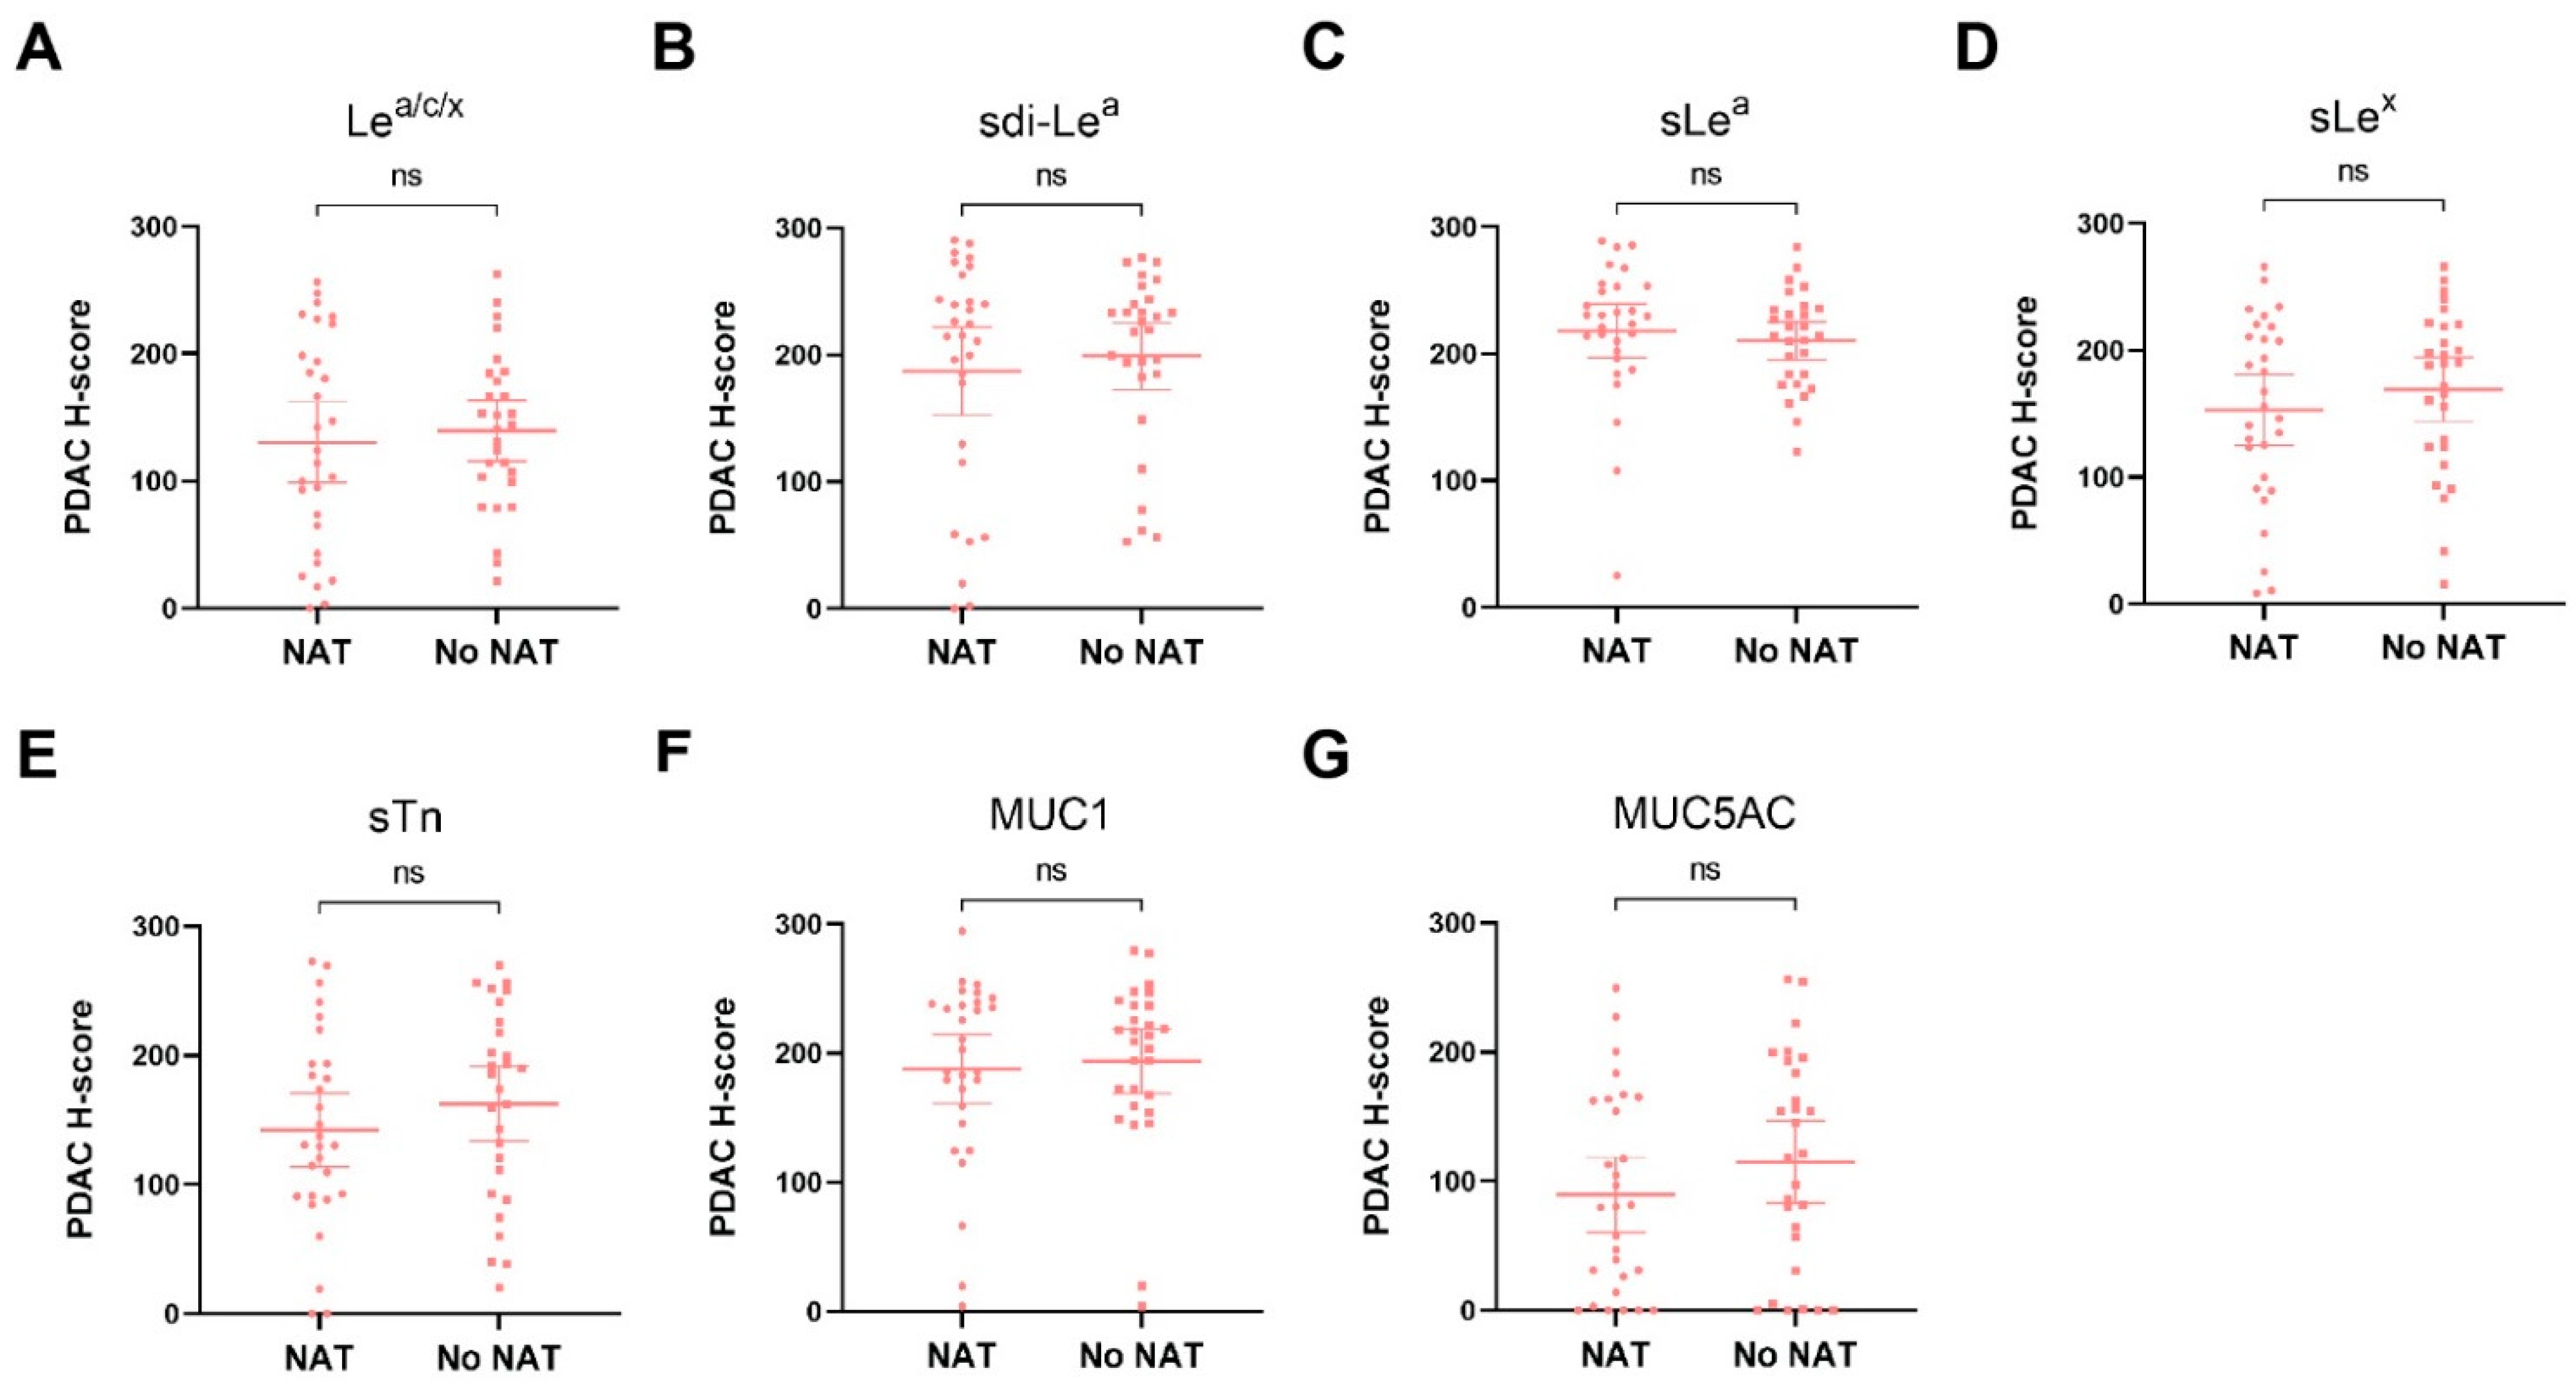
3.4. Biomarker Expression on PDAC Tissues after NAT

As we found that all biomarkers showed high expression on PDAC tissues, subgroup analyses were performed to study the effect of NAT on biomarker expression on PDAC tissues. H-score scatter plots showing biomarker expression in NAT and no NAT patients are shown in Figure 3. Although sLex, sTn and MUC5AC expression seemed slightly lower in the NAT group, no statistically significant differences in biomarker expression between NAT and no NAT patients were observed, suggesting that NAT does not influence the (over)expression of these biomarkers.

3.5. Biomarker Co-Expression on PDAC Tissues

Biomarker co-expression on tumor tissues was analyzed to evaluate the potential added value of targeting two biomarkers simultaneously. The percentage of patients with positive expression of at least one biomarker along with the percentage of cases with biomarker co-expression are shown in Table 4. Although co-expression was present in the majority of patients, virtually all patients expressed at least one of two biomarkers of any panel, with the least-performing biomarker combination being sTn-MUC5AC that was, alone and or combined, expressed in 90% of PDAC tissues. The highest co-expression panel was sLea and MUC1, which were simultaneously expressed in 94% of patients.

3.6. Detection of Lymph Node Metastases

LN+ and LN tissues were stained to evaluate the biomarkers’ potential for identification of lymph node metastases in addition to primary PDAC lesions. Representative IHC images for biomarker expression on LN+ tissues are depicted in Figure 4, which shows that all biomarkers were highly expressed on PDAC cells in LN+ tissues. For LN tissues, biomarker expression was mostly absent, although low to moderate expression was occasionally observed for Lea/c/x, sdi-Lea and sLea. Despite the latter, mean LN+ expression was significantly higher compared to LN expression for all biomarkers (p < 0.0001), as shown in Figure 5. In addition, sensitivity, specificity, PPV, NPV and AUC for correct LN+ detection were calculated based on positive or negative biomarker expression on LN+ and LN tissues. Although sensitivity for LN+ detection was lower for sLex and sTn, Lea/c/x, sdi-Lea, sLea, MUC1 and MUC5AC showed high LN+ identification potential, with limited false-positive and false-negative staining. Accuracy for identification of LN+ and LN tissues together was 90% for Lea/c/x, 81% for sdi-Lea, 81% for sLea, 84% for sLex, 81% for sTn, 97% for MUC1, and 91% for MUC5AC (Table 5).

4. Discussion

Through specific binding to and (real-time) visualization of tumor cells, targeted molecular imaging agents can play a key role in overcoming current challenges during diagnosis, resection, and monitoring of PDAC. In this study, we evaluated the potential of tumor-associated glycans Lea/c/x, sdi-Lea, sLea, sLex and sTn, and mucins MUC1 and MUC5AC as a molecular imaging target for PDAC using a semi-automated, machine-learning-based image analysis workflow. Our results show that all biomarkers are highly expressed on PDAC cells. Importantly, subgroup analyses showed that biomarker expression was similar in patients who received NAT and patients who did not receive NAT, suggesting that NAT does not influence biomarker expression. This finding is particularly promising in view of the ever-increasing application of neoadjuvant chemoradiotherapy for PDAC and paves the way for PDAC targeting using these biomarkers in a clinically relevant setting [24]. We additionally showed that simultaneous targeting of two targets using, for instance, a bispecific tracer could be attractive in order to allow targeting of the entire PDAC population. High tumor:CP ratios were observed for all biomarkers, although tumor:CP ratios for MUC1 and Lea/c/x were closer to 1 (1.4 and 1.7, respectively). In addition, high tumor:pancreas ratios were observed for all biomarkers, except for MUC1 (tumor:pancreas ratio 1.0). These results suggest that all biomarkers, besides MUC1, have a high potential to serve as molecular imaging targets to solve current challenges in the delineation of primary PDAC lesions from surrounding CP and healthy pancreatic tissue. We additionally evaluated biomarker expression on healthy duodenal tissues to evaluate their potential for delineating locally advanced primary pancreatic head carcinomas invading the duodenum, which can be present in 47–58% of patients [25,26]. In contrast to the other biomarkers, sTn’s abundant expression on healthy duodenal tissues limits its suitability for molecular imaging of primary PDAC invading the duodenum.
In addition to primary PDAC detection, both pre- and intraoperative imaging of lymph node metastases is pivotal for disease staging and monitoring [27,28]. Therefore, we evaluated the potential of the biomarker panel to detect lymph node metastases and found that all biomarkers are significantly upregulated on LN+ compared to LN tissues. All biomarkers showed a high detection potential for LN+ tissues and distinction of LN+ from LN tissues, which was comparable to the performance of established protein-based molecular imaging targets, such as CEACAM5, PSMA, avβ6 and uPAR, further strengthening their potential as molecular imaging targets [28,29].
Due to their tumor-specific (over)expression and excellent in vivo accessibility, tumor-associated glycans, which are present on the outermost layer of the cell membrane, are of particular interest for molecular imaging [11]. Several glycan-specific tracers were successfully evaluated for molecular imaging of PDAC in a preclinical setting, but only a few studies have described glycan-based imaging in a clinical context. For instance, 89Zr-DFO-HuMab-5B1 (MVT-2163), which targets sLea (more commonly known as CA19-9), was successfully evaluated in a phase 1 trial for PET imaging of PDAC and provided clear delineation of primary tumors and metastases, some of which were not identified using standard imaging modalities [30]. sLea is also employed as a serum biomarker for diagnosis and monitoring of PDAC within standard-of-care. However, despite its strong overexpression in PDAC, targeting of sLea in PDAC is limited by its presence in the healthy pancreas, CP and other benign pancreaticobiliary diseases, which is confirmed by the relatively low tumor:CP, tumor:pancreas and tumor:duodenum ratios found in the current study [31]. Noteworthy, we showed that sdi-Lea, which is a Lewis glycan structurally related to sLea, had a more restricted expression on CP, healthy pancreas and duodenal tissues with similar PDAC expression, which strengthens the major potential of sdi-Lea over sLea for specific PDAC targeting.
Lea/c/x and sdi-Lea were recently described by Chua and Tivadar et al., respectively, showing high expression on PDAC tissues with low to moderate abundance on healthy tissues [13,15]. Once employed in vivo, the Lea/c/x-specific mAb FG88.2 subsequently displayed remarkable tumor targeting [13]. Recently, our group conducted a proof-of-concept evaluation of the chimeric (human/mouse) counterpart of the FG88.2 mAb, CH88.2, as a targeting moiety for fluorescence-guided surgery of colon carcinoma and PDAC. Conjugated to IRDye 800CW, the tracer allowed clear visualization of subcutaneous HT-29 (colon carcinoma) and BxPC-3 (PDAC) tumor xenografts using a clinical near-infrared fluorescence imaging system [32]. Although additional IHC exploration of expression on other gastrointestinal tumors along with their normal counterparts and metastases is required to evaluate the tracer employability beyond PDAC, the current findings strongly support previous data on FG88.2 staining, paving the way for a clinical translation of the tracer [13,15].
In addition to glycans, mucins, that are heavily coated with glycans, may form attractive targets for molecular imaging of PDAC due to their tumor-specific expression, some of which from the earliest in situ stage onward. Although in our study MUC1 seems to be a less suitable candidate for molecular imaging of PDAC, it should be noted that alternative conformational epitopes on MUC1, induced by the presence of (truncated) O-glycans, were described [33,34]. As their accessibility is dependent on conformational changes, induced by tumor-specific aberrant glycosylation, their expression on healthy tissues might be minimized, making them more attractive for tumor-specific targeting. For instance, the PAM4-reactive epitope, which is present on both MUC1 and MUC5AC, was shown to have a low abundance on healthy pancreatic and CP tissues, while expression on PDAC and pancreatic intraepithelial neoplasia (PanIN)-1A lesions onward was high [35,36]. Evaluation of PAM4-reactive epitope expression on the current cohort would be an interesting continuation in order to establish its potential as a PDAC imaging target, while simultaneously putting the current findings into perspective.
A strong methodological point of the study is the inclusion of tissues derived from the entire PDAC context, i.e., the primary tumor, healthy/benign tissue counterparts, surrounding organs and metastatic and healthy lymph nodes, which is paramount for a complete and accurate biomarker comparison. Our semi-automated image analysis workflow provided highly accurate cell classification, allowing an objective, reproducible and precise evaluation of biomarker expression. In contrast, accurate manual scoring of heterogeneous biomarker stainings may be challenging and consequently suffers from both intraobserver and interobserver variability [37,38,39]. Moreover, to the best of our knowledge, this study is the first to evaluate the expression of the current biomarkers on both PDAC tissues of patients who received NAT and on metastatic PDAC lymph node tissues.
This study has some limitations. Application of the current QuPath workflow for this relatively small cohort is limited by its labor intensity and still does not avoid the involvement of a specialized pathologist. In addition, erroneous classification of out-of-focus tissue areas and staining artifacts, although mostly avoided during tissue area annotation, may further compromise accurate semi-automated scoring of digital images. Moreover, we cannot fully exclude that, particularly in patients that received NAT, residual tumor clusters in both primary resection and lymph node tissues were misclassified and subsequently annotated as non-tumorous. It should however be noted that considering manual scoring to be the gold standard may overlook the potential of machine learning-based algorithms to classify cells with superior accuracy relative to the human eye [40]. Furthermore, we feel that the benefits of the highly accurate, semi-automated scoring method, which is of high importance considering the heterogenicity of the observed staining patterns within a complex PDAC morphology, do outweigh the aforementioned disadvantages.
This study identified Lea/c/x, sdi-Lea, sLea, sLex, and MUC5AC as high-potential targets for molecular imaging of PDAC. Future research into glycan- and mucin-targeted imaging should thus focus on the development and evaluation of clinically suitable tracers directed against these glycan and mucin targets. Secondly, although this study showed no difference in biomarker expression on PDAC tissues between NAT and no NAT patients, evaluating the correlation between biomarker expression on PDAC tissues before and after NAT, for instance by using fine-needle aspiration biopsies acquired before NAT, could strengthen the current finding that NAT does not influence biomarker expression. Thirdly, although this study demonstrates the potential of identifying LN+ tissues based on the expression of the evaluated biomarkers, future animal models with complex lymph node metastases are required to definitely establish a glycan or mucin-targeting tracer’s potential for metastatic lymph node detection. Altogether, this study provides a strong foundation for the development, characterization and preclinical evaluation of tumor-associated glycan- and mucin-specific molecular imaging agents for high-contrast delineation of PDAC.

5. Conclusions

To conclude, our results show that particularly Lea/c/x, sdi-Lea, sLea, sLex and MUC5AC are high-potential targets for molecular imaging of primary PDAC lesions, regardless of the application of NAT. Due to their strong abundance on duodenum and healthy pancreatic tissues, sTn and MUC1 were considered less suitable targets. All biomarkers are suitable targets for correct identification of LN+ as well as the distinction of LN+ from LN tissues. Through this study, we lay the groundwork for the development and evaluation of clinically suitable glycan- and mucin-specific tracers for molecular imaging of PDAC.

Supplementary Materials

The following are available online at https://www.mdpi.com/article/10.3390/cancers13225777/s1. Figure S1: Graphical representation of biomarker training and validation workflow; Figure S2: QuPath images and semi-automated image analysis workflow; Figure S3: Heatmap of biomarker expression on PDAC tissues for each case separately. Table S1: Primary and secondary mAbs, clone, catalog number, provider, isotype and conditions used during IHC; Table S2: Automated cell detection parameters used in QuPath; Table S3: Mean ± SD object classifier sensitivity, specificity, PPV, NPV, accuracy for the detection of tumor, stromal, acinar, immune or glandular cells pooled from all biomarkers (n = 7).

Author Contributions

Conceptualization, R.D.H., P.J.K.K., A.S.L.P.C. and C.F.M.S.; methodology: R.D.H., P.J.K.K., A.S.L.P.C. and C.F.M.S.; software, R.D.H., K.T. and A.S.L.P.C.; validation, R.D.H., K.T. and A.S.L.P.C.; formal analysis, R.D.H.; investigation, R.D.H. and K.T.; resources, J.V.G., J.C., M.V., L.G.D., J.S.D.M., B.A.B., A.L.V., A.S.L.P.C. and C.F.M.S.; data curation, R.D.H. and K.T.; writing—original draft preparation, R.D.H.; writing—review and editing, K.T. J.V.G., J.C., M.V., L.G.D., J.S.D.M., B.A.B., A.L.V., P.J.K.K., A.S.L.P.C. and C.F.M.S.; visualization, R.D.H.; supervision, A.L.V., P.J.K.K. and C.F.M.S.; project administration, R.D.H. All authors have read and agreed to the published version of the manuscript.

Funding

This work was financially supported by Stichting Sacha Swarttouw-Hijmans. C.F.M.S. was in part funded by the European Commission under two Marie Skłodowska-Curie Action awards: H2020-MSCA-RISE-2018, ID 777682-CANCER, H2020-MSCA-RISE 2019, ID 872860-PRISAR2 and H2020-WIDESPREAD-2018-Twinning 852985-SIMICA.

Institutional Review Board Statement

The study was conducted according to the guidelines of the Declaration of Helsinki and approved by the Ethics Committee of the Leiden University Medical Center (protocol code B20.052, date of approval 17 December 2020).

Informed Consent Statement

Informed consent was waived by the Ethics Committee of the Leiden University Medical Center.

Data Availability Statement

The data presented in this study are available on request from the corresponding author. The data are not publicly available due to privacy reasons.

Acknowledgments

We thank Ronald van Vlierberghe and Shadhvi Bhairosingh for their assistance during immunohistochemistry and scanning of the tissue slides. The graphical abstract was created with BioRender.com.

Conflicts of Interest

Lindy G. Durrant is CEO and CSO of Scancell Ltd. and has an ownership interest in Scancell Ltd. Jia Xin Chua and Mireille Vankemmelbeke are employed at Scancell Ltd. The remaining authors declare no conflict of interest.

Abbreviations

95% CI: 95% Confidence Interval, AUC: Area Under the Curve, CP: Chronic Pancreatitis, DAB: 3,3′-Diaminobenzidine, EUS: Endoscopic Ultrasound, HE: Hematoxylin-Eosin, IHC: Immunohistochemistry, IQR: Interquartile Range, Lea/c/x: Lewisa/c/x, LN+: positive lymph node, LN: negative lymph node, MRI: Magnetic Resonance Imaging, MUC1: Mucin-1, MUC5AC: Mucin-5AC, NAT: Neoadjuvant Therapy, NPV: Negative Predictive Value, PanIN: Pancreatic Intraepithelial Neoplasia, PBS: Phosphate-Buffered Saline, PDAC: Pancreatic Ductal Adenocarcinoma, PET/CT: Positron Emission Tomography/Computed Tomography, PPPD: Pylorus-Preserving Pancreatoduodenectomy, PPV: Positive Predictive Value, ROC: Receiver Operation Characteristic, ROI: Region-Of-Interest, SD: Standard Deviation, sdi-Lea: sialyl-di-Lewisa, Sens.: Sensitivity, sLea: sialyl-Lewisa, sLex: sialyl-Lewisx, Spec.: Specificity, sTn: sialyl-Thomsen-Nouveau.

References

  1. Rawla, P.; Sunkara, T.; Gaduputi, V. Epidemiology of pancreatic cancer: Global trends, etiology and risk factors. World J. Oncol. 2019, 10, 10–27. [Google Scholar] [CrossRef] [PubMed]
  2. Versteijne, E.; Vogel, J.A.; Besselink, M.G.; Busch, O.R.C.; Wilmink, J.W.; Daams, J.G.; van Eijck, C.H.J.; Groot Koerkamp, B.; Rasch, C.R.N.; van Tienhoven, G.; et al. Meta-analysis comparing upfront surgery with neoadjuvant treatment in patients with resectable or borderline resectable pancreatic cancer. Br. J. Surg. 2018, 105, 946–958. [Google Scholar] [CrossRef] [PubMed] [Green Version]
  3. Papalezova, K.T.; Tyler, D.S.; Blazer, D.G., 3rd; Clary, B.M.; Czito, B.G.; Hurwitz, H.I.; Uronis, H.E.; Pappas, T.N.; Willett, C.G.; White, R.R. Does preoperative therapy optimize outcomes in patients with resectable pancreatic cancer? J. Surg. Oncol. 2012, 106, 111–118. [Google Scholar] [CrossRef] [PubMed]
  4. Pietryga, J.A.; Morgan, D.E. Imaging preoperatively for pancreatic adenocarcinoma. J. Gastrointest. Oncol. 2015, 6, 343–357. [Google Scholar] [CrossRef]
  5. Tummers, W.S.; Groen, J.V.; Sibinga Mulder, B.G.; Farina-Sarasqueta, A.; Morreau, J.; Putter, H.; van de Velde, C.J.; Vahrmeijer, A.L.; Bonsing, B.A.; Mieog, J.S.; et al. Impact of resection margin status on recurrence and survival in pancreatic cancer surgery. Br. J. Surg. 2019, 106, 1055–1065. [Google Scholar] [CrossRef] [Green Version]
  6. Strobel, O.; Hank, T.; Hinz, U.; Bergmann, F.; Schneider, L.; Springfeld, C.; Jäger, D.; Schirmacher, P.; Hackert, T.; Büchler, M.W. Pancreatic cancer surgery: The new R-status counts. Ann. Surg. 2017, 265, 565–573. [Google Scholar] [CrossRef]
  7. Gerritsen, A.; Molenaar, I.Q.; Bollen, T.L.; Nio, C.Y.; Dijkgraaf, M.G.; van Santvoort, H.C.; Offerhaus, G.J.; Brosens, L.A.; Biermann, K.; Sieders, E.; et al. Preoperative characteristics of patients with presumed pancreatic cancer but ultimately benign disease: A multicenter series of 344 pancreatoduodenectomies. Ann. Surg. Oncol. 2014, 21, 3999–4006. [Google Scholar] [CrossRef]
  8. Pandol, S.; Edderkaoui, M.; Gukovsky, I.; Lugea, A.; Gukovskaya, A. Desmoplasia of pancreatic ductal adenocarcinoma. Clin. Gastroenterol. Hepatol. 2009, 7, S44–S47. [Google Scholar] [CrossRef] [Green Version]
  9. Chatterjee, D.; Katz, M.H.; Rashid, A.; Estrella, J.S.; Wang, H.; Varadhachary, G.R.; Wolff, R.A.; Lee, J.E.; Pisters, P.W.; Abbruzzese, J.L.; et al. Pancreatic intraepithelial neoplasia and histological changes in non-neoplastic pancreas associated with neoadjuvant therapy in patients with pancreatic ductal adenocarcinoma. Histopathology 2013, 63, 841–851. [Google Scholar] [CrossRef] [Green Version]
  10. Vahrmeijer, A.L.; Hutteman, M.; van der Vorst, J.R.; van de Velde, C.J.H.; Frangioni, J.V. Image-guided cancer surgery using near-infrared fluorescence. Nat. Rev. Clin. Oncol. 2013, 10, 507–518. [Google Scholar] [CrossRef] [Green Version]
  11. Houvast, R.D.; Vankemmelbeke, M.; Durrant, L.G.; Wuhrer, M.; Baart, V.M.; Kuppen, P.J.K.; de Geus-Oei, L.F.; Vahrmeijer, A.L.; Sier, C.F.M. Targeting glycans and heavily glycosylated proteins for tumor imaging. Cancers 2020, 12, 3870. [Google Scholar] [CrossRef]
  12. Fuster, M.M.; Esko, J.D. The sweet and sour of cancer: Glycans as novel therapeutic targets. Nat. Rev. Cancer 2005, 5, 526–542. [Google Scholar] [CrossRef]
  13. Chua, J.X.; Vankemmelbeke, M.; McIntosh, R.S.; Clarke, P.A.; Moss, R.; Parsons, T.; Spendlove, I.; Zaitoun, A.M.; Madhusudan, S.; Durrant, L.G. Monoclonal antibodies targeting LecLex-related Glycans with potent antitumor activity. Clin. Cancer Res. 2015, 21, 2963–2974. [Google Scholar] [CrossRef] [Green Version]
  14. Dube, D.H.; Bertozzi, C.R. Glycans in cancer and inflammation—Potential for therapeutics and diagnostics. Nat. Rev. Drug Discov. 2005, 4, 477–488. [Google Scholar] [CrossRef]
  15. Tivadar, S.T.; McIntosh, R.S.; Chua, J.X.; Moss, R.; Parsons, T.; Zaitoun, A.M.; Madhusudan, S.; Durrant, L.G.; Vankemmelbeke, M. Monoclonal antibody targeting Sialyl-di-Lewis(a)-containing internalizing and noninternalizing glycoproteins with cancer immunotherapy development potential. Mol. Cancer Ther. 2020, 19, 790–801. [Google Scholar] [CrossRef] [Green Version]
  16. Trinchera, M.; Aronica, A.; Dall’Olio, F. Selectin ligands Sialyl-Lewis a and Sialyl-Lewis x in gastrointestinal cancers. Biology 2017, 6, 16. [Google Scholar] [CrossRef]
  17. Contessa, J.N.; Bhojani, M.S.; Freeze, H.H.; Rehemtulla, A.; Lawrence, T.S. Inhibition of N-linked glycosylation disrupts receptor tyrosine kinase signaling in tumor cells. Cancer Res. 2008, 68, 3803–3809. [Google Scholar] [CrossRef] [Green Version]
  18. Wang, S.; You, L.; Dai, M.; Zhao, Y. Mucins in pancreatic cancer: A well-established but promising family for diagnosis, prognosis and therapy. J. Cell. Mol. Med. 2020, 24, 10279–10289. [Google Scholar] [CrossRef]
  19. Kaur, S.; Kumar, S.; Momi, N.; Sasson, A.R.; Batra, S.K. Mucins in pancreatic cancer and its microenvironment. Nat. Rev. Gastroenterol. Hepatol. 2013, 10, 607–620. [Google Scholar] [CrossRef] [Green Version]
  20. Lebrilla, C.B.; An, H.J. The prospects of glycan biomarkers for the diagnosis of diseases. Mol. BioSyst. 2009, 5, 17–20. [Google Scholar] [CrossRef]
  21. Bankhead, P.; Loughrey, M.B.; Fernández, J.A.; Dombrowski, Y.; McArt, D.G.; Dunne, P.D.; McQuaid, S.; Gray, R.T.; Murray, L.J.; Coleman, H.G.; et al. QuPath: Open source software for digital pathology image analysis. Sci. Rep. 2017, 7, 16878. [Google Scholar] [CrossRef] [Green Version]
  22. Breiman, L. Random forests. Mach. Learn. 2001, 45, 5–32. [Google Scholar] [CrossRef] [Green Version]
  23. Thike, A.A.; Chng, M.J.; Fook-Chong, S.; Tan, P.H. Immunohistochemical expression of hormone receptors in invasive breast carcinoma: Correlation of results of H-score with pathological parameters. Pathology 2001, 33, 21–25. [Google Scholar] [CrossRef]
  24. Janssen, Q.P.; van Dam, J.L.; Bonsing, B.A.; Bos, H.; Bosscha, K.P.; Coene, P.; van Eijck, C.H.J.; de Hingh, I.; Karsten, T.M.; van der Kolk, M.B.; et al. Total neoadjuvant FOLFIRINOX versus neoadjuvant gemcitabine-based chemoradiotherapy and adjuvant gemcitabine for resectable and borderline resectable pancreatic cancer (PREOPANC-2 trial): Study protocol for a nationwide multicenter randomized controlled trial. BMC Cancer 2021, 21, 300. [Google Scholar] [CrossRef]
  25. Park, H.S.; Lee, J.M.; Choi, H.K.; Hong, S.H.; Han, J.K.; Choi, B.I. Preoperative evaluation of pancreatic cancer: Comparison of gadolinium-enhanced dynamic MRI with MR cholangiopancreatography versus MDCT. J. Magn. Reson. Imaging 2009, 30, 586–595. [Google Scholar] [CrossRef]
  26. Arvold, N.D.; Niemierko, A.; Mamon, H.J.; Fernandez-del Castillo, C.; Hong, T.S. Pancreatic cancer tumor size on CT scan versus pathologic specimen: Implications for radiation treatment planning. Int. J. Radiat. Oncol. Biol. Phys. 2011, 80, 1383–1390. [Google Scholar] [CrossRef] [Green Version]
  27. Tummers, W.S.; Miller, S.E.; Teraphongphom, N.T.; Gomez, A.; Steinberg, I.; Huland, D.M.; Hong, S.; Kothapalli, S.R.; Hasan, A.; Ertsey, R.; et al. Intraoperative pancreatic cancer detection using tumor-specific multimodality molecular imaging. Ann. Surg. Oncol. 2018, 25, 1880–1888. [Google Scholar] [CrossRef]
  28. Vuijk, F.A.; Hilling, D.E.; Mieog, J.S.D.; Vahrmeijer, A.L. Fluorescent-guided surgery for sentinel lymph node detection in gastric cancer and carcinoembryonic antigen targeted fluorescent-guided surgery in colorectal and pancreatic cancer. J. Surg. Oncol. 2018, 118, 315–323. [Google Scholar] [CrossRef] [PubMed] [Green Version]
  29. Tummers, W.S.; Farina-Sarasqueta, A.; Boonstra, M.C.; Prevoo, H.A.; Sier, C.F.; Mieog, J.S.; Morreau, J.; van Eijck, C.H.; Kuppen, P.J.; van de Velde, C.J.; et al. Selection of optimal molecular targets for tumor-specific imaging in pancreatic ductal adenocarcinoma. Oncotarget 2017, 8, 56816–56828. [Google Scholar] [CrossRef] [PubMed] [Green Version]
  30. Lohrmann, C.; O’Reilly, E.M.; O’Donoghue, J.A.; Pandit-Taskar, N.; Carrasquillo, J.A.; Lyashchenko, S.K.; Ruan, S.; Teng, R.; Scholz, W.; Maffuid, P.W.; et al. Retooling a blood-based biomarker: Phase I assessment of the high-affinity CA19-9 antibody HuMab-5B1 for immuno-PET imaging of pancreatic cancer. Clin. Cancer Res. 2019, 25, 7014–7023. [Google Scholar] [CrossRef] [PubMed] [Green Version]
  31. Ballehaninna, U.K.; Chamberlain, R.S. Serum CA 19-9 as a biomarker for pancreatic cancer—A comprehensive review. Indian J. Surg. Oncol. 2011, 2, 88–100. [Google Scholar] [CrossRef] [Green Version]
  32. Houvast, R.D.; Baart, V.M.; Bhairosingh, S.S.; Cordfunke, R.A.; Chua, J.X.; Vankemmelbeke, M.; Parsons, T.; Kuppen, P.J.K.; Durrant, L.G.; Vahrmeijer, A.L.; et al. Glycan-based near-infrared fluorescent (NIRF) imaging of gastrointestinal tumors: A preclinical proof-of-concept in vivo study. Mol. Imaging Biol. 2020, 22, 1511–1522. [Google Scholar] [CrossRef]
  33. Gold, D.V.; Lew, K.; Maliniak, R.; Hernandez, M.; Cardillo, T. Characterization of monoclonal antibody PAM4 reactive with a pancreatic cancer mucin. Int. J. Cancer 1994, 57, 204–210. [Google Scholar] [CrossRef]
  34. Fan, X.N.; Karsten, U.; Goletz, S.; Cao, Y. Reactivity of a humanized antibody (hPankoMab) towards a tumor-related MUC1 epitope (TA-MUC1) with various human carcinomas. Pathol. Res. Pract. 2010, 206, 585–589. [Google Scholar] [CrossRef]
  35. Gold, D.V.; Karanjawala, Z.; Modrak, D.E.; Goldenberg, D.M.; Hruban, R.H. PAM4-reactive MUC1 is a biomarker for early pancreatic adenocarcinoma. Clin. Cancer Res. 2007, 13, 7380–7387. [Google Scholar] [CrossRef] [Green Version]
  36. Shi, C.; Merchant, N.; Newsome, G.; Goldenberg, D.M.; Gold, D.V. Differentiation of pancreatic ductal adenocarcinoma from chronic pancreatitis by PAM4 immunohistochemistry. Arch. Pathol. Lab. Med. 2014, 138, 220–228. [Google Scholar] [CrossRef] [Green Version]
  37. Loughrey, M.B.; Bankhead, P.; Coleman, H.G.; Hagan, R.S.; Craig, S.; McCorry, A.M.B.; Gray, R.T.; McQuaid, S.; Dunne, P.D.; Hamilton, P.W.; et al. Validation of the systematic scoring of immunohistochemically stained tumour tissue microarrays using QuPath digital image analysis. Histopathology 2018, 73, 327–338. [Google Scholar] [CrossRef] [Green Version]
  38. Adams, E.J.; Green, J.A.; Clark, A.H.; Youngson, J.H. Comparison of different scoring systems for immunohistochemical staining. J. Clin. Pathol. 1999, 52, 75–77. [Google Scholar] [CrossRef] [Green Version]
  39. Feuchtinger, A.; Stiehler, T.; Jütting, U.; Marjanovic, G.; Luber, B.; Langer, R.; Walch, A. Image analysis of immunohistochemistry is superior to visual scoring as shown for patient outcome of esophageal adenocarcinoma. Histochem. Cell Biol. 2015, 143, 1–9. [Google Scholar] [CrossRef]
  40. Bankhead, P.; Fernández, J.A.; McArt, D.G.; Boyle, D.P.; Li, G.; Loughrey, M.B.; Irwin, G.W.; Harkin, D.P.; James, J.A.; McQuaid, S.; et al. Integrated tumor identification and automated scoring minimizes pathologist involvement and provides new insights to key biomarkers in breast cancer. Lab. Investig. 2018, 98, 15–26. [Google Scholar] [CrossRef] [Green Version]
Figure 1. Representative (immuno)histochemical staining of HE, Lea/c/x, sdi-Lea, sLea, sLex, sTn, MUC1 and MUC5AC expression on PDAC, CP, pancreas and duodenum tissues. HE: hematoxylin-eosin, CP: chronic pancreatitis, PDAC: pancreatic ductal adenocarcinoma, Overview images and inserts are taken at 5× and 25× magnification, respectively. Scale bars represent 100 µM.
Cancers 13 05777 g001
Figure 2. H-score scatter plots of immunohistochemical staining of (A) Lea/c/x; (B) sdi-Lea; (C) sLea; (D) sLex; (E) sTn; (F) MUC1; (G) MUC5AC expression on PDAC, CP, pancreas and duodenum tissues. Mean H-scores are represented by the horizontal line together with their error bars representing the 95% confidence interval. Within each tissue category, every dot represents immunohistochemical staining on one case. CP: chronic pancreatitis, Duo: duodenum, ns: not significant, Panc: pancreas, PDAC: pancreatic ductal adenocarcinoma, **: p < 0.01, ***: p < 0.001, ****: p < 0.0001.
Cancers 13 05777 g002
Figure 3. H-score scatter plots of immunohistochemical staining of (A) Lea/c/x; (B) sdi-Lea; (C) sLea; (D) sLex; (E) sTn; (F) MUC1; (G) MUC5AC expression on PDAC tissues of patients who received NAT or no NAT. Mean H-scores are represented by the horizontal line together with their error bars representing the 95% confidence interval. Each dot represents immunohistochemical staining on one case. NAT: neoadjuvant treatment, ns: not significant.
Cancers 13 05777 g003
Figure 4. Representative images of (immune)histochemical staining of (A) HE; (B) Lea/c/x; (C) sdi-Lea; (D) sLea; (E) sLex; (F) sTn; (G) MUC1; (H) MUC5AC expression on LN+ tissues of primary PDAC patients. Overview images and inserts are taken at 5× and 25× magnification, respectively. Scale bars represent 100 µM. HE: hematoxylin-eosin, LN+: positive lymph node.
Cancers 13 05777 g004
Figure 5. H-score scatter plots of immunohistochemical staining of (A) Lea/c/x; (B) sdi-Lea; (C) sLea; (D) sLex; (E) sTn; (F) MUC1; (G) MUC5AC expression on LN+ and LN tissues. Mean H-scores are represented by the horizontal line together with their error bars representing the 95% confidence interval. Within each tissue category, every dot represents immunohistochemical staining on one case. LN+: positive lymph node, LN: negative lymph node, ****: p < 0.0001.
Cancers 13 05777 g005
Table 1. Characteristics of PDAC patients (n = 53) and CP patients (n = 9) *. PDAC patients are categorized into NAT and no NAT patients. p-values represent differences between NAT and no NAT patients. CP: chronic pancreatitis, IQR: interquartile range, NA: not applicable, NAT: neoadjuvant therapy, PDAC: pancreatic ductal adenocarcinoma, SD: standard deviation.
CharacteristicTotal PDAC
(n = 53)
NAT
(n = 22)
No NAT
(n = 31)
p-ValueCP
(n = 9)
Age, years, mean (SD)64.7 (9.8)61.3 (9.1)67.1 (9.7)0.03353.5 (10.9)
Gender, n (%)
Male26 (49)9 (41)17 (55)0.4068 (89)
Female27 (51)13 (59)14 (45) 1 (11)
Surgery type, n (%)
Pancreaticoduodenectomy41 (77)16 (73)25 (81)0.6324 (44)
Pancreatic corpus/tail resection9 (17)4 (18)5 (16) 5 (56)
Total pancreatectomy3 (6)2 (9)1 (3) 0 (0)
Tumor differentiation, n (%)
Good6 (11)1 (5)5 (16)0.607-
Moderate12 (23)1 (5)11 (36) -
Poor18 (34)4 (18)14 (45) -
Missing17 (32)16 (73)1 (3) -
Primary tumor, n (%)
pT118 (34)10 (46)8 (26)0.275-
pT227 (51)10 (46)17 (55) -
pT38 (15)2 (9)6 (19) -
Regional lymph nodes, n (%)
pN018 (34)13 (59)5 (16)<0.001-
pN121 (40)9 (41)12 (39) -
pN214 (26)0 (0)14 (45) -
Surgical margin status, n (%)
R029 (55)15 (68)14 (45)0.161-
R124 (45)7 (32)17 (55) -
NAT, n (%)
No31 (59)0 (0)31 (100)-8 (89)
Yes, chemoradiotherapy15 (28)15 (68)0 (0)-0 (0)
Yes, chemotherapy7 (13)7 (32)0 (0)-1 (11)
Tumor size, mm, mean (SD)26 (13)22 (11)30 (13)0.024-
Serum CEA, µg/L, median (IQR)3.2 (5.9)3.2 (6.5)3.5 (5.2)0.349-
Serum CA19-9, kU/L, median (IQR)74.5 (377.5)48.4 (69.7)322.8 (371.6)0.007-
* Patients primarily diagnosed with CP are listed in the table as a separate cohort next to PDAC patients.
Table 2. Percentage of PDAC tissues with positive immunohistochemical staining (H-score ≥ 51 out of 300) and mean tumor:CP, tumor:pancreas and tumor:duodenum H-score ratios, along with the p-value of the H-score difference. CP: chronic pancreatitis, PDAC: pancreatic ductal adenocarcinoma.
BiomarkerPDAC
Positive
n (%)
Tumor:
CP
p-ValueTumor:
Pancreas
p-ValueTumor:
Duodenum
p-Value
Lea/c/x40 (83)1.70.00102.5<0.00011.90.0073
sdi-Lea45 (94)2.9<0.000110.3<0.000110.0<0.0001
sLea47 (98)2.2<0.00013.8<0.00015.9<0.0001
sLex43 (90)33.2<0.000120.9<0.000153.0<0.0001
sTn42 (88)15.6<0.0001100.9<0.00010.6<0.0001
MUC146 (96)1.40.00121.0>0.99994.8<0.0001
MUC5AC32 (67)11.5<0.000113.6<0.00015.6<0.0001
Table 3. Distribution of biomarker expression on 48 PDAC tissues (n (%)). Expression was categorized as negative (H-score: 0–50), low (H score: 51–100), moderate (H-score: 101–200) or high (H-score 201–300). PDAC: pancreatic ductal adenocarcinoma.
PDAC Expression
BiomarkerNegative
n (%)
Low
n (%)
Moderate
n (%)
High
n (%)
Lea/c/x8 (17)8 (17)23 (48)9 (19)
sdi-Lea3 (6)5 (10)11 (23)29 (60)
sLea1 (2)0 (0)15 (31)32 (67)
sLex5 (10)7 (15)20 (42)16 (33)
sTn6 (13)7 (15)23 (48)12 (25)
MUC12 (4)1 (2)18 (38)27 (56)
MUC5AC16 (33)9 (19)17 (35)6 (13)
Table 4. Percentage of cases with positive expression for at least one of two biomarker combinations (panel: ≥1) along with the percentage of cases with expression of both biomarkers (panel: both). Immunohistochemical staining with an H-score of ≥51.0 was considered positive.
BiomarkerPanelLea/c/x
(%)
sdi-Lea
(%)
sLea
(%)
sLex
(%)
sTn
(%)
MUC1
(%)
MUC5AC
(%)
Lea/c/x≥1
Both
-------
sdi-Lea≥1
Both
94
83
------
sLea≥1
Both
100
81
100
92
-----
sLex≥1
Both
98
75
100
83
100
88
----
sTn≥1
Both
100
71
100
81
100
85
98
79
---
MUC1≥1
Both
100
79
100
90
100
94
100
85
100
83
--
MUC5AC≥1
Both
96
54
96
65
98
67
96
60
90
65
96
67
-
Table 5. Biomarker sensitivity, specificity, PPV, NPV and accuracy along with the AUC and p-value for identification of LN+. Immunohistochemical staining with an H-score of ≥51.0 was considered positive. AUC: area under the curve, PPV: positive predictive value, NPV: negative predictive value, Sens.: sensitivity, Spec.: specificity, 95% CI: 95% confidence interval.
BiomarkerSens.
(%)
Spec.
(%)
PPV
(%)
NPV
(%)
Accuracy
(%)
AUC (95% CI)p-Value
Lea/c/x78989687900.929 (0.846–1.000)<0.0001
sdi-Lea70887982810.955 (0.896–1.000)<0.0001
sLea78837585810.927 (0.858–0.995)<0.0001
sLex5910010079840.960 (0.913–1.000)<0.0001
sTn5210010076810.954 (0.894–1.000)<0.0001
MUC19310010095971.000 (1.000–1.000)<0.0001
MUC5AC7810010087910.972 (0.912–1.000)<0.0001
Publisher’s Note: MDPI stays neutral with regard to jurisdictional claims in published maps and institutional affiliations.

