
Prospective Evaluation of Sarcopenia in Head and Neck Cancer Patients Treated with Radiotherapy or Radiochemotherapy

 ,
,  ,
,
Abstract
:Simple Summary
Abstract
1. Introduction
2. Materials and Methods
2.1. Patients’ Characteristics
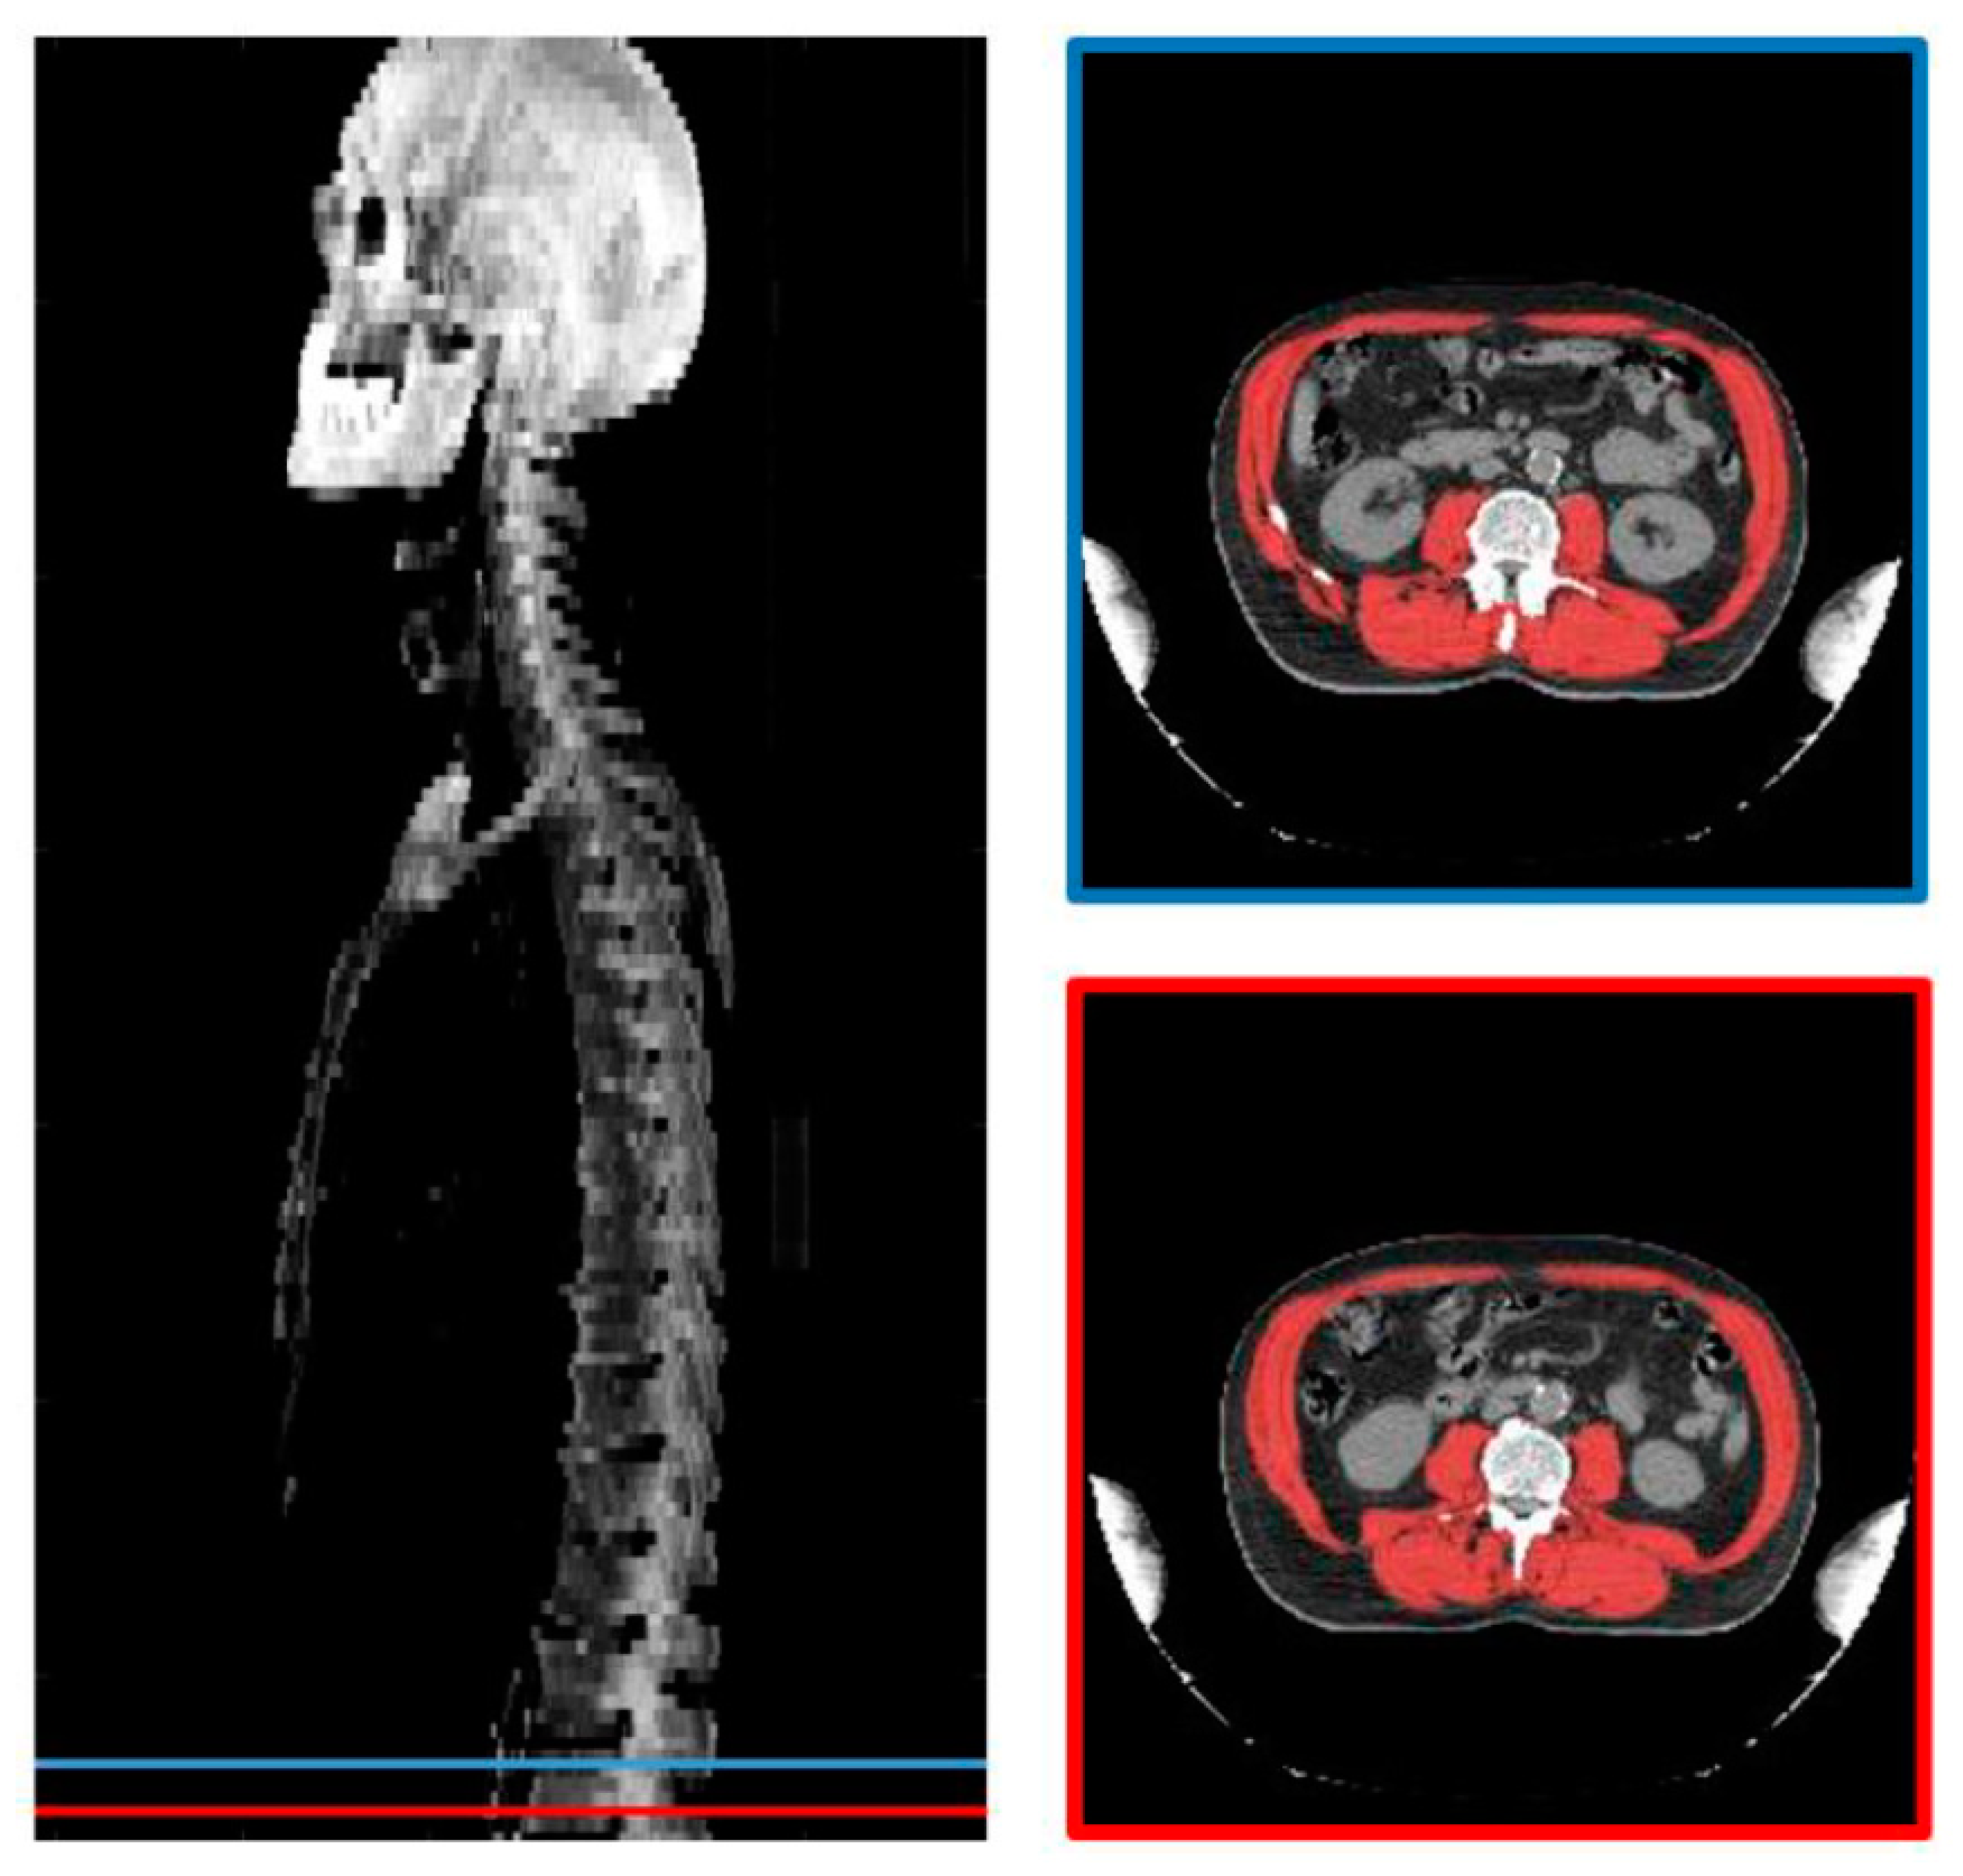
2.2. CT Scan
2.3. Statistics
3. Results
3.1. Patient Characteristics
3.2. Patient Characteristics According to Treatment
3.3. Treatment Compliance and Toxicity
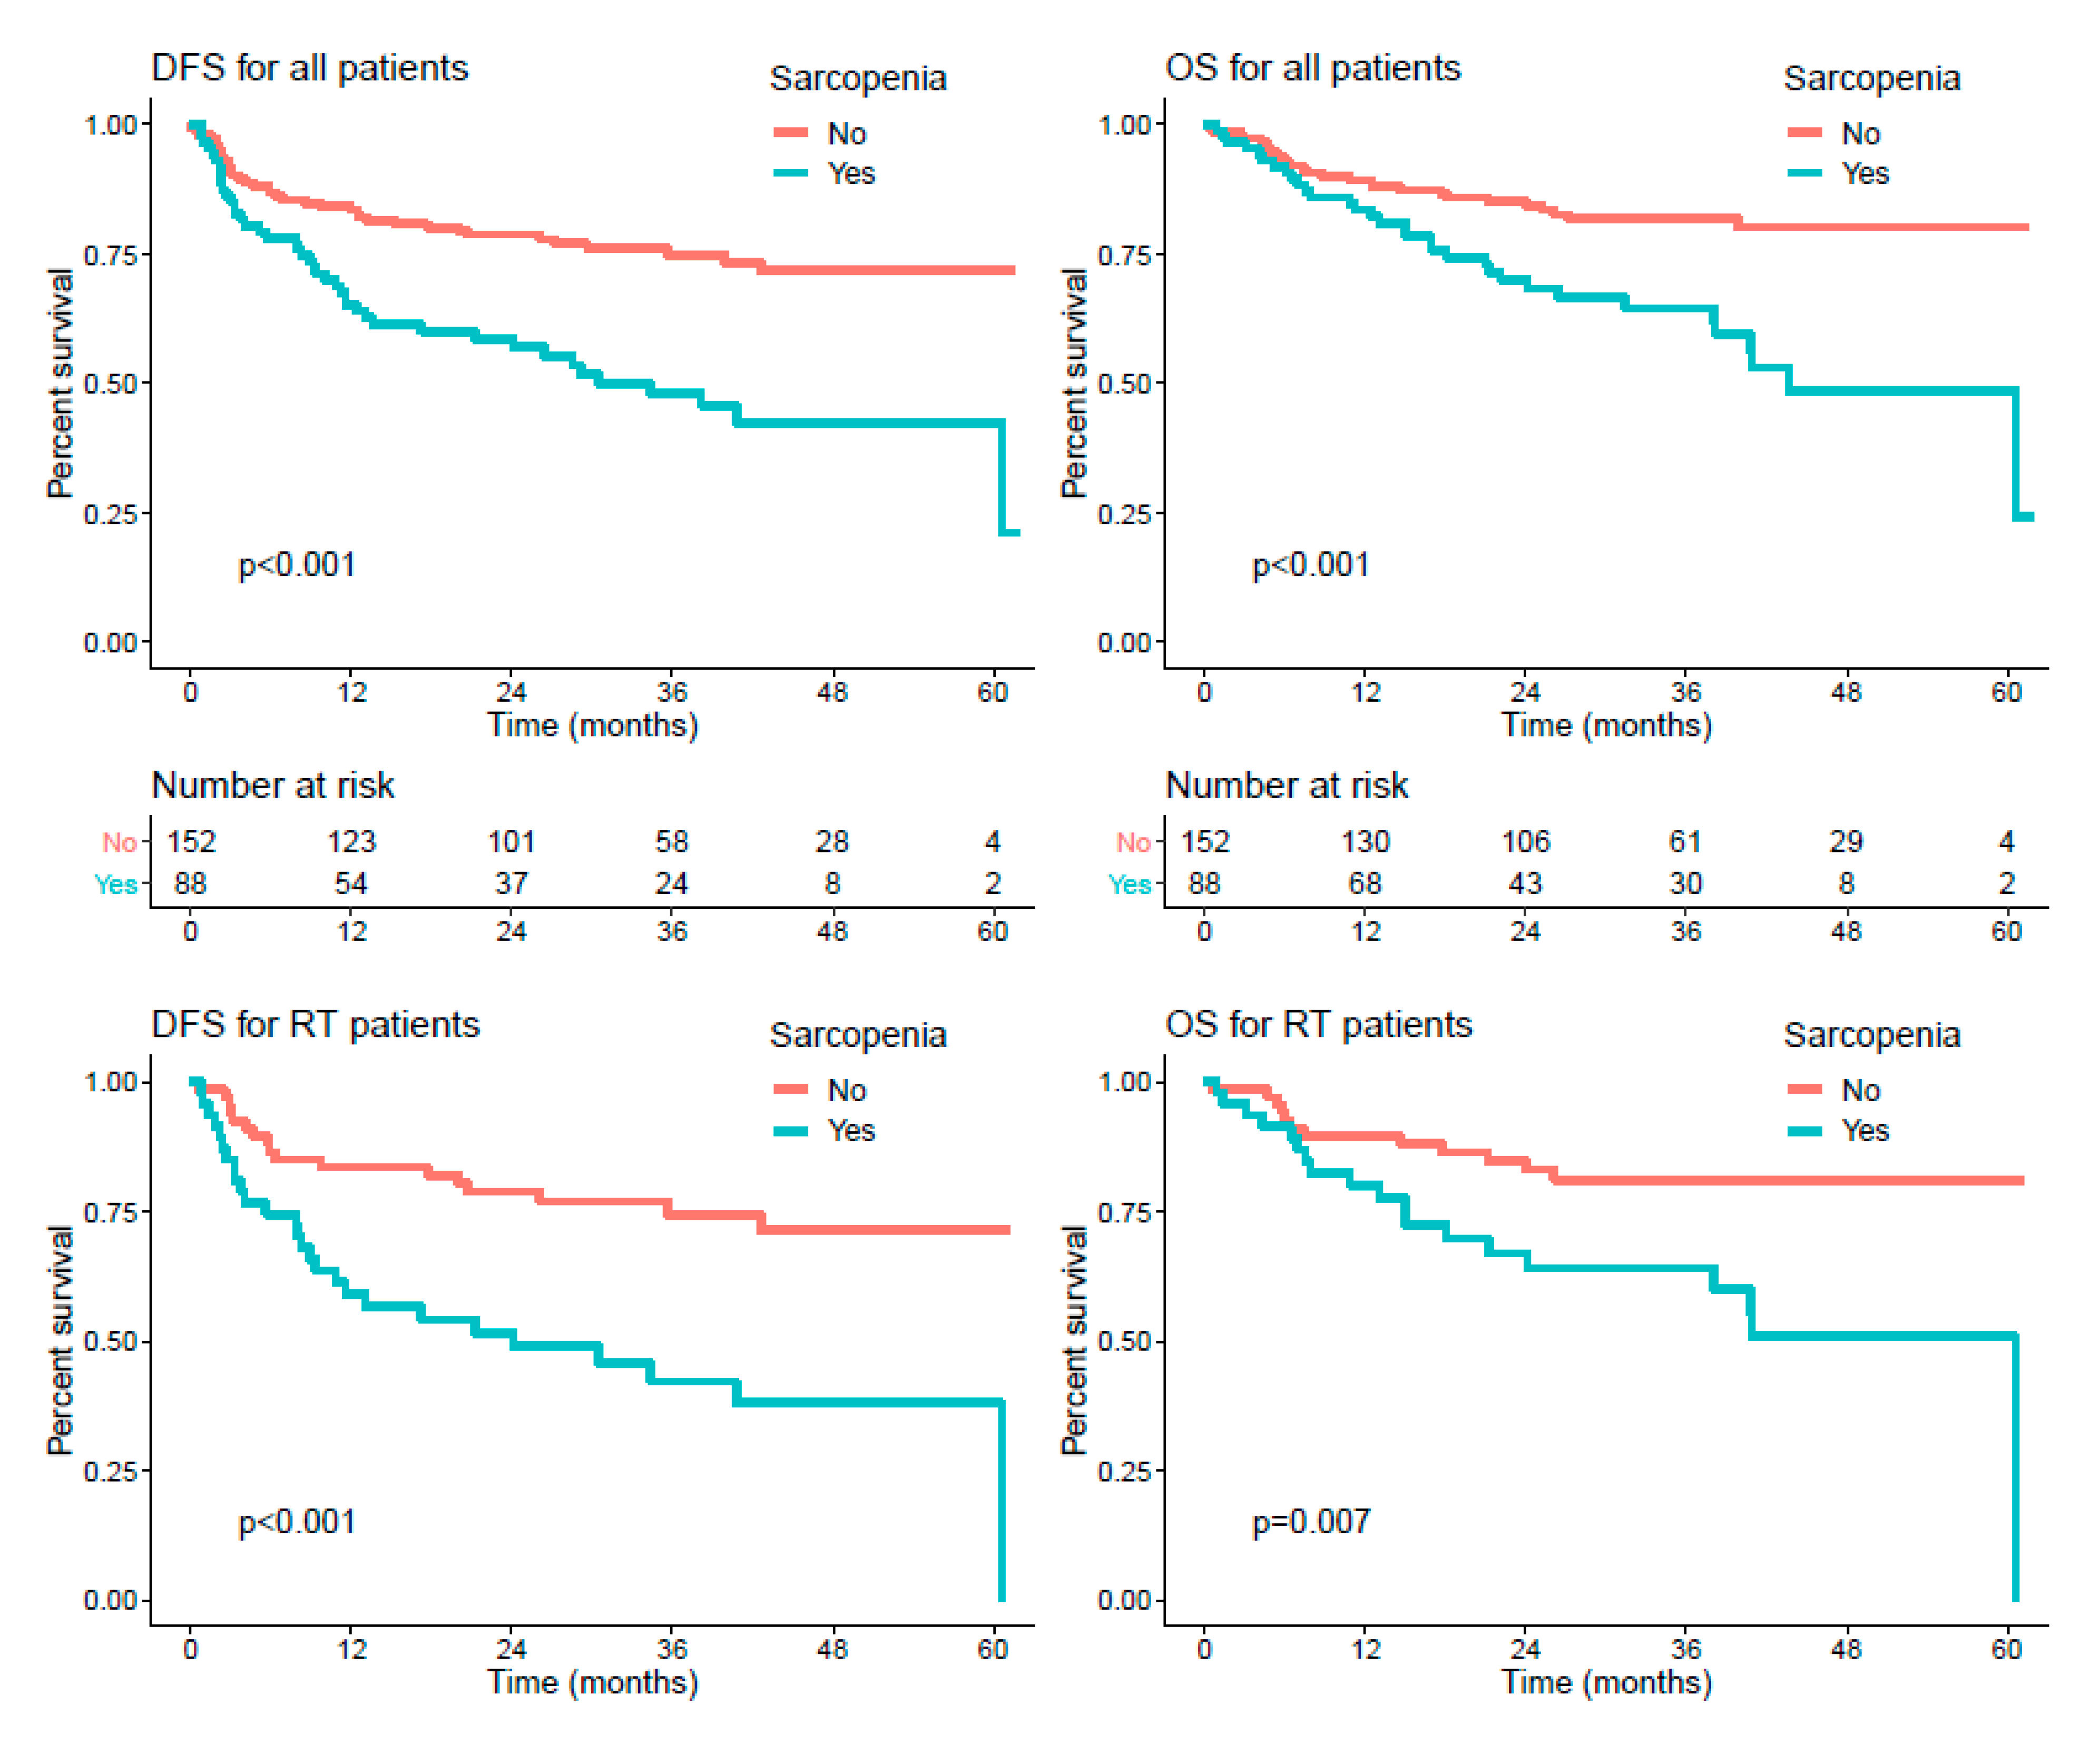
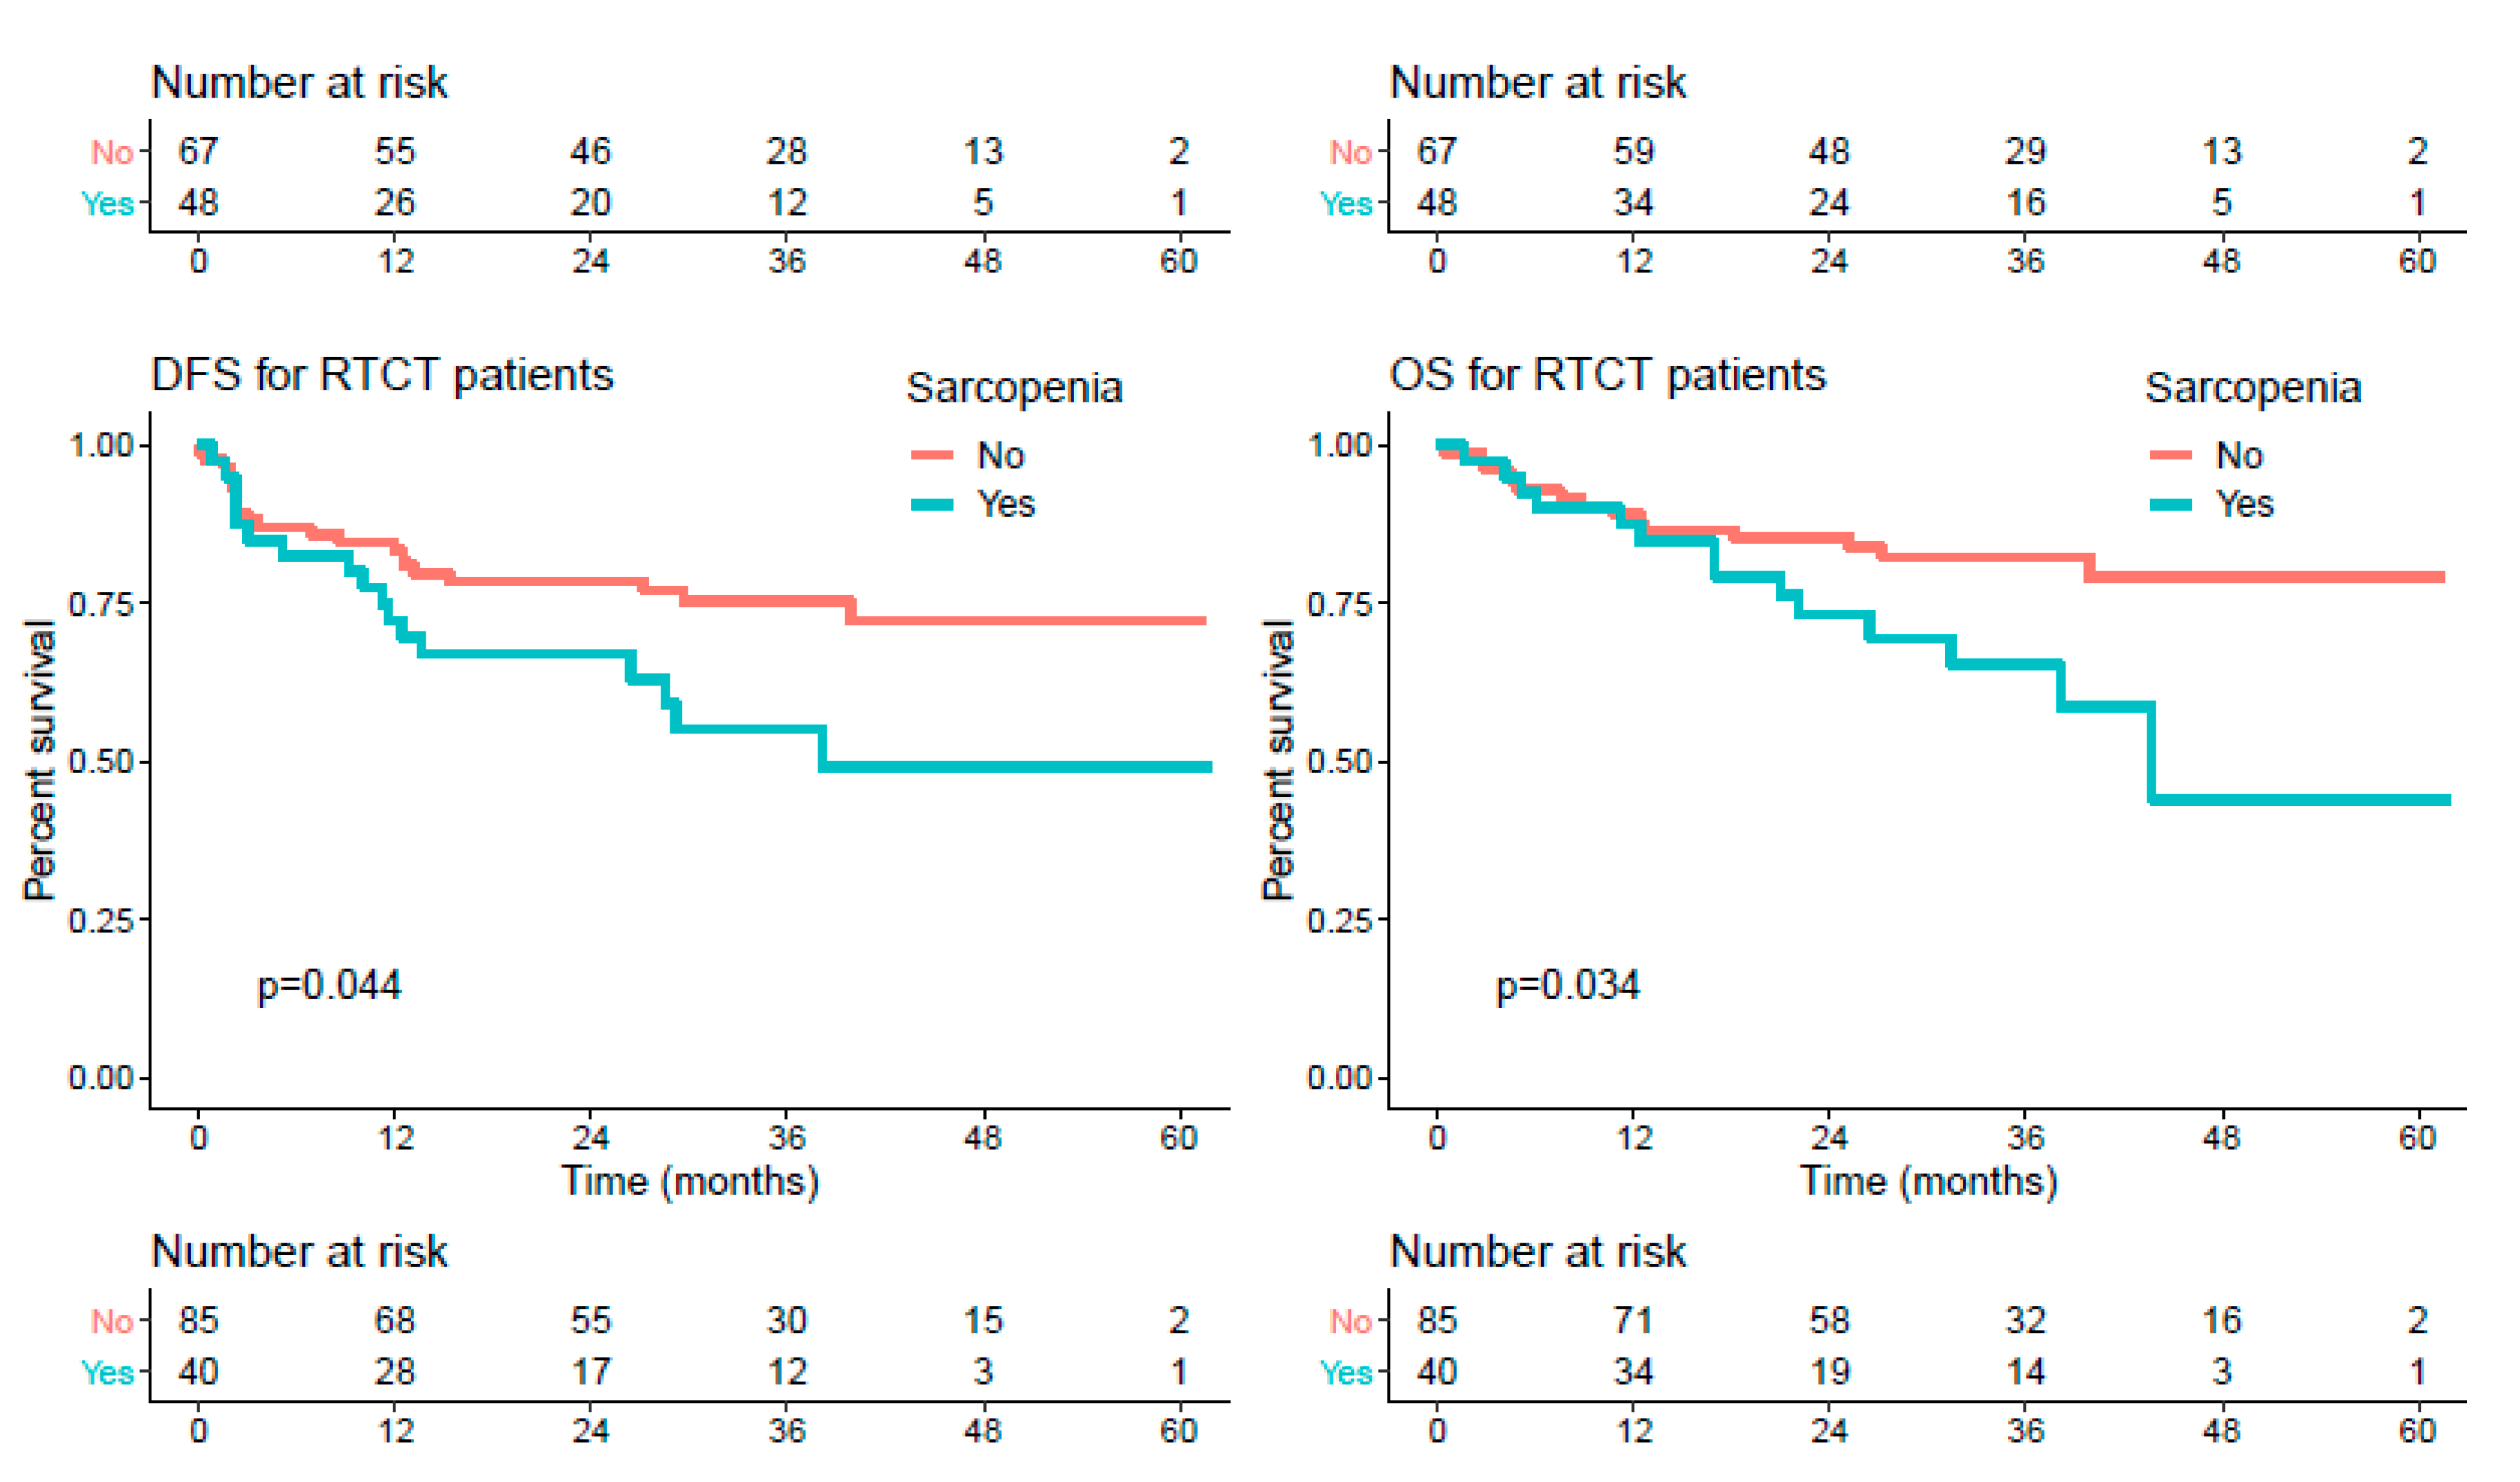
3.4. Survival Endpoints
4. Discussion
5. Conclusions
Supplementary Materials
Author Contributions
Funding
Institutional Review Board Statement
Informed Consent Statement
Data Availability Statement
Acknowledgments
Conflicts of Interest
References
- Bray, F.; Ferlay, J.; Soerjomataram, I.; Siegel, R.L.; Torre, L.A.; Jemal, A. Global cancer statistics 2018: GLOBOCAN estimates of incidence and mortality worldwide for 36 cancers in 185 countries. CA Cancer J. Clin. 2018, 68, 394–424. [Google Scholar] [CrossRef] [PubMed] [Green Version]
- Langendijk, J.A.; Slotman, B.J.; Van Der Waal, I.; Doornaert, P.; Berkof, J.; Leemans, C.R. Risk-group definition by recursive partitioning analysis of patients with squamous cell head and neck carcinoma treated with surgery and postoperative radiotherapy. Cancer 2005, 104, 1408–1417. [Google Scholar] [CrossRef]
- Pignon, J.-P.; Le Maître, A.; Maillard, E.; Bourhis, J. Meta-analysis of chemotherapy in head and neck cancer (MACH-NC): An update on 93 randomised trials and 17,346 patients. Radiother. Oncol. 2009, 92, 4–14. [Google Scholar] [CrossRef] [PubMed]
- Bernier, J.; Domenge, C.; Ozsahin, M.; Matuszewska, K.; Lefèbvre, J.-L.; Greiner, R.H.; Giralt, J.; Maingon, P.; Rolland, F.; Bolla, M.; et al. Postoperative irradiation with or without concomitant chemotherapy for locally advanced head and neck cancer. N. Engl. J. Med. 2004, 350, 1945–1952. [Google Scholar] [CrossRef] [Green Version]
- Silander, E.; Nyman, J.; Hammerlid, E. An exploration of factors predicting malnutrition in patients with advanced head and neck cancer. Laryngoscope 2013, 123, 2428–2434. [Google Scholar] [CrossRef] [PubMed]
- Strojan, P.; Vermorken, J.B.; Beitler, J.J.; Saba, N.F.; Haigentz, M.; Bossi, P.; Worden, F.P.; Langendijk, J.A.; Eisbruch, A.; Mendenhall, W.M.; et al. Cumulative cisplatin dose in concurrent chemoradiotherapy for head and neck cancer: A systematic review. Head Neck 2015, 38, E2151–E2158. [Google Scholar] [CrossRef] [Green Version]
- Brown, T.E.; Banks, M.D.; Hughes, B.G.M.; Lin, C.Y.; Kenny, L.M.; Bauer, J.D. Randomised controlled trial of early prophylactic feeding vs standard care in patients with head and neck cancer. Br. J. Cancer 2017, 117, 15–24. [Google Scholar] [CrossRef] [Green Version]
- Camus, V.; Lanic, H.; Kraut, J.; Modzelewski, R.; Clatot, F.; Picquenot, J.M.; Contentin, N.; Lenain, P.; Groza, L.; Lemasle, E.; et al. Prognostic impact of fat tissue loss and cachexia assessed by computed tomography scan in elderly patients with diffuse large B-cell lymphoma treated with immunochemotherapy. Eur. J. Haematol. 2014, 93, 9–18. [Google Scholar] [CrossRef] [PubMed]
- Willemsen, A.C.; Hoeben, A.; Lalisang, R.I.; Van Helvoort, A.; Wesseling, F.W.; Hoebers, F.; Baijens, L.W.; Schols, A.M. Disease-induced and treatment-induced alterations in body composition in locally advanced head and neck squamous cell carcinoma. J. Cachexia Sarcopenia Muscle 2020, 11, 145–159. [Google Scholar] [CrossRef] [PubMed] [Green Version]
- Yamaguchi, T.; Makiguchi, T.; Nakamura, H.; Yamatsu, Y.; Hirai, Y.; Shoda, K.; Suzuki, K.; Kim, M.; Kurozumi, S.; Motegi, S.; et al. Impact of muscle volume loss on acute oral mucositis in patients undergoing concurrent chemoradiotherapy after oral cancer resection. Int. J. Oral Maxillofac. Surg. 2021. [Google Scholar] [CrossRef] [PubMed]
- Silva, P.B.; Ramos, G.H.A.; Petterle, R.R.; Borba, V.Z.C. Sarcopenia as an early complication of patients with head and neck cancer with dysphagia. Eur. J. Cancer Care 2021, 30, e13343. [Google Scholar] [CrossRef] [PubMed]
- Almada-Correia, I.; Neves, P.M.; Mäkitie, A.; Ravasco, P. Body composition evaluation in head and neck cancer patients: A review. Front. Oncol. 2019, 9, 1112. [Google Scholar] [CrossRef] [Green Version]
- Matsuyama, R.; Maeda, K.; Yamanaka, Y.; Ishida, Y.; Kato, R.; Nonogaki, T.; Shimizu, A.; Ueshima, J.; Kazaoka, Y.; Hayashi, T.; et al. Assessing skeletal muscle mass based on the cross-sectional area of muscles at the 12th thoracic vertebra level on computed tomography in patients with oral squamous cell carcinoma. Oral Oncol. 2021, 113, 105126. [Google Scholar] [CrossRef] [PubMed]
- Zwart, A.T.; Becker, J.-N.; Lamers, M.J.; Dierckx, R.A.J.O.; De Bock, G.H.; Halmos, G.B.; Van Der Hoorn, A. Skeletal muscle mass and sarcopenia can be determined with 1.5-T and 3-T neck MRI scans, in the event that no neck CT scan is performed. Eur. Radiol. 2020, 1–10. [Google Scholar] [CrossRef]
- Findlay, M.; White, K.; Stapleton, N.; Bauer, J. Is sarcopenia a predictor of prognosis for patients undergoing radiotherapy for head and neck cancer? A meta-analysis. Clin. Nutr. 2020. [Google Scholar] [CrossRef]
- Jung, A.R.; Roh, J.-L.; Kim, J.S.; Kim, S.-B.; Choi, S.-H.; Nam, S.Y.; Kim, S.Y. Prognostic value of body composition on recurrence and survival of advanced-stage head and neck cancer. Eur. J. Cancer 2019, 116, 98–106. [Google Scholar] [CrossRef]
- Chargi, N.; Bril, S.; Swartz, J.; Wegner, I.; Willems, S.; De Bree, R. Skeletal muscle mass is an imaging biomarker for decreased survival in patients with oropharyngeal squamous cell carcinoma. Oral Oncol. 2020, 101, 104519. [Google Scholar] [CrossRef] [PubMed]
- Grossberg, A.J.; Chamchod, S.; Fuller, C.D.; Mohamed, A.S.R.; Heukelom, J.; Eichelberger, H.; Kantor, M.E.; Hutcheson, K.A.; Gunn, G.B.; Garden, A.S.; et al. Association of body composition with survival and locoregional control of radiotherapy-treated head and neck squamous cell carcinoma. JAMA Oncol. 2016, 2, 782–789. [Google Scholar] [CrossRef]
- Van Rijn-Dekker, M.I.; Bosch, L.V.D.; Hoek, J.G.V.D.; Bijl, H.P.; Van Aken, E.S.; Van Der Hoorn, A.; Oosting, S.F.; Halmos, G.B.; Witjes, M.J.; Van Der Laan, H.P.; et al. Impact of sarcopenia on survival and late toxicity in head and neck cancer patients treated with radiotherapy. Radiother. Oncol. 2020, 147, 103–110. [Google Scholar] [CrossRef]
- Shodo, R.; Yamazaki, K.; Ueki, Y.; Takahashi, T.; Horii, A. Sarcopenia predicts a poor treatment outcome in patients with head and neck squamous cell carcinoma receiving concurrent chemoradiotherapy. Eur. Arch. Oto-Rhino-Laryngol. 2020. [Google Scholar] [CrossRef]
- Lerouge, J.; Herault, R.; Chatelain, C.; Jardin, F.; Modzelewski, R. IODA: An input/output deep architecture for image labeling. Pattern Recognit. 2015, 48, 2847–2858. [Google Scholar] [CrossRef] [Green Version]
- Mitsiopoulos, N.; Baumgartner, R.N.; Heymsfield, S.B.; Lyons, W.; Gallagher, D.; Ross, R. Cadaver validation of skeletal muscle measurement by magnetic resonance imaging and computerized tomography. J. Appl. Physiol. 1998, 85, 115–122. [Google Scholar] [CrossRef]
- Shen, W.; Punyanitya, M.; Wang, Z.; Gallagher, D.; St.-Onge, M.-P.; Albu, J.; Heymsfield, S.B.; Heshka, S. Total body skeletal muscle and adipose tissue volumes: Estimation from a single abdominal cross-sectional image. J. Appl. Physiol. 2004, 97, 2333–2338. [Google Scholar] [CrossRef] [PubMed] [Green Version]
- The R Development Core Team. R: A Language and Environment for Statistical Computing, Version 2.6.2; R Foundation for Statistical Computing: Vienna, Austria, 2019. [Google Scholar]
- Heinze, G.; Wallisch, C.; Dunkler, D. Variable selection—A review and recommendations for the practicing statistician. Biom. J. 2018, 60, 431–449. [Google Scholar] [CrossRef] [PubMed] [Green Version]
- Findlay, M.; White, K.; Lai, M.; Luo, D.; Bauer, J.D. The association between computed tomography–defined sarcopenia and outcomes in adult patients undergoing radiotherapy of curative intent for head and neck cancer: A systematic review. J. Acad. Nutr. Diet. 2020, 120, 1330–1347.e8. [Google Scholar] [CrossRef] [PubMed]
- Capozzi, L.C.; McNeely, M.L.; Lau, H.Y.; Reimer, R.A.; Giese-Davis, J.; Fung, T.S.; Culos-Reed, S.N. Patient-reported outcomes, body composition, and nutrition status in patients with head and neck cancer: Results from an exploratory randomized controlled exercise trial. Cancer 2016, 122, 1185–1200. [Google Scholar] [CrossRef] [PubMed] [Green Version]
- Huiskamp, L.F.J.; Chargi, N.; Devriese, L.A.; De Jong, P.A.; De Bree, R. The predictive and prognostic value of low skeletal muscle mass for dose-limiting toxicity and survival in head and neck cancer patients receiving concomitant cetuximab and radiotherapy. Eur. Arch. Oto-Rhino-Laryngol. 2020, 277, 2847–2858. [Google Scholar] [CrossRef] [Green Version]
- Icard, P.; Schussler, O.; Loi, M.; Bobbio, A.; Lupo, A.M.; Wislez, M.; Iannelli, A.; Fournel, L.; Damotte, D.; Alifano, M. Pre-disease and pre-surgery bmi, weight loss and sarcopenia impact survival of resected lung cancer independently of tumor stage. Cancers 2020, 12, 266. [Google Scholar] [CrossRef] [PubMed] [Green Version]
- Baxi, S.S.; Schwitzer, E.; Jones, L.W. A review of weight loss and sarcopenia in patients with head and neck cancer treated with chemoradiation. Cancers Head Neck 2016, 1, 1–7. [Google Scholar] [CrossRef] [PubMed] [Green Version]


| Characteristic | Total (n = 243) | Radiotherapy (n = 116) | Radiochemotherapy (n = 127) | p-Value |
|---|---|---|---|---|
| Sex ratio (M:F) | 3.34 | 3.14 | 3.54 | 0.7 |
| Age (years), mean ± SD | 61.13 ± 9.04 | 63.41 ± 10.40 | 59.04 ± 6.99 | 0.00014 |
| Age (median; Q1–Q3) | 61 (56; 66) | 62.5 (57; 70) | 60 (54.5; 64) | |
| Smoking history, n (%) | 0.25 | |||
| Ever | 198 (81.5) | 98 (84.5) | 100 (78.7) | |
| Never | 45 (18.5) | 18 (15.5) | 27 (21.3) | |
| Chronic alcohol drinking, n (%) | 0.86 | |||
| Yes | 118 (48.6) | 57 (49.1) | 61 (48.0) | |
| No | 125 (51.4) | 59 (50.9) | 66 (52.0) | |
| BMI, mean ± SD | 24.94 ± 4.56 | 24.78 ± 4.72 | 25.09 ± 4.43 | 0.59 |
| Cancer site, n (%) | 0.3 | |||
| Oral cavity | 69 (28.4) | 39 (33.6) | 30 (23.6) | |
| Oropharynx | 79 (32.5) | 32 (27.6) | 47 (37.0) | |
| Hypopharynx | 39 (16.0) | 17 (14.7) | 22 (17.3) | |
| Larynx | 39 (16.0) | 21 (18.1) | 18 (14.2) | |
| Cancer of unknown primary (CUP) | 17 (7.0) | 7 (6.0) | 10 (7.9) | |
| T stage, n (%) | 0.0039 | |||
| T0 | 17 (7.0) | 7 (6.0) | 10 (7.9) | |
| T1 | 45 (18.5) | 29 (25.0) | 16 (12.6) | |
| T2 | 79 (32.5) | 45 (38.8) | 34 (26.8) | |
| T3 | 51 (21.0) | 18 (15.5) | 33 (26.0) | |
| T4 | 51 (21.0) | 17 (14.7) | 34 (26.8) | |
| N stage, n (%) | <0.0001 | |||
| N0 | 91 (37.4) | 61 (52.6) | 30 (23.6) | |
| N1 | 47 (19.3) | 19 (16.4) | 28 (22.0) | |
| N2 | 82 (33.7) | 29 (25.0) | 53 (41.7) | |
| N3 | 23 (9.5) | 7 (6.0) | 16 (12.6) | |
| Stage, n (%) | <0.0001 | |||
| I | 19 (7.8) | 17 (14.7) | 2 (1.6) | |
| II | 50 (20.6) | 30 (25.9) | 20 (15.7) | |
| III | 57 (23.5) | 26 (22.4) | 31 (24.4) | |
| IV | 117 (48.1) | 43 (37.1) | 74 (58.3) | |
| p16 status (among oropharyngeal cancer patients), n (%) | 0.09 | |||
| Positive | 23 (29.1) | 5 (15.6) | 18 (38.3) | |
| Negative | 30 (38.0) | 14 (43.8) | 16 (34.0) | |
| Not known | 26 (32.9) | 13 (40.6) | 13 (27.7) | |
| WHO PS, n (%) | 0.15 | |||
| 0 | 97 (40.1) | 41 (35.7) | 56 (44.1) | |
| 1 | 127 (52.5) | 62 (53.9) | 65 (51.2) | |
| 2 | 18 (7.4) | 12 (10.4) | 6 (4.7) | |
| Undernutrition, n (%) | 0.48 | |||
| Yes | 8 (3.3) | 5 (4.4) | 3 (2.4) | |
| No | 231 (96.7) | 108 (95.6) | 123 (97.6) | |
| Sarcopenia, n (%) | 0.12 | |||
| Present | 88 (36.7) | 48 (41.7) | 40 (32.0) | |
| Absent | 152 (63.3) | 67 (58.3) | 85 (68.0) | |
| Performed surgery, n (%) | <0.0001 | |||
| Yes | 152 (62.6) | 89 (76.7) | 63 (49.6) | |
| No | 91 (37.4) | 27 (23.3) | 64 (50.4) |
| Toxicities | Radiotherapy (n = 116) | p-Value * | Radiochemotherapy (n = 127) | p-Value * | ||||||||||
|---|---|---|---|---|---|---|---|---|---|---|---|---|---|---|
| Sarcopenia (n = 48) | No Sarcopenia (n = 67) | Sarcopenia (n = 40) | No Sarcopenia (n = 85) | |||||||||||
| Grade 0–1 | Grade 2 | Grade ≥ 3 | Grade 0–1 | Grade 2 | Grade ≥3 | Grade 0–1 | Grade 2 | Grade ≥ 3 | Grade 0–1 | Grade 2 | Grade ≥ 3 | |||
| Mucositis | 11 (22.9) | 28 (58.3) | 9 (18.8) | 14 (20.9) | 42 (62.7) | 11 (16.4) | 0.89 | 7 (17.5) | 23 (57.5) | 10 (25.0) | 18 (21.4) | 49 (58.3) | 17 (20.2) | 0.78 |
| Dermatitis | 16 (33.3) | 28 (58.3) | 4 (8.3) | 27 (40.9) | 33 (50.0) | 6 (9.1) | 0.69 | 13 (32.5) | 23 (57.5) | 4 (10.0) | 34 (40.5) | 42 (50.0) | 8 (9.5) | 0.66 |
| Dysphagia | 26 (56.5) | 10 (21.7) | 10 (21.7) | 31 (47.7) | 23 (35.4) | 11 (16.9) | 0.3 | 16 (40.0) | 9 (22.5) | 15 (37.5) | 31 (36.9) | 23 (27.4) | 30 (35.7) | 0.84 |
| 2 or 3 toxicities in one patient | 42 (87.5) | 59 (88.1) | 0.93 | 35 (87.5) | 70 (83.3) | 0.55 | ||||||||
| Characteristics | OS | DFS | ||||||||||
|---|---|---|---|---|---|---|---|---|---|---|---|---|
| Univariate | Multivariable | Univariate | Multivariable | |||||||||
| HR | 95% CI | p | HR | 95% CI | p | HR | 95% CI | p | HR | 95% CI | p | |
| Age | 1.01 | [0.98–1.04] | 0.352 | 1.02 | [0.99–1.04] | 0.193 | ||||||
| BMI | 0.95 | [0.89–1] | 0.068 | 0.97 | [0.92–1.02] | 0.182 | ||||||
| WHO PS 2 (vs. 0–1) | 6.15 | [3.12–12.11] | <0.001 | 4.26 | [2.08–8.73] | <0.001 | 6.87 | [3.84–12.3] | <0.001 | 4.14 | [2.19–7.84] | <0.001 |
| Stage III–IV (vs. I–II) | 2.45 | [1.24–4.84] | 0.01 | 1.99 | [0.96–4.12] | 0.065 | 2.14 | [1.22–3.76] | 0.008 | 2.1 | [1.11–3.94] | 0.023 |
| Tumor site | ||||||||||||
| Oropharynx | 1 | |||||||||||
| CUP | 0.64 | [0.19–2.13] | 0.463 | 0.76 | [0.26–2.18] | 0.605 | ||||||
| Oral cavity | 0.92 | [0.47–1.77] | 0.795 | 1.36 | [0.78–2.37] | 0.282 | ||||||
| Hypopharynx | 1.03 | [0.47–2.25] | 0.938 | 1.55 | [0.82–2.96] | 0.18 | ||||||
| Larynx | 1.08 | [0.53–2.18] | 0.829 | 1.13 | [0.59–2.18] | 0.709 | ||||||
| Undernutrition | 4.16 | [1.51–11.5] | 0.006 | 3.44 | [1.39–8.52] | 0.007 | ||||||
| Surgery | 0.75 | [0.45–1.25] | 0.273 | 0.74 | [0.48–1.15] | 0.184 | 0.64 | [0.37–1.09] | 0.099 | |||
| Sarcopenia | 2.52 | [1.51–4.20] | <0.001 | 1.9 | [1.11–3.25] | 0.019 | 2.45 | [1.58–3.78] | <0.001 | 1.7 | [1.06–2.71] | 0.026 |
| p16 Positivity | 0.44 | [0.14–1.39] | 0.161 | 0.42 | [0.15–1.16] | 0.094 | ||||||
| RTCT | 0.8 | [0.49–1.33] | 0.396 | 0.75 | [0.48–1.15] | 0.186 | 0.57 | [0.34–0.96] | 0.036 | |||
| Characteristics/Treatment | RT | RTCT | ||||||||||
|---|---|---|---|---|---|---|---|---|---|---|---|---|
| Univariate | Multivariable | Univariate | Multivariable | |||||||||
| PFS | HR | 95% CI | p | HR | 95% CI | p | HR | 95% CI | p | HR | 95% CI | p |
| Age | 1.03 | [1–1.06] | 0.049 | 0.97 | [0.93–1.02] | 0.238 | 0.96 | [0.91–1] | 0.095 | |||
| BMI | 0.98 | [0.92–1.05] | 0.591 | 0.95 | [0.88–1.03] | 0.201 | ||||||
| WHO PS = 2 | 9.12 | [4.20–19.8] | <0.001 | 5.9 | [2.38–14.61] | <0.001 | 4.94 | [1.91–12.79] | 0.001 | 4.57 | [1.74–11.98] | 0.002 |
| Stage III/IV (vs. I/II) | 1.85 | [0.99–3.49] | 0.056 | 2.27 | [1–5.14] | 0.05 | 8.84 | [1.21–64.41] | 0.032 | 7.49 | [1.02–55.13] | 0.048 |
| Tumor site | ||||||||||||
| Oropharynx | 1 | |||||||||||
| CUP | 1.31 | [0.36–4.72] | 0.679 | 0.33 | [0.04–2.50] | 0.283 | ||||||
| Oral cavity | 1.09 | [0.48–2.43] | 0.843 | 1.72 | [0.79–3.74] | 0.169 | ||||||
| Hypopharynx | 2.5 | [1.03–6.08] | 0.043 | 0.99 | [0.38–2.60] | 1 | ||||||
| Larynx | 1.27 | [0.52–3.06] | 0.599 | 0.92 | [0.33–2.55] | 0.872 | ||||||
| Undernutrition | 3.67 | [1.13–11.9] | 0.03 | 5 | [1.37–18.32] | 0.015 | 3.21 | [0.77–13.39] | 0.109 | |||
| Surgery | 0.49 | [0.26–0.94] | 0.03 | 0.29 | [0.13–0.62] | 0.001 | 0.85 | [0.45–1.61] | 0.617 | |||
| Sarcopenia | 2.94 | [1.60–5.42] | <0.001 | 2.49 | [1.26–4.9] | 0.008 | 1.93 | [1.02–3.67] | 0.044 | |||
| P16 Positivity | 1.02 | [0.24–4.23] | 0.98 | 5.04 | [1.08–23.64] | 0.04 | 0.29 | [0.07–1.23] | 0.093 | |||
| OS | HR | 95% CI | p | HR | 95% CI | p | HR | 95% CI | p | HR | 95% CI | p |
| Age | 1.03 | [0.99–1.07] | 0.13 | 0.97 | [0.92–1.03] | 0.307 | 0.96 | [0.90–1.02] | 0.148 | |||
| BMI | 0.97 | [0.89–1.05] | 0.404 | 0.93 | [0.85–1.02] | 0.112 | ||||||
| WHO PS = 2 | 6.69 | [2.73–16.4] | <0.001 | 4.23 | [1.45–12.33] | 0.008 | 5.15 | [1.76–15.1] | 0.003 | 4.84 | [1.63–14.36] | 0.004 |
| Stage III/IV (vs. I/II) | 2.12 | [0.98–4.59] | 0.057 | 2.69 | [0.94–7.67] | 0.064 | 6.58 | [0.89–48.4] | 0.064 | 5.59 | [0.75–41.65] | 0.092 |
| Tumor site | ||||||||||||
| oropharynx | 1 | 1 | ||||||||||
| CUP | 1.33 | [0.37–4.87] | 0.664 | 0 * | ||||||||
| oral cavity | 0.61 | [0.23–1.61] | 0.319 | 1.36 | [0.55–3.35] | 0.501 | ||||||
| hypopharynx | 1.35 | [0.46–3.99] | 0.585 | 0.8 | [0.26–2.48] | 0.695 | ||||||
| larynx | 1.03 | [0.39–2.72] | 0.947 | 1.06 | [0.37–3.01] | 0.914 | ||||||
| Undernutrition | 6.24 | [1.88–20.7] | 0.003 | 12.25 | [2.93–51.15] | <0.001 | 2.18 | [0.29–16.1] | 0.445 | |||
| Surgery | 0.6 | [0.28–1.31] | 0.2 | 0.4 | [0.15–1.04] | 0.06 | 0.75 | [0.36–1.57] | 0.448 | |||
| Sarcopenia | 2.71 | [1.31–5.59] | 0.007 | 2.24 | [1.03–4.86] | 0.041 | 2.21 | [1.06–4.59] | 0.034 | |||
| P16 Positive | 0.71 | [0.10–5.27] | 0.742 | 0.39 | [0.09–1.64] | 0.198 | ||||||
Publisher’s Note: MDPI stays neutral with regard to jurisdictional claims in published maps and institutional affiliations. |
© 2021 by the authors. Licensee MDPI, Basel, Switzerland. This article is an open access article distributed under the terms and conditions of the Creative Commons Attribution (CC BY) license (http://creativecommons.org/licenses/by/4.0/).
Share and Cite
Thureau, S.; Lebret, L.; Lequesne, J.; Cabourg, M.; Dandoy, S.; Gouley, C.; Lefebvre, L.; Mallet, R.; Mihailescu, S.-D.; Moldovan, C.; et al. Prospective Evaluation of Sarcopenia in Head and Neck Cancer Patients Treated with Radiotherapy or Radiochemotherapy. Cancers 2021, 13, 753. https://doi.org/10.3390/cancers13040753
Thureau S, Lebret L, Lequesne J, Cabourg M, Dandoy S, Gouley C, Lefebvre L, Mallet R, Mihailescu S-D, Moldovan C, et al. Prospective Evaluation of Sarcopenia in Head and Neck Cancer Patients Treated with Radiotherapy or Radiochemotherapy. Cancers. 2021; 13(4):753. https://doi.org/10.3390/cancers13040753
Chicago/Turabian StyleThureau, Sébastien, Lucie Lebret, Justine Lequesne, Marine Cabourg, Simon Dandoy, Céline Gouley, Laureline Lefebvre, Romain Mallet, Sorina-Dana Mihailescu, Cristian Moldovan, and et al. 2021. "Prospective Evaluation of Sarcopenia in Head and Neck Cancer Patients Treated with Radiotherapy or Radiochemotherapy" Cancers 13, no. 4: 753. https://doi.org/10.3390/cancers13040753