Simple Summary
HER2, which is associated with clinically aggressive disease, is overexpressed in 15–20% of breast cancers (BC). Peroxisome proliferator-activated receptor γ (PPARγ), is expressed in a variety of malignancies. The aim of our study was to determine the function of endogenous Pparγ1 in the onset and progression of mammary tumors induced by ErbB2 in mice. Genetic deletion of Pparγ1 slowed the rate of tumor progression and death from ErbB2-induced mammary tumors. The deletion of Pparγ1 correlated with reduced pro-tumorigenic inflammation. We conclude ErbB2 collaborates with endogenous Pparγ1 in the onset and progression of mammary tumorigenesis.
Abstract
HER2, which is associated with clinically aggressive disease, is overexpressed in 15–20% of breast cancers (BC). The host immune system participates in the therapeutic response of HER2+ breast cancer. Identifying genetic programs that participate in ErbB2-induced tumors may provide the rational basis for co-extinction therapeutic approaches. Peroxisome proliferator-activated receptor γ (PPARγ), which is expressed in a variety of malignancies, governs biological functions through transcriptional programs. Herein, genetic deletion of endogenous Pparγ1 restrained mammary tumor progression, lipogenesis, and induced local mammary tumor macrophage infiltration, without affecting other tissue hematopoietic stem cell pools. Endogenous Pparγ1 induced expression of both an EphA2-Amphiregulin and an inflammatory INFγ and Cxcl5 signaling module, that was recapitulated in human breast cancer. Pparγ1 bound directly to growth promoting and proinflammatory target genes in the context of chromatin. We conclude Pparγ1 promotes ErbB2-induced tumor growth and inflammation and represents a relevant target for therapeutic coextinction. Herein, endogenous Pparγ1 promoted ErbB2-mediated mammary tumor onset and progression. PPARγ1 increased expression of an EGF-EphA2 receptor tyrosine kinase module and a cytokine/chemokine 1 transcriptional module. The induction of a pro-tumorigenic inflammatory state by Pparγ1 may provide the rationale for complementary coextinction programs in ErbB2 tumors.
1. Introduction
ErbB2 is overexpressed in approximately 25% of human breast cancers, associated with clinically aggressive disease [1]. No soluble ligand has been identified and the receptor is regulated by heterodimerization with other ErbB family receptors, including EGFR, and other receptor tyrosine kinases including EphA2 [2]. EGFR is activated by seven different growth factors including EGF and Amphiregulin [3]. Downstream signaling modules required for ErbB2 induced tumorigenesis in genetically engineered mouse models (GEMM) include the phosphatidylinositol 3-kinase/Akt (PKB) pathway [4], the Ras/Raf/MEK/ERK1/2 pathway and the phospholipase C (PLCγ) pathways [5]. ErbB2-mediated tumorigenesis involves [2,6] activation of receptor tyrosine kinases [5,7], induction of cyclin D1/CDK activity [8], and functional restraint by tumor suppressors [9,10,11]. The receptor tyrosine kinase EPH receptor A2 (EphA2), a member of the Eph RTK family, is overexpressed in aggressive breast cancer and EphA2 forms a complex with ErbB2 thereby enhancing ErbB2-induced tumor onset and progression [7].
HER2-targeted breast cancer treatments, include monoclonal antibodies (trastuzumab, pertuzumab), tyrosine kinase inhibitors (lapatinib, neratinib), and antibody–drug conjugates (Ado-trastuzumab emtansine [T-DM1]) [12,13,14,15]. Herceptin and the dual tyrosine kinase inhibitor Lapatanib, have resulted in dramatic improvements in survival [16], conveyed through both direct and indirect effects which involve anti-tumor immunity [17,18,19]. HER2+ breast cancers have higher stromal tumor-infiltrating lymphocytes (TILs) levels than hormone receptor positive (HR+)/HER2- breast cancers, correlating with better prognosis [18,20]. HER2-enriched breast cancers are more immunogenic than others (Luminal A/B [21]. As nearly all patients with metastatic Her2-positive breast cancer will progress on treatment it is essential to develop coextinction approaches targeting multiple pathways. The identification of endogenous target genes governing tumor metabolism and inflammation is essential in order to provide a rational approach to extinguishing multiple pathways activated in cancer [22].
The activation of oncogenic signals, downregulation of tumor suppressor pathways, metabolic changes and alterations in the tumor microenvironment, including immune cells, contribute to tumor progression [22,23,24]. The tumor microenvironment (TME) is regulated by chemokines and their G protein coupled receptors binds several ligands, including Cxcl5 which binds Cxcr2, to augment the pro-tumor immune response [25,26], tumor growth and metastasis [27,28]. In this regard, Cxcr2 plays an important role in governing the pro-inflammatory response in mammary tumors inducing the proportion of Gr1+ tumor-associated granulocytes, F4/80+ tumor-associated macrophages, and CD11b+ Gr1+ myeloid derived suppressor cells (MDSC) [26]. Tumor-associated macrophages (TAM), which promote tumorigenesis [29], arise primarily from the Ly6C+ population of circulating mouse monocytes from the bone marrow [30,31], with a smaller proportion from the spleen [32]. Clinical studies and experimental mouse models indicate that F4/80+ macrophages play a pro-tumoral role [33,34,35].
Recent studies have suggested an association between Peroxisome proliferator-activated receptor γ (PPARγ) signaling and lapatinib-resistant breast cancer. PPARγ is a member of the nuclear receptor (NR) superfamily that regulates diverse biological functions including lipogenesis and differentiation, inflammation, insulin sensitivity, cellular proliferation and autophagy [36,37,38,39]. Evidence for PPARγ as a tumor growth inhibitor includes the detection of heterozygous PPARγ mutations in colon cancer and the finding that PPARγ agonists reduce tumorigenesis in murine models [40,41,42]. In contrast several lines of evidence suggest PPARγ augments growth as PPARγ ligands increased gastrointestinal polyp number in the Apc mouse model of familial adenomatosis [43]. Although the preponderance of studies demonstrated PPARγ restrains inflammation [44,45], the impact on anti-tumor immune responses and the role for endogenous Pparγ in promoting local tissue and disease-specific inflammatory processes appears to be more complex as a pro-inflammatory effect of Pparγ [46], the induction of tissue specific pools of macrophages [47] have been described. Furthermore, studies that deployed ER-Hoxb8-immortalized bone marrow-derived macrophages from Pparγ-and LysM-Cre Ppar fl/fmice, showed loss of Pparγ resulted in reduced F4/80+ macrophages [46]. Although Pparγ has been implicated in the regulation of cellular growth, the role of endogenous Pparγ1 in the growth of mammary tumors and the impact on the anti-tumor immune response was not previously known. In order to determine the role of endogenous Pparγ1 in mammary tumorigenesis the Pparγ1 gene was deleted in mammary targeted ErbB2 transgenic mice.
2. Results
2.1. Deletion of Endogenous PPARγ1 Reduces ErbB2-Induced Mammary Tumor Growth
Previous studies demonstrated that PPARγ may either enhance or inhibit tumor growth depending upon the tumor type and oncogenic driver [40,41,42,43]. In order to define the role of endogenous Pparγ1 in the onset and growth of ErbB2-induced mammary tumorigenesis in an immune-competent context in vivo, we generated multigenic mice in which the Pparγ1 exon 2 alleles were flanked by LoxP sites and the induction of Cre recombinase was governed through the addition of Tamoxifen (TMX) (Rosa26ERT2Cre) with the mT/mG transgenic reporter (The mT/mG transgenic reporter mouse cells that have not undergone recombination express membrane-targeted tdTomato (mT), but after recombination they express membrane-targeted enhanced green fluorescent protein (EGFP)). These mice were intercrossed with the transgenic mammary gland oncomouse MMTV-ErbB2 (Figure 1A) in order to generate transgenic mice, Pparγ1fl/flCreERT2+mTmG+MMTV-ErbB2+ (Pparγ1−/−), and the control mice, Pparγ1wt/wtCreERT2+mTmG+MMTV-ErbB2+(Pparγ1+/+). The multigenic offspring were treated with a 5 days pulse of Tamoxifen (Figure 1B and S2A), which was sufficient to induce Cre expression, deletion of the target gene and conversion of the tdTomato expressing mammary epithelium to EGFP (Figure 1C). Tumor formation was compared between the transgenic mice (Pparγ1−/− vs. Pparγ1+/+) treated with Tamoxifen with analysis conducted over the subsequent 6 months (Figure 1D). Statistical analysis demonstrated that the rate of MMTV-ErbB2 induced mammary tumor onset was delayed in mice in which the Pparγ1 gene had been deleted through Cre recombinase (by the log-rank test, p = 0.043; by Wilcoxon rank-sum test, p = 0.028 or by the Tarone-Ware test, p = 0.033) (Table S1). The potential independent effect of Tamoxifen on mammary tumor rate was controlled for, as each line received identical exposure to tamoxifen. Growth rate of established ErbB2 mammary tumors upon Cre-mediated deletion of Pparγ1 was determined as well. Tumor volumes in MMTV-ErbB2, ROSA26CreERT2/mTmG mice that were either Pparγ1+/+ or Pparγ1−/− were showed in Figure S2B (n = 4 of each genotype). The estimated tumor growth rate for each group was calculated based on the mixed effects models and showed in Table S2. The results showed that tumor growth in Pparγ1−/− mice was slower than in Pparγ1+/+ mice.
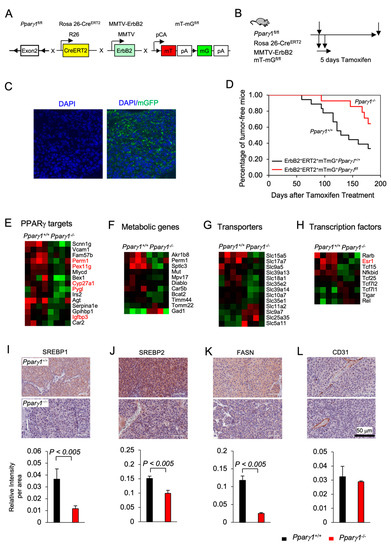
Figure 1.
Pparγ1 collaborates in ErbB2-induced mammary adenocarcinoma, promoting Pparγ1 signaling. (A). Schematic representation of the multigenic mice treatment used to induce Cre excision from the ROSA26 locus using (B). 5 days of tamoxifen treatment. (C). Representative example of mammary gland tumors showing transgenic fluorescent of GFP reflecting Cre excision. (D). Kaplan-Meier curves displaying the onset of tumorigenesis. Data are shown as percentage of tumor free mice. Comparison is made of the Pparγ1fl/flCreERT2+mTmG+MMTV-ErbB2 (Pparγ1−/−) and the Pparγ1wt/wtCreERT2+mTmG+MMTV-ErbB2 (Pparγ1+/+) transgenic mice treated with Tamoxifen for 5 days. (E). Statistical analysis of the difference in tumor onset rates between the transgenic mice. (F–I). Gene expression derived by RNA-seq from tumors of ErbB2 mammary OncoMice with inducible Pparγ1 deletion showing mean-fold change in levels of expression. Data is shown by functional categories for individual mice tumors as color display with red for increased levels of expression and blue for reduced levels of expression in Pparγ1+/+ vs. Pparγ1−/− mammary tumors. (J–L). Representative staining of tumors derived from the transgenic mice with quantitation for SREBP1, SREBP2, FASN, and CD31 with quantitation shown as mean ± SEM for n = 3 separate mice for each genotype.
In order to determine the molecular mechanisms by which Pparγ1 maintained ErbB2 mammary tumors, analysis of RNA-seq based gene expression derived from the Pparγ1−/− vs. Pparγ1+/+ mammary tumors was conducted, revealing deletion of endogenous Pparγ1 changed substantially (up to 24-fold) the levels of gene expression (Figure S1A), with reduced expression of Pparγ1-responsive genes (PERM1, (Peroxisome Proliferator-Activated Receptor Gamma Coactivator 1 And Estrogen-Related Receptor-Induced Regulator In Muscle 1), PEX11G (Peroxisomal Biogenesis Factor 11 Gamma), Cyp27A1 and Pygl1 (glycogen phosphorylase1 (Figure 1E), and reduced lipogenic and metabolic genes (Figure 1F). Consistent with reduced anabolism and lipogenesis Pparγ1−/− ErbB2 tumors showed reduced expression of anabolic solute carriers (Figure 1G) and reduced expression of growth promoting transcription factors including reduced nuclear receptors Esr1 (ERα), Tcf25, and Tcf15 (Figure 1H). The abundance of key enzymes required for de novo lipogenesis, including sterol regulatory element-binding protein (SREBP1, SREBP2) and fatty acid synthase (FASN) was reduced in Pparγ1−/− vs. Pparγ1+/+ ErbB2 mammary tumors (Figure 1I–K and Figure S1B). CD31 (cluster of differentiation 31) expression was not significantly changed in endothelial cells (Figure 1L).
The MCF10A-NeuT-PPARγ1 cells showed reduced transwell migration compared with vector control. In order to determine the role of PPARγ1 in ErbB2 induced growth in xenografts, MCF10A-NeuT cells were transduced with PPARγ1 or vector control as indicated in Figure S2D. 5 × 10⁶ cells were implanted into the mammary fat pad of immune-deficient nude mice. Tumor growth, measured at 20 days by digital caliper, showed a substantial increase in tumor volume (Figure S2E, Data are shown as mean ± SEM for n = 13).
2.2. Pparγ1 Augments an EphA2-amphiregulin Growth Gactor Signaling Module
Ki-67 staining, a marker of cellular proliferation, demonstrated an increased percentage of Ki-67+ staining cells in the Pparγ1+/+ ErbB2 mammary adenocarcinoma (Figure 2A,B). Pathway analysis showed Pparγ1 augmented the activity of an Eph receptor node and a protein tyrosine kinase node, which in turn activated atypical PKC, Neu3 and ADAM12, whereas FGFR2 signaling was restrained (Figure 2C). RNA-seq identified the induction of a growth factor module regulators including EGF, Amphiregulin, IRS2, AngP2, CXCl5, and SDF2l1 (Figure 2D). The abundance of mRNA encoding growth factors known to enhance ErbB2 signaling, including Egf, Amphiregulin, EphA2, and Adam12 was increased (Figure 2D). ADAM12 (a disintegrin and metalloproteinase 12), is linked to the induction of EphA2-dependent cell migration [48]. EphA2, which is known to augment ErbB2-induced mammary tumorigenesis [7], was increased 4-fold in the Pparγ1+/+ ErbB2 mammary tumors (Figure 2E). EphB6 signaling, known to suppress breast cancer cell aggressiveness by interacting with EPHB4 and interfering with EPHB4 action [49], was repressed by Pparγ1 in ErbB2 mammary tumors (Figure 2F). In order to examine further the relationship between Pparγ and the abundance of the growth factors maintained by endogenous Pparγ1 in the murine mammary tumors, we interrogated a public database (https://www.cbioportal.org/study/summary?id=brca_mbcproject_wagle_2017 (accessed on 2–15 December 2020)) in which mRNA expression of breast cancer samples had been determined. These analysis revealed a significant correlation in human metastatic breast cancer between Pparγ1 and the key growth factors identified (Figure 2G–M), including MAPK3K6 (n = 136, Pearson 0.50, p = 1.96 × 10⁻¹⁰), IRS2 (n = 136, Pearson 0.26, p = 1.27 × 10⁻³), MMP16 (n = 136, Pearson 0.42, p = 9.77 × 10⁻⁸), ANGPT13 (n = 136, Pearson 0.20, p = 3.3 × 10⁻⁴), ADAM12 (n = 136, Pearson 0.52, p = 1.62 × 10⁻¹¹), EGFR (n = 136, Pearson 0.53, p = 1 × 10⁻¹¹) and EphA2 (n = 136, p = 3.1 × 10⁻³, Pearson, 0.24). EphA2 abundance, assessed by immunohistochemistry, was increased approximately 5-fold (Figure 2N,O). Collectively these studies are consistent with a model in which endogenous Pparγ1 maintains the abundance of a growth promoting module (ADAM12, EGFR, EphA2), each component of which is known to enhance ErbB2 function.
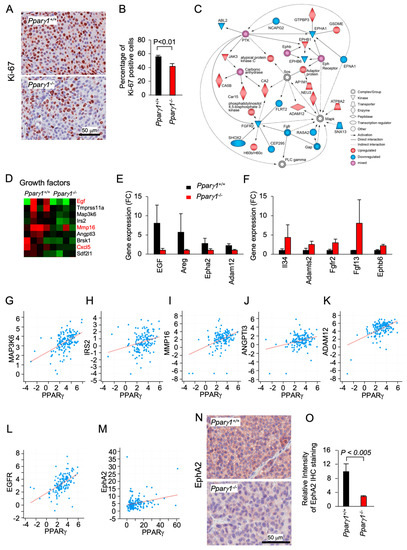
Figure 2.
Pparγ induction of EphA2-Areg growth factor signaling in ErbB2-induced mammary adenocarcinoma. The ErbB2 adenocarcinoma were analyzed for (A). Ki-67 by immunohistochemical staining with (B) quantitation as mean + SEM from n = 5 separate mice (p < 0.01). (C). IPA pathway analysis identified a gene interaction network with upregulation (red) of signaling nodes for PTK (protein tyrosine kinase), SOS and Eph receptor, with down-regulation (blue) for Fgfr2 and Fgfr. (D). RNA-seq expression for genes within the “growth factors” KEGG category shown as a heat map display or (E,F). as mean ± SEM for n = 8 mice. (G–M). Correlative gene expression analysis in breast cancer samples (The Metastatic Breast Cancer Project (Provisional, February 2020) between Pparγ and growth factors identified in (D). Data are shown for correlation between Pparγ and MAPK3K6 (n = 136, Pearson 0.50, p = 1.96 × 10⁻¹⁰), IRS2 (n = 136, Pearson 0.26, p = 1.27 × 10⁻³), MMP16 (n = 136, Pearson 0.42, p = 9.77 × 10⁻⁸), ANGPT13 (n = 136, Pearson 0.20, p = 3.3 × 10⁻⁴), ADAM12 (n = 136, Pearson 0.52, p = 1.62 × 10⁻¹¹), EGFR (n = 136, Pearson 0.53, p = 1 × 10⁻¹¹) and EphA2 (n = 136, p = 3.1 × 10⁻³, Pearson, 0.24). (N,O). Representative Immunohistochemical staining for EphA2 shown as (O). mean ± SEM for n = 8 mice.
2.3. Pparγ1 Governs the Mammary Tumor Immune Response
In order to determine the signal transduction pathways maintained by Pparγ1 in the ErbB2 mammary tumors, we conducted Kyoto Encyclopedia of Genes and Genomes (KEGG) pathway analysis of RNA-seq from the tumors. Deletion of Pparγ1 reduced activity of the pathways “cytokines/chemokine receptors signaling” and the related “Graft versus Host disease”, “NOD-like receptor signaling” and “NFκB signaling” (Figure 3A). Analysis of significantly affected genes by Ingenuity Pathway Analysis (IPA) identified potentially altered upstream regulators related to cancer and the inflammatory response. INFγ-induced genes were decreased by deletion of endogenous Pparγ1 (Figure 3B,C), consistent with the known induction of Interferons (IFNs) and IFN-stimulated genes by peroxisomes [50,51]. Pparγ1+/+ ErbB2 mammary tumors showed increased expression of specific chemokines and cytokines (Cxcl5, Cxcl19, Cxcl13, IL1b and Tnfrsf13c (Figure 3D)). As IFNG and IL6 were the most induced by number of genes and Z score (circled in Figure 3C), we examined the relationship between Pparγ and IFNG and IL6 in mRNA expression data from The Metastatic Breast Cancer Project (Provisional, February 2020) (Figure 3E,F). These analyses revealed a significant correlation in human metastatic breast cancer between Pparγ and IFNGR1 (n = 136, Pearson 0.57, p = 17.13 × 10⁻¹⁴), and with IL6 (n = 136, Pearson 0.55, p = 6.1 × 10⁻¹³). The F4/80+ marker of murine tissue associated macrophages (TAM) confirmed a significantly increased proportion in the Pparγ1+/+ tumor population within both the tumor and the tumor stroma (Figure 3G,H). Collectively these findings are consistent with a model in which endogenous Pparγ1 maintains an inflammatory tumor microenvironment that includes an increase in F4/80+ macrophages.
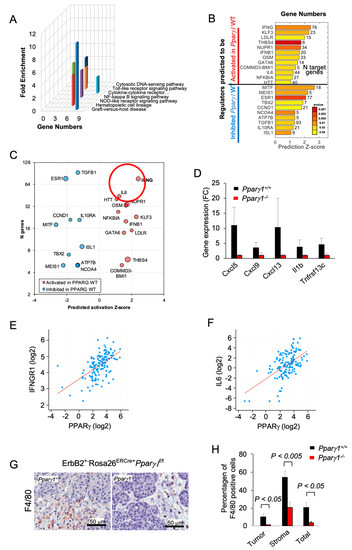
Figure 3.
Deletion of Pparγ1 in MMTV-ErbB2 mammary tumors reduces gene expression of signaling via cytokine/chemokine and growth factor pathways. (A). KEGG pathway analysis gene expression from tumors of ErbB2 mammary GEMM with inducible Pparγ1 deletion showing mean-fold change in levels of expression. (B,C). Ingenuity Pathway Analysis (IPA) performed for mammary tumors using “Upstream Regulators” option. The results show regulators with a significant number of changed known targets and Z-score for the predicted change of the regulator’s activation state. In (B) Z-scores are shown as bars with p-values shown in color scale from red (best p-value) to yellow. In (C) results are represented by bubble plot of Z-scores vs. Number of genes (n) with size proportional to log10(p-value) and color indicating predicted increased (red) or decreased (blue) activity of the regulators in Pparγ1+/+ vs. Pparγ1−/− mammary tumors. Lower p-values are related to a more significant of number of changed targets of a regulator, and a higher Z-score indicates a better evidence of activation or inhibition of regulator’s activity based on the targets direction of change. (D). Gene expression for cytokines/chemokines upregulated by Pparγ1 from KEGG analysis. (E,F). Correlative gene expression analysis in breast cancer samples from The Metastatic Breast Cancer Project (Provisional, February 2020) between Pparγ and IFNG and IL-6 identified in (C). Correlation between PPARγ expression and expression of IFNGR1 (n = 136, Pearson 0.57, p = 17.13 × 10⁻¹⁴), and IL6 (n = 136, Pearson 0.55, p = 6.1 × 10⁻¹³) is highly significant. (G). Immunohistochemical staining for the tissue-associated macrophages with F4/80. (H). with data shown as mean ± SEM for n = 6 separate tumors.
2.4. Pparγ1 in B Cell Differentiation
TAM can be recruited from inflammatory monocytes, tissue generated macrophages [52,53], and can be generated from Pre/proB cells during inflammation [54]. These monocytes are derived from primarily the bone marrow and also the spleen [32,55]. In order to determine whether the changes in the tumor immune environment were a function of Pparγ1 on the hematopoietic system, we conducted a detailed analysis of the hematopoietic cell system. The hematocrit (HCT), counts of white blood cells (WBC), red blood cells and platelets were not significantly changed (Figure S3A–D). The proportion of WBC subtypes in the peripheral blood were unchanged (Figure S3E). The F4/80+ macrophage and Mac1+Gr1− cellularity counts in the bone marrow, blood and spleen and were unchanged (Figure S3F,G). The spleen showed a modest by significant increase in the percentage of Mac1+Gr1+ granulocytes (Figure S3H).
Subsorting for the proportion of ProB, PreB, immature and mature B cells in the bone marrow did not show significant differences between Pparγ1 genotypes (Figure 4A,B). Analysis of the B-cell lineage in the spleen showed a decrease in the proportion of mature splenic B cells in Pparγ1−/− mice (B220hiCD19+) (54.7 vs. 45.7, p < 0.05, Figure 4C, n = 10 total mice). There was no significant change in the CD4−CD8+ T cell compartment (Figure S4).
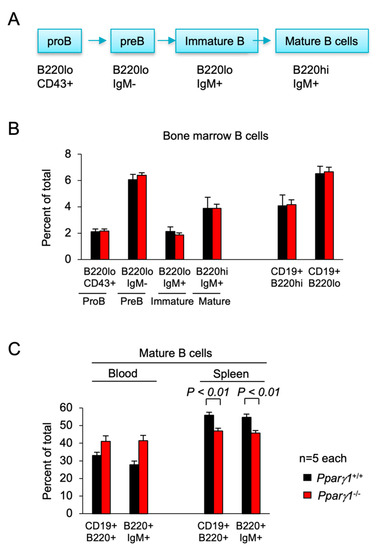
Figure 4.
B cell differentiation in Pparγ1+/+ vs. Pparγ1−/− multigenic mice. (A). Schematic representation of lineage differentiation from pro B cells to mature B cells. (B). Lineage indices of Pparγ1+/+ vs. Pparγ1−/− multigenic mice (Pparγ1wt/wt, vs. Pparγ1fl/fl, both in ROSA26CreERT2, Rosa26mTmG and MMTV-ErbB2 background and treated with tamoxifen) with relative distribution of B cell lineage components in the bone marrow (BM). Relative proportion of Pro-B, Pre-B, Immature B cells, and Mature B cells (B220highIgM+) are shown. (C). The proportion of Mature B cells are shown for the blood and spleen. Data are represented as mean ± SEM. n = 10 total.
2.5. Pparγ1 Does Not Influence Hematopoietic Stem Cell Population (HSC) Differentiation
Given the small but significant reduction in the mature B cell population, we assessed the impact of Pparγ1 on the hematopoietic stem cell population (HSC). In the adult mouse, all multipotent cells are contained in the Lineage−/lowSca-1+c-Kit+ (LSK) fraction of bone marrow cells, which was similar between Pparγ1 genotypes (Figure 5A). Assays using flow cytometry to quantify HSPC (Flk2/CD34) demonstrated that HSPCs were unaltered although there was a trend towards a reduction in the Flk2−CD34+ (ST-HSC or short term HSC) population in Pparγ1−/− (Figure 5B,C). The distribution of LSK CD34−Flk2− (representing long term-HSC) and LSK CD34+Flk2+ multipotent progenitors (MPP) (Figure 5B,C) was unchanged.
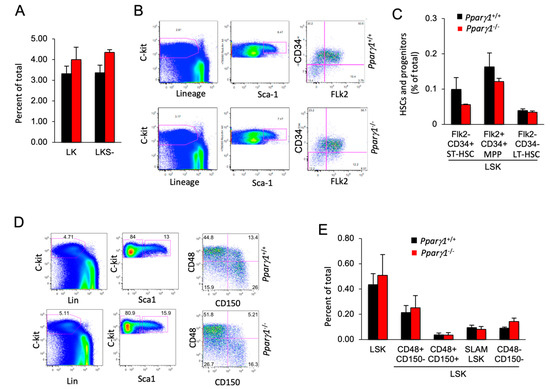
Figure 5.
Hematopoietic stem cell (HSC) distribution of LT-HSC and ST-HSC is unchanged in Pparγ1+/+ vs. Pparγ1−/− multigenic mice. (A). the LK and LKS− are shown as a percent of total as mean ± SEM. (B). Relative distribution of HSC lineage components, using c-Kit, Sca-1 and Flk2 shown as representative FACS analysis. (C). HSC lineage proportion of LSK cells shown for proportion of Flk2/CD34 as mean ± SEM. (D). Representative FACS plots for the HSC and progenitor markers with antibodies to c-Kit, Lin, Sca-1, CD48/CD150. (E). Relative distribution of LT-HSC lineage components (LSK/CD48/CD150) shown as mean ± SEM for n = 10 total.
SLAM family markers, CD150, CD48, CD229, and CD244, can distinguish HSCs and MPPs from restricted progenitors and subdivide them into a hierarchy of functionally distinct subpopulations with stepwise changes in cell-cycle status, self-renewal, and reconstituting potential [56]. The frequency of hematopoietic stem cells and progenitors (HSPCs) assessed by SLAM markers (LSK CD150/CD48) (Figure 5D,E), was unchanged. A quantification of colony forming progenitors and colony subtypes types (M, G, GM, GEMM; (granulocyte (G), erythrocyte, monocyte, megakaryocyte)) [57] demonstrated Pparγ1+/+ did not affect colony forming ability (Figure S5A,B). As Pparγ did not increase the proportion of F4/80+ macrophages in the bone marrow, blood or spleen, these studies suggest the reduction in tumor-associated F4/80+ macrophages within the ErbB2 Pparγ1−/− mammary tumors is not due to a Pparγ1-mediated alteration in hematopoietic precursors in the bone marrow or the circulation.
2.6. Pparγ1 Binds in Chromatin Immune Precipitation Assays to the Regulatory Regions of the EphA-Amphiregulin and the Chemokine Signaling Axis Genes in Breast Cancer Cells
ChIP-Seq was used to define the genome-wide DNA sequence-specific binding characteristics regulated by Pparγ1 in breast cancer cells. High confidence Pparγ1 ChIP-Seq peaks were identified in MCF10A-NeuT cells expressing Pparγ1 Wt. Analysis of the ChIP-Seq data (Figure 6A) demonstrated 13,488 genes were selectively bound by Pparγ1 Wt as defined by the limits of within 10 kb upstream of the transcriptional start site (TSS), 10 kb downstream of the TES and binding within the gene. We next compared the position of ChIP-Seq peaks relative to gene transcription start site and evaluated the number of binding peaks at decreasing intervals upstream from the transcription start site as indicated (Figure 6B). We then determined by ChIP-Seq analysis the binding of PPARγ1 to the regulatory regions of genes involved in both the growth factor induced module and the inflammatory module. Given the induction by Pparγ1 of EphA2, Amphiregulin, Adam12 in the mammary tumors we sought to determine whether PPARγ1 directly interacted in the context of chromatin with these target genes. We first examined the known Pparγ1 target pyruvate dehydrogenase kinase 4 (PDK4) [58] the expression of which is known to regulate de novo lipogenesis. PPARγ1 was enriched in the PDK4 ChIP (Figure 6C). Furthermore PPARγ1 was enriched in the EPHA2, AREG, ADAMTS, ADAM12 and the IL34 and IL1B ChIP (Figure 6D–I).
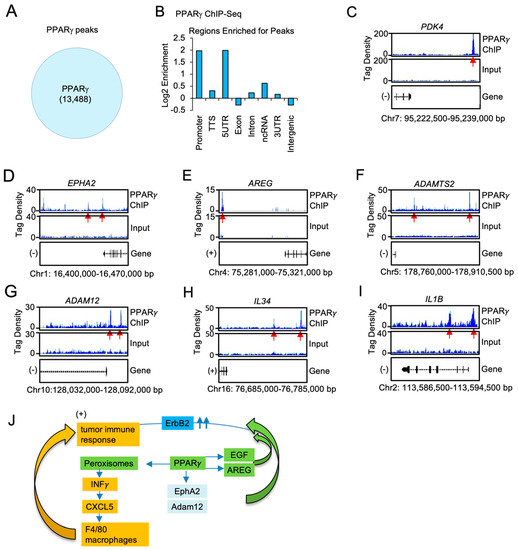
Figure 6.
PPARγ1 binding in chromatin to growth factor and cytokine/chemokine signaling module genes, in ErbB2 mammary tumors. (A). ChIP-Seq analysis was performed on samples derived from MCF10A-NeuT transduced with PPARγ Wt and peak calling defined by MACS2 software is shown in the Venn diagram. (B). Distribution of PPARγ Wt peaks relative to the TSS. The region upstream from the TSS was divided as indicated. (C). Integrated genome browser visualization of tag density profiles for ChIP-Seq PPARγ Wt of selected genes in the PPARγ1 target gene (PDK4), (D–G). the growth module EphA2, Amphiregulin, ADAM12, ADAMTS2 and (H,I), the interferon/cytokine module of IL1B, IL34. (J). Schematic representation of model in which PPARγ1 determines binding to cytokine/chemokine and growth factor genes.
3. Discussion
The current studies extend our understanding of Her2-function by identifying the critical role for Pparγ1 in mediating ErbB2-mammary tumor progression in vivo. Using tetra-transgenic inducible, gene deletion mice, we show that the Pparγ1 gene is required for the progression of ErbB2-induced mammary tumorigenesis in immune competent mice. Second, Pparγ1 gene deletion reduced the expression of genes within signaling pathways mediating growth, including growth factors and growth factor receptors (EphA2, EGF, Amphiregulin, Adam12) (Figure 6J). Third, Pparγ1 gene deletion reduced the influx of an F4/80+ macrophage inflammatory infiltrate into the mammary tumors, without affecting hematopoietic cell differentiation. The immune infiltration of the ErbB2 tumors was associated with the induction of lipogenesis, peroxisome signaling, INFγ and Cxcl5 [59]. Collectively these studies suggest Pparγ1 may represent a useful target for coextinction strategies of ErbB2 induced breast cancer.
Previous studies had shown that PPARγ activation by ligands or overexpression may either enhance or inhibit tumor growth depending upon the tumor type and oncogenic driver [40,41,42,43,60,61,62]. Herein, deletion of endogenous Pparγ1 reduced ErbB2-induced mammary tumors. PPARγ antagonists include GW9662 (2-chloro-5-nitro-N-phenylbenzamide) [63], 2-bromo-5-nitro-N-phenylbenzamide [64] and the structurally similar T0070907 [65]. GW9662 and T0070907 have also been reported to produce off-target effects in vitro [66,67,68]. The partial PPARγ agonists include GW0072 [69] and L-764406 [70]. The current studies are consistent with prior studies using GW9662. Mammary carcinogenesis induced by treatment with medroxyprogesterone and dimethylbenz(a)anthracene (DMBA) are ERα-responsive tumors. Continuous administration of GW9662 in the diet enhanced susceptibility to fulvestrant therapy with a marked increase in survival and a reduction in tumor number in the animals maintained on GW9662 and treated with fuvestrant [71].
Pparγ1 deletion reduced expression of Pparγ1 target genes, genes governing growth factor signaling pathways (EGF, IRS2, AngP2, CXCl5, SDF2), transcription factors that promote breast tumor growth including nuclear receptors and anabolic solute carriers (Slc25a35 (oxaloacetate carrier), Slc39a13, Slc39a14, Slc15a5, Slc18a1, Slc17a7) which may participate in cellular growth [72]. The induction of EGF, EphA2 and ADAM12 are known to augment ErbB2-induced tumorigenesis (Figure 6J). EGF is known to enhance ErbB2 signaling via the EGFR/ErbB2 heterodimer [73]. Endogenous Pparγ1 enhanced EphA2 mRNA and protein abundance in the ErbB2 adenocarcinoma. EphA2 is known to enhance ErbB2-induced mammary adenocarcinoma [5,7]. Co-expression of ErbB2 and EphA2 is sufficient to induce tyrosine phosphorylation of EphA2 in the absence of ligand and EphA2 [5,7]. A disintegrin and metalloproteases (ADAMs) are transmembrane metalloproteases that process and shed the ectodomains of membrane-anchored growth factors, cytokines and receptors [74]. ADAM12 is linked to the induction of EphA2-dependent cell migration in metastatic tumors [48]. The membrane type-I matrix metalloproteinase (MT1-MMP) also promotes cancer cell migration and invasion via EphA2 receptor cleavage [75] ADAM12 modulates intracellular signaling by cleaving various membrane bound signaling receptors and their ligands. ADAM12 is highly expressed in glioblastoma multiforme, where it is linked to shedding of HB-EGF. cancer cell invasion, including ADAMs (as reviewed above), and interestingly, ADAM12 [48], and MMP2 and 9 [76] are all upregulated by TGF-β1 signaling in tumor metastasis. ADAM12, ephrin-A1, and EphA2-contribute to growth or cell migration in primary and metastatic tumors [48,77,78].
In order to determine the molecular mechanisms by which Pparγ1 enhanced ErbB2-mediated mammary tumorigenesis tissue culture-based experiments were conducted to examine cell autonomous function. MCF10A-ErbB2-PPARγ1 cells displayed reduced transwell migration compared with vector control. These findings suggest that a cell autonomous effect on migration does not contribute to the tumorigenic phenotype. Prior experiments had supported a model in which Pparγ1 mediated cell non autonomous functions through the induction of secreted factors that promoted angiogenesis [79]. Herein, endogenous Pparγ1 enhanced tumorigenic inflammation. First, Infiltration of F4/80+ macrophages into the mammary tumors of transgenic mice, which are known to augment ErbB2-induced tumor progression [80,81], was reduced by Pparγ1 deletion. EGF, which was increased upon Pparγ1 gene deletion, is known to augment a feedforward loop within the TME to enhance TAM recruitment [33,34,35]. Interferon signaling (INFγ1, INFβ1), was augmented by endogenous Pparγ1. IPA analysis identified interferon signaling as a predominant pathway induced by Pparγ1. Peroxisomes induced by Pparγ1, activate Type1 interferons (IFNs) and IFN-stimulated gene expression [50,51], including Cxcl5 and Cxcl9. Peroxisome proliferation requires PEX11-type peroxisomal proliferators [82] and herein, endogenous Pparγ1 induced peroxisomal target genes in the mammary tumors as evidenced by increased expression of PEX-11, together with PPARGC1 and ESRR induced regulator, muscle 1, PGC-1 and ERR-induced regulator in muscle 1 (Perm1). Cxcl5 is a key local cue that recruits tumor associated macrophages (TAMs), which in turn promote a pro-tumorigenic environment [26,52,53]. CXCL9 which may also be pro-tumorigenic [59], is upregulated during BCa therapy [83] and participates in augmenting the response to cancer therapy with checkpoint blockade [84]. IL-1b [85,86] and IL34, which were induced by Pparγ1 are also known to induce a pro-tumorigenic tumor microenvironment (TME) with IL-34 enhancing recruitment and survival of TAM [87].
In order to determine potential mechanisms by which Pparγ1 coordinated the induction of growth factor and cytokine/chemokine signaling in ErbB2 tumors, we conducted genome wide PPARγ1 chromatin binding assays in human mammary adenocarcinoma cells. The expression of genes governing growth factor (EphA2, amphiregulin, Adam12, AdamTS2) and a chemokine module (CXCL5, IL1B,IL34, TNFRSF13C), were induced by PPARγ1 and bound in ChIP to target regions within the genes. PPARγ1 ChIP analysis in MCF10A-NeuT mammary tumors showed the number of sites bound by PPARγ1 Wt including all cis elements was comparable to the ~23,000 and ~21,000 sites identified in human adipocyte cell lines [88], but fewer than the ~40,000 sites identified in primary in vitro differentiated human adipose derived stem cells. In adipocytes, C/EBPs co-localizes with PPARγ1 at the majority of its binding sites and cooperate in target gene transcription [88,89], whereas in macrophages, PPARγ1 ChIP is enriched with the hematopoietic transcription factor PU.1 [90]. Collectively these findings are consistent with a model in which Pparγ1 promotes the expression of gene governing lipogenesis, mammary tumor growth and a local tumor immune response. Pparγ1 should be considered further for coextinction paradigms in ErbB2-mediated adenocarcinoma.
4. Materials and Methods
4.1. Transgenic Mice
Mice were kept on a 12 h light/dark cycle with ad libitum access to chow and water. The Pparγ1fl/fl mice (which remove exon 2 of the Pparγ1 locus [91]), ROSA26CreERT2 mice (Expressing CRE-ERT2 fusion protein under the control of the ubiquitous ROSA26 promoter. Cre-ERT2 fusion protein will bind with tamoxifen and then transport to nucleus to induce the deletion of floxed alleles [92]) and ROSA26mTmG mice [93] (ROSA26mTmG is a cell membrane-targeted, two-color fluorescent Cre-reporter allele. Prior to Cre recombination, tdTomato (mT) red fluorescence will be expressed. Followed Cre recombination, instead of the red fluorescence, cell membrane-localized EGFP (mG) fluorescence will be expressed) (Stock No. 007576, The Jackson Laboratory, Bar Harbor, ME, USA) [93] were previously described. Mice homozygous for a floxed Pparγ1 allele were mated with ether ROSA26CreERT2/CreERT2 or ROSA26mTmG/mTmG mice. Due to the fact both Pparγ1 and Rosa26 localized in the same chromosome, recombinant Pparγ1fl-ROSA26CreERT2 and Pparγ1fl-ROSA26mTmG mice were generated. Pparγ1fl-ROSA26CreERT2, Pparγ1fl-ROSA26mTmG, Pparγ1wt-ROSA26CreERT2 and Pparγ1wt-ROSA26mTmG mice were then mated with MMTV-ErbB2 transgenic mice [8,9] to generate Pparγ1fl-ROSA26CreERT2MMTV-ErbB2, Pparγ1fl-ROSA26mTmGMMTV-ErbB2, Pparγ1wt-ROSA26CreERT2MMTV-ErbB2 and Pparγ1wt-ROSA26mTmGMMTV-ErbB2 mice. Pparγ1fl-ROSA26CreERT2Pparγ1fl-ROSA26mTmGMMTV-ErbB2 (Pparγ1fl/flCreERT2+mTmG+MMTV-ErbB2+) and Pparγ1wt-ROSA26CreERT2Pparγ1wt-ROSA26mTmGMMTV-ErbB2 (Pparγ1wt/wtCreERT2+mTmG+MMTV-ErbB2+) mice were obtained by cross Pparγ1fl-ROSA26CreERT2MMTV-ErbB2 with Pparγ1fl-ROSA26mTmGMMTV-ErbB2 or Pparγ1wt-ROSA26CreERT2MMTV-ErbB2 with Pparγ1wt-ROSA26mTmGMMTV-ErbB2 mice. The deletion of Pparγ1 exon 2 in Pparγ1fl/flCreERT2+mTmG+MMTV-ErbB2+ mice was induced by intraperitoneal injection of tamoxifen with 75 mg/kg/day for 5 days in 6 weeks-old female mice. The extent of deletion was assessed by PCR-based DNA analysis. Pparγ1wt/wtCreERT2+mTmG+MMTV-ErbB2+ mice were used as control for the potential effect of tamoxifen on mammary gland development and gene expression [94].
4.2. Statistics
All means were compared using two-tailed Student’s t-test. A p value < 0.05 was considered significant. RNA-seq data was aligned using bowtie2 [95] against mm10 genome and RSEM v1.2.12 software [96] was used to estimate gene-level read counts using Ensemble transcriptome information. Raw gene counts were used in DESeq2 [97] algorithm to estimate significance of differential expression between Pparγ1+/+ and Pparγ1−/− groups. Expression heatmaps were plotted using mean-centered log2-scaled normalized by DESeq2 expression values. Gene set enrichment analysis was done using Qiagen’s Ingenuity® Pathway Analysis software (IPA®, Qiagen, Redwood City, CA, USA, www.qiagen.com/ingenuity) on genes that passed nominal p < 0.05 using “Upstream Regulators” and “Networks” option. Upstream regulators with significantly predicted activation state (|Z-score|>1) that in addition passed p < 0.05 target enrichment threshold with at least 5 target genes were reported. Identified gene interaction networks with IPA score of at least 25 were considered. Activation states and fold changes were reported for Pparγ1+/+ condition relative to Pparγ1−/−. KEGG pathway analysis was conducted as previously described [98]. Analyses of human gene expression derived from The Metastatic Breast Cancer Project (Provisional, February 2020) were conducted using the cBioPortal analytical tools including the Pearson correlation coefficients.
4.3. Antibodies
Antibodies used for tumor analysis include F4/80 (ab6640, Abcam, Cambridge, MA, USA) [99], EphA2 (C-20, SC-924, Santa Cruz Biotech, Dallas, TX, USA), Ki-67 (RM-9106-S1, Thermo Fisher Scientific, Waltham, MA, USA), SREBP1 (H-160), SREBP2 (H-164), FASN (H-300), and CD31 (CM303A, Biocare Medical, Concord, CA, USA). Antibodies used for lineage analysis were: anti-B220 (RA3-6B2), anti-CD19 (eBio1D3), anti-IgM µ-chain (Jackson Labs), anti-CD43 (S7) for B cells, anti-CD3 (145-2C11), anti-CD4 (GK1.5), anti-CD8a (53-6.7) for T cells, anti-CD41 (MWReg30), anti-CD71 (C2), anti-Ter119 (TER-119), and anti-F4/80 (BM8), anti-Mac1 (M1/70), and anti-Gr1 (RB6-8C5) for myeloid cells. Antibodies used for HSC and progenitor analysis were: Lineage (biotin-conjugated anti-Gr-1 (RB6-8C5), -Mac1 (M1/70), -B220 (RA3-6B2), -CD19 (eBio1D3), -Ter110 (TER-119), -CD5 (53-7.3), -CD4 (GK1.5), -CD8 (53-6.7)), APC-Cy7-c-Kit (2B8), PerCP-cy5.5-Sca1 (E13-161.7 or D7, 1:1000 dilution), FITC-CD48 (HM48-1), PE-Cy7-CD150 (TC15-12F12.2), APC-CD34 (RAM34) and PE–Flk2 (A2F10.1). All antibodies were used at 1:200 dilution unless otherwise noted. FACS antibodies were purchased from eBioscience (San Diego, CA, USA), BD Biosciences (San Jose, CA, USA) or BioLegend (San Diego, CA, USA).
4.4. Cellularity, Hematology and Flow Cytometry
Cellularity of bone marrow, spleen and thymus was calculated from cell count and weights of each organ. Complete blood count (CBC) was measured using a Hemavet 950 (Drew Scientific, Miami Lakes, FL, USA) and hematocrit was calculated after centrifugation of whole blood in heparinized microcapillary tubes (1-000-7500-HC/5 Drummond, Broomall, PA, USA) [57,100]. For flow analysis of lineage distribution in blood, bone marrow, spleen and thymus, red blood cells were first lysed then cells were stained for B, T, and myeloid subsets. All peripheral blood data was acquired using the BD Canto flow cytometer. For bone marrow analysis of HSPC, cells were stained with Lineage (biotin-Ter-119, -Mac-1, -Gr-1, -CD4, -CD8α, -CD5, -CD19 and -B220) followed by staining with streptavidin-PE-TexasRed (SA1017, 1:50, Invitrogen, Carlsbad, CA, USA), and the HSPC panel: -c-Kit-APC, -Sca1-PE, -CD150-PE-Cy7, -CD48-FITC or –c-kit-APC-Cy7, -Sca1-PE-Cy5.5, CD34-APC, and Flk2-PE. Data for bone marrow analysis was collected on the BD Fortessa flow cytometer. Data for bone marrow analysis was collected on the BD Fortessa flow cytometer. All flow cytometry data was analyzed using FlowJo v8.7 for MAC.
4.5. Colony Forming Assay
Total BM from femur was plated onto M3434 semi-solid methylcellulose media (STEMCELL Technologies, Vancouver, BC, Canada). Colonies were enumerated 7 days after plating.
4.6. Cell Culture, Plasmid DNA, and Transfection
The MCF10A-NeuT cells [101], were cultured in DMEM/Ham’s F-12 (50/50) supplemented with 5% of horse serum, 10 μg/mL of insulin, 20 ng/mL of EGF, 100 ng/mL of Cholera Toxin and 0.5 μg/mL of hydrocortisone. MCF10A-NeuT cells transduced with the PPARγ1 expression vector [78], were maintained in Dulbecco’s Modification of Eagle’s Medium (DMEM) supplemented with 10% fetal bovine serum. A total of 100 μg/mL of each penicillin and streptomycin were included in all media. The mouse PPARγ1 subcloned into p3XFLAG-CMV-10 (Sigma-Aldrich, St. Louis, MO, USA) was previously described [39,78]. The coding region of 3XFLAG-PPARγ1 cDNA was inserted into the retroviral expression vector MSCV-IRES-GFP at the EcoRI site (blunted) upstream of the IRES driving expression of GFP [78]. The MCF10A-NeuT cells stably expressing PPARγ1, were established as previously described [102].
4.7. Transwell Migration and Xenografts
Transwell migration assay was performed in 24 well transwell inserts (Corning, Tewksbury, MA, USA) as previously described [103,104]. See the supplemental methods for the details. MCF10A-NeuT cells stably expressing PPARγ1, or vector control were previously established described [102] and used in mammary fat pad xenografts as described [105].
4.8. Immunohistochemistry (IHC) Staining
IHC staining was performed on the paraffin-embedded tissue blocks in the Kimmel Cancer Center Pathology Core Facility at Thomas Jefferson University. Quantification was conducted using ImageJ software.
4.9. ChIP-Seq
For the ChIP-Seq [106], ChIP and input libraries were generated from at least three distinct biological samples from MCF10A-NeuT cells stably expressing vector control or PPARγ1 Wt. Approximately 10 ng of ChIP DNA (quantified by Qubit 2.0 Fluorometer, Invitrogen) was prepared for sequencing according to the amplification protocol from Illumina using enzymes from New England Biolabs (Ipswich, MA, USA) and PCR purification (#28104) and MinElute (#28004) kits from Qiagen. Deep sequencing was performed by the Functional Genomics Core (J. Schugg and K. Kaestner) of the Penn Diabetes Research Center using Illumina HiSeq 2000 and aligned sequences were obtained using the Solexa Analysis Pipeline.
4.10. ChIP-Seq Data Analysis
Tag Alignment and Peak Calling. Binding sites for PPAR WT were inferred from ChIP-Seq analysis of chromatin occupancy. ChIP-Seq tags in FASTQ format were mapped to the human genome version hg19 using the bwa-mem aligner with default parameters. ChIP-Seq data analysis was then performed following ENCODE guidelines to generate high quality peak calls [107]. Aligned reads, or “tags,” were filtered based on mapping quality to retain only those with MAPQ score of 30 or higher for further analysis. Within each IP “treatment” group (vector control, PPARγ Wt), peak calling was performed on individual replicates using pooled input as a control using MACS2 peak calling software [108]. Peak calling was also performed on pooled IP “treatment” samples versus pooled input “control” samples within each group. Peak calling was performed using an estimated 150 bp fragment size, and a 10% FDR threshold. MACS2 automatically filters out duplicate reads, and since each individual replicate had less than the recommended 15M unique tags, the MACS2 option “-to-large” was used to linearly scale up read depth to match the number of input tags; the “-to-large” option was not used during the analysis of pooled IP samples. Consistency between ChIP replicates was evaluated using the Irreproducible Discovery Rate (IDR) methodology. Per the IDR framework, individual replicate samples were used to determine the optimal number of peaks in the pooled replicates at an IDR threshold of 5%.
4.11. Annotation and Motif Finding
Annotation and motif finding within putative PPARγ binding peaks was performed using the databases and tools provided as part of the Hypergeometric Optimization of Motif EnRichment (HOMER) software suite. The HOMER find Motifs Genome command was used to search peak regions for known and novel motifs. The HOMER annotate Peaks command was used to generate region statistics and identify the closest genomic feature relative to each peak, based on the hg19 genome. The annotate Peaks command was also used in tss-centric, rna-centric, and tts-centric mode to identify the closest peak with respect to transcription start sites, transcribed mRNA regions, and transcription termination sites, respectively.
5. Conclusions
Peroxisome proliferator-activated receptor γ (PPARγ) has been implicated in either promoting or inhibiting tumorigenesis, primarily deduced through using agonists of the receptor. Herein, genetic deletion of Pparγ1 in a murine model of human ErbB2-mediated breast cancer, the rate of tumor progression and death was significantly reduced. Furthermore, the genetic deletion of Pparγ1 correlated with reduced pro-tumorigenic inflammation and lipogenesis in the mammary tumors of the mice. The induction of local mammary tumor macrophage infiltration occurred without affecting other tissue hematopoietic stem cell pools. Endogenous Pparγ1 induced expression of both an EphA2-Amphiregulin and an inflammatory INFγ and Cxcl5 signaling module, that was recapitulated in human breast cancer. We conclude ErbB2 collaborates with endogenous Pparγ1 in the onset and progression of mammary tumorigenesis.
Supplementary Materials
The following are available online at https://www.mdpi.com/article/10.3390/cancers13092171/s1, Supplemental materials and methods, Table S1: Test of equality of the survival distribution function (DF = 1), Table S2: Estimated tumor growth rate, Figure S1: Deletion of Pparγ1 reduces adipogenesis in MMTV-ErbB2 transgenic mammary tumors, Figure S2: Growth rate of established ErbB2 mammary tumors upon Cre-mediated deletion of Pparγ1, Figure S3: Impact of Pparγ1 gene deletion on hematopoietic cell peripheral tissue distribution in multigenic mice, Figure S4: T cell lineage indices of Pparγ1+/+ vs. Pparγ −/− multigenic mice, Figure S5: Colony forming hematopoietic progenitor cell assays.
Author Contributions
Conceptualization, R.G.P. and W.T.; Data curation, X.J., L.T., Z.Z., M.C.C. and R.G.P.; Formal analysis, X.J., L.T., Z.Z., J.B., A.V.K., M.C.C., C.W., Y.L., A.E., R.E.S., Q.L., A.W.A. and W.T.; Funding acquisition, R.G.P. and W.T.; Investigation, X.J., L.T., Z.Z., J.B., E.R.C. and A.W.A.; Methodology, X.J., L.T., A.V.K., M.C.C., C.W., Y.L., R.E.S. and W.T.; Project administration, R.G.P.; Supervision, X.J., C.W., W.T. and R.G.P.; Writing–original draft, R.G.P. and X.J.; Writing–review & editing, R.G.P., X.J. and W.T. All authors have read and agreed to the published version of the manuscript
Funding
R.G.P is supported in part by funding from the National Institutes of Health National Cancer Institute (R01CA132115, R21CA235139-01 and the Breast Cancer Research Program (W81XWH1810605, Breakthrough Award) from the Department of Defense. W.T. is supported by NIH grants R01HL095675 and R01HL133828, awards from Fanconi Anemia Research Fund, Department of Defense, Leukemia Lymphoma Society and the Basser Center for BRCA. J.B. was supported by a NRSA F31CA180604 and the Patel Family Award.
Institutional Review Board Statement
The appropriate Thomas Jefferson University institutional committee approved protocols were followed when working with all mice. Animals were housed and maintained at Thomas Jefferson University in a pathogen-free barrier facility under National Institutes of Health (NIH) guidelines.
Informed Consent Statement
Not applicable. As these studies did not involve humans.
Data Availability Statement
All of the data generated from this study are available upon request.
Conflicts of Interest
R.G.P. holds ownership interests in LightSeed, Inc., CytoDyn Inc., and ownership interests (value unknown) for several patents and submitted patent applications, none of which influenced the representation or interpretation of reported research results, nor had any role in the design of the study; in the collection, analyses or interpretation of data; in the writing of the manuscript, or in the decision to publish the results. The other authors declare that they have no conflict of interest.
References
- Slamon, D.J.; Clark, G.M.; Wong, S.G.; Levin, W.J.; Ullrich, A.; McGuire, W.L. Human breast cancer: correlation of relapse and survival with amplification of the HER-2/neu oncogene. Science 1987, 235, 177–182. [Google Scholar] [CrossRef] [PubMed]
- Maennling, A.E.; Tur, M.K.; Niebert, M.; Klockenbring, T.; Zeppernick, F.; Gattenlohner, S.; Meinhold-Heerlein, I.; Hussain, A.F. Molecular Targeting Therapy against EGFR Family in Breast Cancer: Progress and Future Potentials. Cancers 2019, 11, 1826. [Google Scholar] [CrossRef] [PubMed]
- Freed, D.M.; Bessman, N.J.; Kiyatkin, A.; Salazar-Cavazos, E.; Byrne, P.O.; Moore, J.O.; Valley, C.C.; Ferguson, K.M.; Leahy, D.J.; Lidke, D.S.; et al. EGFR Ligands Differentially Stabilize Receptor Dimers to Specify Signaling Kinetics. Cell 2017, 171, 683–695. [Google Scholar] [CrossRef] [PubMed]
- Ju, X.; Katiyar, S.; Wang, C.; Liu, M.; Jiao, X.; Li, S.; Zhou, J.; Turner, J.; Lisanti, M.P.; Russell, R.G.; et al. Akt1 governs breast cancer progression in vivo. Proc. Natl. Acad. Sci. USA 2007, 104, 7438–7443. [Google Scholar] [CrossRef]
- Smith, H.W.; Hirukawa, A.; Sanguin-Gendreau, V.; Nandi, I.; Dufour, C.R.; Zuo, D.; Tandoc, K.; Leibovitch, M.; Singh, S.; Rennhack, J.P.; et al. An ErbB2/c-Src axis links bioenergetics with PRC2 translation to drive epigenetic reprogramming and mammary tumorigenesis. Nat. Commun. 2019, 10, 2901. [Google Scholar] [CrossRef] [PubMed]
- Lemmon, M.A.; Schlessinger, J.; Ferguson, K.M. The EGFR family: not so prototypical receptor tyrosine kinases. Cold Spring Harb. Perspect Biol. 2014, 6, a020768. [Google Scholar] [CrossRef] [PubMed]
- Brantley-Sieders, D.M.; Zhuang, G.; Hicks, D.; Fang, W.B.; Hwang, Y.; Cates, J.M.; Coffman, K.; Jackson, D.; Bruckheimer, E.; Muraoka-Cook, R.S.; et al. The receptor tyrosine kinase EphA2 promotes mammary adenocarcinoma tumorigenesis and metastatic progression in mice by amplifying ErbB2 signaling. J. Clin. Investig. 2008, 118, 64–78. [Google Scholar] [CrossRef]
- Lee, R.J.; Albanese, C.; Fu, M.; D’Amico, M.; Lin, B.; Watanabe, G.; Haines, G.K., 3rd; Siegel, P.M.; Hung, M.C.; Yarden, Y.; et al. Cyclin D1 is required for transformation by activated Neu and is induced through an E2F-dependent signaling pathway. Mol. Cell Biol. 2000, 20, 672–683. [Google Scholar] [CrossRef]
- Hulit, J.; Lee, R.J.; Li, Z.; Wang, C.; Katiyar, S.; Yang, J.; Quong, A.A.; Wu, K.; Albanese, C.; Russell, R.; et al. p27Kip1 repression of ErbB2-induced mammary tumor growth in transgenic mice involves Skp2 and Wnt/beta-catenin signaling. Cancer Res. 2006, 66, 8529–8541. [Google Scholar] [CrossRef]
- D’Amico, M.; Wu, K.; Di Vizio, D.; Reutens, A.T.; Stahl, M.; Fu, M.; Albanese, C.; Russell, R.G.; Muller, W.J.; White, M.; et al. The role of Ink4a/Arf in ErbB2 mammary gland tumorigenesis. Cancer Res. 2003, 63, 3395–3402. [Google Scholar]
- Ursini-Siegel, J.; Schade, B.; Cardiff, R.D.; Muller, W.J. Insights from transgenic mouse models of ERBB2-induced breast cancer. Nat. Rev. Cancer 2007, 7, 389–397. [Google Scholar] [CrossRef]
- Swain, S.M.; Baselga, J.; Kim, S.B.; Ro, J.; Semiglazov, V.; Campone, M.; Ciruelos, E.; Ferrero, J.M.; Schneeweiss, A.; Heeson, S.; et al. Pertuzumab, trastuzumab, and docetaxel in HER2-positive metastatic breast cancer. N. Engl. J. Med. 2015, 372, 724–734. [Google Scholar] [CrossRef] [PubMed]
- Verma, S.; Miles, D.; Gianni, L.; Krop, I.E.; Welslau, M.; Baselga, J.; Pegram, M.; Oh, D.Y.; Dieras, V.; Guardino, E.; et al. Trastuzumab emtansine for HER2-positive advanced breast cancer. N. Engl. J. Med. 2012, 367, 1783–1791. [Google Scholar] [CrossRef] [PubMed]
- Geyer, C.E.; Forster, J.; Lindquist, D.; Chan, S.; Romieu, C.G.; Pienkowski, T.; Jagiello-Gruszfeld, A.; Crown, J.; Chan, A.; Kaufman, B.; et al. Lapatinib plus capecitabine for HER2-positive advanced breast cancer. N. Engl. J. Med. 2006, 355, 2733–2743. [Google Scholar] [CrossRef] [PubMed]
- Martin, M.; Holmes, F.A.; Ejlertsen, B.; Delaloge, S.; Moy, B.; Iwata, H.; von Minckwitz, G.; Chia, S.K.L.; Mansi, J.; Barrios, C.H.; et al. Neratinib after trastuzumab-based adjuvant therapy in HER2-positive breast cancer (ExteNET): 5-year analysis of a randomised, double-blind, placebo-controlled, phase 3 trial. Lancet Oncol. 2017, 18, 1688–1700. [Google Scholar] [CrossRef]
- Ponde, N.; Brandao, M.; El-Hachem, G.; Werbrouck, E.; Piccart, M. Treatment of advanced HER2-positive breast cancer: 2018 and beyond. Cancer Treat. Rev. 2018, 67, 10–20. [Google Scholar] [CrossRef]
- Griguolo, G.; Pascual, T.; Dieci, M.V.; Guarneri, V.; Prat, A. Interaction of host immunity with HER2-targeted treatment and tumor heterogeneity in HER2-positive breast cancer. J. Immunother. Cancer 2019, 7, 90. [Google Scholar] [CrossRef]
- Denkert, C.; von Minckwitz, G.; Darb-Esfahani, S.; Lederer, B.; Heppner, B.I.; Weber, K.E.; Budczies, J.; Huober, J.; Klauschen, F.; Furlanetto, J.; et al. Tumour-infiltrating lymphocytes and prognosis in different subtypes of breast cancer: a pooled analysis of 3771 patients treated with neoadjuvant therapy. Lancet Oncol. 2018, 19, 40–50. [Google Scholar] [CrossRef]
- Perez, E.A.; Thompson, E.A.; Ballman, K.V.; Anderson, S.K.; Asmann, Y.W.; Kalari, K.R.; Eckel-Passow, J.E.; Dueck, A.C.; Tenner, K.S.; Jen, J.; et al. Genomic analysis reveals that immune function genes are strongly linked to clinical outcome in the North Central Cancer Treatment Group n9831 Adjuvant Trastuzumab Trial. J. Clin. Oncol. 2015, 33, 701–708. [Google Scholar] [CrossRef]
- Luen, S.J.; Salgado, R.; Fox, S.; Savas, P.; Eng-Wong, J.; Clark, E.; Kiermaier, A.; Swain, S.M.; Baselga, J.; Michiels, S.; et al. Tumour-infiltrating lymphocytes in advanced HER2-positive breast cancer treated with pertuzumab or placebo in addition to trastuzumab and docetaxel: a retrospective analysis of the CLEOPATRA study. Lancet Oncol. 2017, 18, 52–62. [Google Scholar] [CrossRef]
- Nuciforo, P.; Pascual, T.; Cortes, J.; Llombart-Cussac, A.; Fasani, R.; Pare, L.; Oliveira, M.; Galvan, P.; Martinez, N.; Bermejo, B.; et al. A predictive model of pathologic response based on tumor cellularity and tumor-infiltrating lymphocytes (CelTIL) in HER2-positive breast cancer treated with chemo-free dual HER2 blockade. Ann. Oncol. 2018, 29, 170–177. [Google Scholar] [CrossRef]
- Martinez-Outschoorn, U.E.; Peiris-Pages, M.; Pestell, R.G.; Sotgia, F.; Lisanti, M.P. Cancer metabolism: A therapeutic perspective. Nat. Rev. Clin. Oncol. 2017, 14, 11–31. [Google Scholar] [CrossRef]
- Chaffer, C.L.; Weinberg, R.A. How does multistep tumorigenesis really proceed? Cancer Discov. 2015, 5, 22–24. [Google Scholar] [CrossRef]
- Hanahan, D.; Weinberg, R.A. Hallmarks of cancer: The next generation. Cell 2011, 144, 646–674. [Google Scholar] [CrossRef] [PubMed]
- Jiao, X.; Nawab, O.; Patel, T.; Kossenkov, A.V.; Halama, N.; Jaeger, D.; Pestell, R.G. Recent Advances Targeting CCR5 for Cancer and Its Role in Immuno-Oncology. Cancer Res. 2019, 79, 4801–4807. [Google Scholar] [CrossRef] [PubMed]
- Sharma, B.; Nannuru, K.C.; Varney, M.L.; Singh, R.K. Host Cxcr2-dependent regulation of mammary tumor growth and metastasis. Clin. Exp. Metastasis 2015, 32, 65–72. [Google Scholar] [CrossRef] [PubMed]
- Sicoli, D.; Jiao, X.; Ju, X.; Velasco-Velazquez, M.; Ertel, A.; Addya, S.; Li, Z.; Ando, S.; Fatatis, A.; Paudyal, B.; et al. CCR5 receptor antagonists block metastasis to bone of v-Src oncogene-transformed metastatic prostate cancer cell lines. Cancer Res. 2014, 74, 7103–7114. [Google Scholar] [CrossRef] [PubMed]
- Velasco-Velazquez, M.; Jiao, X.; De La Fuente, M.; Pestell, T.G.; Ertel, A.; Lisanti, M.P.; Pestell, R.G. CCR5 antagonist blocks metastasis of basal breast cancer cells. Cancer Res. 2012, 72, 3839–3850. [Google Scholar] [CrossRef] [PubMed]
- Cassetta, L.; Pollard, J.W. Tumor-associated macrophages. Curr. Biol. 2020, 30, R246–R248. [Google Scholar] [CrossRef] [PubMed]
- Pyonteck, S.M.; Akkari, L.; Schuhmacher, A.J.; Bowman, R.L.; Sevenich, L.; Quail, D.F.; Olson, O.C.; Quick, M.L.; Huse, J.T.; Teijeiro, V.; et al. CSF-1R inhibition alters macrophage polarization and blocks glioma progression. Nat. Med. 2013, 19, 1264–1272. [Google Scholar] [CrossRef]
- Movahedi, K.; Laoui, D.; Gysemans, C.; Baeten, M.; Stange, G.; Van den Bossche, J.; Mack, M.; Pipeleers, D.; In’t Veld, P.; De Baetselier, P.; et al. Different tumor microenvironments contain functionally distinct subsets of macrophages derived from Ly6C(high) monocytes. Cancer Res. 2010, 70, 5728–5739. [Google Scholar] [CrossRef] [PubMed]
- Shand, F.H.; Ueha, S.; Otsuji, M.; Koid, S.S.; Shichino, S.; Tsukui, T.; Kosugi-Kanaya, M.; Abe, J.; Tomura, M.; Ziogas, J.; et al. Tracking of intertissue migration reveals the origins of tumor-infiltrating monocytes. Proc. Natl. Acad. Sci. USA 2014, 111, 7771–7776. [Google Scholar] [CrossRef] [PubMed]
- Noy, R.; Pollard, J.W. Tumor-associated macrophages: From mechanisms to therapy. Immunity 2014, 41, 49–61. [Google Scholar] [CrossRef] [PubMed]
- Cassetta, L.; Fragkogianni, S.; Sims, A.H.; Swierczak, A.; Forrester, L.M.; Zhang, H.; Soong, D.Y.H.; Cotechini, T.; Anur, P.; Lin, E.Y.; et al. Human Tumor-Associated Macrophage and Monocyte Transcriptional Landscapes Reveal Cancer-Specific Reprogramming, Biomarkers, and Therapeutic Targets. Cancer Cell 2019, 35, 588–602 e510. [Google Scholar] [CrossRef] [PubMed]
- Cassetta, L.; Pollard, J.W. Targeting macrophages: therapeutic approaches in cancer. Nat. Rev. Drug. Discov. 2018, 17, 887–904. [Google Scholar] [CrossRef]
- Miles, P.D.; Barak, Y.; He, W.; Evans, R.M.; Olefsky, J.M. Improved insulin-sensitivity in mice heterozygous for PPAR-gamma deficiency. J. Clin. Investig. 2000, 105, 287–292. [Google Scholar] [CrossRef]
- Tontonoz, P.; Hu, E.; Spiegelman, B.M. Stimulation of adipogenesis in fibroblasts by PPAR gamma 2, a lipid-activated transcription factor. Cell 1994, 79, 1147–1156. [Google Scholar] [CrossRef]
- Mueller, E.; Sarraf, P.; Tontonoz, P.; Evans, R.M.; Martin, K.J.; Zhang, M.; Fletcher, C.; Singer, S.; Spiegelman, B.M. Terminal differentiation of human breast cancer through PPAR gamma. Mol. Cell 1998, 1, 465–470. [Google Scholar] [CrossRef]
- Zhou, J.; Zhang, W.; Liang, B.; Casimiro, M.C.; Whitaker-Menezes, D.; Wang, M.; Lisanti, M.P.; Lanza-Jacoby, S.; Pestell, R.G.; Wang, C. PPARgamma activation induces autophagy in breast cancer cells. Int. J. Biochem. Cell Biol. 2009, 41, 2334–2342. [Google Scholar] [CrossRef]
- Suh, N.; Wang, Y.; Williams, C.R.; Risingsong, R.; Gilmer, T.; Willson, T.M.; Sporn, M.B. A new ligand for the peroxisome proliferator-activated receptor-gamma (PPAR-gamma), GW7845, inhibits rat mammary carcinogenesis. Cancer Res. 1999, 59, 5671–5673. [Google Scholar]
- Mehta, R.G.; Williamson, E.; Patel, M.K.; Koeffler, H.P. A ligand of peroxisome proliferator-activated receptor gamma, retinoids, and prevention of preneoplastic mammary lesions. J. Natl. Cancer Inst. 2000, 92, 418–423. [Google Scholar] [CrossRef] [PubMed]
- Girnun, G.D.; Smith, W.M.; Drori, S.; Sarraf, P.; Mueller, E.; Eng, C.; Nambiar, P.; Rosenberg, D.W.; Bronson, R.T.; Edelmann, W.; et al. APC-dependent suppression of colon carcinogenesis by PPARgamma. Proc. Natl. Acad. Sci. USA 2002, 99, 13771–13776. [Google Scholar] [CrossRef]
- Lefebvre, A.M.; Chen, I.; Desreumaux, P.; Najib, J.; Fruchart, J.C.; Geboes, K.; Briggs, M.; Heyman, R.; Auwerx, J. Activation of the peroxisome proliferator-activated receptor gamma promotes the development of colon tumors in C57BL/6J-APCMin/+ mice. Nat. Med. 1998, 4, 1053–1057. [Google Scholar] [CrossRef] [PubMed]
- Harmon, G.S.; Lam, M.T.; Glass, C.K. PPARs and lipid ligands in inflammation and metabolism. Chem. Rev. 2011, 111, 6321–6340. [Google Scholar] [CrossRef]
- Glass, C.K.; Saijo, K. Nuclear receptor transrepression pathways that regulate inflammation in macrophages and T cells. Nat. Rev. Immunol. 2010, 10, 365–376. [Google Scholar] [CrossRef] [PubMed]
- Heming, M.; Gran, S.; Jauch, S.L.; Fischer-Riepe, L.; Russo, A.; Klotz, L.; Hermann, S.; Schafers, M.; Roth, J.; Barczyk-Kahlert, K. Peroxisome Proliferator-Activated Receptor-gamma Modulates the Response of Macrophages to Lipopolysaccharide and Glucocorticoids. Front. Immunol. 2018, 9, 893. [Google Scholar] [CrossRef]
- Schneider, C.; Nobs, S.P.; Kurrer, M.; Rehrauer, H.; Thiele, C.; Kopf, M. Induction of the nuclear receptor PPAR-gamma by the cytokine GM-CSF is critical for the differentiation of fetal monocytes into alveolar macrophages. Nat. Immunol. 2014, 15, 1026–1037. [Google Scholar] [CrossRef]
- Ieguchi, K.; Tomita, T.; Omori, T.; Komatsu, A.; Deguchi, A.; Masuda, J.; Duffy, S.L.; Coulthard, M.G.; Boyd, A.; Maru, Y. ADAM12-cleaved ephrin-A1 contributes to lung metastasis. Oncogene 2014, 33, 2179–2190. [Google Scholar] [CrossRef]
- Truitt, L.; Freywald, T.; DeCoteau, J.; Sharfe, N.; Freywald, A. The EphB6 receptor cooperates with c-Cbl to regulate the behavior of breast cancer cells. Cancer Res. 2010, 70, 1141–1153. [Google Scholar] [CrossRef]
- Dixit, E.; Boulant, S.; Zhang, Y.; Lee, A.S.; Odendall, C.; Shum, B.; Hacohen, N.; Chen, Z.J.; Whelan, S.P.; Fransen, M.; et al. Peroxisomes are signaling platforms for antiviral innate immunity. Cell 2010, 141, 668–681. [Google Scholar] [CrossRef]
- Odendall, C.; Dixit, E.; Stavru, F.; Bierne, H.; Franz, K.M.; Durbin, A.F.; Boulant, S.; Gehrke, L.; Cossart, P.; Kagan, J.C. Diverse intracellular pathogens activate type III interferon expression from peroxisomes. Nat. Immunol. 2014, 15, 717–726. [Google Scholar] [CrossRef]
- Lopez-Yrigoyen, M.; Cassetta, L.; Pollard, J.W. Macrophage targeting in cancer. Ann. N. Y. Acad. Sci. 2020. [Google Scholar] [CrossRef]
- Franklin, R.A.; Liao, W.; Sarkar, A.; Kim, M.V.; Bivona, M.R.; Liu, K.; Pamer, E.G.; Li, M.O. The cellular and molecular origin of tumor-associated macrophages. Science 2014, 344, 921–925. [Google Scholar] [CrossRef]
- Audzevich, T.; Bashford-Rogers, R.; Mabbott, N.A.; Frampton, D.; Freeman, T.C.; Potocnik, A.; Kellam, P.; Gilroy, D.W. Pre/pro-B cells generate macrophage populations during homeostasis and inflammation. Proc. Natl. Acad. Sci. USA 2017, 114, E3954–E3963. [Google Scholar] [CrossRef]
- Cortez-Retamozo, V.; Etzrodt, M.; Newton, A.; Rauch, P.J.; Chudnovskiy, A.; Berger, C.; Ryan, R.J.; Iwamoto, Y.; Marinelli, B.; Gorbatov, R.; et al. Origins of tumor-associated macrophages and neutrophils. Proc. Natl. Acad. Sci. USA 2012, 109, 2491–2496. [Google Scholar] [CrossRef]
- Oguro, H.; Ding, L.; Morrison, S.J. SLAM family markers resolve functionally distinct subpopulations of hematopoietic stem cells and multipotent progenitors. Cell Stem Cell 2013, 13, 102–116. [Google Scholar] [CrossRef]
- Lv, K.; Jiang, J.; Donaghy, R.; Riling, C.R.; Cheng, Y.; Chandra, V.; Rozenova, K.; An, W.; Mohapatra, B.C.; Goetz, B.T.; et al. CBL family E3 ubiquitin ligases control JAK2 ubiquitination and stability in hematopoietic stem cells and myeloid malignancies. Genes Dev. 2017, 31, 1007–1023. [Google Scholar] [CrossRef]
- Strand, D.W.; Jiang, M.; Murphy, T.A.; Yi, Y.; Konvinse, K.C.; Franco, O.E.; Wang, Y.; Young, J.D.; Hayward, S.W. PPARgamma isoforms differentially regulate metabolic networks to mediate mouse prostatic epithelial differentiation. Cell Death Dis. 2012, 3, e361. [Google Scholar] [CrossRef] [PubMed]
- Ding, Q.; Lu, P.; Xia, Y.; Ding, S.; Fan, Y.; Li, X.; Han, P.; Liu, J.; Tian, D.; Liu, M. CXCL9: Evidence and contradictions for its role in tumor progression. Cancer Med. 2016, 5, 3246–3259. [Google Scholar] [CrossRef]
- Sarraf, P.; Mueller, E.; Smith, W.M.; Wright, H.M.; Kum, J.B.; Aaltonen, L.A.; de la Chapelle, A.; Spiegelman, B.M.; Eng, C. Loss-of-function mutations in PPAR gamma associated with human colon cancer. Mol. Cell 1999, 3, 799–804. [Google Scholar] [CrossRef]
- Saez, E.; Tontonoz, P.; Nelson, M.C.; Alvarez, J.G.; Ming, U.T.; Baird, S.M.; Thomazy, V.A.; Evans, R.M. Activators of the nuclear receptor PPARgamma enhance colon polyp formation. Nat. Med. 1998, 4, 1058–1061. [Google Scholar] [CrossRef]
- Saez, E.; Rosenfeld, J.; Livolsi, A.; Olson, P.; Lombardo, E.; Nelson, M.; Banayo, E.; Cardiff, R.D.; Izpisua-Belmonte, J.C.; Evans, R.M. PPAR gamma signaling exacerbates mammary gland tumor development. Genes Dev. 2004, 18, 528–540. [Google Scholar] [CrossRef]
- Leesnitzer, L.M.; Parks, D.J.; Bledsoe, R.K.; Cobb, J.E.; Collins, J.L.; Consler, T.G.; Davis, R.G.; Hull-Ryde, E.A.; Lenhard, J.M.; Patel, L.; et al. Functional consequences of cysteine modification in the ligand binding sites of peroxisome proliferator activated receptors by GW9662. Biochemistry 2002, 41, 6640–6650. [Google Scholar] [CrossRef]
- Lee, H.; Finck, B.N.; Jones, L.A.; Welch, M.J.; Mach, R.H. Synthesis and evaluation of a bromine-76-labeled PPARgamma antagonist 2-bromo-5-nitro-N-phenylbenzamide. Nucl. Med. Biol. 2006, 33, 847–854. [Google Scholar] [CrossRef]
- Lee, G.; Elwood, F.; McNally, J.; Weiszmann, J.; Lindstrom, M.; Amaral, K.; Nakamura, M.; Miao, S.; Cao, P.; Learned, R.M.; et al. T0070907, a selective ligand for peroxisome proliferator-activated receptor gamma, functions as an antagonist of biochemical and cellular activities. J. Biol. Chem. 2002, 277, 19649–19657. [Google Scholar] [CrossRef]
- Seargent, J.M.; Yates, E.A.; Gill, J.H. GW9662, a potent antagonist of PPARgamma, inhibits growth of breast tumour cells and promotes the anticancer effects of the PPARgamma agonist rosiglitazone, independently of PPARgamma activation. Br. J. Pharmacol. 2004, 143, 933–937. [Google Scholar] [CrossRef]
- Lecomte, J.; Flament, S.; Salamone, S.; Boisbrun, M.; Mazerbourg, S.; Chapleur, Y.; Grillier-Vuissoz, I. Disruption of ERalpha signalling pathway by PPARgamma agonists: evidences of PPARgamma-independent events in two hormone-dependent breast cancer cell lines. Breast Cancer Res. Treat. 2008, 112, 437–451. [Google Scholar] [CrossRef]
- Schaefer, K.L.; Takahashi, H.; Morales, V.M.; Harris, G.; Barton, S.; Osawa, E.; Nakajima, A.; Saubermann, L.J. PPARgamma inhibitors reduce tubulin protein levels by a PPARgamma, PPARdelta and proteasome-independent mechanism, resulting in cell cycle arrest, apoptosis and reduced metastasis of colorectal carcinoma cells. Int. J. Cancer 2007, 120, 702–713. [Google Scholar] [CrossRef] [PubMed]
- Oberfield, J.L.; Collins, J.L.; Holmes, C.P.; Goreham, D.M.; Cooper, J.P.; Cobb, J.E.; Lenhard, J.M.; Hull-Ryde, E.A.; Mohr, C.P.; Blanchard, S.G.; et al. A peroxisome proliferator-activated receptor gamma ligand inhibits adipocyte differentiation. Proc. Natl. Acad. Sci. USA 1999, 96, 6102–6106. [Google Scholar] [CrossRef]
- Elbrecht, A.; Chen, Y.; Adams, A.; Berger, J.; Griffin, P.; Klatt, T.; Zhang, B.; Menke, J.; Zhou, G.; Smith, R.G.; et al. L-764406 is a partial agonist of human peroxisome proliferator-activated receptor gamma. The role of Cys313 in ligand binding. J. Biol. Chem. 1999, 274, 7913–7922. [Google Scholar] [CrossRef]
- Yuan, H.; Kopelovich, L.; Yin, Y.; Lu, J.; Glazer, R.I. Drug-targeted inhibition of peroxisome proliferator-activated receptor-gamma enhances the chemopreventive effect of anti-estrogen therapy. Oncotarget 2012, 3, 345–356. [Google Scholar] [CrossRef]
- Bafaro, E.; Liu, Y.; Xu, Y.; Dempski, R.E. The emerging role of zinc transporters in cellular homeostasis and cancer. Signal Transduct Target Ther. 2017, 2. [Google Scholar] [CrossRef] [PubMed]
- Li, Y.; Macdonald-Obermann, J.; Westfall, C.; Piwnica-Worms, D.; Pike, L.J. Quantitation of the effect of ErbB2 on epidermal growth factor receptor binding and dimerization. J. Biol. Chem. 2012, 287, 31116–31125. [Google Scholar] [CrossRef] [PubMed]
- Atapattu, L.; Lackmann, M.; Janes, P.W. The role of proteases in regulating Eph/ephrin signaling. Cell Adh. Migr. 2014, 8, 294–307. [Google Scholar] [CrossRef] [PubMed]
- Sugiyama, N.; Gucciardo, E.; Tatti, O.; Varjosalo, M.; Hyytiainen, M.; Gstaiger, M.; Lehti, K. EphA2 cleavage by MT1-MMP triggers single cancer cell invasion via homotypic cell repulsion. J. Cell Biol. 2013, 201, 467–484. [Google Scholar] [CrossRef]
- Cousin, H.; Abbruzzese, G.; Kerdavid, E.; Gaultier, A.; Alfandari, D. Translocation of the cytoplasmic domain of ADAM13 to the nucleus is essential for Calpain8-a expression and cranial neural crest cell migration. Dev. Cell 2011, 20, 256–263. [Google Scholar] [CrossRef] [PubMed]
- Frohlich, C.; Nehammer, C.; Albrechtsen, R.; Kronqvist, P.; Kveiborg, M.; Sehara-Fujisawa, A.; Mercurio, A.M.; Wewer, U.M. ADAM12 produced by tumor cells rather than stromal cells accelerates breast tumor progression. Mol. Cancer Res. 2011, 9, 1449–1461. [Google Scholar] [CrossRef] [PubMed]
- Kodama, T.; Ikeda, E.; Okada, A.; Ohtsuka, T.; Shimoda, M.; Shiomi, T.; Yoshida, K.; Nakada, M.; Ohuchi, E.; Okada, Y. ADAM12 is selectively overexpressed in human glioblastomas and is associated with glioblastoma cell proliferation and shedding of heparin-binding epidermal growth factor. Am. J. Pathol. 2004, 165, 1743–1753. [Google Scholar] [CrossRef]
- Tian, L.; Zhou, J.; Casimiro, M.C.; Liang, B.; Ojeifo, J.O.; Wang, M.; Hyslop, T.; Wang, C.; Pestell, R.G. Activating peroxisome proliferator-activated receptor gamma mutant promotes tumor growth in vivo by enhancing angiogenesis. Cancer Res. 2009, 69, 9236–9244. [Google Scholar] [CrossRef]
- Harper, K.L.; Sosa, M.S.; Entenberg, D.; Hosseini, H.; Cheung, J.F.; Nobre, R.; Avivar-Valderas, A.; Nagi, C.; Girnius, N.; Davis, R.J.; et al. Mechanism of early dissemination and metastasis in Her2(+) mammary cancer. Nature 2016, 540, 588–592. [Google Scholar] [CrossRef]
- Linde, N.; Casanova-Acebes, M.; Sosa, M.S.; Mortha, A.; Rahman, A.; Farias, E.; Harper, K.; Tardio, E.; Reyes Torres, I.; Jones, J.; et al. Macrophages orchestrate breast cancer early dissemination and metastasis. Nat. Commun. 2018, 9, 21. [Google Scholar] [CrossRef] [PubMed]
- Koch, J.; Pranjic, K.; Huber, A.; Ellinger, A.; Hartig, A.; Kragler, F.; Brocard, C. PEX11 family members are membrane elongation factors that coordinate peroxisome proliferation and maintenance. J. Cell Sci. 2010, 123, 3389–3400. [Google Scholar] [CrossRef]
- de Mingo Pulido, A.; Gardner, A.; Hiebler, S.; Soliman, H.; Rugo, H.S.; Krummel, M.F.; Coussens, L.M.; Ruffell, B. TIM-3 Regulates CD103(+) Dendritic Cell Function and Response to Chemotherapy in Breast Cancer. Cancer Cell 2018, 33, 60–74. [Google Scholar] [CrossRef] [PubMed]
- Dangaj, D.; Bruand, M.; Grimm, A.J.; Ronet, C.; Barras, D.; Duttagupta, P.A.; Lanitis, E.; Duraiswamy, J.; Tanyi, J.L.; Benencia, F.; et al. Cooperation between Constitutive and Inducible Chemokines Enables T Cell Engraftment and Immune Attack in Solid Tumors. Cancer Cell 2019, 35, 885–900 e810. [Google Scholar] [CrossRef] [PubMed]
- Liang, B.; Li, Y.; Liu, B.; Zhou, F.; Xu, S.; Wu, Q. A pencil beam dose calculation model for CyberKnife system. Med. Phys. 2016, 43, 5380. [Google Scholar] [CrossRef]
- Bent, R.; Moll, L.; Grabbe, S.; Bros, M. Interleukin-1 Beta-A Friend or Foe in Malignancies? Int. J. Mol. Sci. 2018, 19, 2155. [Google Scholar] [CrossRef]
- Franze, E.; Stolfi, C.; Troncone, E.; Scarozza, P.; Monteleone, G. Role of Interleukin-34 in Cancer. Cancers 2020, 12, 252. [Google Scholar] [CrossRef]
- Schmidt, S.F.; Jorgensen, M.; Chen, Y.; Nielsen, R.; Sandelin, A.; Mandrup, S. Cross species comparison of C/EBPalpha and PPARgamma profiles in mouse and human adipocytes reveals interdependent retention of binding sites. BMC Genom. 2011, 12, 152–168. [Google Scholar] [CrossRef]
- Lefterova, M.I.; Zhang, Y.; Steger, D.J.; Schupp, M.; Schug, J.; Cristancho, A.; Feng, D.; Zhuo, D.; Stoeckert, C.J., Jr.; Liu, X.S.; et al. PPARgamma and C/EBP factors orchestrate adipocyte biology via adjacent binding on a genome-wide scale. Genes Dev. 2008, 22, 2941–2952. [Google Scholar] [CrossRef]
- Dispirito, J.R.; Fang, B.; Wang, F.; Lazar, M.A. Pruning of the adipocyte peroxisome proliferator-activated receptor gamma cistrome by hematopoietic master regulator PU.1. Mol. Cell Biol. 2013, 33, 3354–3364. [Google Scholar] [CrossRef]
- Akiyama, T.E.; Sakai, S.; Lambert, G.; Nicol, C.J.; Matsusue, K.; Pimprale, S.; Lee, Y.H.; Ricote, M.; Glass, C.K.; Brewer, H.B., Jr.; et al. Conditional disruption of the peroxisome proliferator-activated receptor gamma gene in mice results in lowered expression of ABCA1, ABCG1, and apoE in macrophages and reduced cholesterol efflux. Mol. Cell Biol. 2002, 22, 2607–2619. [Google Scholar] [CrossRef] [PubMed]
- de Luca, C.; Kowalski, T.J.; Zhang, Y.; Elmquist, J.K.; Lee, C.; Kilimann, M.W.; Ludwig, T.; Liu, S.M.; Chua, S.C. Complete rescue of obesity, diabetes, and infertility in db/db mice by neuron-specific LEPR-B transgenes. J. Clin. Investig. 2005, 115, 3484–3493. [Google Scholar] [CrossRef] [PubMed]
- Muzumdar, M.D.; Tasic, B.; Miyamichi, K.; Li, L.; Luo, L. A global double-fluorescent Cre reporter mouse. Genesis 2007, 45, 593–605. [Google Scholar] [CrossRef]
- Shehata, M.; van Amerongen, R.; Zeeman, A.L.; Giraddi, R.R.; Stingl, J. The influence of tamoxifen on normal mouse mammary gland homeostasis. Breast Cancer Res. 2014, 16, 411. [Google Scholar] [CrossRef]
- Langmead, B.; Salzberg, S.L. Fast gapped-read alignment with Bowtie 2. Nat Methods 2012, 9, 357–359. [Google Scholar] [CrossRef] [PubMed]
- Li, B.; Dewey, C.N. RSEM: accurate transcript quantification from RNA-Seq data with or without a reference genome. BMC Bioinform. 2011, 12, 323. [Google Scholar] [CrossRef] [PubMed]
- Love, M.I.; Huber, W.; Anders, S. Moderated estimation of fold change and dispersion for RNA-seq data with DESeq2. Genome Biol. 2014, 15, 550. [Google Scholar] [CrossRef]
- Ju, X.; Casimiro, M.C.; Gormley, M.; Meng, H.; Jiao, X.; Katiyar, S.; Crosariol, M.; Chen, K.; Wang, M.; Quong, A.A.; et al. Identification of a cyclin D1 network in prostate cancer that antagonizes epithelial-mesenchymal restraint. Cancer Res. 2014, 74, 508–519. [Google Scholar] [CrossRef]
- Jung, D.G.; Jung, D.; Kong, S.H. A Lab-on-a-Chip-Based Non-Invasive Optical Sensor for Measuring Glucose in Saliva. Sensors 2017, 17, 2607. [Google Scholar] [CrossRef] [PubMed]
- Balcerek, J.; Jiang, J.; Li, Y.; Jiang, Q.; Holdreith, N.; Singh, B.; Chandra, V.; Lv, K.; Ren, J.G.; Rozenova, K.; et al. Lnk/Sh2b3 deficiency restores hematopoietic stem cell function and genome integrity in Fancd2 deficient Fanconi anemia. Nat. Commun. 2018, 9, 3915. [Google Scholar] [CrossRef]
- Liu, M.; Casimiro, M.C.; Wang, C.; Shirley, L.A.; Jiao, X.; Katiyar, S.; Ju, X.; Li, Z.; Yu, Z.; Zhou, J.; et al. p21CIP1 attenuates Ras- and c-Myc-dependent breast tumor epithelial mesenchymal transition and cancer stem cell-like gene expression in vivo. Proc. Natl. Acad. Sci. USA 2009, 106, 19035–19039. [Google Scholar] [CrossRef]
- Tian, L.; Wang, C.; Hagen, F.K.; Gormley, M.; Addya, S.; Soccio, R.; Casimiro, M.C.; Zhou, J.; Powell, M.J.; Xu, P.; et al. Acetylation-defective mutant of Ppargamma is associated with decreased lipid synthesis in breast cancer cells. Oncotarget 2014, 5, 7303–7315. [Google Scholar] [CrossRef] [PubMed]
- Li, Z.; Jiao, X.; Wang, C.; Ju, X.; Lu, Y.; Yuan, L.; Lisanti, M.P.; Katiyar, S.; Pestell, R.G. Cyclin D1 induction of cellular migration requires p27(KIP1). Cancer Res. 2006, 66, 9986–9994. [Google Scholar] [CrossRef] [PubMed]
- Jiao, X.; Wang, M.; Zhang, Z.; Li, Z.; Ni, D.; Ashton, A.W.; Tang, H.Y.; Speicher, D.W.; Pestell, R.G. Leronlimab, a humanized monoclonal antibody to CCR5, blocks breast cancer cellular metastasis and enhances cell death induced by DNA damaging chemotherapy. Breast Cancer Res. 2021, 23, 11. [Google Scholar] [CrossRef] [PubMed]
- Williams, T.M.; Sotgia, F.; Lee, H.; Hassan, G.; Di Vizio, D.; Bonuccelli, G.; Capozza, F.; Mercier, I.; Rui, H.; Pestell, R.G.; et al. Stromal and epithelial caveolin-1 both confer a protective effect against mammary hyperplasia and tumorigenesis: Caveolin-1 antagonizes cyclin D1 function in mammary epithelial cells. Am. J. Pathol. 2006, 169, 1784–1801. [Google Scholar] [CrossRef] [PubMed]
- Casimiro, M.C.; Crosariol, M.; Loro, E.; Ertel, A.; Yu, Z.; Dampier, W.; Saria, E.A.; Papanikolaou, A.; Stanek, T.J.; Li, Z.; et al. ChIP sequencing of cyclin D1 reveals a transcriptional role in chromosomal instability in mice. J. Clin. Investig. 2012, 122, 833–843. [Google Scholar] [CrossRef] [PubMed]
- Landt, S.G.; Marinov, G.K.; Kundaje, A.; Kheradpour, P.; Pauli, F.; Batzoglou, S.; Bernstein, B.E.; Bickel, P.; Brown, J.B.; Cayting, P.; et al. ChIP-seq guidelines and practices of the ENCODE and modENCODE consortia. Genome Res. 2012, 22, 1813–1831. [Google Scholar] [CrossRef] [PubMed]
- Zhang, Y.; Liu, T.; Meyer, C.A.; Eeckhoute, J.; Johnson, D.S.; Bernstein, B.E.; Nusbaum, C.; Myers, R.M.; Brown, M.; Li, W.; et al. Model-based analysis of ChIP-Seq (MACS). Genome Biol. 2008, 9, R137. [Google Scholar] [CrossRef]


Publisher’s Note: MDPI stays neutral with regard to jurisdictional claims in published maps and institutional affiliations. |
© 2021 by the authors. Licensee MDPI, Basel, Switzerland. This article is an open access article distributed under the terms and conditions of the Creative Commons Attribution (CC BY) license (https://creativecommons.org/licenses/by/4.0/).