Article

An Integrative Human Pan-Cancer Analysis of Cyclin-Dependent Kinase 1 (CDK1)

1
Department of Medical Pharmacology and Physiology, University of Missouri School of Medicine, Columbia, MO 65212, USA
2
Center for Precision Medicine and Division of Cardiovascular Medicine, Department of Medicine, University of Missouri School of Medicine, Columbia, MO 65212, USA
*
Author to whom correspondence should be addressed.
These authors contributed equally to this work.
Cancers 2022, 14(11), 2658; https://doi.org/10.3390/cancers14112658
Submission received: 4 April 2022 / Revised: 13 May 2022 / Accepted: 25 May 2022 / Published: 27 May 2022
(This article belongs to the Section Cancer Informatics and Big Data)

Abstract

:

Simple Summary

Cyclin-dependent kinase 1 (CDK1), one of the key regulators of the G2/M checkpoint, is expressed in many cells and plays an important role in cell cycle control. However, CDK1 expression is substantially increased in many tumors of diverse origins and is associated with tumorigenesis. Targeting CDK1 shows promising results for several tumors. However, a systematic and integrative analysis of CDK1 in cancer has not been conducted. The present study aims to use pan-cancer analysis to investigate the relationship, similarities, and differences in genetic and cellular changes associated with CDK1 in various tumors and tumor microenvironments. Our findings elucidate that CDK1 expression increases in more than 20 human tumors and is highly correlated with oncogenic signature gene sets, biological pathways, immune cell infiltration, tumor mutational burden, microsatellite instability, and lower survival rate across multiple tumors. Targeting CDK1 may provide a novel and effective strategy for cancer immunotherapy.

Abstract

Cyclin-dependent kinase 1 (CDK1) is essential for cell division by regulating the G2/M phase and mitosis. CDK1 overexpression can also promote the development and progression of a variety of cancers. However, the significance of CDK1 in the formation, progression, and prognosis of human pan-cancer remains unclear. In the present study, we used The Cancer Genome Atlas database, Clinical Proteomic Tumor Analysis Consortium, Human Protein Atlas, Genotype-Tissue Expression, and other well-established databases to comprehensively examine CDK1 genetic alterations and gene/protein expression in various cancers and their relationships with the prognosis, immune reactivities, and clinical outcomes for 33 tumor types. Gene set enrichment analysis was also conducted to examine the potential mechanisms of CDK1 in tumorigenesis. The data showed that CDK1 mutation was frequently present in multiple tumors. CDK1 expression was significantly increased in various types of tumors as compared with normal tissues and was associated with poor overall and disease-free survival. In addition, CDK1 expression was significantly correlated with oncogenic genes, proteins, cellular components, myeloid-derived suppressor cell infiltration, ESTMATEScore, and signaling pathways associated with tumor development and progression and tumor microenvironments. These data indicate that CDK1 could serve as a promising biomarker for predicting tumor prognosis and a potential target for cancer treatment.

1. Introduction

Cyclin-dependent kinases (CDKs) are families of protein kinases that are critically involved in cell division, migration, gene transcription, and other important cellular and molecular processes [1]. The best-known CDK for cell cycle regulation is CDK1, which was first described in the genetic screening of the cell division cycle in yeast by Hartwell in 1970 [2,3]. CDK1 is also known as cell division cycle 2 homolog A, p34 protein kinase, p34, CDC2, and CDC28A [4]. It is a 34 kDa intracellular protein and expressed in many normal cells and organ systems, especially bone marrow, lymphoid tissues, gastrointestinal tract, skin, kidney, and testis [5]. CDK1 is an important catalytic subunit of the highly conserved protein kinase complex known as M-phase promoting factor (MPF) in both meiosis and mitosis [6]. The primary function of CDK1 is to critically regulate the eukaryotic cell cycle by modulating the centrosome cycle as well as mitotic onset, promoting G2-M transition, and regulating the G1 progress and G1-S transition via association with multiple interphase cyclins [7]. Increased CDK1 expression has been observed in tumor cells, including pancreatic ductal adenocarcinoma, esophageal squamous cell carcinoma, and hepatocellular carcinoma [8,9,10]. Inhibiting CDK1 or CDK1-related signaling pathways could increase the efficacy of cancer treatment by overcoming immune or apoptotic resistance [10,11,12]. In addition, CDK1-specific deletion in the liver decreases tumorigenesis [13]. Although extensive evidence reveals a close relationship between CDK1 and cancer, there is no comprehensive pan-cancer analysis of CDK1 yet.
The development, progression, and prognosis of tumors are very complicated and involve significant changes in the expression and/or mutations of many diverse genes. A large number of human tumors have been screened and evaluated by The Cancer Genome Atlas (TCGA), including ACC, BLCA, BRCA, CESC, CHOL, COAD, DLBC, ESCA, GBM, HNSC, LGG, LIHC, LUAD, LUSC, OV, PAAD, READ, SARC, STAD, THYM, UCEC, UCS, SKCM, KICH, KIRC, KIRP, LAML, MESO, PCPG, PRAD, TGCT, THCA, and UVM (the full names are listed in Table S1) [14,15]. Pan-cancer analysis based on the TCGA database has provided information on the cellular and molecular abnormalities of DNA, RNA, and proteins, their roles, and their relations to clinical prognosis for the 33 tumor types listed above. There are complex interactions among multiple genes and proteins for the initiation and progression of tumors. Gene set enrichment analysis and protein–protein interaction (PPI) networks can provide information on CDK1-related genes and proteins that are associated with oncogenic signaling pathways.
The tumor microenvironment (TME), including immune cells, stromal cells, extracellular matrix, and blood vessels, is critical for the fate of tumors [16]. It has been documented that CDK1 links communications between the TME and tumor cells in hepatocellular carcinoma [17]. JUN-dependent immune checkpoint expression was inhibited by blocking CDK1/2/5 in pancreatic cancer in response to interferon gamma [11]. Targeting immune checkpoints by blocking co-inhibitory molecules or activating co-stimulatory molecules has emerged as one of the important options in cancer treatment [18]. Microsatellite instability (MSI) and tumor mutational burden (TMB) function as predictive biomarkers for favorable outcomes of cancer immunotherapy [19]. However, the role of CDK1 in TME, immune checkpoints, MSI, and TMB is unclear.
The present study was designed to use a pan-cancer analysis to understand the role of CDK1 in human tumor development, progression, and clinical outcomes, as well as potential signaling pathways. The objectives were: (1) to investigate CDK1 gene alterations and gene and protein expression in various tumors; (2) to determine the correlation between CDK1 expression and clinical outcome; (3) to study CDK1-related genes and proteins and their roles in tumorigenesis using gene enrichment analysis; and (4) to determine the role of CDK1 in immune reactivity and immunotherapy.

2. Materials and Methods

2.1. Analyses of Genetic Alterations

The cBioPortal database (https://www.cbioportal.org/, accessed on 12 March 2022) was used to analyze genetic alterations in the CDK1 gene [20]. The “Cancer Types Summary” in the “TCGA PanCancer Atlas Studies” module of cBioPortal was selected to obtain cancer genomic data of CDK1, including copy number alterations (CNAs), alteration frequency, and tumor entity summary. Then, the “mutation” module was selected, and the alteration/mutation types and case numbers were identified and analyzed in a diagram of CDK1 alteration sites.

2.2. Analyses of Gene Expression

The difference in the expression of CDK1 between tumor and normal tissues was examined from the “Box Plot” module in the “Expression analysis” of Gene Expression Profiling Interactive Analysis version 2 (GEPIA2) database (http://gepia2.cancer-pku.cn/, accessed on 12 March 2022) with the default parameters, log2FC cutoff = 1, p-value cutoff = 0.01, and matched TCGA normal and GTEx data [21]. The “Pathological Stage Plot” module of “Expression DIY” in the GEPIA2 website was used to generate violin plots of CDK1 gene expression in tumors at different disease stages. The profiles of CDK1 gene expression in different tissues were acquired from the Human Protein Atlas (HPA) database (https://www.proteinatlas.org/, accessed on 13 March 2022).

2.3. Analyses of Protein Expression

The Clinical Proteomic Tumor Analysis Consortium (CPTAC) Confirmatory/Discovery module of the UALCAN database (http://ualcan.path.uab.edu/analysis-prot.html, accessed on 12 March 2022) was used to acquire total CDK1 protein expression in human tumors and normal tissues [22]. The HPA database was used to obtain the profiles of CDK1 protein expression in different tissues and pathological sections for analysis.

2.4. Analyses of Prognosis and Survival

The “Survival Map” and “Survival analysis” modules of GEPIA2 were selected to evaluate the relationship between overall survival (OS) and disease-free survival (DFS) and CDK1 expression in tumors based on the TCGA database. According to the median value of CDK1 expression with 50% cutoff-high and 50% cutoff-low, patients were divided into high and low CDK1 expression groups. The R packages “rms” and “survival” in the R software (version 3.6.3, R Foundation for Statistical Computing, Vienna, Austria) were used for prognosis and survival analysis using prognostic nomograms [23].

2.5. Analyses of CDK1-Related Genes and Proteins

The “Similar Genes Detection” module of GEPIA2 was used to examine the top 100 CDK1-correlated target genes based on the TCGA tumor cohort. Then, the top 5 genes were selected to conduct Pearson correlation analysis with CDK1 using the “correlation analysis” module of GEPIA2. Additionally, a heatmap of the correlation between the selected top 5 genes and CDK1 in different tumors was analyzed using Spearman’s correlation test in the “Gene_Corr” module of TIMER2.
Protein–protein interactions with CDK1 were analyzed using the STRING tool (https://string-db.org/, accessed on 13 March 2022). An estimated 50 experimentally determined proteins that were related to CDK1 were identified in the PPI network. The corresponding genes of these 50 proteins were named CDK1-interacted genes for analysis in the present study.
Intersection analysis of CDK1-interacted and CDK1-correlated genes was performed using Venn Diagram (http://bioinformatics.psb.ugent.be/webtools/Venn/, accessed on 13 March 2022) [24]. Gene Ontology (GO) enrichment analysis (biological processes, cellular components, and molecular function) and Kyoto Encyclopedia of Genes and Genomes (KEGG) pathway analysis were conducted using the R package “clusterProfiler” in the R software after combining with the datasets of CDK1-related genes.

2.6. Analyses of Gene Set Enrichment

Gene set enrichment analysis (GSEA) based on the TCGA tumor database between CDK1 high- and low-expression groups was performed to determine the biological and oncogenic signaling pathways. MSigDB H (hallmark gene sets) and C6 (oncogenic signature gene sets) enrichment analyses were conducted using the R package “clusterProfiler” in the R software [25]. Enrichment was considered significant when |NES| > 1, p.adjust < 0.05, and FDR < 0.25.

2.7. Analyses of Cancer Immune Reactivity

The ESTIMATE, Immune, and Stromal scores of CDK1 in tumors were conducted using SangerBox (http://sangerbox.com/, accessed on 13 March 2022) [26]. The “Immune Association” module of TIMER2 was selected to explore the association between CDK1 expression and immune infiltration of myeloid-derived suppressor cells (MDSCs) in different tumors in the TCGA database. In addition, correlations between various immune checkpoints, MSI, and TMB with CDK1 expression in various tumors in the TCGA database were analyzed using SangerBox. The R package “GSVA” in the R software was used to determine the correlation between CDK1 expression and infiltration of 24 common immune cells in tumors of the TCGA dataset by single-sample GESA (ssGESA) [27,28]. Cellular heterogeneity of CDK1 expression in tumors was conducted using Cancer Single-cell Expression Map (https://ngdc.cncb.ac.cn/cancerscem/index, last accessed on 30 April 2022) [29].

2.8. Statistical Analysis

The Wilcoxon test was used to analyze data on gene expression from GEPIA2 based on TCGA and GTEx databases. Student’s t-test was used to analyze protein expression data from UALCAN. The log-rank test was used to analyze the survival data from GEPIA2. The R package “clusterProfiler” in the R software was used to analyze GO, KEGG pathway, MSigDB H, and C6 enrichment. Purity-adjusted Spearman’s rho was used to analyze correlation data from TIMER2. Pearson’s correlation coefficients were used to analyze correlation data from SangerBox. A difference was reported as statistically significant when p < 0.05.

3. Results

3.1. Genetic Variation Analysis of CDK1 in Tumors

CDK1 genetic alterations in various tumors in the TCGA database were identified and are summarized in Figure 1A. The highest frequency of CDK1 genetic alteration (7.02%) was observed in patients with uterine carcinosarcoma, with amplification as the primary genetic alteration. Mutation and deep deletion were observed in cutaneous melanoma, which had the second highest frequency of CDK1 genetic alterations (3.15%). The mutation types, sites, and case numbers of CDK1 in different tumors are shown in Figure 1B. The most common type of mutation was missense, followed by truncation. The transcriptional expression of CDK1 in structural variants of amplification, gain, diploid, shallow deletion, and deep deletion in various tumors, such as BRCA, STAD, SKCM, COAD, UCEC, and USC, is shown in Figure S1.

3.2. CDK1 Gene and Protein Expression in Tumors

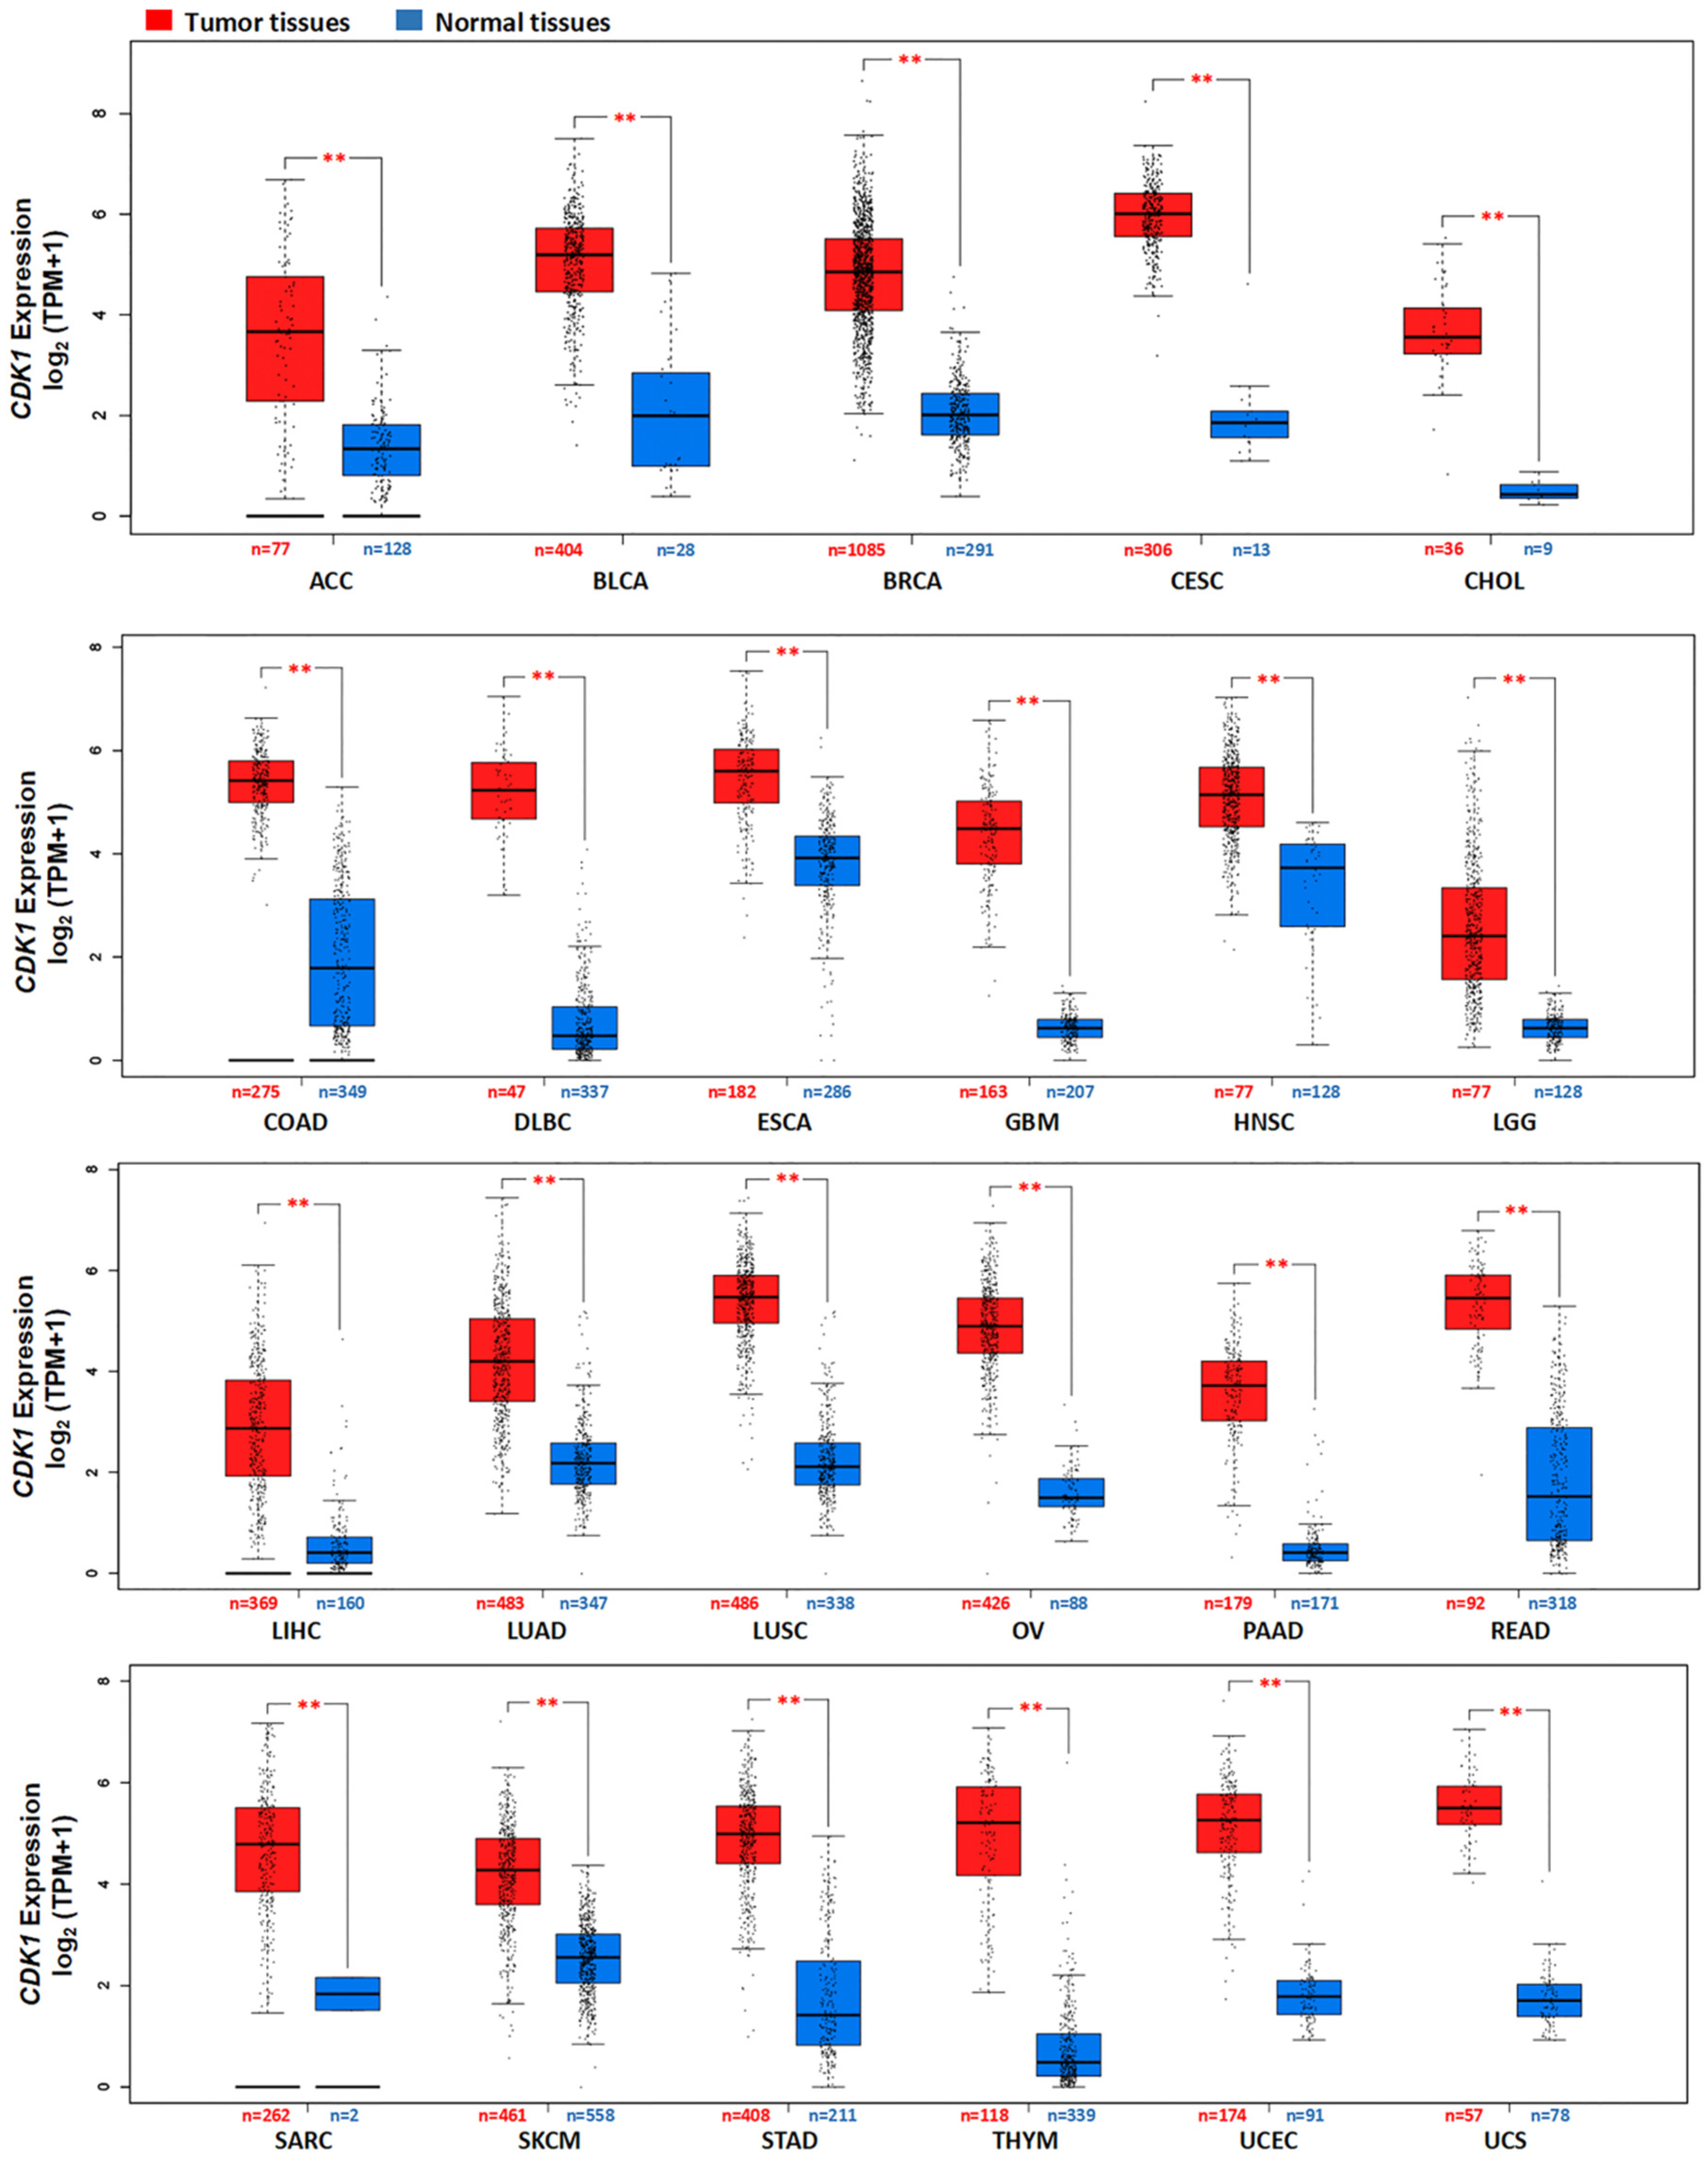
The gene expression of CDK1 in various normal tissues is shown in Figure S2A. It was found that the highest CDK1 RNA expression was observed in the bone marrow and lymphoid tissue. The consensus dataset consisting of TCGA and GTEx databases revealed that the level of CDK1 gene expression was dramatically increased in most tumor tissues when compared to normal tissues, including ACC, BLCA, BRCA, CESC, CHOL, COAD, DLBC, ESCA, GBM, HNSC, LGG, LIHC, LUAD, LUSC, OV, PAAD, READ, SARC, SKCM, STAD, THYM, UCEC, and UCS (Figure 2 and Figure S3). There was a significant correlation between the gene expression of CDK1 and the stages of some tumors, such as KIRC, BRCA, KIRP, LUAD, ACC, and KICH (Figure S4). However, the level of CDK1 gene expression was significantly decreased in LAML when compared to normal tissues (Figure S5).
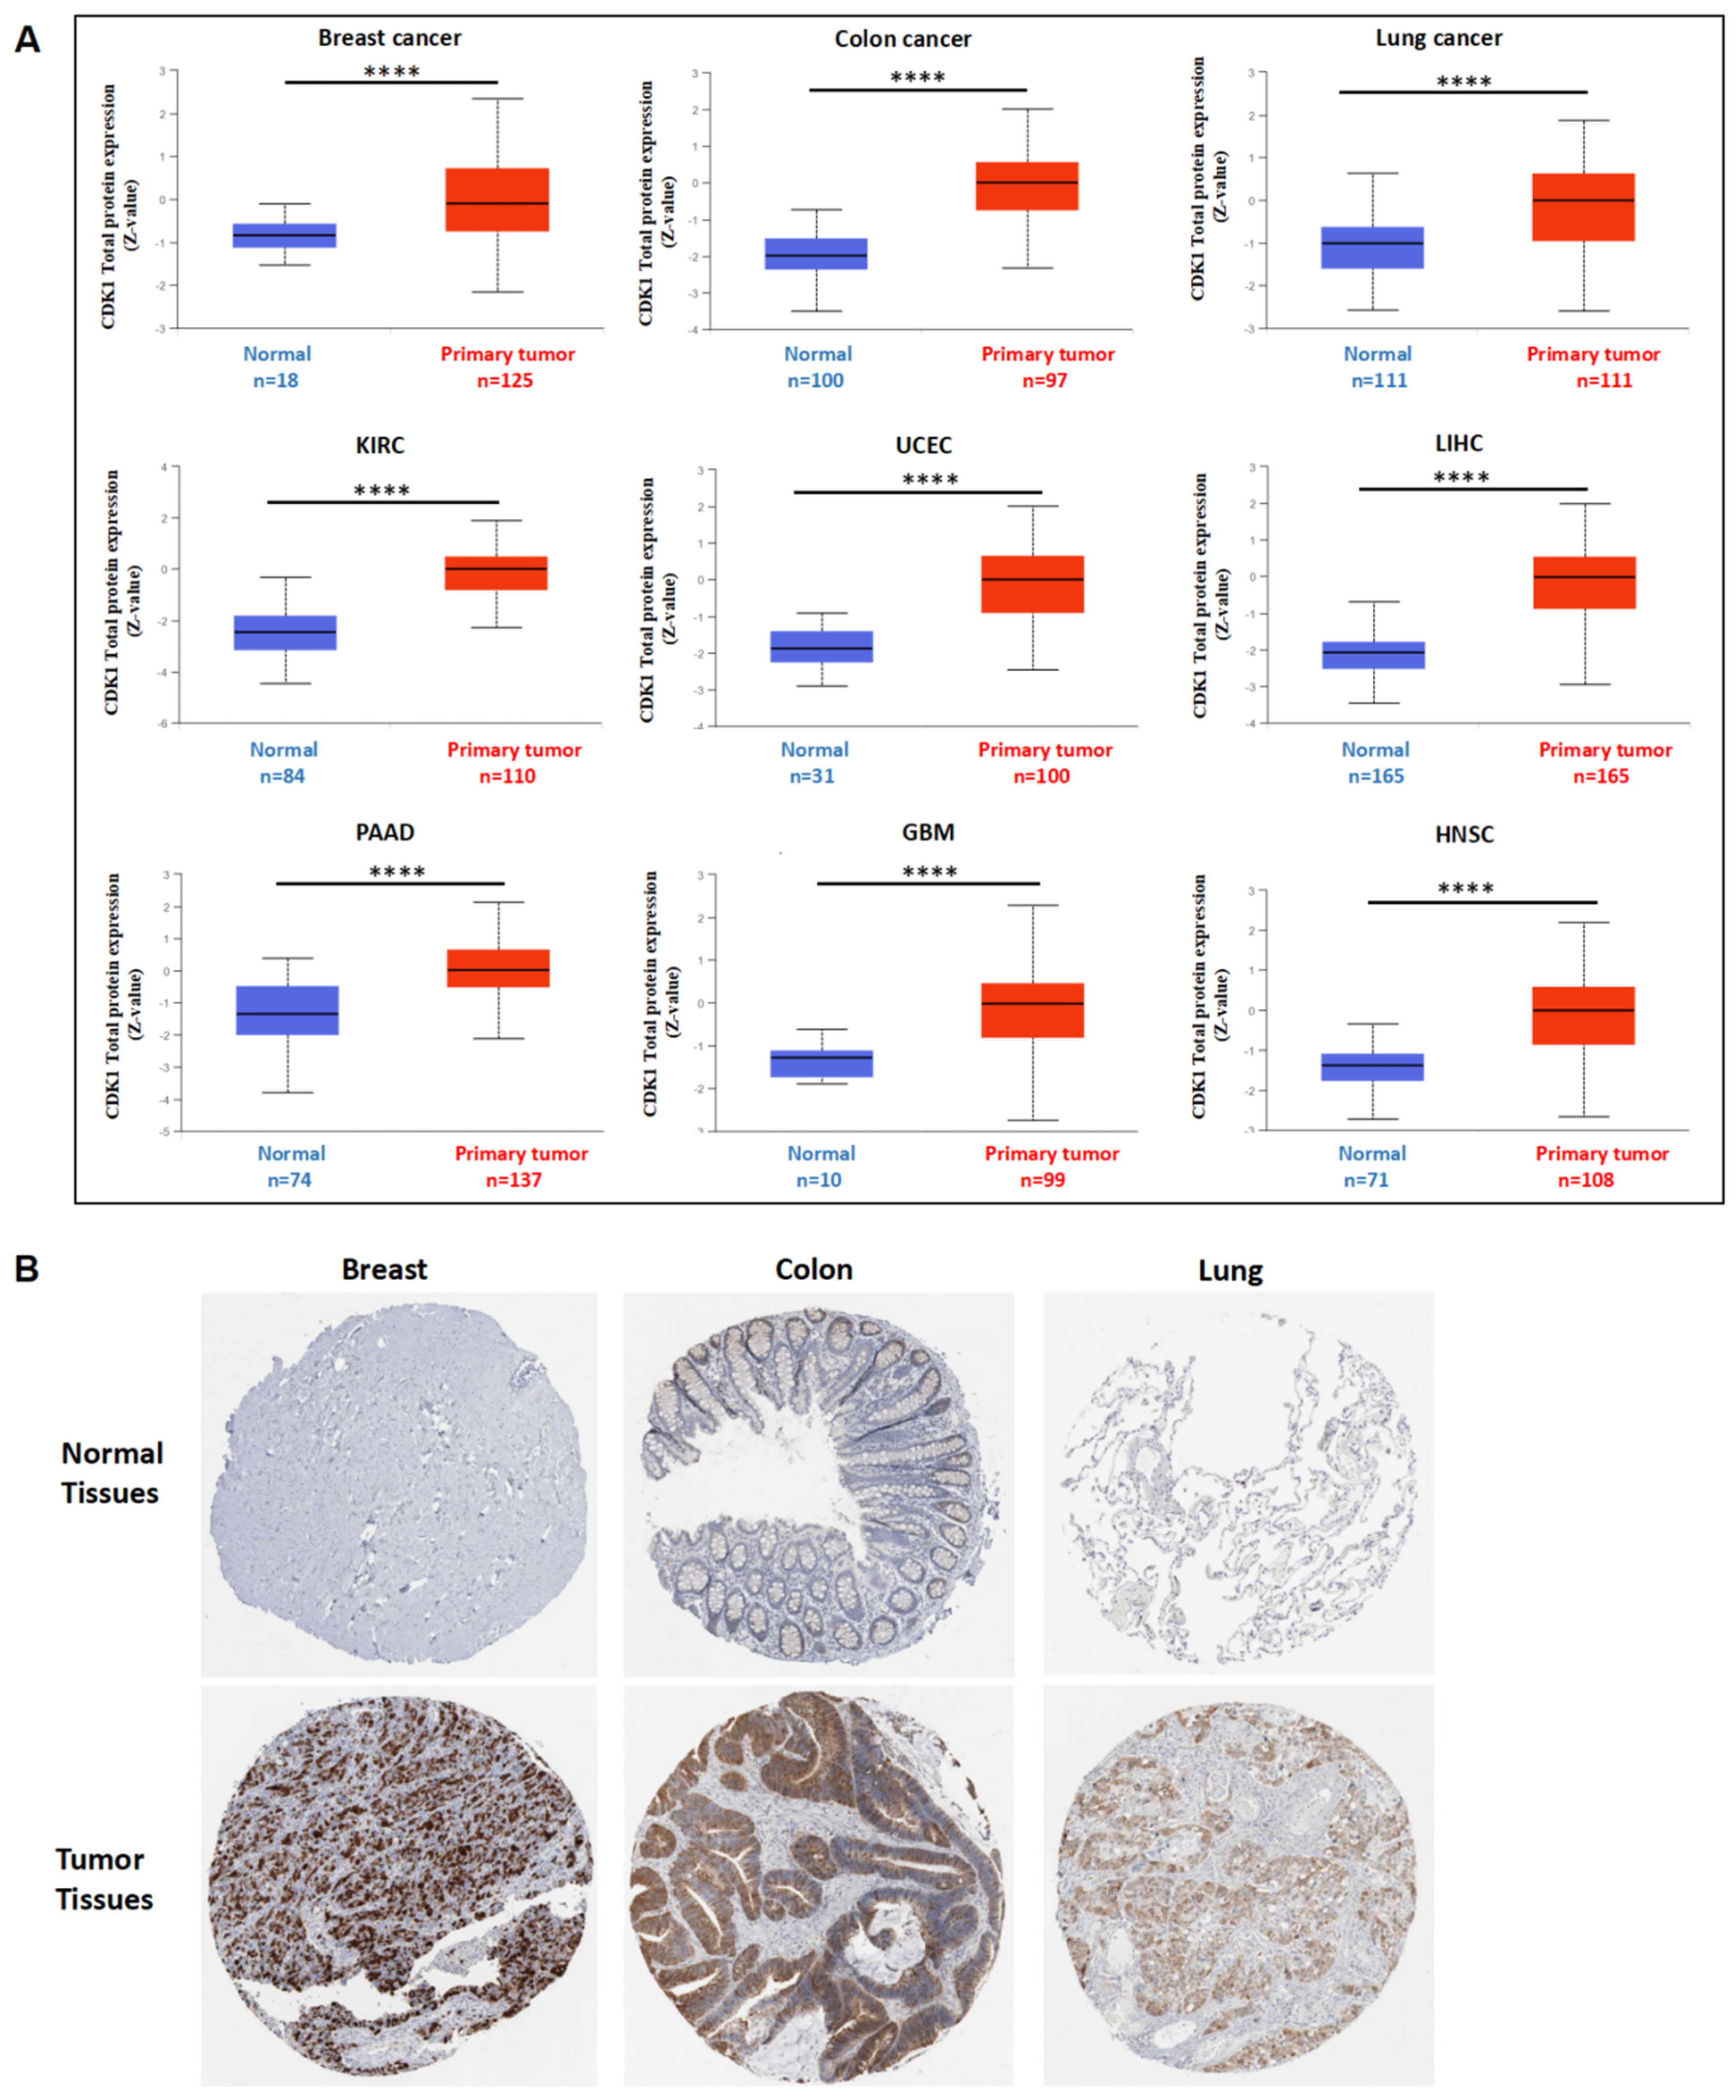
The highest level of CDK1 protein expression was observed in the testis, lymph nodes, and tonsil (Figure S2B). The total protein expression of CDK1 was significantly higher in some primary tumors, including breast cancer, colon cancer, lung cancer, KIRC, UCEC, LIHC, PAAD, GBM, and HNSC, as compared to normal tissues (Figure 3A). Immunohistochemistry staining also demonstrated a significant increase in CDK1 protein in breast cancer, colon cancer, and lung cancer tissues from patients but very minimal CDK1 protein in healthy human tissues (Figure 3B).

3.3. Survival Analysis

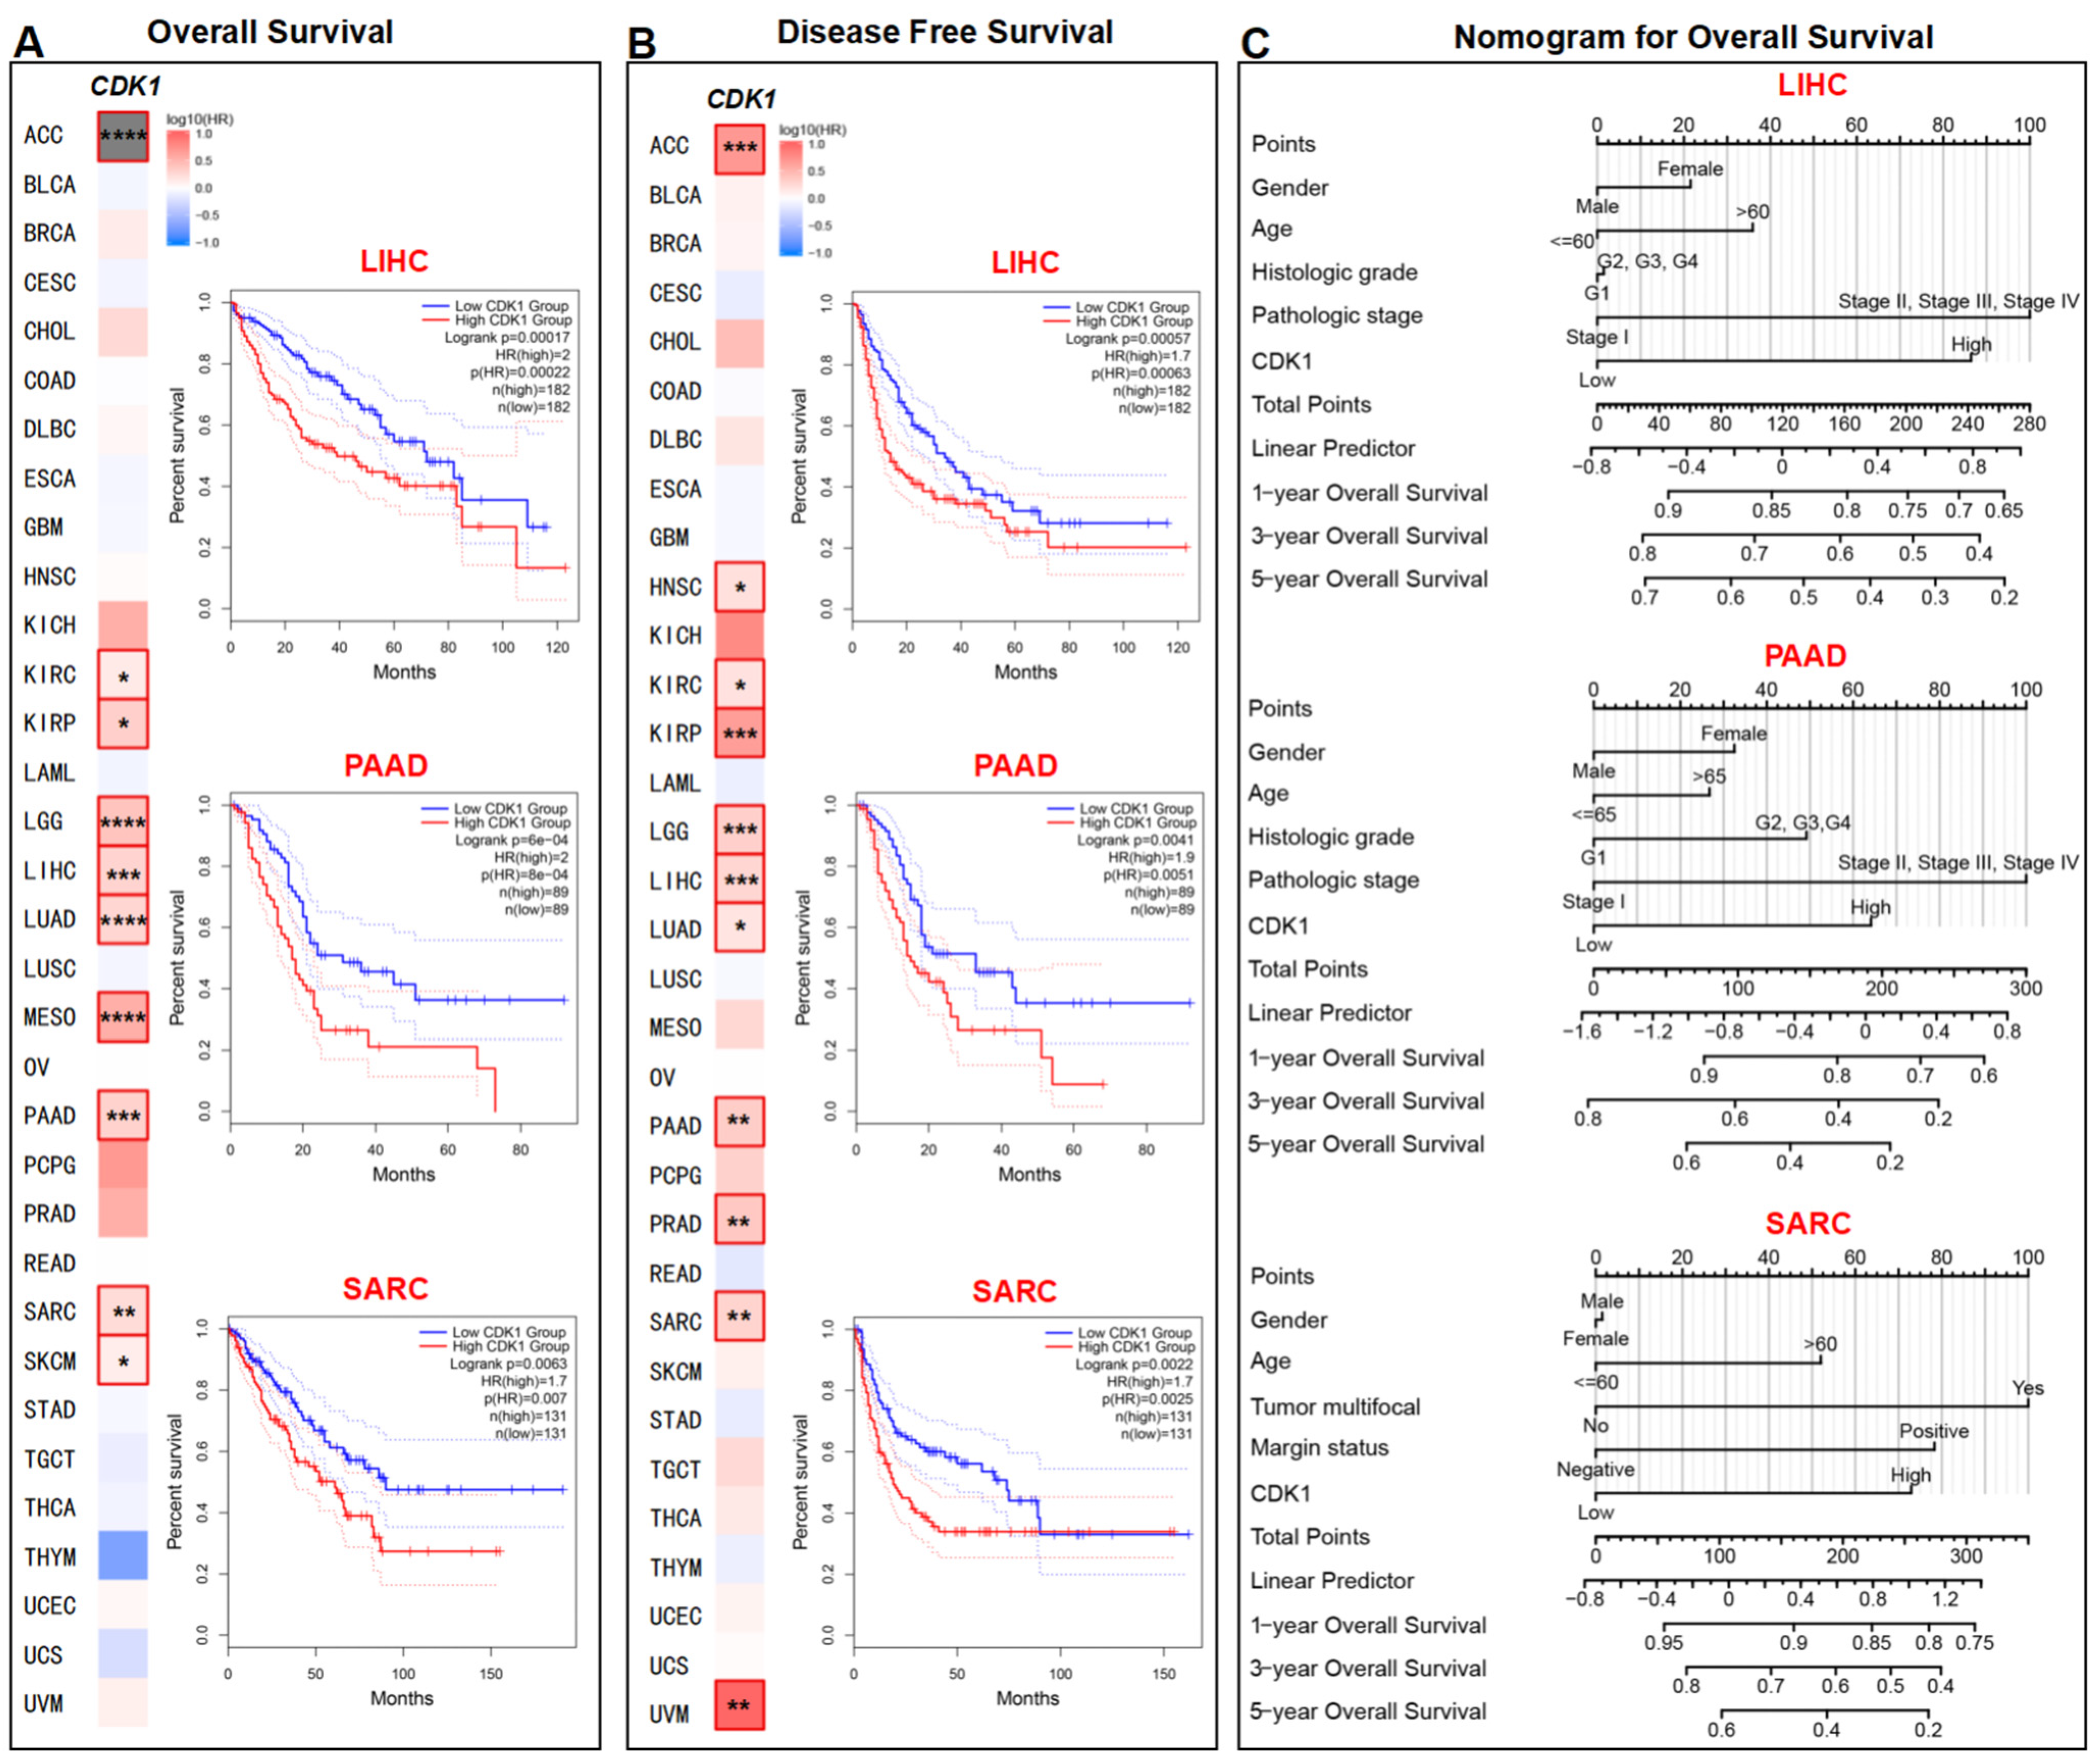
To investigate the relationship between CDK1 expression and the prognosis of the tumor, the TCGA dataset was separated into two groups: one with high CDK1 expression and the other with low CDK1 expression. As shown in Figure 4A and Figure S6, tumors with high CDK1 expression, including ACC, KIRC, KIRP, LGG, LIHC, LUAD, MESO, PAAD, SARC, and SKCM, were related to poor overall survival (OS) (p < 0.05). High CDK1 expression was also associated with poor disease-free survival (DFS) for ACC, HNSC, KIRC, KIRP, LGG, LIHC, LUAD, PAAD, PRAD, SARC, and UVM (Figure 4B, p < 0.05). Nomograms were used to predict one-, three-, and five-year OS of LIHC, PAAD, and SARC. The corresponding clinical and pathological points for each patient, such as gender, age, histological grade, tumor stage, and expression of CDK1, were calculated and added together to obtain the total points. A higher number of total points served as a predictor for poorer OS. As shown in Figure 4C, high expression of CDK1 contributed to a large portion of the total points for LIHC, PAAD, and SARC.

3.4. CDK1-Related Genes and Protein–Protein Interactions

CDK1-related gene analysis and protein–protein interaction (PPI) analysis were performed to explore the potential mechanisms of CDK1 in tumorigenesis. The top 100 CDK1-correlated genes were identified (Table S2), and the top five correlated genes were obtained and are shown in Figure 5A: cyclin A2 (CCNA2, R = 0.77), centrosomal protein 55 (CEP55, R = 0.76), kinesin family member 11 (KIF11, R = 0.8), kinesin family member 4A (KIF4A, R = 0.76), and ZW10 interacting kinetochore protein (ZWINT, R = 0.82). In addition, there was a significant positive correlation between these top five genes and CDK1 in all tumor types from the TCGA database (Figure 5B). The top 50 CDK1-interacted genes were also identified (Table S2). Analysis of protein–protein interactions revealed a total of 50 proteins that experimentally interacted with CDK1, with the top five node degree proteins being: CDK2, TEN1-CDK3, CCNB1, CCNA2, and CDKN1 (Figure 5C).
Cross-analysis of CDK1-interacted genes and CDK1-correlated genes revealed 10 common member genes: CCNA2, CCNB1, CCNB2, cell division cycle 20 (CDC20), CDC25C, cyclin-dependent kinase inhibitor 3 (CDKN3), CDC28 protein kinase regulatory subunit 1B (CKS1B), enhancer of zeste 2 polycomb repressive complex 2 subunit (EZH2), and KIF11 (Figure 5D). The GO enrichment analysis of the two combined datasets indicated that the CDK1-interacted or -correlated genes were related to the biological processes of organelle fission, nuclear division, mitotic nuclear division, and cell cycle regulation (Figure 5E); to the cellular structures of the spindle, chromosome, centromeric region, condensed chromosome, and kinetochore (Figure 5F); and to the cellular functions of tubulin/microtubule binding, ATPase activity, serine/threonine kinase activity, and protein kinase regulator activity (Figure 5G). In addition, KEGG pathway analysis showed that CDK1 was involved in the regulation of cellular senescence, the cell cycle, viral carcinogenesis, p53 signaling, and FoxO signaling, thus potentially contributing to oncogenesis (Figure 5H).

3.5. Gene Set Enrichment Analysis (GSEA)

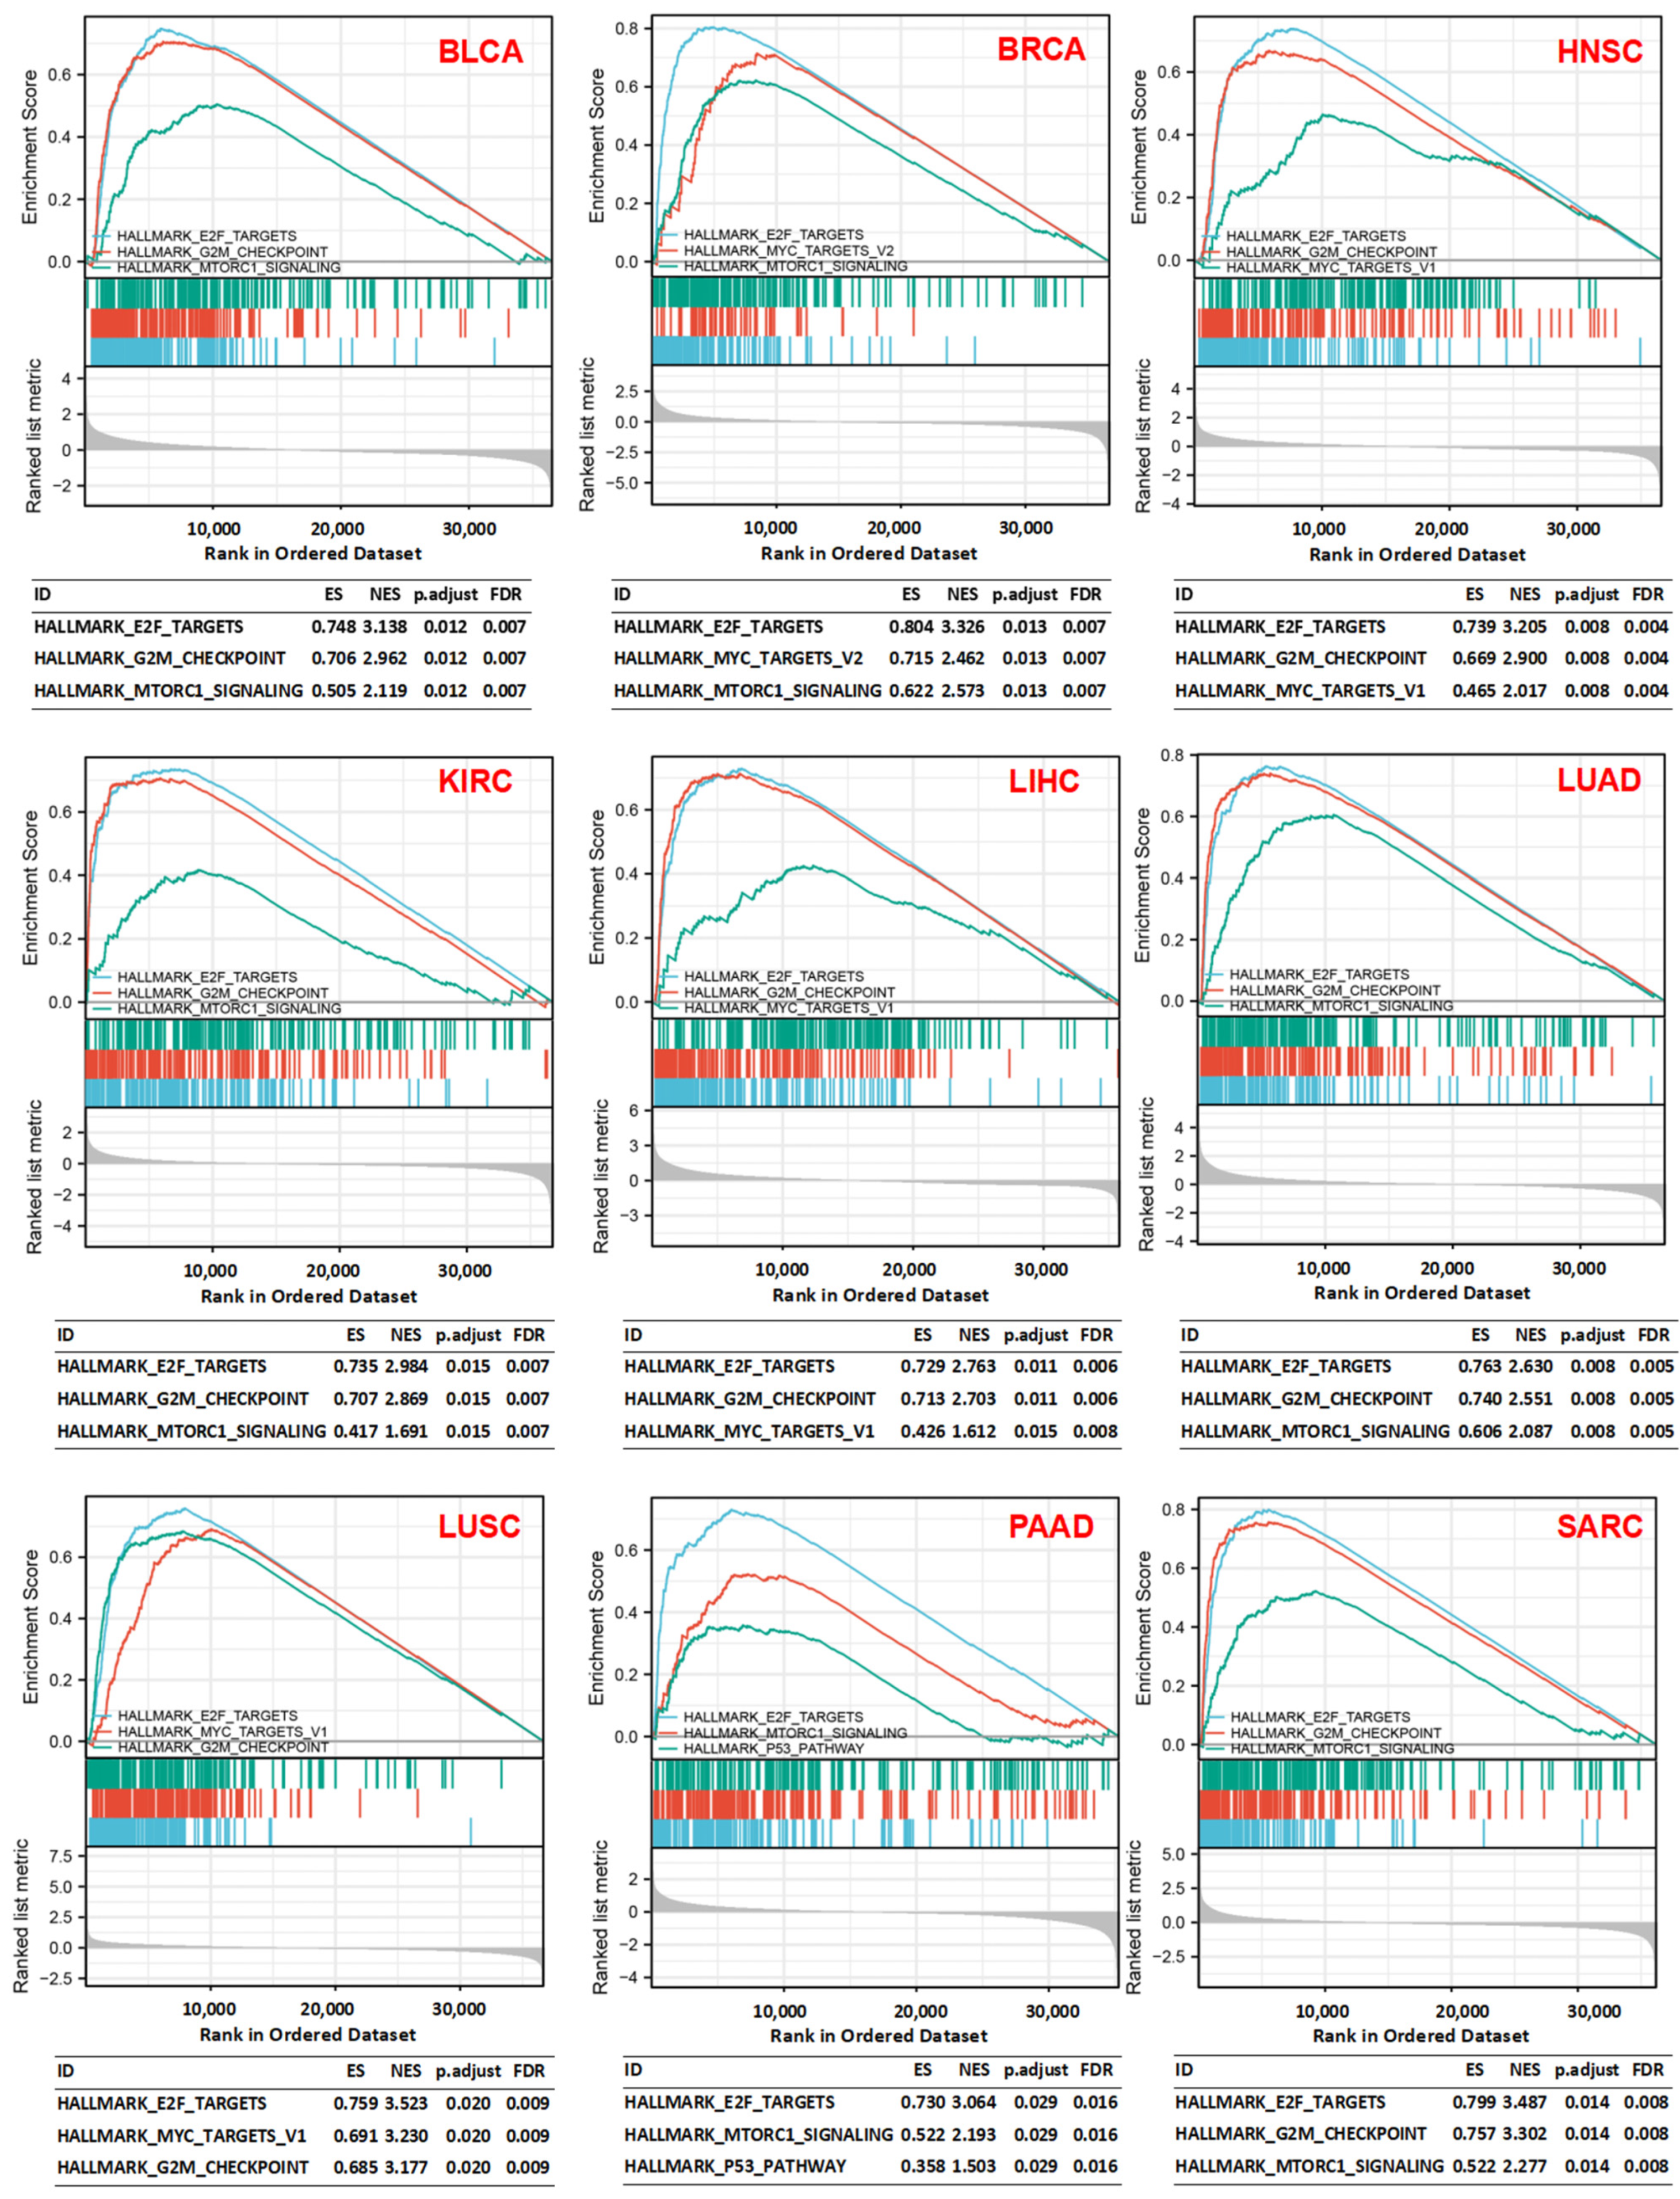
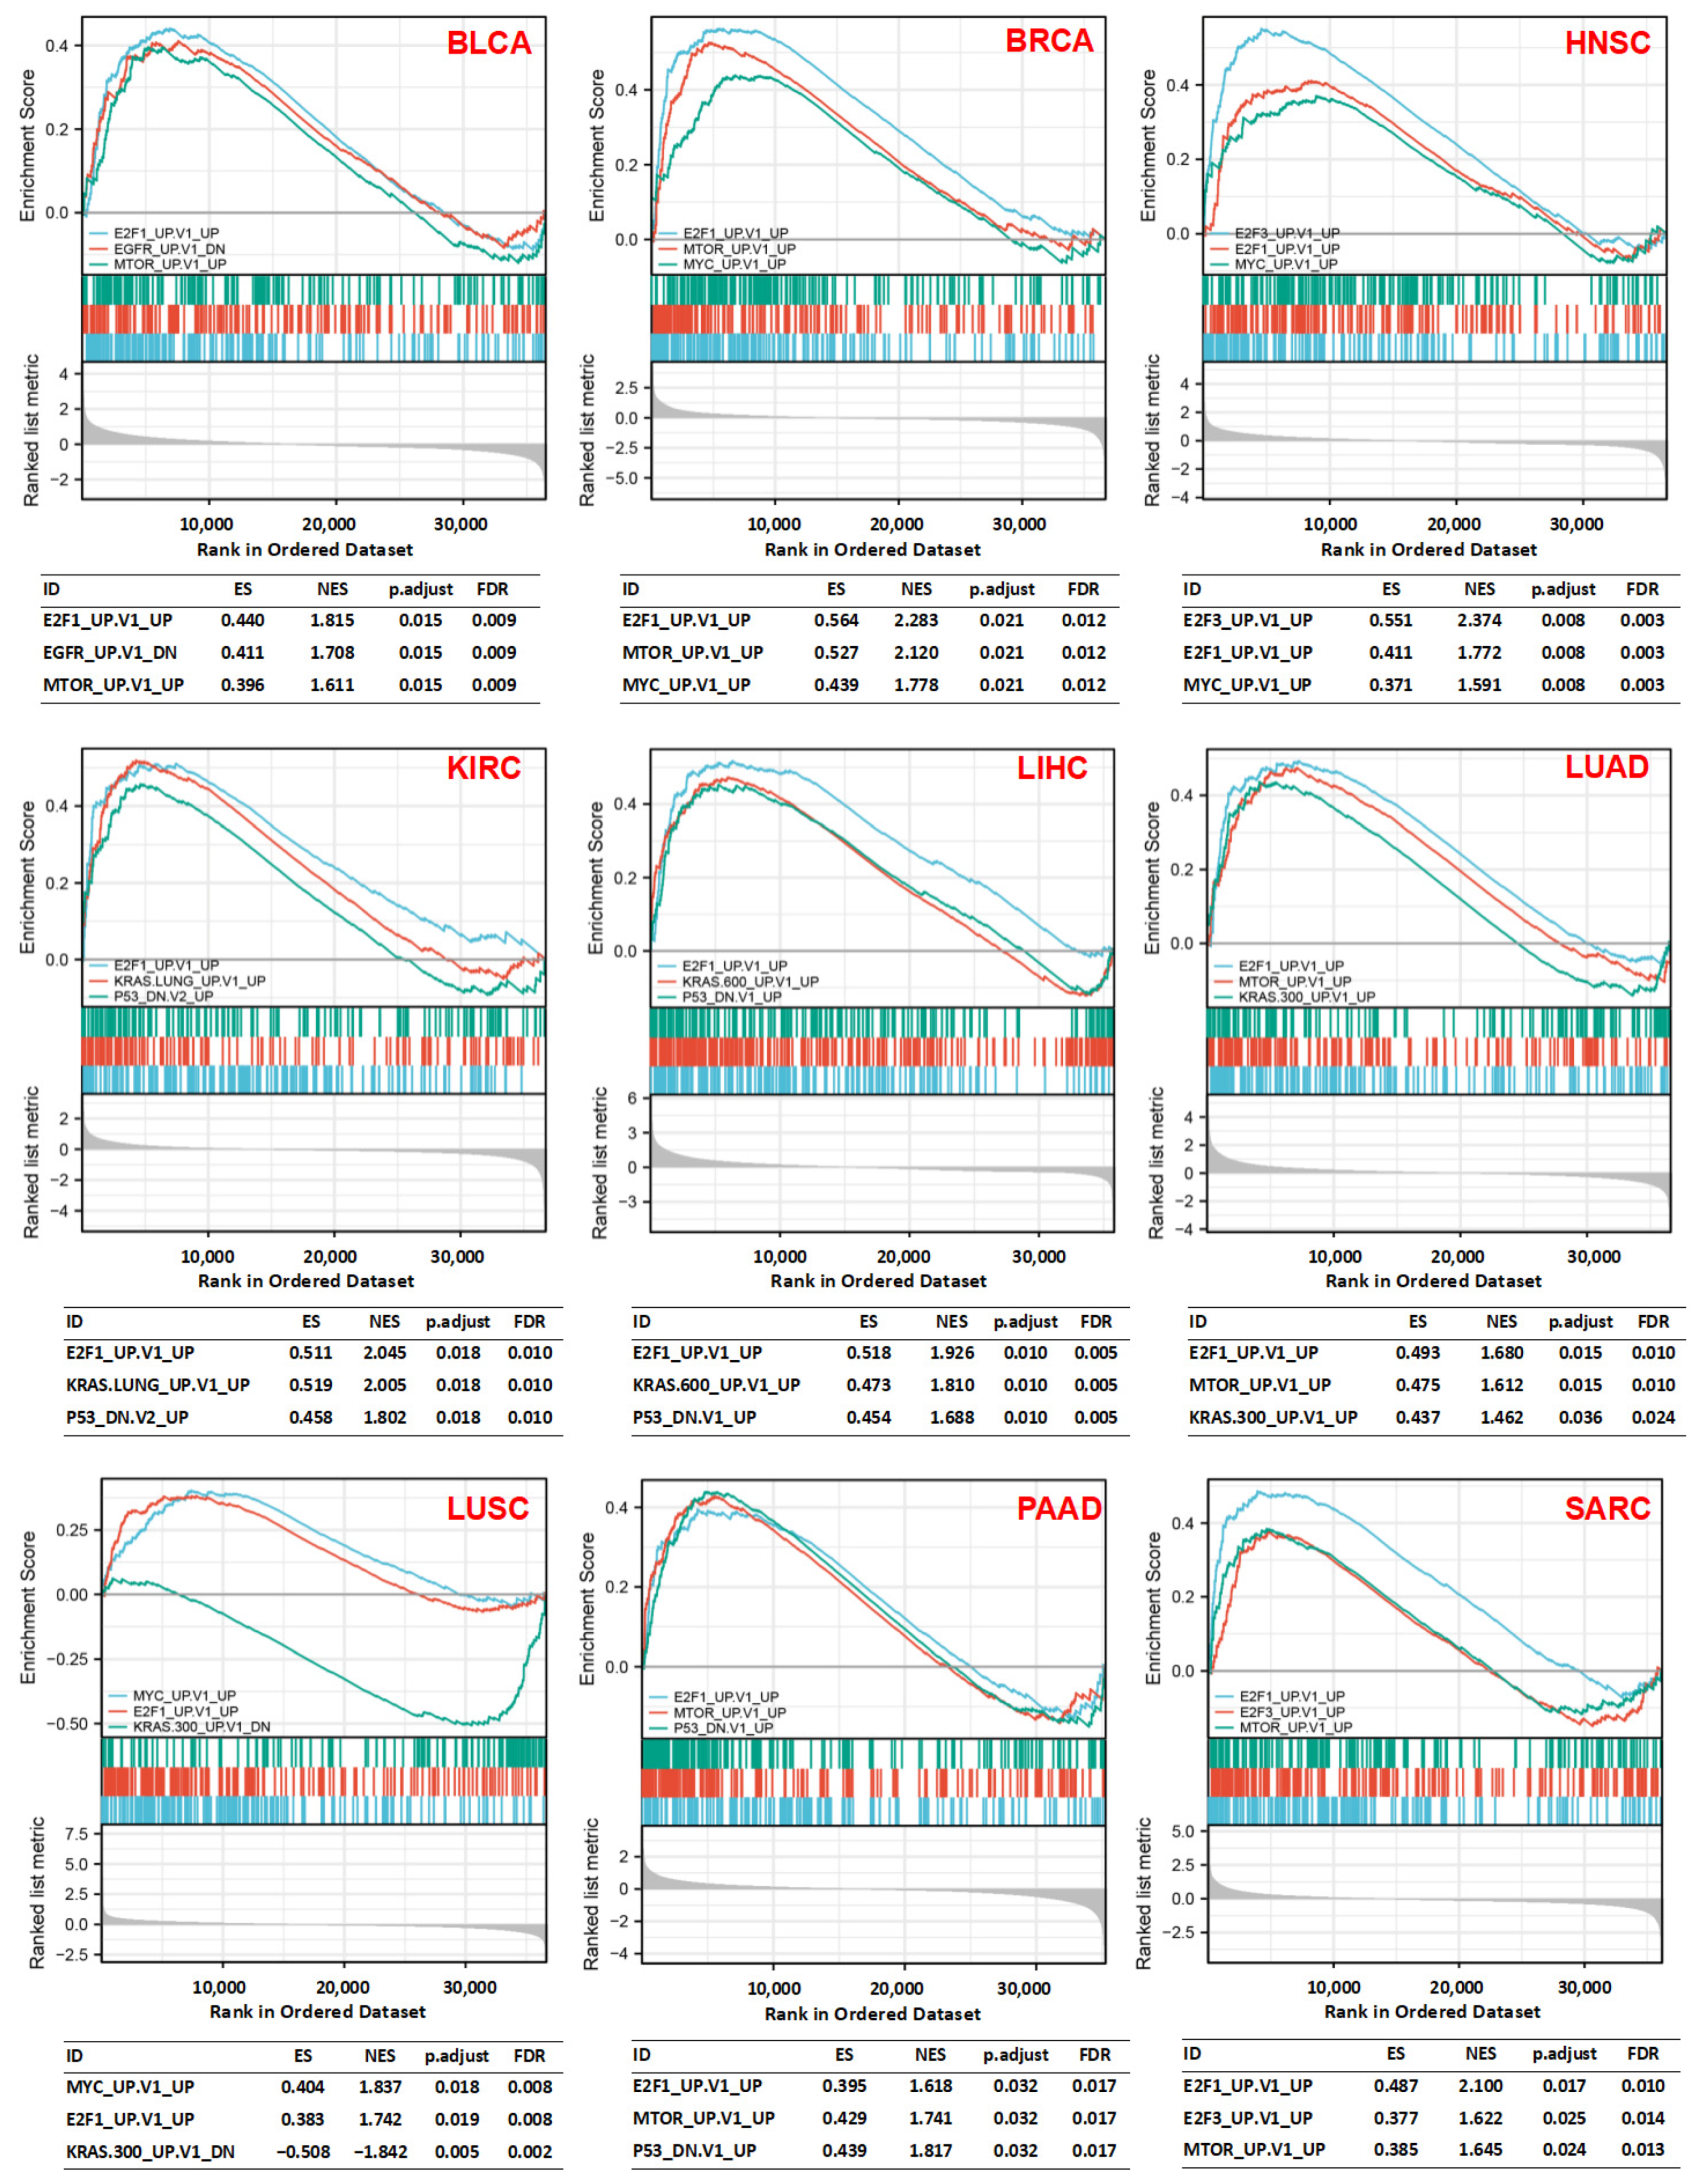
Analysis of H hallmark gene sets and C6 oncogenic signature gene sets in the molecular signatures database (MSigDB) demonstrated that coherent expression and cellular pathways were often dysregulated in cancer cells based on the levels of CDK1 expression. It was found that high CDK1 expression was associated with cell-cycle-related targets of E2F transcription factors, the G2M DNA damage checkpoint, mTORC1 signaling, MYC target genes, and the P53 pathway in various tumors, such as BLCA, BRCA, HNSC, KIRC, LIHC, LUAD, LUSC, PAAD, and SARC (Figure 6). The C6 enrichment analysis showed that high expression of CDK1 was associated with genes that were upregulated with the overexpression of oncogenes, such as E2F1, MTOR, MYC, E2F3, and KRAS, and genes that were upregulated with the knockdown of the tumor suppressor gene P53. However, low expression of CDK1 was related to genes that were downregulated by the overexpression of an oncogenic form of KRAS (Figure 7).

3.6. CDK1 and Immune Reactivity

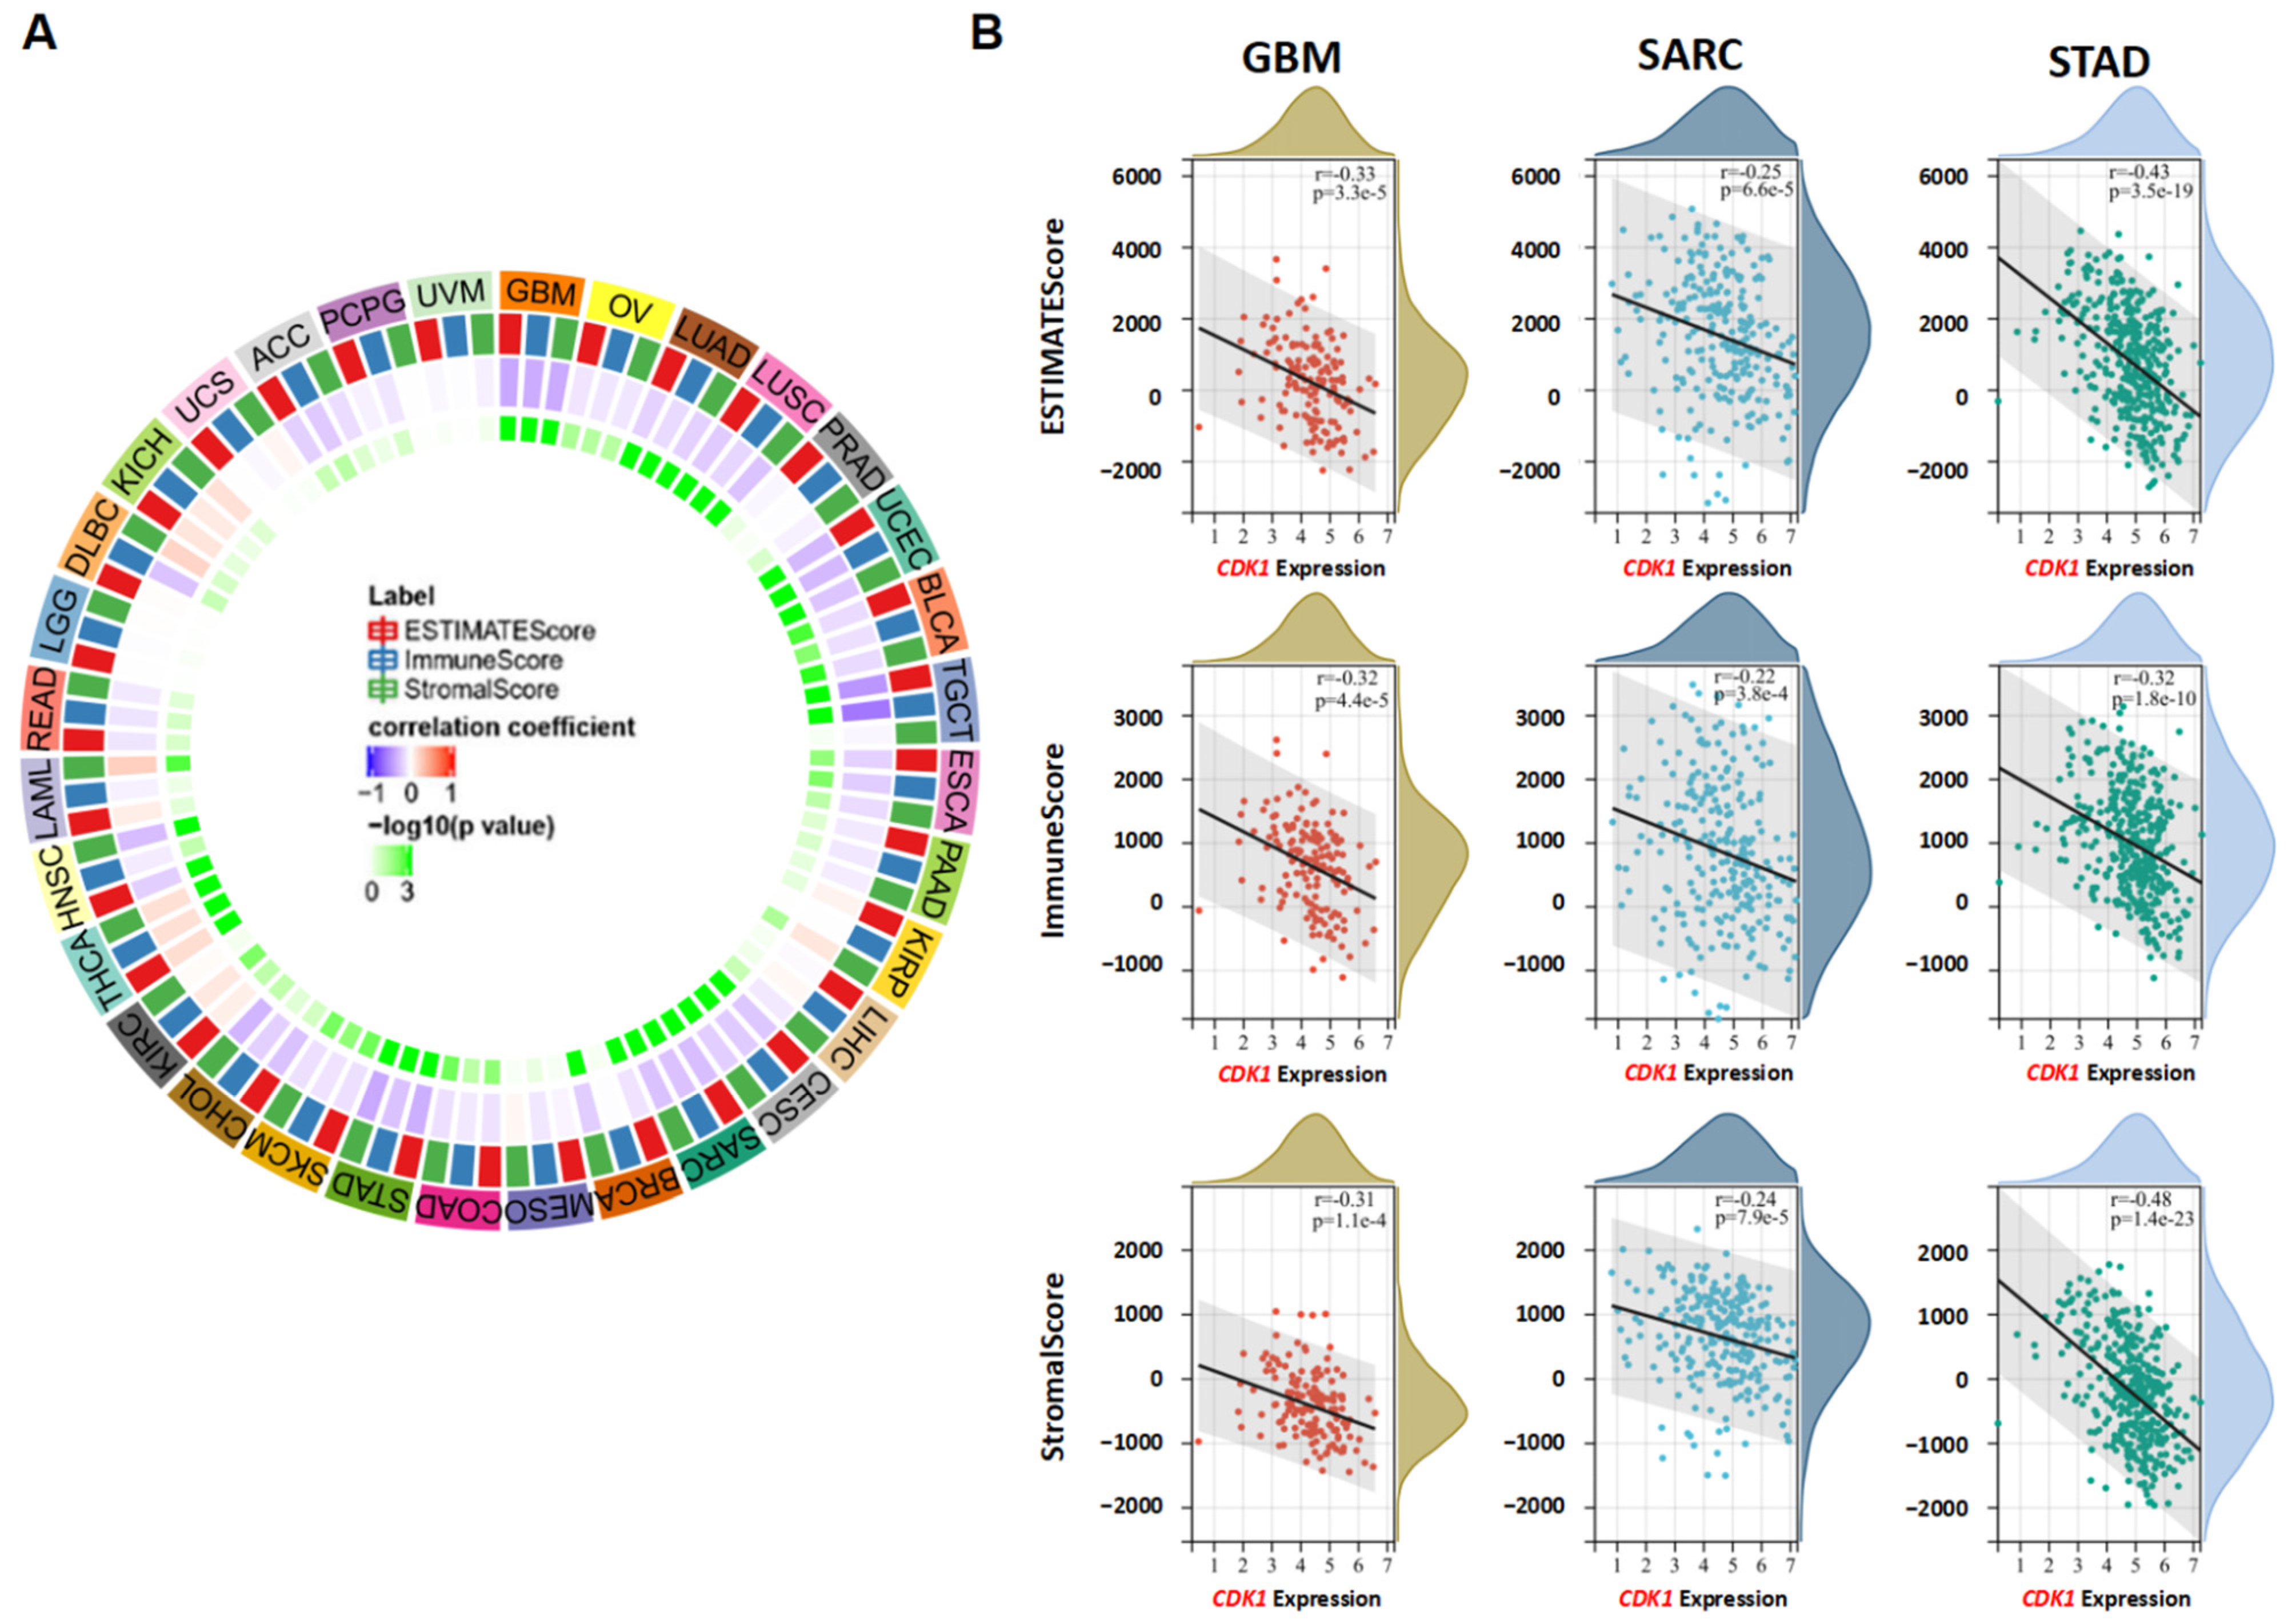
The correlations between CDK1 expression and the ESTIMATEScore, the ImmuneScore, and the StromalScore were estimated using SangerBox in diverse tumor types from the TCGA database (Table S3). The EstimateScore is the sum of the ImmuneScore and StromalScore. A lower ImmuneScore or StromalScore indicates a lower percentage of immune cells or stromal cells in the core and the invasive margin of the tumor [26]. It was found that CDK1 expression was negatively correlated with the ESTIMATEScore, the ImmuneScore, and the StromalScore in GBM, UCEC, STAD, and SKCM (r < −0.3, p < 0.05) (Figure 8A). Conversely, CDK1 expression was positively associated with these scores in KIPAN (KICH + KIRC + KIRP) (r > 0.3, p < 0.05). Representative scatter plots display a significant and negative correlation between the expression of CDK1 and the ESTIMATEScore, the ImmuneScore, and the StromalScore in GBM, SARC, and STAD (Figure 8B).
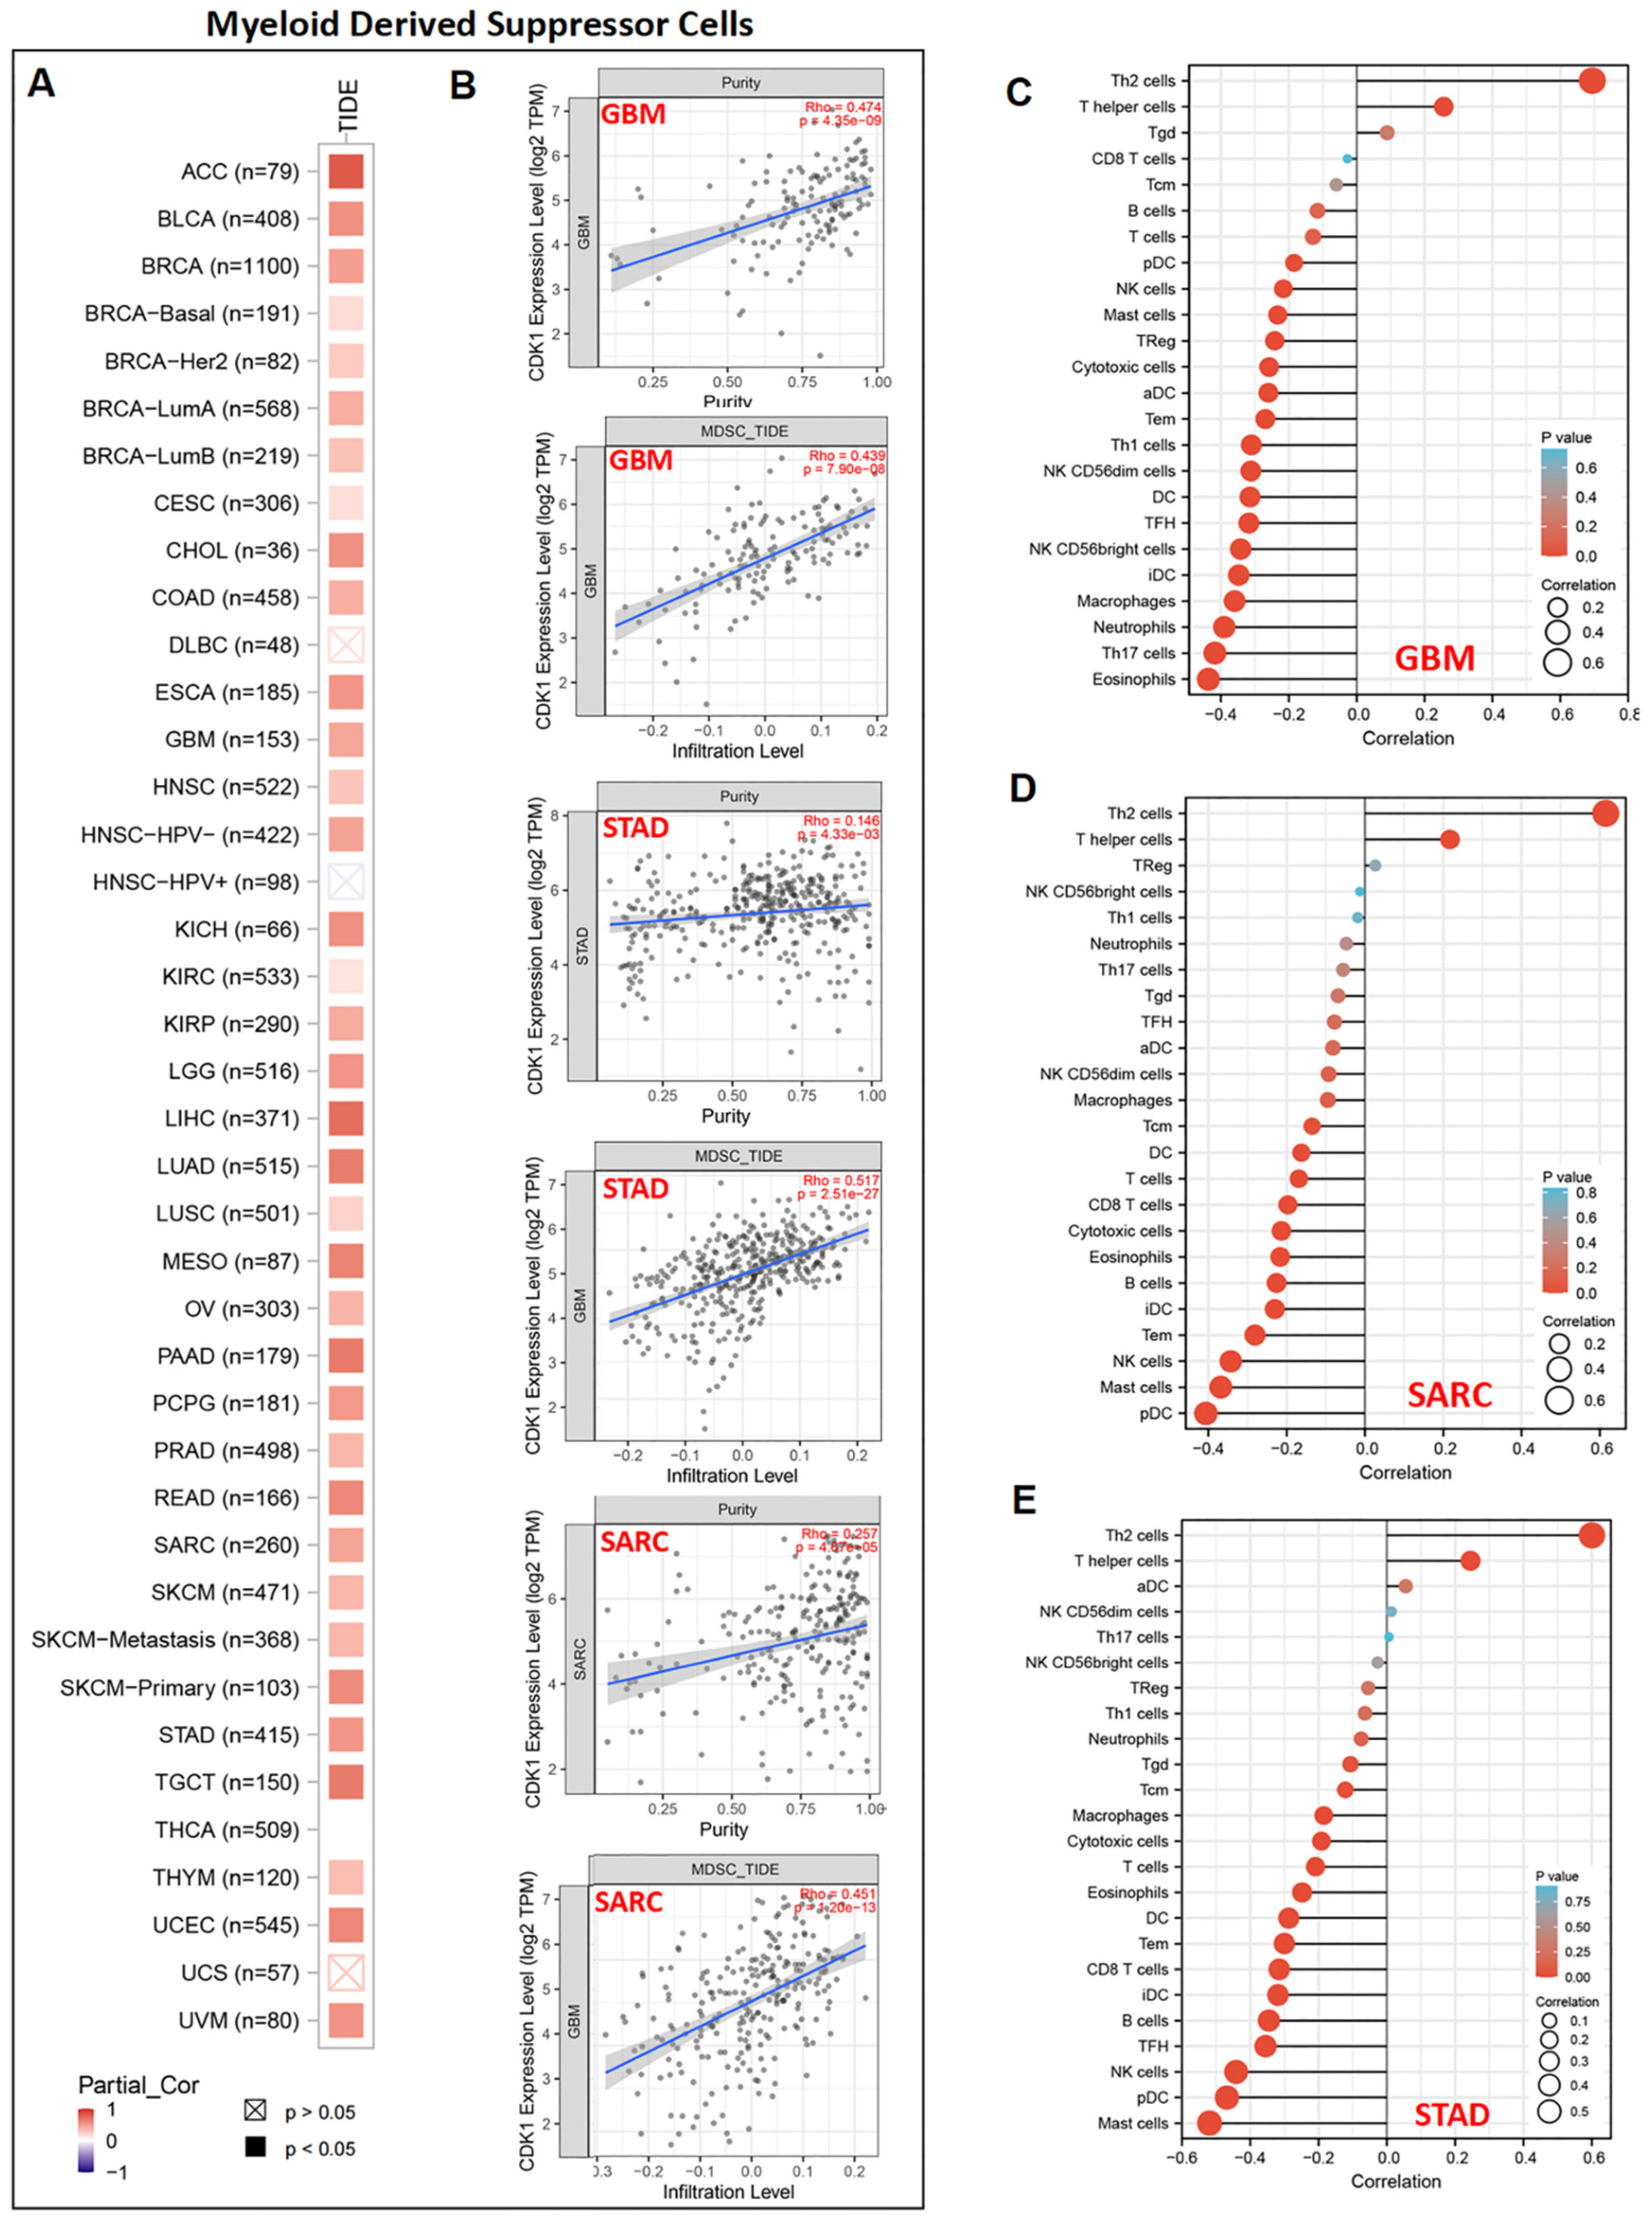
The correlation between MDSC infiltration and the expression of CDK1 was evaluated based on the TCGA database. As shown in Figure 9A, a significant and positive correlation between CDK1 expression and MDSC infiltration was observed in almost all tumors, except for DLBC, HNSC-HPV+, and UCS. Representative scatter plots show that the purity and infiltration levels of MDSCs were significantly increased when the expression of CDK1 was increased in GBM, STAD, and SARC (Figure 9B). In addition, the representative lollipop chart of immune infiltration demonstrates that the expression of CDK1 in GBM, SARC, and STAD was positively related to Th2 cells and negatively associated with most of the immune cells, such as eosinophils, pDC, and mast cells (Figure 9C–E). Single-cell data showed that CDK1 was mainly expressed in malignant cells (Figure 10).
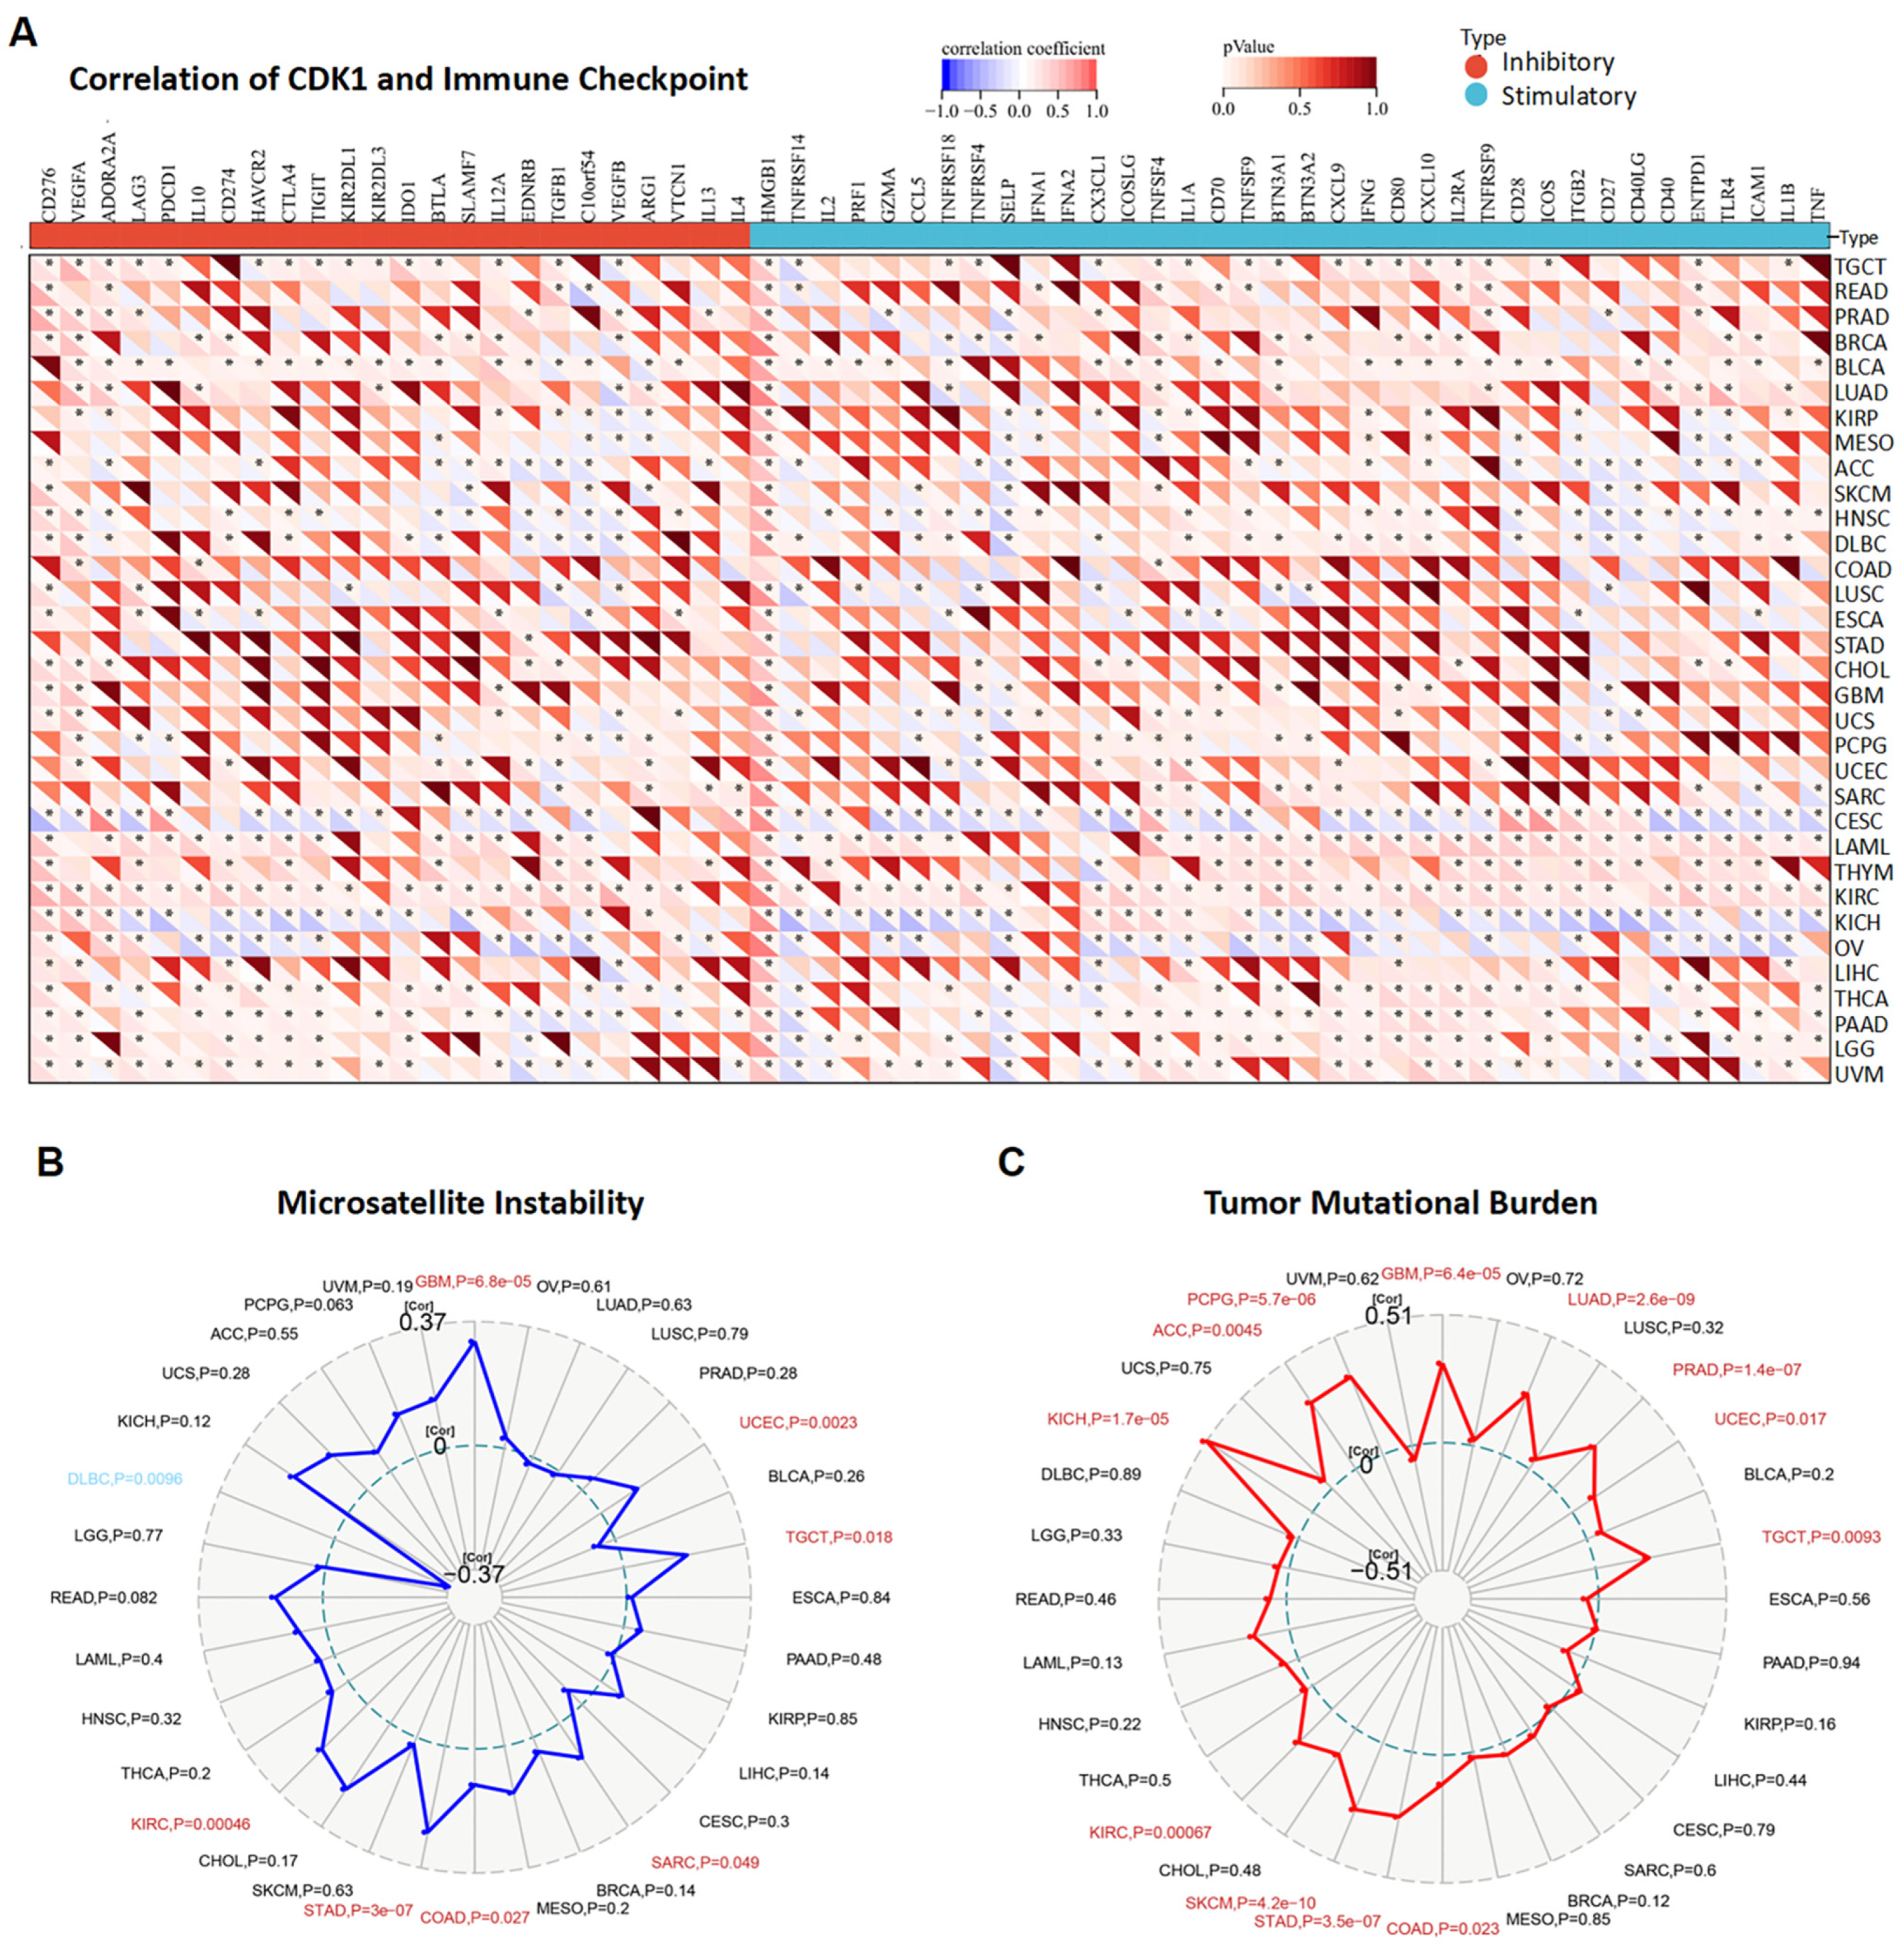
Immune checkpoint genes (ICGs) are among the critical immunotherapy targets for cancer treatment. CDK1 expression was positively related to many inhibitory ICGs, such as cluster of differentiation 276 (CD276), vascular endothelial growth factor A (VEGFA), cytotoxic T-lymphocyte-associated protein 4 (CTLA4), and programmed cell death protein 1 (PDCD1) in various tumors (Figure 11A). Notably, high mobility group box 1 (HMGB1) was significantly and positively related to CDK1 in 31 different types of tumors. A series of stimulatory ICGs, such as CD40, TNF receptor superfamily member 14 (TNFRSF14), and selectin P (SELP), were negatively linked with CDK1 in some tumors (OV, KICH, and CESC) (Figure 11A). Analysis of the correlations between the expression of CDK1 and MSI/TMB in tumors in the TCGA database showed that CDK1 expression was positively related to MSI in GBM, UCEC, TGCT, SARC, COAD, STAD, and KIRC, whereas CDK1 expression was negatively linked with MSI in DLBC (Figure 11B). In addition, high expression of CDK1 was associated with high TMB in GBM, LUAD, PRAD, UCEC, TGCT, COAD, STAD, SKCM, KIRC, KICH, ACC, and PCPG (Figure 11C).

4. Discussion

The present pan-cancer analysis demonstrated: (1) CDK1 genetic alterations, including amplification, mutation, and deep deletion, were observed in a variety of cancers; (2) the gene expression of CDK1 was significantly increased in many tumor tissues based on the TCGA database, including ACC, BLCA, BRCA, CESC, CHOL, COAD, DLBC, ESCA, GBM, HNSC, LGG, LIHC, LUAD, LUSC, OV, PAAD, READ, SARC, SKCM, STAD, THYM, UCEC, and UCS, as compared to normal tissues; (3) high total protein expression of CDK1 was observed in a variety of primary tumors from the CPTAC database, including breast cancer, colon cancer, lung cancer, KIRC, UCEC, LIHC, PAAD, GBM, and HNSC; (4) poor OS and DFS were associated with high CDK1 expression in multiple tumors, such as ACC, KIRC, KIRP, LGG, LIHC, LUAD, PAAD, and SARC; (5) the top five CDK1-correlated genes were CCNA2, CEP55, KIF11, KIF4A, and ZWINT: these genes were positively and significantly correlated with CDK1 in all tumor types; (6) CDK1-interacted or -correlated genes were closely associated with “cell cycle”, “organelle fission”, “nuclear division”, and other cellular functions related to carcinogenesis; (7) high CDK1 expression was associated with genes in E2F, G2M, mTORC1, MYC, and P53 pathways in various tumors, such as BLCA, BRCA, HNSC, KIRC, LIHC, LUAD, LUSC, PAAD, and SARC; (8) CDK1 expression was significantly correlated with the ESTIMATEScore, the ImmuneScore, and the StromalScore in some tumors; (9) there was positive correlation between CDK1 expression and MDSC infiltration in almost all of the tumor types from the TCGA database; (10) CDK1 was positively related to Th2 cells in GBM, SARC, and STAD and negatively associated with eosinophils, pDC, mast cells, and other immune cells in tumors; (11) CDK1 was correlated with several immune checkpoints in various tumors, including CD276, VEGFA, CTLA4, PDCD1, CD40, TNFRSF14, and SELP; and (12) MSI and TMB were also significantly correlated with the expression of CDK1. Taken together, these data suggest that CDK1 is highly related to tumorigenesis and could be a potential target for tumor diagnosis and treatment.
CDK1, one of the serine/threonine kinases, plays a critical role in regulating the centrosome cycle and mitotic onset. During G2 and early mitosis, CDK1–cyclin complexes are activated and phosphorylate more than 70 substrates to promote the separation of centrosomes, collapse of the nuclear envelope, and condensation of chromosomes [30]. Notably, CDK1 can balance cell proliferation and protein synthesis [31]. Mutations in various genes and uncontrolled cell division can lead to the development of tumors. Indeed, the data from the present study showed that amplification, mutation, deep deletion, and other genetic alterations of CDK1 were present in multiple tumors from the TCGA cohort, such as UCS, SKCM, CHOL, STAD, and BRCA. Previous studies have demonstrated that the expression of CDK1 is increased in some human tumors, and an increase in CDK1 expression is associated with a poor prognosis for hepatocellular carcinoma and pancreatic ductal adenocarcinoma [10,32,33]. Tumorigenic potential and tumor-initiating capacity are significantly increased in melanoma cells with CDK1 overexpression due to its interaction with the pluripotent stem cell transcription factor Sox2 [34]. Clinically, CDK1-mediated phosphorylation of human telomerase reverse transcriptase (hTERT) at T249 is closely related to aggressive and advanced cancers [35]. The phosphorylation of transcription factor CP2-like 1 (TFCP2L1) by CDK1 at Thr177 promotes bladder carcinogenesis, and the tumorigenic potency of bladder cancer cells was reduced in a xenograft model when the level of TFCP2L1 phosphorylation was decreased [36]. In the present study, based on the TCGA database, both gene and protein expression of CDK1 were significantly higher in some tumors than in normal tissues, and CDK1 activity was associated with a poor prognosis in patients with some tumors, such as KIRC, UCEC, LIHC, PAAD, GBM, LUAD, and HNSC.
Multiple changes in genes and proteins are frequently observed in tumors, and the interactions among these genes and proteins are important for tumor development and progression. Thus, the role of CDK1 in carcinogenesis would be associated with many other genes and proteins. Indeed, the present study showed that CCNA2, CEP55, KIF11, KIF4A, and ZWINT were the top five genes that were significantly and positively correlated with CDK1 in all tumor types from the TCGA database. CCNA2 activates CDK1 during the S phase and early mitosis and promotes nuclear accumulation of cyclin B1-CDK1 [37,38,39]. Hyperactivation of CCNA2-CDK1 could cause abnormal replication in the early S phase, while CCNA2 deletion delays nuclear envelope breakdown and suppresses tumor formation [39,40,41]. Increased co-expression of CCNA2 and CDK1 has been observed in hepatoblastoma, and inhibiting the expression of CCNA2 and CDK1 attenuates the proliferative, migrative, and invasive capacities of both HepG2 and HuH-6 cells [42]. CEP55, a centrosomal protein, regulates cytokinesis and is upregulated in tumorigenesis [43]. A recent study has shown that CEP55 expression is increased in the tissue of colorectal cancer (CRC) and promotes the proliferation of CRC cells through interactions with p53/p21 signaling proteins [44]. CEP55 deletion can prime premature CDK1/cyclin B activation and mitotic cell death, thus sensitizing breast cancer cells to antimitotic drugs [43]. KIF11, a mitotic kinesin, is involved in the formation and maintenance of the bipolar spindle. Increased KIF11 expression has been reported in a variety of tumors, such as HCC, GBM, CRC, and gallbladder cancer (GBC), and affects the regulation of various signaling pathways, including ERBB2/PI3K/AKT and p53/GSK3β [45,46,47,48]. Blocking KIF11 with siRNA can inhibit the protein expression of Cyclin B1 and CDK1, thus arresting the cell cycle in the G2/M phase [45]. KIF4A is closely related to prostate cancer, liver cancer, and lung cancer through the regulation of spindle formation, centrosome assembly, chromosome concentration and separation, and DNA damage repair [49,50,51]. Chromosome binding and assembly during early mitosis are dependent on CDK1-mediated phosphorylation of KIF4A at S1186 [52]. ZWINT, a kinetochore-associated protein, is known to be critically involved in centromere function and cell growth and is required for the spindle assembly checkpoint [53]. CDK1 expression can be modified by ZWINT to promote HCC progression with increased tumor size and number [54]. Understanding the function of CDK1-related genes and their interactions may provide a novel and effective therapeutic strategy for cancers.
In the present study, GO analysis revealed that CDK1 was related to genes involved in the chromosome, spindle, and kinetochore and genes that regulate cell cycle phase transition, microtubule binding, kinase activity, and cell division. The KEGG analysis also showed that CDK1-related genes were involved in the cell cycle, as well as P53 and FoxO signaling. According to GSEA, E2F transcription factors, the G2/M DNA damage checkpoint, MYC targets, mTORC1, and P53 signaling were associated with high CDK1 expression. These results suggest that CDK1-mediated mechanisms in the cell cycle are important for cell proliferation and tumor initiation. It is known that E2F and MYC activities are highly regulated, and p53 activity is suppressed in tumors with enhanced cell growth and proliferation [55,56,57]. Cyclins and CDKs are upregulated during the cell cycle, and the progression of the cell cycle can be achieved by MYC-induced CDK1 activation [58]. Tumorigenesis induced by silencing p53 is attenuated after CDK1 deletion in the liver [13]. To avoid the accumulation and transmission of genetic errors during cell division, cell cycle checkpoints slow cell cycle progression and induce cell cycle exit or cell death [59]. Double-strand DNA breaks can activate DNA damage checkpoints, which depend on the checkpoint protein kinase ataxia telangiectasia mutated (ATM). In S and G2 phases, CHK2 and WEE1 can inhibit CDK1 activity to prevent mitotic entry [59]. However, CDK1 can phosphorylate the DNA damage signaling protein 53BP1 and drive cell cycle reentry by terminating the ATM-CHK2 branch of the G2/M checkpoint [60]. There are two functionally distinct mTOR complexes: one is rapamycin-sensitive (mTORC1), and the other is relatively rapamycin-resistant (mTORC2). Enhanced tumor formation, proliferation, and metastasis could be associated with mTORC1 overactivation [61]. Temsirolimus and everolimus are FDA-approved mTOR inhibitors for kidney or breast cancer. The inhibition of one signaling pathway may result in feedback activation of other signaling pathways. Blocking mTOR with rapamycin can cause CDK1 activation and further cell cycle progression [62]. Tumor development processes are complex, involving numerous signaling pathways. Therefore, more studies are welcomed to explore the mechanisms of CDK1 in tumorigenesis.
One of the major challenges in cancer therapy is drug resistance. Antimitotic drugs are usually used as the first-line treatment in patients with cancer. However, drug resistance decreases the efficacy of these drugs. Chromosomal instability (CIN) and aneuploidy are often observed in tumor cells that are resistant to antimitotic drugs. The CDK1-related gene CEP55 can protect aneuploid cells from death, while targeting CEP55 may sensitize cells to microtubule inhibitors [63]. It has been reported that cyclin B1/CDK1-mediated mitochondrial bioenergetics plays a role in tumor cell survival and the reduction in anticancer efficacy [64]. Inhibition of CDK1 has been shown to reverse Paclitaxel-induced resistance in ovarian cancer cells and 5-FU-induced resistance in colorectal cancer [65,66]. Immunotherapy can be combined with antimitotic drugs to treat cancer by boosting or modulating the immune system. MDSCs expand and negatively regulate the immune response in cancer, making the tumor resistant to immunotherapy and thus promoting tumor cell proliferation and invasion [67,68]. Increased levels of MDSCs were observed in patients with STAD or GBM and associated with advanced stages and poor prognoses of cancers [69,70]. Based on the TCGA database, the data from the present study indicated that CDK1 expression was positively related to MDSC infiltration in almost all tumor types (except for DLBC, HNSC-HPV+, and UCS). The expression of CDK1 was negatively correlated with the ImmuneScore, which reflects in situ T-cell infiltration in a variety of tumors. Indeed, most of the innate and adaptive immune cells are negatively related to CDK1 expression in GBM, SARC, and STAD. Data on the role of Th2 cells in tumors have been inconsistent. Some studies show that Th2 contributes to antitumor immunity, while others show that Th2 promotes tumor growth and metastasis [71]. A positive correlation between CDK1 and Th2 cells was observed in GBM, SARC, and STAD in the present study. However, the specific mechanisms of CDK1 and Th2 cells in tumorigenesis are not clear at this point.
Immune checkpoint inhibitors (ICIs) are one of the immunotherapies that work by promoting immune cell responses in cancer treatment. The present study showed that CD276, CTLA4, and PDCD1 (PD1) were positively related to CDK1 expression in some tumors in the TCGA database. Inhibitory checkpoints CTLA4 and PDCD1 are commonly found in activated T cells, and their inhibitors have been used in patients with tumors, including melanoma, bladder cancer, renal cell carcinoma, non-small cell lung cancer, Hodgkin lymphoma, MSI-high colorectal carcinoma, and Merkel cell carcinoma [72,73]. However, resistance to ICIs develops during treatment. The treatment efficacy of ICIs can be predicted by tumor MSI and TMB. The objective response rate to ICIs in 27 cancer types is positively correlated with TMB, and MSI-high is also used to define the antitumor efficacy of ICIs [74,75]. The present study also demonstrated that the expression of CDK1 was significantly and positively correlated with MSI and TMB in multiple tumors in the TCGA database. These results suggest that CDK1 could be an effective target for immunotherapy and for the treatment of drug-resistant cancers. Alsterpaullone, Flavopiridol, and RO-3306 are CDK1 inhibitors and have been shown to increase drug efficacy and decrease tumor growth [10,65,76]. Future studies are required to clarify the role of CDK1 in cancer cell proliferation and invasion and to design specific CDK1 inhibitors to improve anticancer efficacy and reduce side effects.

5. Conclusions

The present pan-cancer analysis of CDK1 demonstrates that CDK1 is closely related to a variety of tumors, including ACC, BLCA, BRCA, CESC, CHOL, COAD, DLBC, ESCA, GBM, HNSC, LGG, LIHC, LUAD, LUSC, OV, PAAD, READ, SARC, SKCM, STAD, THYM, UCEC, and UCS. CDK1 is critically involved in the regulation of the “cell cycle”, “organelle fission”, and “nuclear division” and associated with genes in E2F, G2M, mTORC1, MYC, and P53 pathways. A poor clinical prognosis is observed in cancer patients with high CDK1 expression. The negative correlations between CDK1 and the ESTIMATEScore, the ImmuneScore, and the StromalScore, as well as the positive correlations between CDK1 expression and MDSC infiltration, MSI, and TMB across multiple tumors, suggest that CDK1 may potentially serve as a novel and effective target for cancer immunotherapy.

Supplementary Materials

The following supporting information can be downloaded at: https://www.mdpi.com/article/10.3390/cancers14112658/s1, Figure S1: The transcriptional expression of CDK1 in different types of structural variants in various tumors. Figure S2: RNA and protein expression of CDK1 in different normal tissues based on the consensus datasets of the HPA and GTEx databases. Figure S3: The gene expression of CDK1 in different cancers based on the TCGA database. Figure S4: The correlation between CDK1 expression and various pathological stages of KIRC, BRCA, KIRP, LUAD ACC, and KICH based on the TCGA database. Figure S5: (A) The mRNA level of CDK1 was significantly decreased in LAML when compared to normal tissues. (B) C6 enrichment analysis showed that high expression of CDK1 was also associated with the genes that were upregulated with overexpression of oncogenes, such as E2F1 and KRAS in LAML of TCGA cohort. Figure S6: Kaplan–Meier curves of overall survival analysis in ACC for cancer patients with low CDK1 expression and high CDK1 expression. Table S1: Tumor abbreviations of TCGA database. Table S2: The interacted and correlated genes of CDK1. Table S3: Raw data of correlation between CDK1 expression and ESTIMATEScore, ImmuneScore, and StromalScore in tumors of TCGA database.

Author Contributions

Conceptualization, X.L. and H.W.; methodology, X.L. and H.W.; software, X.L. and H.W.; validation, X.L., H.W. and Z.L.; formal analysis, X.L. and H.W.; investigation, Z.L.; resources, X.L. and H.W.; data curation, X.L. and H.W.; writing—original draft preparation, X.L.; writing—review and editing, X.L., H.W. and Z.L.; visualization, X.L., H.W. and Z.L.; supervision, Z.L.; project administration, X.L., H.W. and Z.L. All authors have read and agreed to the published version of the manuscript.

Funding

This research received no external funding.

Institutional Review Board Statement

Not applicable.

Informed Consent Statement

Not applicable.

Data Availability Statement

Not applicable.

Acknowledgments

This work was partially supported by the Daniel Steffen Award for Graduate Student Excellence of the Department of Medical Pharmacology and Physiology, University of Missouri-Columbia.

Conflicts of Interest

The authors declare no conflict of interest.

References

  1. Malumbres, M. Cyclin-dependent kinases. Genome Biol. 2014, 15, 122. [Google Scholar] [CrossRef] [PubMed] [Green Version]
  2. Enserink, J.M.; Chymkowitch, P. Cell Cycle-Dependent Transcription: The Cyclin Dependent Kinase Cdk1 Is a Direct Regulator of Basal Transcription Machineries. Int. J. Mol. Sci. 2022, 23, 1293. [Google Scholar] [CrossRef] [PubMed]
  3. Hartwell, L.H.; Culotti, J.; Reid, B. Genetic control of the cell-division cycle in yeast. I. Detection of mutants. Proc. Natl. Acad. Sci. USA 1970, 66, 352–359. [Google Scholar] [CrossRef] [PubMed] [Green Version]
  4. Wijnen, R.; Pecoraro, C.; Carbone, D.; Fiuji, H.; Avan, A.; Peters, G.J.; Giovannetti, E.; Diana, P. Cyclin Dependent Kinase-1 (CDK-1) Inhibition as a Novel Therapeutic Strategy against Pancreatic Ductal Adenocarcinoma (PDAC). Cancers 2021, 13, 4389. [Google Scholar] [CrossRef]
  5. CDK1-TISSUE. Available online: https://www.proteinatlas.org/ENSG00000170312-CDK1/tissue (accessed on 30 March 2022).
  6. Kalous, J.; Jansova, D.; Susor, A. Role of Cyclin-Dependent Kinase 1 in Translational Regulation in the M-Phase. Cells 2020, 9, 1568. [Google Scholar] [CrossRef]
  7. Enserink, J.M.; Kolodner, R.D. An overview of Cdk1-controlled targets and processes. Cell Div. 2010, 5, 11. [Google Scholar] [CrossRef] [Green Version]
  8. Huang, H.M.; Huang, X.Y.; Wu, S.P.; Chen, C.K.; He, X.H.; Zhang, Y.F. Parecoxib inhibits esophageal squamous cell carcinoma progression via the PDK1-AKT pathway. Cell. Mol. Biol. Lett. 2022, 27, 28. [Google Scholar] [CrossRef]
  9. Dong, S.; Huang, F.; Zhang, H.; Chen, Q. Overexpression of BUB1B, CCNA2, CDC20, and CDK1 in tumor tissues predicts poor survival in pancreatic ductal adenocarcinoma. Biosci. Rep. 2019, 39, BSR20182306. [Google Scholar] [CrossRef] [Green Version]
  10. Wu, C.X.; Wang, X.Q.; Chok, S.H.; Man, K.; Tsang, S.; Chan, A.; Ma, K.W.; Xia, W.; Cheung, T.T. Blocking CDK1/PDK1/beta-Catenin signaling by CDK1 inhibitor RO3306 increased the efficacy of sorafenib treatment by targeting cancer stem cells in a preclinical model of hepatocellular carcinoma. Theranostics 2018, 8, 3737–3750. [Google Scholar] [CrossRef]
  11. Huang, J.; Chen, P.; Liu, K.; Liu, J.; Zhou, B.; Wu, R.; Peng, Q.; Liu, Z.X.; Li, C.; Kroemer, G.; et al. CDK1/2/5 inhibition overcomes IFNG-mediated adaptive immune resistance in pancreatic cancer. Gut 2021, 70, 890–899. [Google Scholar] [CrossRef]
  12. Zhang, P.; Kawakami, H.; Liu, W.; Zeng, X.; Strebhardt, K.; Tao, K.; Huang, S.; Sinicrope, F.A. Targeting CDK1 and MEK/ERK Overcomes Apoptotic Resistance in BRAF-Mutant Human Colorectal Cancer. Mol. Cancer Res. 2018, 16, 378–389. [Google Scholar] [CrossRef] [PubMed] [Green Version]
  13. Diril, M.K.; Ratnacaram, C.K.; Padmakumar, V.C.; Du, T.; Wasser, M.; Coppola, V.; Tessarollo, L.; Kaldis, P. Cyclin-dependent kinase 1 (Cdk1) is essential for cell division and suppression of DNA re-replication but not for liver regeneration. Proc. Natl. Acad. Sci. USA 2012, 109, 3826–3831. [Google Scholar] [CrossRef] [PubMed] [Green Version]
  14. Weinstein, J.N.; Collisson, E.A.; Mills, G.B.; Shaw, K.R.; Ozenberger, B.A.; Ellrott, K.; Shmulevich, I.; Sander, C.; Stuart, J.M. The Cancer Genome Atlas Pan-Cancer analysis project. Nat. Genet. 2013, 45, 1113–1120. [Google Scholar] [CrossRef] [PubMed]
  15. Pan-cancer analysis of whole genomes. Nature 2020, 578, 82–93. [CrossRef] [PubMed] [Green Version]
  16. Anderson, N.M.; Simon, M.C. The tumor microenvironment. Curr. Biol. 2020, 30, R921–R925. [Google Scholar] [CrossRef] [PubMed]
  17. Chen, D.; Feng, Z.; Zhou, M.; Ren, Z.; Zhang, F.; Li, Y. Bioinformatic Evidence Reveals that Cell Cycle Correlated Genes Drive the Communication between Tumor Cells and the Tumor Microenvironment and Impact the Outcomes of Hepatocellular Carcinoma. Biomed. Res. Int. 2021, 2021, 4092635. [Google Scholar] [CrossRef]
  18. Yu, Y.; Tang, H.; Franceschi, D.; Mujagond, P.; Acharya, A.; Deng, Y.; Lethaus, B.; Savkovic, V.; Zimmerer, R.; Ziebolz, D.; et al. Immune Checkpoint Gene Expression Profiling Identifies Programmed Cell Death Ligand-1 Centered Immunologic Subtypes of Oral and Squamous Cell Carcinoma with Favorable Survival. Front. Med. 2021, 8, 759605. [Google Scholar] [CrossRef]
  19. Palmeri, M.; Mehnert, J.; Silk, A.W.; Jabbour, S.K.; Ganesan, S.; Popli, P.; Riedlinger, G.; Stephenson, R.; de Meritens, A.B.; Leiser, A.; et al. Real-world application of tumor mutational burden-high (TMB-high) and microsatellite instability (MSI) confirms their utility as immunotherapy biomarkers. ESMO Open 2022, 7, 100336. [Google Scholar] [CrossRef]
  20. Gao, J.; Aksoy, B.A.; Dogrusoz, U.; Dresdner, G.; Gross, B.; Sumer, S.O.; Sun, Y.; Jacobsen, A.; Sinha, R.; Larsson, E.; et al. Integrative analysis of complex cancer genomics and clinical profiles using the cBioPortal. Sci. Signal. 2013, 6, pl1. [Google Scholar] [CrossRef] [Green Version]
  21. Tang, Z.; Kang, B.; Li, C.; Chen, T.; Zhang, Z. GEPIA2: An enhanced web server for large-scale expression profiling and interactive analysis. Nucleic Acids Res. 2019, 47, W556–W560. [Google Scholar] [CrossRef] [Green Version]
  22. Chen, F.; Chandrashekar, D.S.; Varambally, S.; Creighton, C.J. Pan-cancer molecular subtypes revealed by mass-spectrometry-based proteomic characterization of more than 500 human cancers. Nat. Commun. 2019, 10, 5679. [Google Scholar] [CrossRef] [PubMed] [Green Version]
  23. Liu, J.; Lichtenberg, T.; Hoadley, K.A.; Poisson, L.M.; Lazar, A.J.; Cherniack, A.D.; Kovatich, A.J.; Benz, C.C.; Levine, D.A.; Lee, A.V.; et al. An Integrated TCGA Pan-Cancer Clinical Data Resource to Drive High-Quality Survival Outcome Analytics. Cell 2018, 173, 400–416. [Google Scholar] [CrossRef] [PubMed] [Green Version]
  24. Bardou, P.; Mariette, J.; Escudie, F.; Djemiel, C.; Klopp, C. jvenn: An interactive Venn diagram viewer. BMC Bioinform. 2014, 15, 293. [Google Scholar] [CrossRef] [PubMed] [Green Version]
  25. Yu, G.; Wang, L.G.; Han, Y.; He, Q.Y. clusterProfiler: An R package for comparing biological themes among gene clusters. OMICS 2012, 16, 284–287. [Google Scholar] [CrossRef] [PubMed]
  26. Yoshihara, K.; Shahmoradgoli, M.; Martinez, E.; Vegesna, R.; Kim, H.; Torres-Garcia, W.; Trevino, V.; Shen, H.; Laird, P.W.; Levine, D.A.; et al. Inferring tumour purity and stromal and immune cell admixture from expression data. Nat. Commun. 2013, 4, 2612. [Google Scholar] [CrossRef] [PubMed]
  27. Hanzelmann, S.; Castelo, R.; Guinney, J. GSVA: Gene set variation analysis for microarray and RNA-seq data. BMC Bioinform. 2013, 14, 7. [Google Scholar] [CrossRef] [Green Version]
  28. Bindea, G.; Mlecnik, B.; Tosolini, M.; Kirilovsky, A.; Waldner, M.; Obenauf, A.C.; Angell, H.; Fredriksen, T.; Lafontaine, L.; Berger, A.; et al. Spatiotemporal dynamics of intratumoral immune cells reveal the immune landscape in human cancer. Immunity 2013, 39, 782–795. [Google Scholar] [CrossRef] [Green Version]
  29. Zeng, J.; Zhang, Y.; Shang, Y.; Mai, J.; Shi, S.; Lu, M.; Bu, C.; Zhang, Z.; Zhang, Z.; Li, Y.; et al. CancerSCEM: A database of single-cell expression map across various human cancers. Nucleic Acids Res. 2022, 50, D1147–D1155. [Google Scholar] [CrossRef]
  30. Malumbres, M.; Barbacid, M. Cell cycle, CDKs and cancer: A changing paradigm. Nat. Rev. Cancer 2009, 9, 153–166. [Google Scholar] [CrossRef]
  31. Haneke, K.; Schott, J.; Lindner, D.; Hollensen, A.K.; Damgaard, C.K.; Mongis, C.; Knop, M.; Palm, W.; Ruggieri, A.; Stoecklin, G. CDK1 couples proliferation with protein synthesis. J. Cell Biol. 2020, 219, e201906147. [Google Scholar] [CrossRef] [Green Version]
  32. Ito, Y.; Takeda, T.; Sakon, M.; Monden, M.; Tsujimoto, M.; Matsuura, N. Expression and prognostic role of cyclin-dependent kinase 1 (cdc2) in hepatocellular carcinoma. Oncology 2000, 59, 68–74. [Google Scholar] [CrossRef] [PubMed]
  33. Piao, J.; Zhu, L.; Sun, J.; Li, N.; Dong, B.; Yang, Y.; Chen, L. High expression of CDK1 and BUB1 predicts poor prognosis of pancreatic ductal adenocarcinoma. Gene 2019, 701, 15–22. [Google Scholar] [CrossRef] [PubMed]
  34. Ravindran, M.D.; Luo, Y.; Arcaroli, J.J.; Liu, S.; KrishnanKutty, L.N.; Osborne, D.G.; Li, Y.; Samson, J.M.; Bagby, S.; Tan, A.C.; et al. CDK1 Interacts with Sox2 and Promotes Tumor Initiation in Human Melanoma. Cancer Res. 2018, 78, 6561–6574. [Google Scholar] [CrossRef] [PubMed] [Green Version]
  35. Yasukawa, M.; Ando, Y.; Yamashita, T.; Matsuda, Y.; Shoji, S.; Morioka, M.S.; Kawaji, H.; Shiozawa, K.; Machitani, M.; Abe, T.; et al. CDK1 dependent phosphorylation of hTERT contributes to cancer progression. Nat. Commun. 2020, 11, 1557. [Google Scholar] [CrossRef]
  36. Heo, J.; Noh, B.J.; Lee, S.; Lee, H.Y.; Kim, Y.; Lim, J.; Ju, H.; Yu, H.Y.; Ryu, C.M.; Lee, P.C.; et al. Phosphorylation of TFCP2L1 by CDK1 is required for stem cell pluripotency and bladder carcinogenesis. EMBO Mol. Med. 2020, 12, e10880. [Google Scholar] [CrossRef]
  37. Jin, M.; Li, J.; Hu, R.; Xu, B.; Huang, G.; Huang, W.; Chen, B.; He, J.; Cao, Y. Cyclin A2/cyclin-dependent kinase 1-dependent phosphorylation of Top2a is required for S phase entry during retinal development in zebrafish. J. Genet. Genom. 2021, 48, 63–74. [Google Scholar] [CrossRef]
  38. Kanakkanthara, A.; Jeganathan, K.B.; Limzerwala, J.F.; Baker, D.J.; Hamada, M.; Nam, H.J.; van Deursen, W.H.; Hamada, N.; Naylor, R.M.; Becker, N.A.; et al. Cyclin A2 is an RNA binding protein that controls Mre11 mRNA translation. Science 2016, 353, 1549–1552. [Google Scholar] [CrossRef] [Green Version]
  39. Gong, D.; Pomerening, J.R.; Myers, J.W.; Gustavsson, C.; Jones, J.T.; Hahn, A.T.; Meyer, T.; Ferrell, J.J. Cyclin A2 regulates nuclear-envelope breakdown and the nuclear accumulation of cyclin B1. Curr. Biol. 2007, 17, 85–91. [Google Scholar] [CrossRef] [Green Version]
  40. Katsuno, Y.; Suzuki, A.; Sugimura, K.; Okumura, K.; Zineldeen, D.H.; Shimada, M.; Niida, H.; Mizuno, T.; Hanaoka, F.; Nakanishi, M. Cyclin A-Cdk1 regulates the origin firing program in mammalian cells. Proc. Natl. Acad. Sci. USA 2009, 106, 3184–3189. [Google Scholar] [CrossRef] [Green Version]
  41. Gopinathan, L.; Tan, S.L.; Padmakumar, V.C.; Coppola, V.; Tessarollo, L.; Kaldis, P. Loss of Cdk2 and cyclin A2 impairs cell proliferation and tumorigenesis. Cancer Res. 2014, 74, 3870–3879. [Google Scholar] [CrossRef] [Green Version]
  42. Tian, L.; Chen, T.; Lu, J.; Yan, J.; Zhang, Y.; Qin, P.; Ding, S.; Zhou, Y. Integrated Protein-Protein Interaction and Weighted Gene Co-expression Network Analysis Uncover Three Key Genes in Hepatoblastoma. Front. Cell Dev. Biol. 2021, 9, 631982. [Google Scholar] [CrossRef] [PubMed]
  43. Kalimutho, M.; Sinha, D.; Jeffery, J.; Nones, K.; Srihari, S.; Fernando, W.C.; Duijf, P.H.; Vennin, C.; Raninga, P.; Nanayakkara, D.; et al. CEP55 is a determinant of cell fate during perturbed mitosis in breast cancer. EMBO Mol. Med. 2018, 10, e8566. [Google Scholar] [CrossRef] [PubMed]
  44. Lin, K.; Zhu, X.; Luo, C.; Bu, F.; Zhu, J.; Zhu, Z. Data mining combined with experiments to validate CEP55 as a prognostic biomarker in colorectal cancer. Immun. Inflamm. Dis. 2021, 9, 167–182. [Google Scholar] [CrossRef] [PubMed]
  45. Hu, Z.D.; Jiang, Y.; Sun, H.M.; Wang, J.W.; Zhai, L.L.; Yin, Z.Q.; Yan, J. KIF11 Promotes Proliferation of Hepatocellular Carcinoma among Patients with Liver Cancers. Biomed. Res. Int. 2021, 2021, 2676745. [Google Scholar] [CrossRef]
  46. Wei, D.; Rui, B.; Qingquan, F.; Chen, C.; Ping, H.Y.; Xiaoling, S.; Hao, W.; Jun, G. KIF11 promotes cell proliferation via ERBB2/PI3K/AKT signaling pathway in gallbladder cancer. Int. J. Biol. Sci. 2021, 17, 514–526. [Google Scholar] [CrossRef] [PubMed]
  47. Liu, B.; Zhang, G.; Cui, S.; Du, G. Upregulation of KIF11 in TP53 Mutant Glioma Promotes Tumor Stemness and Drug Resistance. Cell. Mol. Neurobiol. 2021. Online ahead of print. [Google Scholar] [CrossRef] [PubMed]
  48. Zhou, Y.; Yang, L.; Xiong, L.; Wang, K.; Hou, X.; Li, Q.; Kong, F.; Liu, X.; He, J. KIF11 is upregulated in colorectal cancer and silencing of it impairs tumor growth and sensitizes colorectal cancer cells to oxaliplatin via p53/GSK3beta signaling. J. Cancer 2021, 12, 3741–3753. [Google Scholar] [CrossRef]
  49. Cao, Q.; Song, Z.; Ruan, H.; Wang, C.; Yang, X.; Bao, L.; Wang, K.; Cheng, G.; Xu, T.; Xiao, W.; et al. Targeting the KIF4A/AR Axis to Reverse Endocrine Therapy Resistance in Castration-resistant Prostate Cancer. Clin. Cancer Res. 2020, 26, 1516–1528. [Google Scholar] [CrossRef] [Green Version]
  50. Huang, Y.; Wang, H.; Lian, Y.; Wu, X.; Zhou, L.; Wang, J.; Deng, M.; Huang, Y. Upregulation of kinesin family member 4A enhanced cell proliferation via activation of Akt signaling and predicted a poor prognosis in hepatocellular carcinoma. Cell Death Dis. 2018, 9, 141. [Google Scholar] [CrossRef]
  51. Taniwaki, M.; Takano, A.; Ishikawa, N.; Yasui, W.; Inai, K.; Nishimura, H.; Tsuchiya, E.; Kohno, N.; Nakamura, Y.; Daigo, Y. Activation of KIF4A as a prognostic biomarker and therapeutic target for lung cancer. Clin. Cancer Res. 2007, 13, 6624–6631. [Google Scholar] [CrossRef] [Green Version]
  52. Takata, H.; Madung, M.; Katoh, K.; Fukui, K. Cdk1-dependent phosphorylation of KIF4A at S1186 triggers lateral chromosome compaction during early mitosis. PLoS ONE 2018, 13, e209614. [Google Scholar] [CrossRef] [PubMed] [Green Version]
  53. Woo, S.D.; Yeop, Y.S.; Chung, W.J.; Cho, D.H.; Kim, J.S.; Su, O.J. Zwint-1 is required for spindle assembly checkpoint function and kinetochore-microtubule attachment during oocyte meiosis. Sci. Rep. 2015, 5, 15431. [Google Scholar] [CrossRef] [PubMed] [Green Version]
  54. Ying, H.; Xu, Z.; Chen, M.; Zhou, S.; Liang, X.; Cai, X. Overexpression of Zwint predicts poor prognosis and promotes the proliferation of hepatocellular carcinoma by regulating cell-cycle-related proteins. Onco Targets Ther. 2018, 11, 689–702. [Google Scholar] [CrossRef] [PubMed] [Green Version]
  55. Dang, C.V. MYC on the path to cancer. Cell 2012, 149, 22–35. [Google Scholar] [CrossRef] [PubMed] [Green Version]
  56. Kent, L.N.; Leone, G. The broken cycle: E2F dysfunction in cancer. Nat. Rev. Cancer 2019, 19, 326–338. [Google Scholar] [CrossRef]
  57. Bieging, K.T.; Mello, S.S.; Attardi, L.D. Unravelling mechanisms of p53-mediated tumour suppression. Nat. Rev. Cancer 2014, 14, 359–370. [Google Scholar] [CrossRef] [Green Version]
  58. Garcia-Gutierrez, L.; Bretones, G.; Molina, E.; Arechaga, I.; Symonds, C.; Acosta, J.C.; Blanco, R.; Fernandez, A.; Alonso, L.; Sicinski, P.; et al. Myc stimulates cell cycle progression through the activation of Cdk1 and phosphorylation of p27. Sci. Rep. 2019, 9, 18693. [Google Scholar] [CrossRef] [Green Version]
  59. Matthews, H.K.; Bertoli, C.; de Bruin, R. Cell cycle control in cancer. Nat. Rev. Mol. Cell Biol. 2022, 23, 74–88. [Google Scholar] [CrossRef]
  60. van Vugt, M.A.; Gardino, A.K.; Linding, R.; Ostheimer, G.J.; Reinhardt, H.C.; Ong, S.E.; Tan, C.S.; Miao, H.; Keezer, S.M.; Li, J.; et al. A mitotic phosphorylation feedback network connects Cdk1, Plk1, 53BP1, and Chk2 to inactivate the G(2)/M DNA damage checkpoint. PLoS Biol. 2010, 8, e1000287. [Google Scholar] [CrossRef]
  61. Zou, Z.; Tao, T.; Li, H.; Zhu, X. mTOR signaling pathway and mTOR inhibitors in cancer: Progress and challenges. Cell Biosci. 2020, 10, 31. [Google Scholar] [CrossRef]
  62. Jin, L.; Chen, Y.; Yan, C.; Guo, X.; Jiang, T.; Guli, A.; Song, X.; Wan, Q.; Shu, Q.; Ding, S. Phosphoproteome Profiling Revealed the Importance of mTOR Inhibition on CDK1 Activation to Further Regulate Cell Cycle Progression. J. Proteome Res. 2021, 20, 2329–2339. [Google Scholar] [CrossRef] [PubMed]
  63. Sinha, D.; Duijf, P.; Khanna, K.K. Mitotic slippage: An old tale with a new twist. Cell Cycle 2019, 18, 7–15. [Google Scholar] [CrossRef] [PubMed] [Green Version]
  64. Xie, B.; Wang, S.; Jiang, N.; Li, J.J. Cyclin B1/CDK1-regulated mitochondrial bioenergetics in cell cycle progression and tumor resistance. Cancer Lett. 2019, 443, 56–66. [Google Scholar] [CrossRef] [PubMed]
  65. Bae, T.; Weon, K.Y.; Lee, J.W.; Eum, K.H.; Kim, S.; Choi, J.W. Restoration of paclitaxel resistance by CDK1 intervention in drug-resistant ovarian cancer. Carcinogenesis 2015, 36, 1561–1571. [Google Scholar] [CrossRef]
  66. Zhu, Y.; Li, K.; Zhang, J.; Wang, L.; Sheng, L.; Yan, L. Inhibition of CDK1 Reverses the Resistance of 5-Fu in Colorectal Cancer. Cancer Manag. Res. 2020, 12, 11271–11283. [Google Scholar] [CrossRef]
  67. Gabrilovich, D.I.; Nagaraj, S. Myeloid-derived suppressor cells as regulators of the immune system. Nat. Rev. Immunol. 2009, 9, 162–174. [Google Scholar] [CrossRef]
  68. Tesi, R.J. MDSC; the Most Important Cell You Have Never Heard of. Trends Pharmacol. Sci. 2019, 40, 4–7. [Google Scholar] [CrossRef]
  69. Wang, L.; Chang, E.W.; Wong, S.C.; Ong, S.M.; Chong, D.Q.; Ling, K.L. Increased myeloid-derived suppressor cells in gastric cancer correlate with cancer stage and plasma S100A8/A9 proinflammatory proteins. J. Immunol. 2013, 190, 794–804. [Google Scholar] [CrossRef]
  70. Alban, T.J.; Alvarado, A.G.; Sorensen, M.D.; Bayik, D.; Volovetz, J.; Serbinowski, E.; Mulkearns-Hubert, E.E.; Sinyuk, M.; Hale, J.S.; Onzi, G.R.; et al. Global immune fingerprinting in glioblastoma patient peripheral blood reveals immune-suppression signatures associated with prognosis. JCI Insight 2018, 3, e122264. [Google Scholar] [CrossRef] [Green Version]
  71. Schreiber, S.; Hammers, C.M.; Kaasch, A.J.; Schraven, B.; Dudeck, A.; Kahlfuss, S. Metabolic Interdependency of Th2 Cell-Mediated Type 2 Immunity and the Tumor Microenvironment. Front. Immunol. 2021, 12, 632581. [Google Scholar] [CrossRef]
  72. Rotte, A. Combination of CTLA-4 and PD-1 blockers for treatment of cancer. J. Exp. Clin. Cancer Res. 2019, 38, 255. [Google Scholar] [CrossRef] [PubMed]
  73. Jenkins, R.W.; Barbie, D.A.; Flaherty, K.T. Mechanisms of resistance to immune checkpoint inhibitors. Br. J. Cancer 2018, 118, 9–16. [Google Scholar] [CrossRef] [PubMed] [Green Version]
  74. Rizzo, A.; Ricci, A.D.; Brandi, G. PD-L1, TMB, MSI, and Other Predictors of Response to Immune Checkpoint Inhibitors in Biliary Tract Cancer. Cancers 2021, 13, 558. [Google Scholar] [CrossRef] [PubMed]
  75. Yarchoan, M.; Hopkins, A.; Jaffee, E.M. Tumor Mutational Burden and Response Rate to PD-1 Inhibition. N. Engl. J. Med. 2017, 377, 2500–2501. [Google Scholar] [CrossRef] [PubMed]
  76. Roskoski, R.J. Cyclin-dependent protein serine/threonine kinase inhibitors as anticancer drugs. Pharmacol. Res. 2019, 139, 471–488. [Google Scholar] [CrossRef]
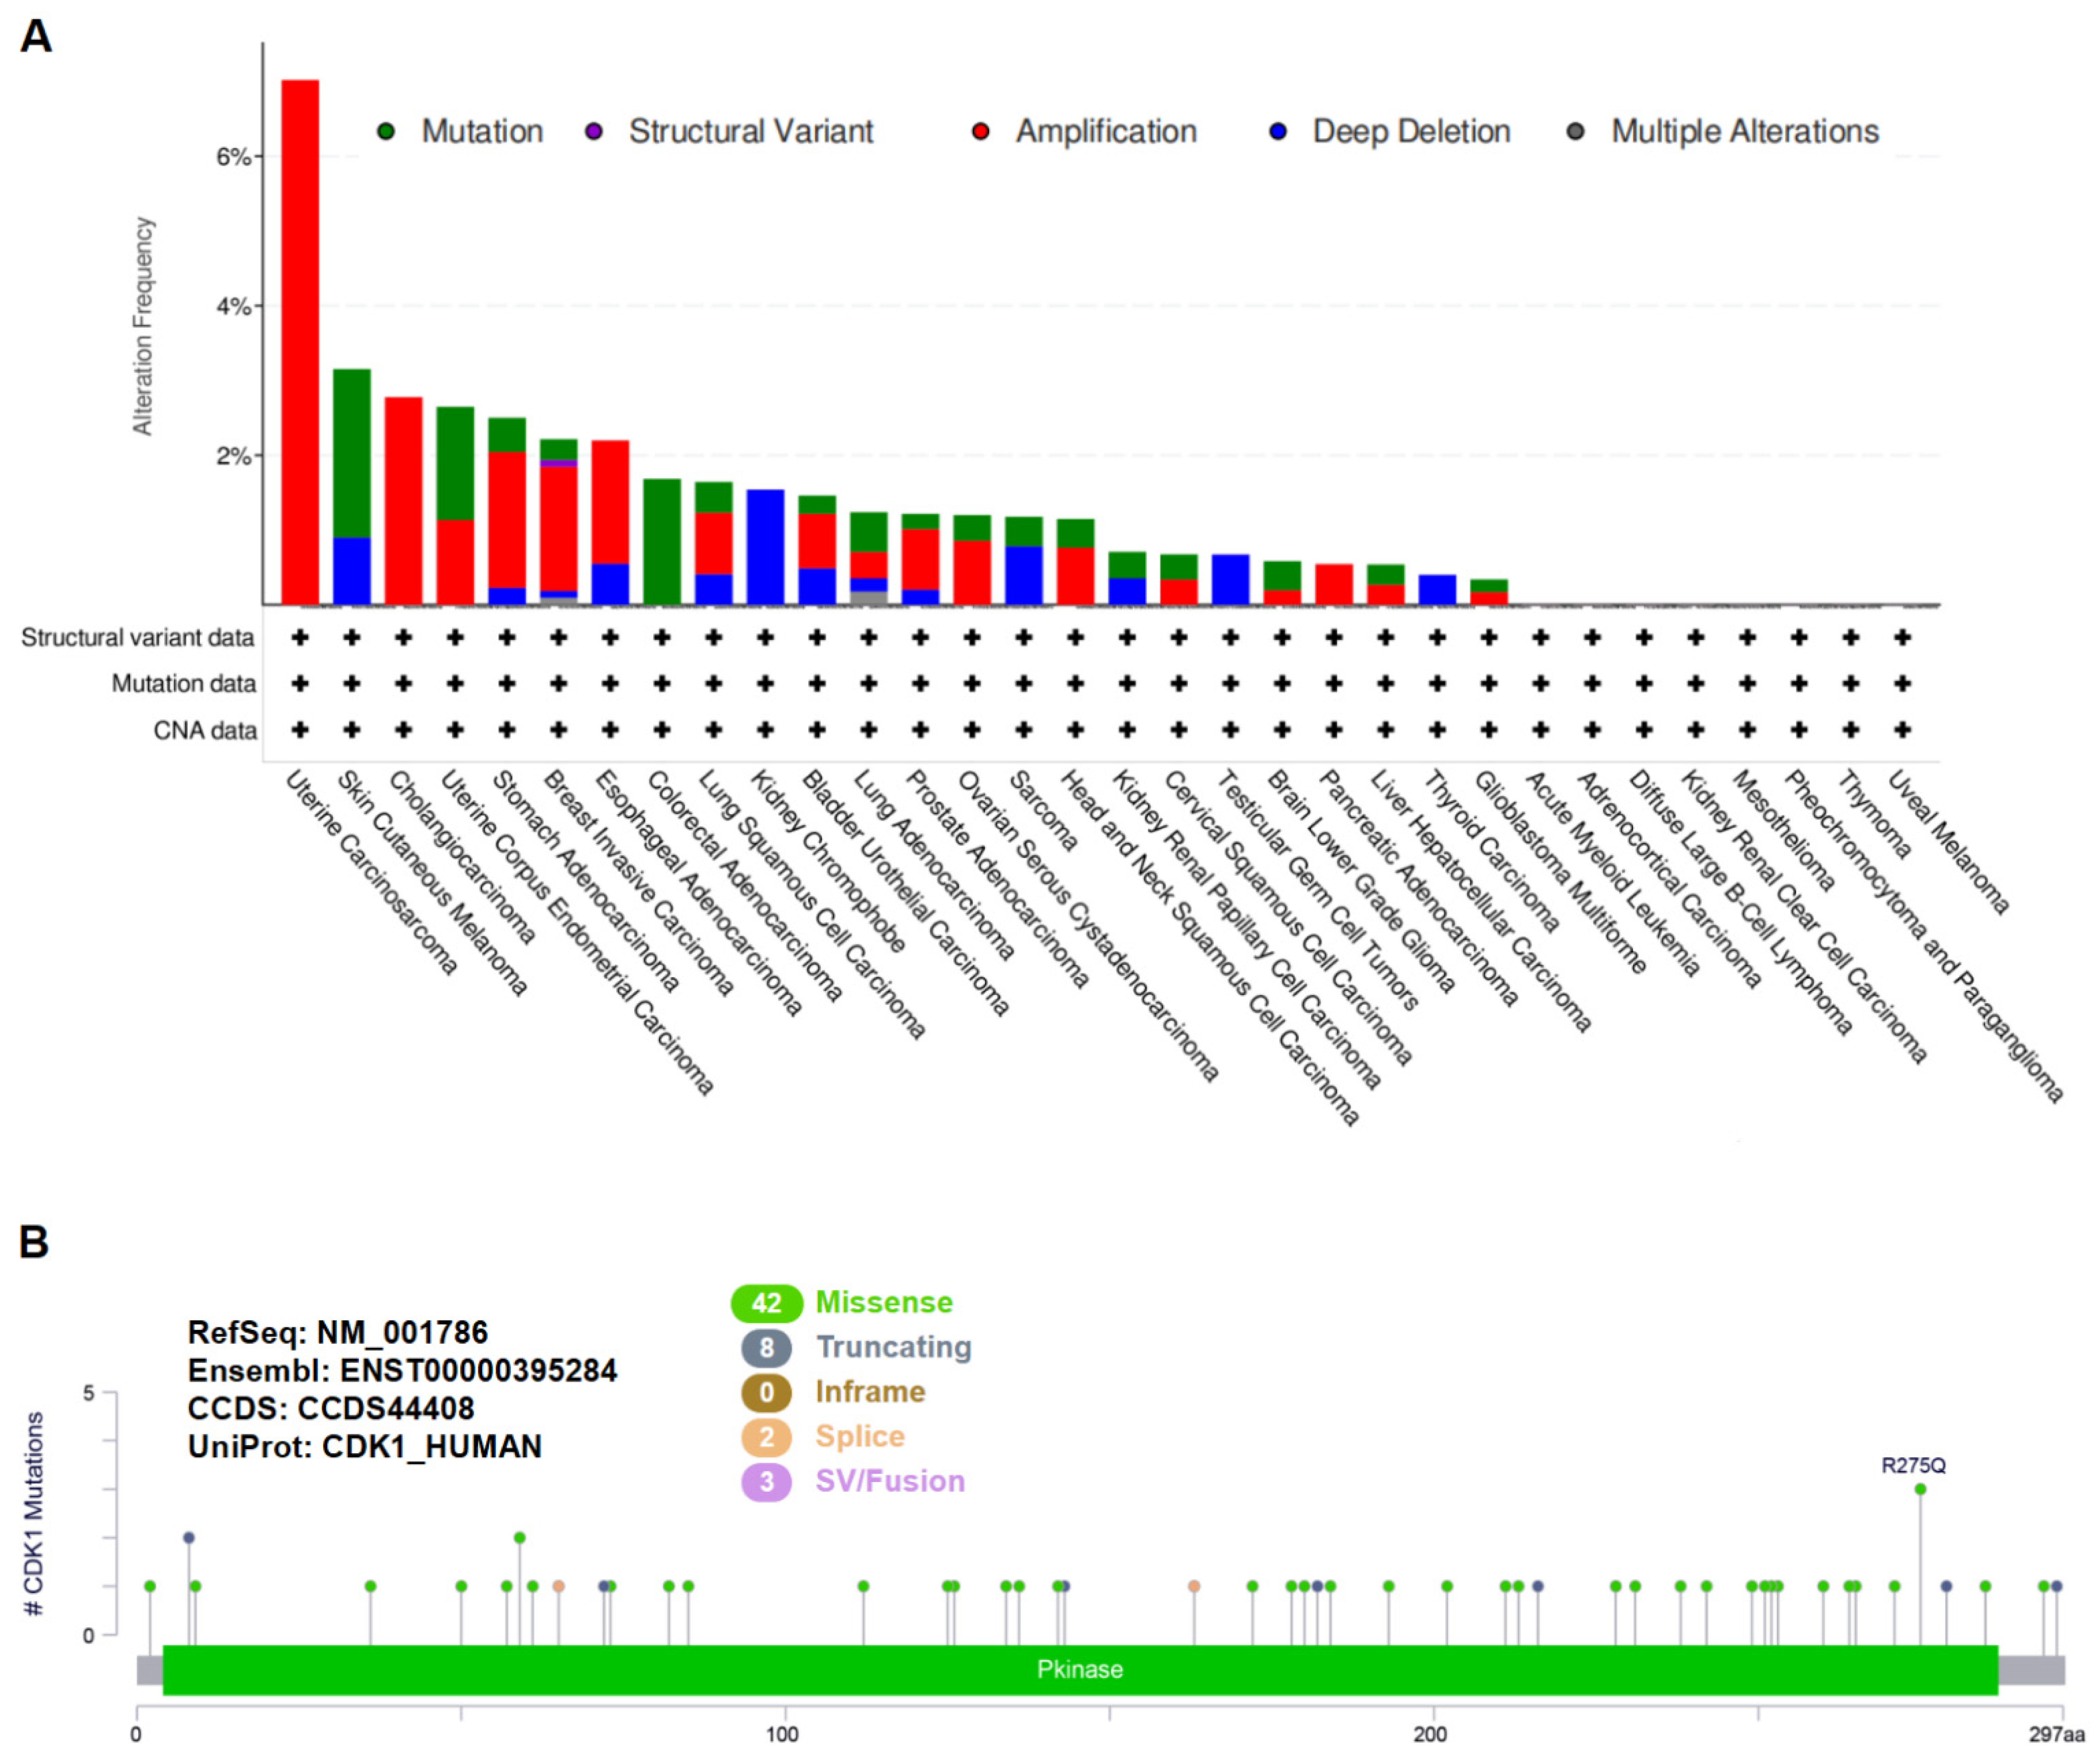
Figure 1. CDK1 genetic alterations in different tumors of TCGA database. (A) The alteration frequencies and types in various tumors. (B) CDK1 mutation types, sites, and case numbers.
Cancers 14 02658 g001
Figure 2. CDK1 mRNA expression in various tumors and normal tissues. The expression of CDK1 in some tumors from the TCGA database was significantly increased as compared to normal tissues from the GTEx database; Expression data were log2 (TPM + 1) transformed for plotting. ** p < 0.01, Wilcoxon test. TPM: transcripts per million.
Cancers 14 02658 g002
Figure 3. CDK1 protein expression in various tumors and normal tissues. (A) The total CDK1 protein expression was significantly higher in primary tumors as compared to normal tissues from the CPTAC database; for a given cancer type, Z-value represents the standard deviation from the median across samples. **** p < 0.0001, Student’s t-test. (B) Immunohistochemistry staining images of CDK1 in human breast, colon, and lung from the HPA database.
Cancers 14 02658 g003
Figure 4. Correlation between CDK1 expression and survival in different tumors. Survival maps of different tumors and Kaplan–Meier curves of LIHC, PAAD, and SARC are given. High CDK1 expression was correlated with (A) overall survival and (B) disease-free survival in multiple tumors from the TCGA database. (C) Nomograms predicting one-, three-, and five-year overall survival of LIHC, PAAD, and SARC. Variables include gender, age, histological grade, pathologic stage, tumor multifocal, margin status, and CDK1 expression. * p < 0.05, ** p < 0.01, *** p < 0.001, **** p < 0.0001, log-rank test. HR: hazard ratio.
Cancers 14 02658 g004
Figure 5. CDK1-related gene network, GO enrichment analysis, KEGG pathway analysis, and protein–protein interactions. (A) Top 5 CDK1-correlated genes in TCGA database, CCNA2, CEP55, KIF11, KIF4A, and ZWINT, Pearson’s correlation coefficients. (B) The heatmap reveals that CDK1 expression was positively correlated with these five genes in all tumor types according to purity-adjusted partial Spearman’s rho values. (C) PPI network of 50 experimentally verified CDK1-interacted proteins. (D) An intersection analysis of the CDK1-interacted and CDK1-correlated genes. (EG) The correlations between CDK1 and biological processes, cellular components, and molecular functions according to GO enrichment analysis. (H) KEGG pathway analysis was performed based on the CDK1-interacted and CDK1-correlated genes.
Cancers 14 02658 g005
Figure 6. Hallmark gene set enrichment analysis (GSEA). “HALLMARK E2F TARGETS”, “HALLMARK G2M CHECKPOINT”, “HALLMARK MTORC1 SIGNALING”, “HALLMARK MYC TARGETS”, and the “HALLMARK P53 PATHWAY” enriched in the high CDK1 expression group compared to the low CDK1 expression group in various tumors. Each line represents one particular gene set with a unique color, with upregulated genes located on the left and the ones with the highest expression on the far left, while downregulated genes are shown on the right. NES: normalized enrichment score; FDR: false discovery rate.
Cancers 14 02658 g006
Figure 7. Oncogenic signature gene set enrichment analysis. CDK1 expression was associated with various signature oncogenes. Each line represents one particular gene set with a unique color, and upregulated genes are located on the left, while down-regulated genes are displayed on the right, with the lowest ones on the right end. ES: enrichment score; NES: normalized enrichment score; FDR: false discovery rate.
Cancers 14 02658 g007
Figure 8. The association of CDK1 expression with ESTIMATEScore, ImmuneScore, and StromalScore in tumors. (A) The heatmap shows that CDK1 expression was significantly associated with these scores in some tumors. (B) Representative scatter plots of GBM, SARC, and STAD are shown. Pearson’s correlation coefficients.
Cancers 14 02658 g008
Figure 9. Association between CDK1 expression and immune infiltration. (A,B) The expression of CDK1 was positively related to MDSC infiltration in almost all of the tumors. Purity-adjusted Spearman’s rho values, with TIDE algorithm. (CE) The representative lollipop chart shows that CDK1 expression was significantly related to the infiltration of various innate and adaptive immune cells in GBM, SARC, and STAD.
Cancers 14 02658 g009
Figure 10. Single-cell data analysis of CDK1 expression in tumors. CDK1 was mainly expressed in malignant cells and also abundantly expressed in some immune cells in GBM, LUAD, and STAD.
Cancers 14 02658 g010
Figure 11. Correlations of immune checkpoints, MSI, and TMB with CDK1 expression. (A) CDK1 expression was significantly associated with many immune checkpoint genes in multiple tumors. (B,C) The radar chart shows that the expression of CDK1 was significantly and positively related to MSI and TMB in several tumors. * p < 0.05, Pearson’s correlation coefficients.
Cancers 14 02658 g011
Publisher’s Note: MDPI stays neutral with regard to jurisdictional claims in published maps and institutional affiliations.