Article

Human Malignant Rhabdoid Tumor Antigens as Biomarkers and Potential Therapeutic Targets

1
Department of Chemistry and Biochemistry, Florida State University, Tallahassee, FL 32306-4390, USA
2
Department of Chemical and Biomedical Engineering, FAMU-FSU College of Engineering, Florida State University, Tallahassee, FL 32310-6046, USA
3
Institute of Molecular Biophysics, Florida State University, Tallahassee, FL 32306-4380, USA
*
Author to whom correspondence should be addressed.
Cancers 2022, 14(15), 3685; https://doi.org/10.3390/cancers14153685
Submission received: 22 June 2022 / Revised: 24 July 2022 / Accepted: 26 July 2022 / Published: 28 July 2022
(This article belongs to the Section Cancer Immunology and Immunotherapy)

Abstract

:

Simple Summary

Atypical teratoid rhabdoid tumor (ATRT) is a deadly type of human pediatric brain cancer without effective treatments. ATRT is mainly linked to the inactivation of a tumor suppressor gene, SMARCB1; however, additional biomarkers remain to be identified to develop novel therapeutic strategies. Therefore, different tumor antigens and extracellular matrix modulators were investigated in two human ATRT and one kidney malignant rhabdoid tumor cell lines and compared with the nonmalignant HEK293 cell line. Alpha-fetoprotein (AFP), mucin-16 (MUC16 or cancer antigen 125/CA125), osteopontin (OPN), and mesothelin (MSLN) are highly expressed in these human malignant rhabdoid cancer cell lines. Inhibiting MMPs using a small-molecule inhibitor decreased cell survival. This biomarker discovery process may lead to the identification of novel diagnostic and therapeutic strategies, such as the development of targeted and immunotherapies against cancer biomarkers, to treat cancer patients.

Abstract

Introduction: Atypical teratoid rhabdoid tumor (ATRT) is a lethal type of malignant rhabdoid tumor in the brain, seen mostly in children under two years old. ATRT is mainly linked to the biallelic inactivation of the SMARCB1 gene. To understand the deadly characteristics of ATRT and develop novel diagnostic and immunotherapy strategies for the treatment of ATRT, this study investigated tumor antigens, such as alpha-fetoprotein (AFP), mucin-16 (MUC16/CA125), and osteopontin (OPN), and extracellular matrix modulators, such as matrix metalloproteinases (MMPs), in different human malignant rhabdoid tumor cell lines. In addition, the roles of MMPs were also examined. Materials and methods: Five human cell lines were chosen for this study, including two ATRT cell lines, CHLA-02-ATRT and CHLA-05-ATRT; a kidney malignant rhabdoid tumor cell line, G401; and two control cell lines, human embryonic kidney HEK293 and HEK293T. Both ATRT cell lines were treated with a broad-spectrum MMP inhibitor, GM6001, to investigate the effect of MMPs on cell proliferation, viability, and expression of tumor antigens and biomarkers. Gene expression was examined using a reverse transcription polymerase chain reaction (RT-PCR), and protein expression was characterized by immunocytochemistry and flow cytometry. Results: All the rhabdoid tumor cell lines tested had high gene expression levels of MUC16, OPN, AFP, and MSLN. Low expression levels of neuron-specific enolase (ENO2) by the two ATRT cell lines demonstrated their lack of neuronal genotype. Membrane-type 1 matrix metalloproteinase (MT1-MMP/MMP-14) and tissue inhibitor of metalloproteinases-2 (TIMP-2) were highly expressed in these malignant rhabdoid tumor cells, indicating their invasive phenotypes. GM6001 significantly decreased ATRT cell proliferation and the gene expression of MSLN, OPN, and several mesenchymal markers, suggesting that inhibition of MMPs may reduce the aggressiveness of rhabdoid cancer cells. Conclusion: The results obtained from this study may advance our knowledge of the molecular landscapes of human malignant rhabdoid tumors and their biomarkers for effective diagnosis and treatment. This work analyzed the expression of human malignant rhabdoid tumor antigens that may serve as biomarkers for the development of novel therapeutic strategies, such as cancer vaccines and targeted and immunotherapies targeting osteopontin and mesothelin, for the treatment of patients with ATRT and other malignant rhabdoid tumors.

Graphical Abstract

1. Introduction

Malignant rhabdoid tumors are aggressive tumors that mostly appear in children under two years of age [1]. Atypical teratoid rhabdoid tumors (ATRTs) are malignant rhabdoid tumors in the brain [1,2]. ATRT is a rare disease and accounts for 2% of pediatric brain tumors and 4.4% of central nervous system tumors in children younger than five years old [3,4]. ATRT is difficult to diagnose and a deadly disease with no effective treatment. Currently, the standard treatment of ATRTs includes surgery to remove the tumor, intensive radiation, and chemotherapy. ATRT prognosis is very poor. The three-year overall survival rate is 22%, and the tumor-free survival rate is 13% [1,5,6].
ATRT has several histological features, including eosinophilic cytoplasm, large nucleoli, and filamentous cytoplasmic inclusions [7]; however, tumors may present a host of neural, epithelial, mesenchymal, or ependymal patterns that make them variable and difficult to diagnose by histology [7]. In 1999, ATRT was mainly linked to the hSNF5/INI-1/SMARCB1 gene’s inactivation on chromosome 22 [8]. As antibodies against SMARCB1 developed, immunohistochemistry effectively determined the lack of protein expression in cancerous tissue samples [9]. In addition, the unexpressed SMARCB1 protein is exclusive to ATRT and other cancers, such as kidney RT, chordoma, epithelioid sarcoma, and medullary renal cell carcinoma [10,11,12,13]. These findings suggest that SMARCB1 expression alone is neither sufficiently sensitive nor specific for ATRT. Therefore, additional biomarkers should be investigated for ATRT characterization.
CD44 is expressed on the surface of ATRT cells and tumor mesenchymal stromal cells from the rhabdoid tumor microenvironment [14]. In addition, CD44 is regulated by the BRG-1 subunit of the SWI–SNF complex [15]; hence, it was investigated in the study. The level of CD44 cleavage is significantly associated with OPN and OPN–CD44 interaction [16], suggesting that both OPN and CD44 could be potential tumor markers for ATRT. CD99 functions in monocyte migration and in endothelial cells under normal physiological conditions [17]; however, it is expressed in most ATRT cases and has been suggested to be an ATRT biomarker [18,19,20,21]. CD99 positivity has been used to eliminate tumor diagnosis as primitive neuroectodermal tumor and rhabdoid meningioma [19]. Although the chorionic gonadotropin subunit beta 3 (CGB3) gene is overexpressed in fetal cells and various cancer types [22], the connection between CGB3 and rhabdoid tumors has yet to be investigated. Alpha-fetoprotein (AFP) is essential to embryonic development because it involves crosstalk with albumin and directs specific brain region development through the neurotrophic effects of oleic acid [23]. It is also a biomarker for several cancer types, especially hepatocellular carcinoma [24,25,26]. Nucleophosmin 1 (NPM1) is important for various cellular pathways, including mRNA transport, chromatin remodeling, apoptosis, and genome stability [27]. One study showed that NPM1 is one of the most upregulated genes in ATRT, and inhibiting NPM1 could arrest cancerous cells at the G1 checkpoint [28]. Therefore, these common cancer biomarkers were chosen for this study.
Compared with medulloblastoma, ATRT has a stemness-like feature and expresses an embryonic stem cell gene profile of OCT4, NANOG, SOX2, and c-MYC [29]. Hence, embryonic markers were also investigated. In addition, SSEA1 (Stage-Specific Embryonic Antigen 1, fucosyltransferase 4, CD15), a glioblastoma tumor stem cell marker, was investigated [30]. MUC16, also called cancer antigen 125 (CA125) [31], is expressed in various types of brain cancer, such as glioblastoma [32] and medulloblastoma [33], and nonbrain cancer, such as ovarian cancer, breast cancer, pancreatic cancer, gastric cancer, and lung cancer [34,35,36,37,38]. MUC16 can bind to membrane proteins of different tissues, promote metastasis in various cancer types, induce cell proliferation and metastasis, and protect tumor cells from chemotherapy [31,35,39,40,41,42,43,44,45]. MSLN is a 40 kDa glycosyl-phosphatidylinositol (GPI)-anchored membrane protein. The normal physiological function of MSLN is not clear, but it is highly expressed in the lung, heart, spleen, liver, kidney, and testis of adult mouse tissues [46]. The protein, however, is not essential for mouse growth and reproduction [46]. MSLN might be involved in cell adhesion [47]. MSLN is overexpressed in various cancer types, including mesothelioma [47], lung cancer [48], pancreatic cancer [49,50], ovarian cancer [47,51], breast cancers [52], and meningiomas [53]. Overexpression of MSLN indicates a poor prognosis for cancer patients [48,54]. Therefore, both MSLN and MUC16 were examined to find out whether they are also ATRT biomarkers.
Matrix metalloproteinases (MMPs) are zinc-dependent endopeptidases/proteinases with the function of degrading extracellular matrix (ECM) proteins, including basement membrane and interstitial matrix [55]. Their roles in an inflammatory response and vascular diseases have been discussed [56]. MMPs are potential biomarkers of invasive and metastatic cancer cells. Our study has detected elevated expression levels of several MMPs by ATRT cells.
The expression levels of tissue inhibitors of metalloproteinases (TIMPs) and disintegrin and metalloproteinases (ADAMs) were also measured in the five cell lines. ADAMs are anchored on the cell membrane, functioning in processes of fertilization, restenosis, neurogenesis, and tumor invasion and metastasis by degrading ECM [57,58], whereas TIMPs usually serve as tentative agents targeting MMPs to treat cancer, cardiovascular diseases, multiple sclerosis, and other diseases [59]. We have demonstrated that TIMPs and ADAMs are differentially expressed by the two ATRT cell lines studied.
Diagnostic and therapeutic biomarkers with improved sensitivity and specificity are needed for ATRT due to its complexity [60,61]. ATRT biomarker discovery is an under-explored area of research. Therefore, the gene and protein expression levels of cancer biomarkers and extracellular matrix modifiers (MMPs, TIMPs, and ADAMs) were characterized in different malignant rhabdoid tumor cell lines to identify ATRT biomarkers. This study is a discovery science project that aimed to identify biomarkers for malignant rhabdoid tumor diagnosis and treatment.

2. Materials and Methods

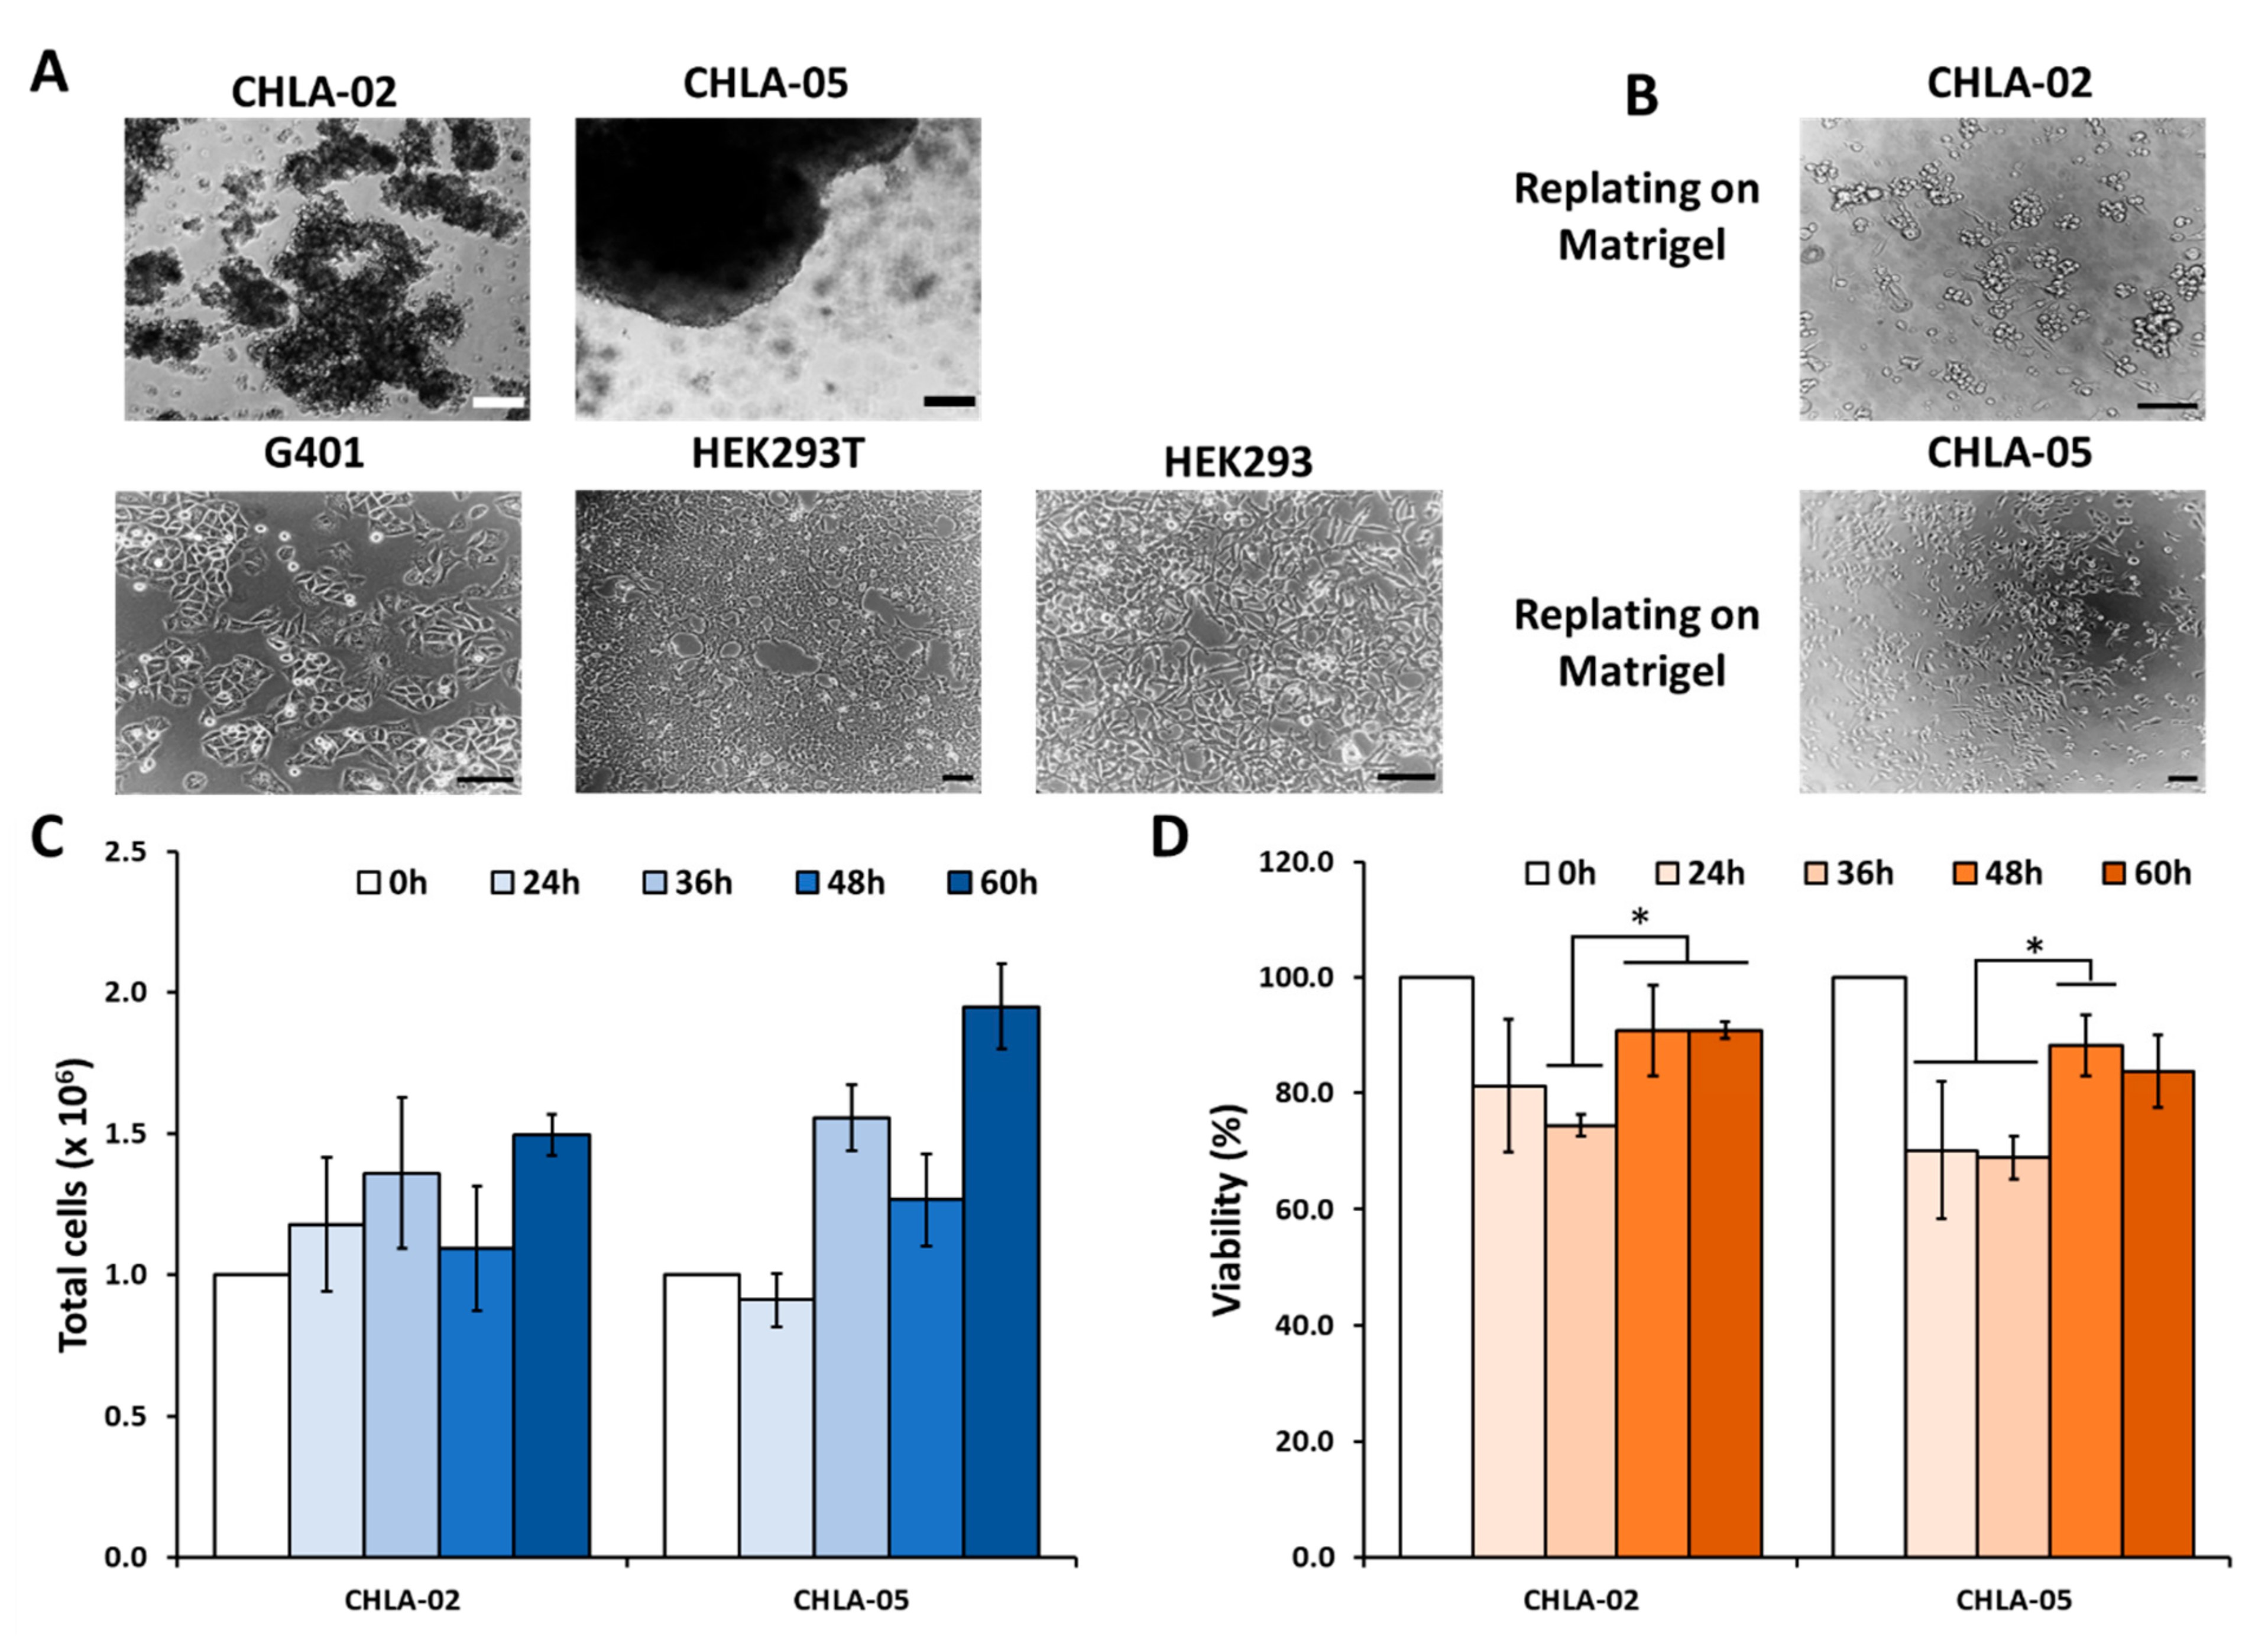
2.1. Culturing Human Malignant Rhabdoid Tumor Cells and Nonmalignant Cells

Both CHLA-02-ATRT (ATCC® CRL-3020TM, ATCC) and CHLA-05-ATRT (ATCC® CRL-3037TM, ATCC) cells were cultured based on the manufacturer’s protocol. Briefly, the cells were plated in suspension using Gibco Dulbecco’s Modified Eagle Medium: Nutrient Mixture F-12 (DMEM/F12, Thermo Fisher Scientific, Waltham, MA, USA) supplemented with 2% B-27, 20 ng/mL of epidermal growth factor (EGF, 78,006.1, STEMCELL Technologies, Vancouver, BC, Canada), and 20 ng/mL of fibroblast growth factor (FGF)-2 (78,003.1, STEMCELL Technologies), in a non-treated 6-well plate at 37 °C, 5% CO2. The initial cell density was 1 × 10⁶ cells/mL. The cell density was determined every 2 to 3 days using a hemocytometer (see Section 2.2), and new media was added accordingly. When the cells reached high confluence (2 × 10⁶ cells/mL), they were passaged at the ratio of 1:6 into a new vessel.
HEK293 (ATCC® CRL-1573TM, ATCC) and HEK293T (ATCC® CRL-11268TM, ATCC) cells were cultured in DMEM supplemented with 10% fetal bovine serum (FBS) at 37 °C at 5% CO2. The cells were passaged when they reached 80% confluence using trypsin (37 °C, 5% CO2, 5 min). G401 (ATCC® CRL-1441TM, ATCC) was cultured based on the ATCC protocol. Briefly, the cells were cultured in McCoy’s 5A Medium (ATCC® 30-2007TM, ATCC) supplemented with 10% FBS. The cells were also passaged upon reaching 80% confluence.

2.2. Cell Proliferation Assay and Imaging

Both CHLA-02 and CHLA-05 were harvested from suspension and washed three times with PBS. Then, the samples were treated with Accumax (AM105, Innovative Cell Technologies, Inc., San Diego, CA, USA) for 20 min at 37 °C at 5% CO2. Then, 6% FBS in phosphate-buffered saline (PBS) was used to quench the reaction. A mixture of the cell solution with Trypan Blue 0.4% (T10282, Thermo Fisher Scientific) at a 1:1 ratio was pipetted onto Countess chamber slides (C10228, Thermo Fisher Scientific) using the Countess® II FL instrument (AMQAF1000, Thermo Fisher Scientific). The total cell number and cell viability were reported.
The images of CHLA-02 and CHLA-05 aggregates were taken using an Olympus IX70 microscope (Melville, NY). In addition, some of the aggregates of CHLA-02 and CHLA-05 were replated on MatrigelTM-coated surfaces to let the cells spread outward from the spheroids. The images of these cells were also taken using an Olympus IX70 microscope.

2.3. Reverse Transcription Polymerase Chain Reaction (RT-PCR) Analysis

An E.Z.N.A.® Total RNA Kit I (R6834, OMEGA Bio-Tek, Norcross, GA, USA) was used to isolate the total RNA from each cell line, and an RNA Clean & Concentrator-5 kit (R1013, Zymo Research, Irvine, CA, USA) was used to clean and concentrate the total mRNA samples. The reverse transcription required 2 μg of the total RNA, anchored oligo-dT primers (Operon, Huntsville, AL, USA), and Superscript III (Invitrogen, Carlsbad, CA, USA) and was performed according to the manufacturer’s protocol. The primers specific to target genes (Tables S1, S5, and S7) were designed using Primer-BLAST (NCBI), and the melting temperature was checked using NetPrimer Analysis (PREMIER Biosoft, Palo Alto, CA, USA). The β-ACTIN (ACTB) gene was used as an endogenous control for normalizing expression levels. RT-PCR was performed on an ABI7500 instrument (Applied Biosystems, Waltham, MA, USA) using SYBR1 Green PCR Master Mix (Applied Biosystems). The amplification reactions were 2 min at 50 °C, 10 min at 95 °C, and 40 cycles of 95 °C for 15 s, 55 °C for 30 s, and 68 °C for 30 s. The fold variation in gene expression was quantified using the comparative 2−ΔΔCT method based on the comparison of expression of the target genes (normalized to the endogenous control β-actin) among different conditions.

2.4. Immunocytochemistry

The cells were replated on a MatrigelTM-coated 96-well plate and then fixed with 4% paraformaldehyde (PFA). For nuclear markers, the cells were permeabilized with 0.5% Triton X-100. The samples were then blocked in 2% FBS in phosphate-buffered saline (PBS) for 1 h and incubated with various mouse antibodies in a blocking buffer at 4 µg/mL (Table S3) overnight at 4 °C. After washing with PBS, the cells were incubated with the corresponding secondary antibody for one hour at room temperature (Table S4). Finally, the samples were stained with Hoechst 33342 and visualized using a fluorescent microscope (Olympus IX70, Melville, NY, USA).

2.5. Flow Cytometry

Briefly, 1 × 10⁶ cells/sample were fixed with 4% PFA and permeabilized with cold methanol. The samples were then blocked with 2% FBS in PBS and stained with the corresponding markers in 2% FBS in PBS overnight at 4 °C. The secondary Alexa Fluor 488 or 594 was used and incubated for an hour at room temperature. The samples were washed with PBS before being acquired with a BD FACSCanto II flow cytometer (Becton Dickinson, Franklin Lakes, NJ, USA). The data were analyzed against the isotype control using FlowJo software.

2.6. MMP Inhibitor GM6001 Preparation and Treatment

CHLA-02 and CHLA-05 cells were replated at a density of 1.6 × 10⁶ cells/mL. GM6001 (CC1000, Sigma Aldrich, St. Louis, MO, USA) was dissolved in DMSO to a stock concentration of 8 mM and added to the culture at a final concentration of 10 µM [62]. After 48 h, phase-contrast images of the aggregates were taken. Some cells were replated on Matrigel. In addition, the cells were harvested for RT-PCR analysis for epithelial, mesenchymal, and important ATRT biomarkers (MSLN, MUC16, and OPN).

2.7. Statistical Analysis

The RT-PCR, cell proliferation, and cell viability results were presented as means ± standard deviations. In addition, they were repeated as three independent data points (n = 3). To compare two conditions in Figure 1, Figure 2, Figure 3, Figure 4, Figure 5 and Figure 6, the Student’s t-test was used to determine the significance. A p-value < 0.05 was considered significant. On the other hand, for comparing more than two different conditions (Figure 1D), a one-way analysis of variance (ANOVA) was used, followed by Tukey’s post hoc test. Significance was determined with a p-value < 0.05.

3. Results

3.1. AFP, MSLN, OPN, and MUC16 Are Highly Expressed Biomarkers for ATRT

Unlike G401, HEK293T, and HEK293, both CHLA-02 and CHLA-05 formed aggregates in the long-term culture (Figure 1A); however, both ATRT cell lines could attach when replated on a Matrigel-coated surface. Some CHLA-02 cells retained their morphology similar to that in suspension culture; however, many CHLA-05 cells spread out entirely after 3 days of culture (Figure 1B). Both cell lines steadily increased their proliferation rates over time. At the time points of 24 h and 36 h, the CHLA-02 proliferation rate was similar to that of CHLA-05. After two days, the total population of CHLA-05 was higher than CHLA-02 (Figure 1C). In addition, CHLA-02 and CHLA-05 cells showed higher viability after 48 h of culture (Figure 1D).
The biomarkers (Table 1) were chosen based on published data for different cancer markers in the brain and in other common cancer types [23,28,63,64,65,66]. The gene expression of these markers was characterized using various primer pairs (Table S1). MUC16, OPN, AFP, and MSLN gene expression were highly expressed in all malignant rhabdoid tumor cell lines (CHLA-02, CHLA-05, and G401) (Figure 2A–D). The expression of OPN was extremely high for rhabdoid tumors, especially in both ATRT cell lines. On the other hand, SSEA1 and CD99 might not be good markers for ATRT. The low expression of ENO2 for CHLA-02 and CHLA-05 suggests that these ATRT cells do not have neuronal characteristics in the brain. CGB3 and CD44 were not consistent among the ATRT samples. Specifically, CGB3 was highly expressed in CHLA-05 but lower in CHLA-02 and in the nonmalignant cell line. CD44 was highly expressed in CHLA-02 but low in CHLA-05. OCT4 was inconclusive for ATRT, even though it is helpful as a marker for G401. NPM1 has been proposed as a potential biomarker for ATRT [28], and the gene expression in both ATRT cell lines was lower than that in HEK293 (Figure 2A–D). The gene expression levels for all the primer pairs are presented in Figures S1 and S2 and Table S2.
Immunocytochemistry experiments were performed to detect the protein expression of several markers (Figure 2E, Tables S3 and S4, and Figures S3–S6). AFP was not expressed in HEK293; however, it was highly expressed in CHLA-02 and G401, though not in CHLA-05. CD44 was expressed in both ATRT cell lines and HEK293. CD99, OCT4, and OPN were well-expressed in all the rhabdoid tumor cell lines and HEK293. MSLN protein expression levels were low in both ATRT cell lines and in G401 and HEK293 cells, although the expression levels seemed to be slightly higher in CHLA-05, G401, and HEK293 cells.

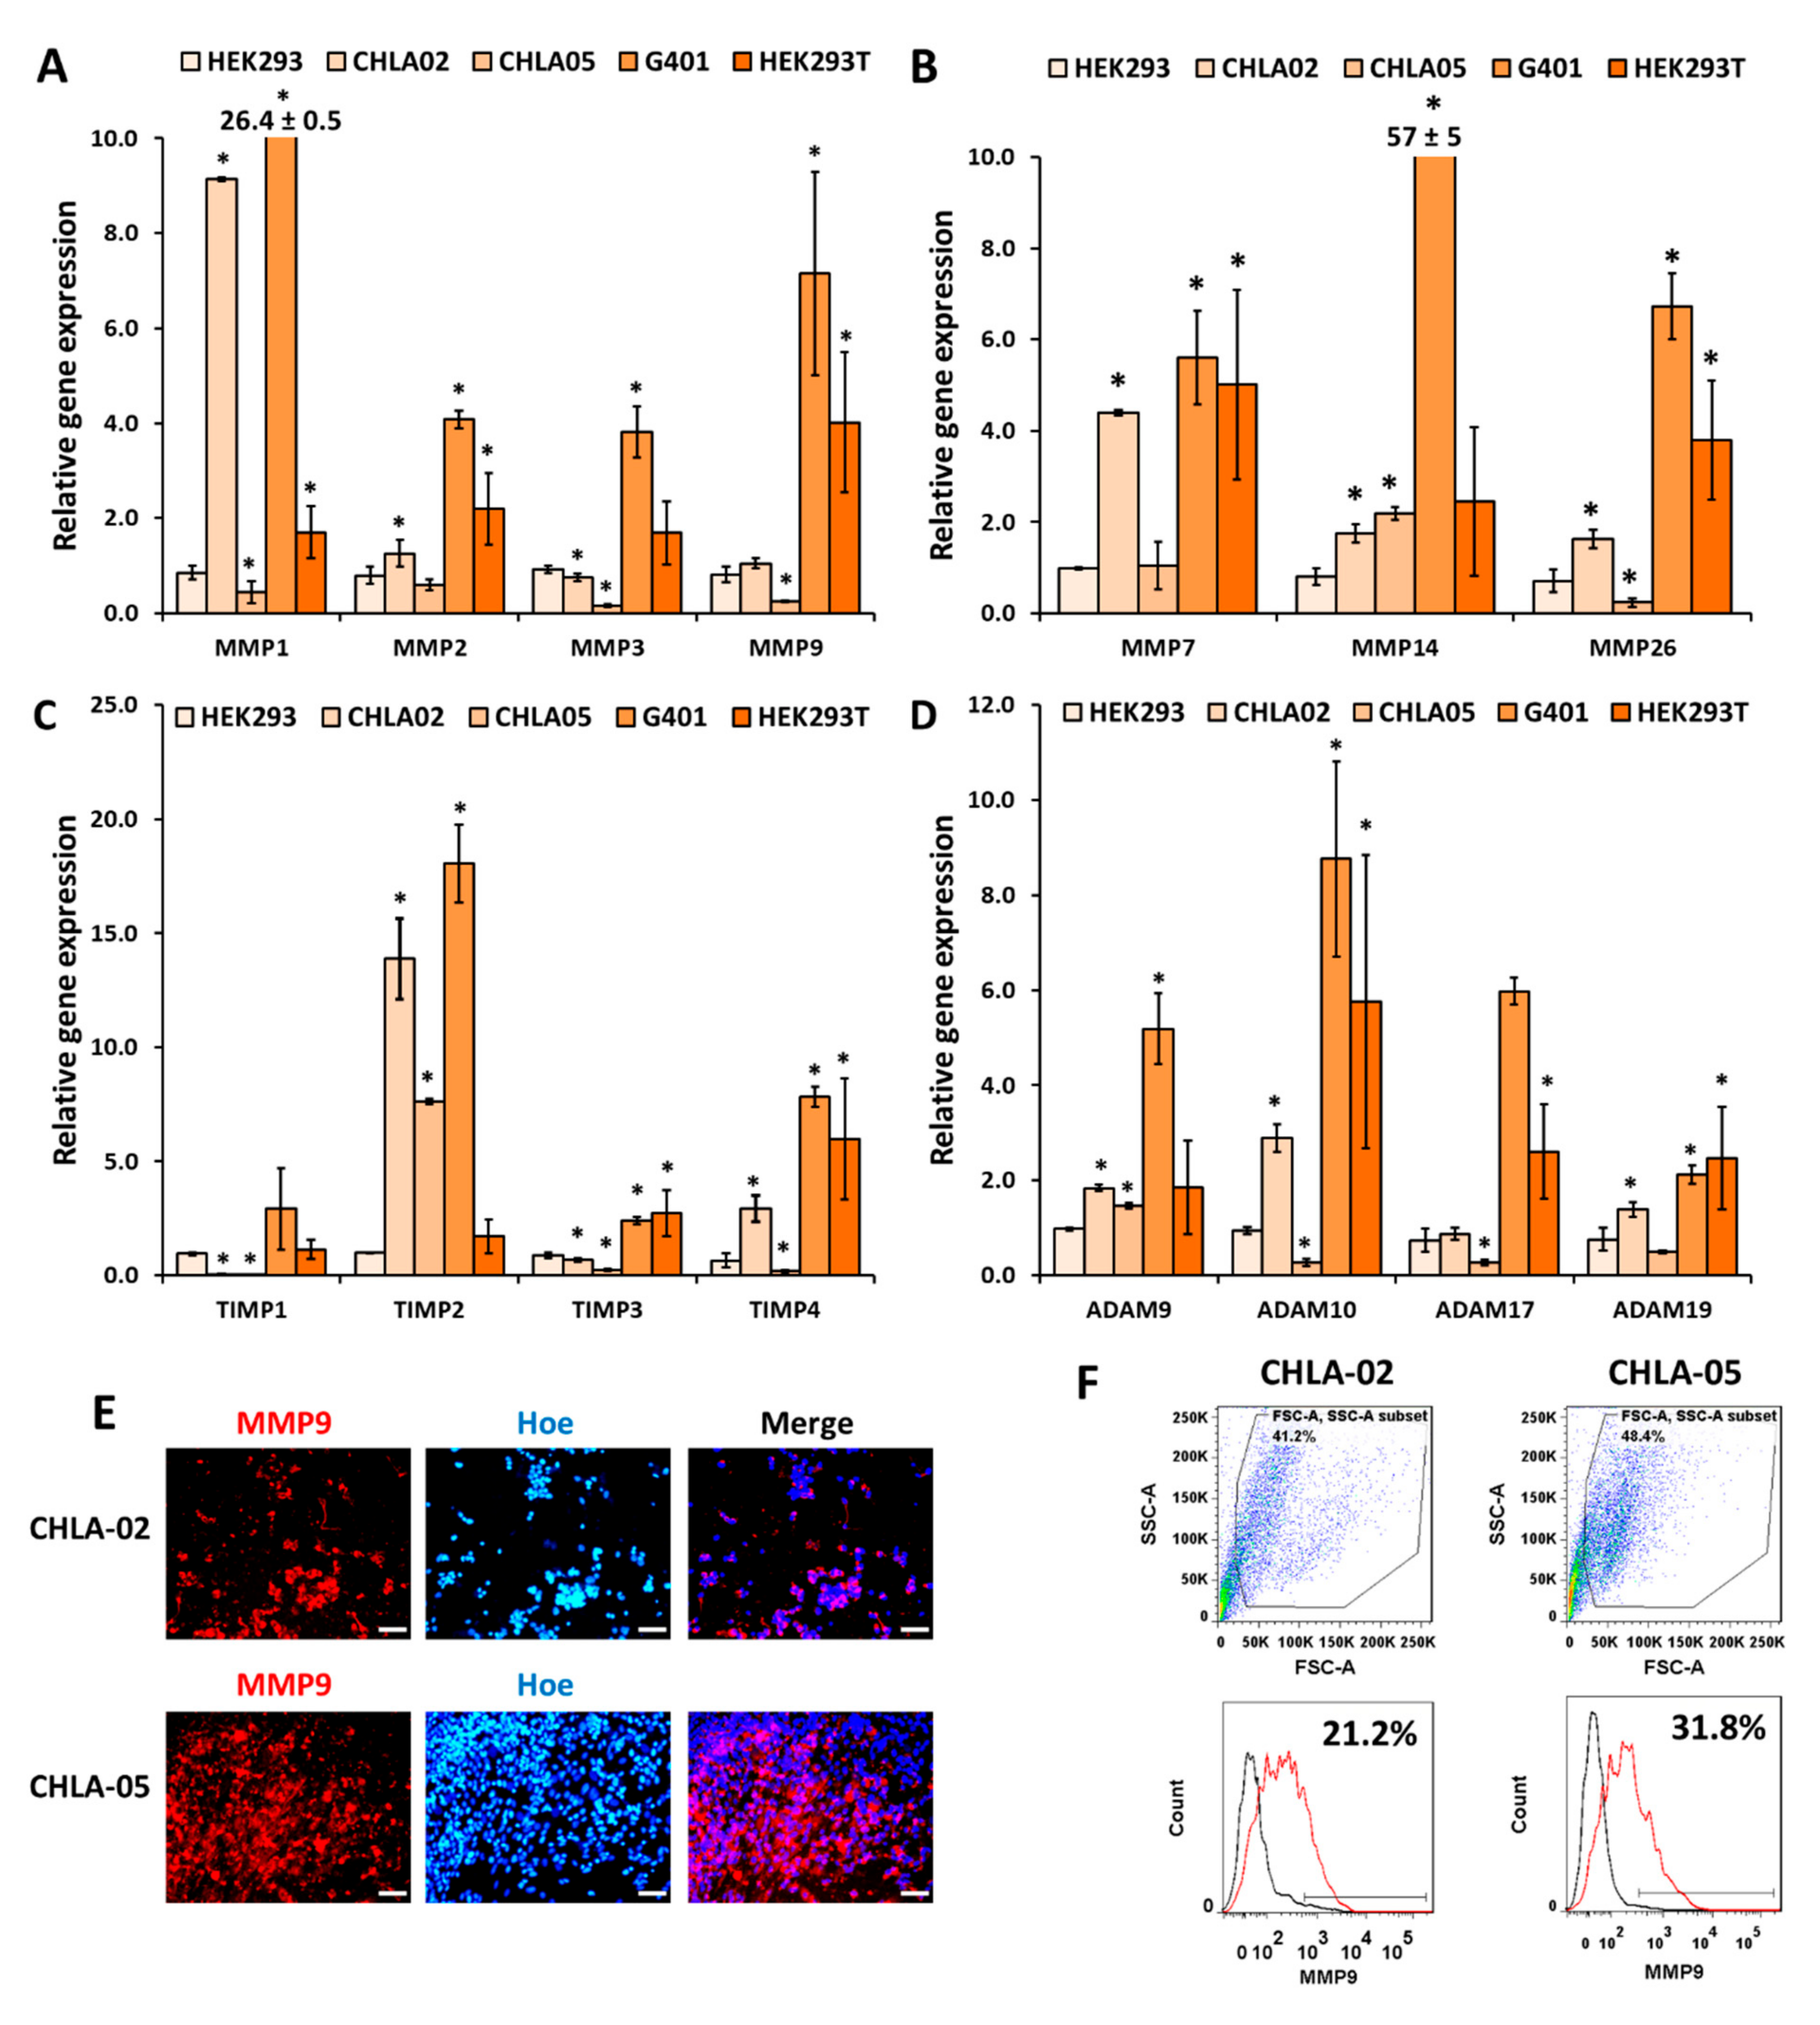
3.2. CHLA-02 Cells Expresseed Higher Levels of MMPs Than CHLA-05 Cells

The gene expressions of several matrix metalloproteinases (MMPs), tissue inhibitors of metalloproteinases (TIMPs), and a disintegrin and metalloproteinases (ADAMs) were characterized for all five cell lines (Figure 3A–D, Tables S5 and S6). CHLA-05 cells had a lower expression of MMP1, 3, 9, 26, TIMP1, 3, 4, ADAM10, and 17 than HEK293. CHLA-05 cells expressed a high MMP9 protein level (Figure 3E,F). CHLA-02 showed high gene expression levels of MMP1, 7, 14, and 26, as well as a high MMP9 protein level (Figure 3). G401 cells expressed high levels of all the selected MMPs, especially MMP14 (Figure 3A,B). These results indicate that CHLA-02 and G401 cells are highly invasive.
TIMP1 might not play an essential role in the cellular processes for ATRT cells due to its low expression in both CHLA-02 and CHLA-05; however, CHLA-02 expressed high levels of TIMP2 and 4, whereas CHLA-05 only showed an increased expression of TIMP2. TIMP2, 3, and 4 were also expressed highly in G401 cells. HEK293T cells expressed a high level of TIMP4 (Figure 3C). On the other hand, CHLA-02 cells showed high-level expression of the selected ADAMs but not ADAM17. Both CHLA-02 and CHLA-05 expressed ADAM9. G401 cells expressed all the studied ADAMs (Figure 3D), indicating that G401 cells participated highly in extracellular matrix remodeling.

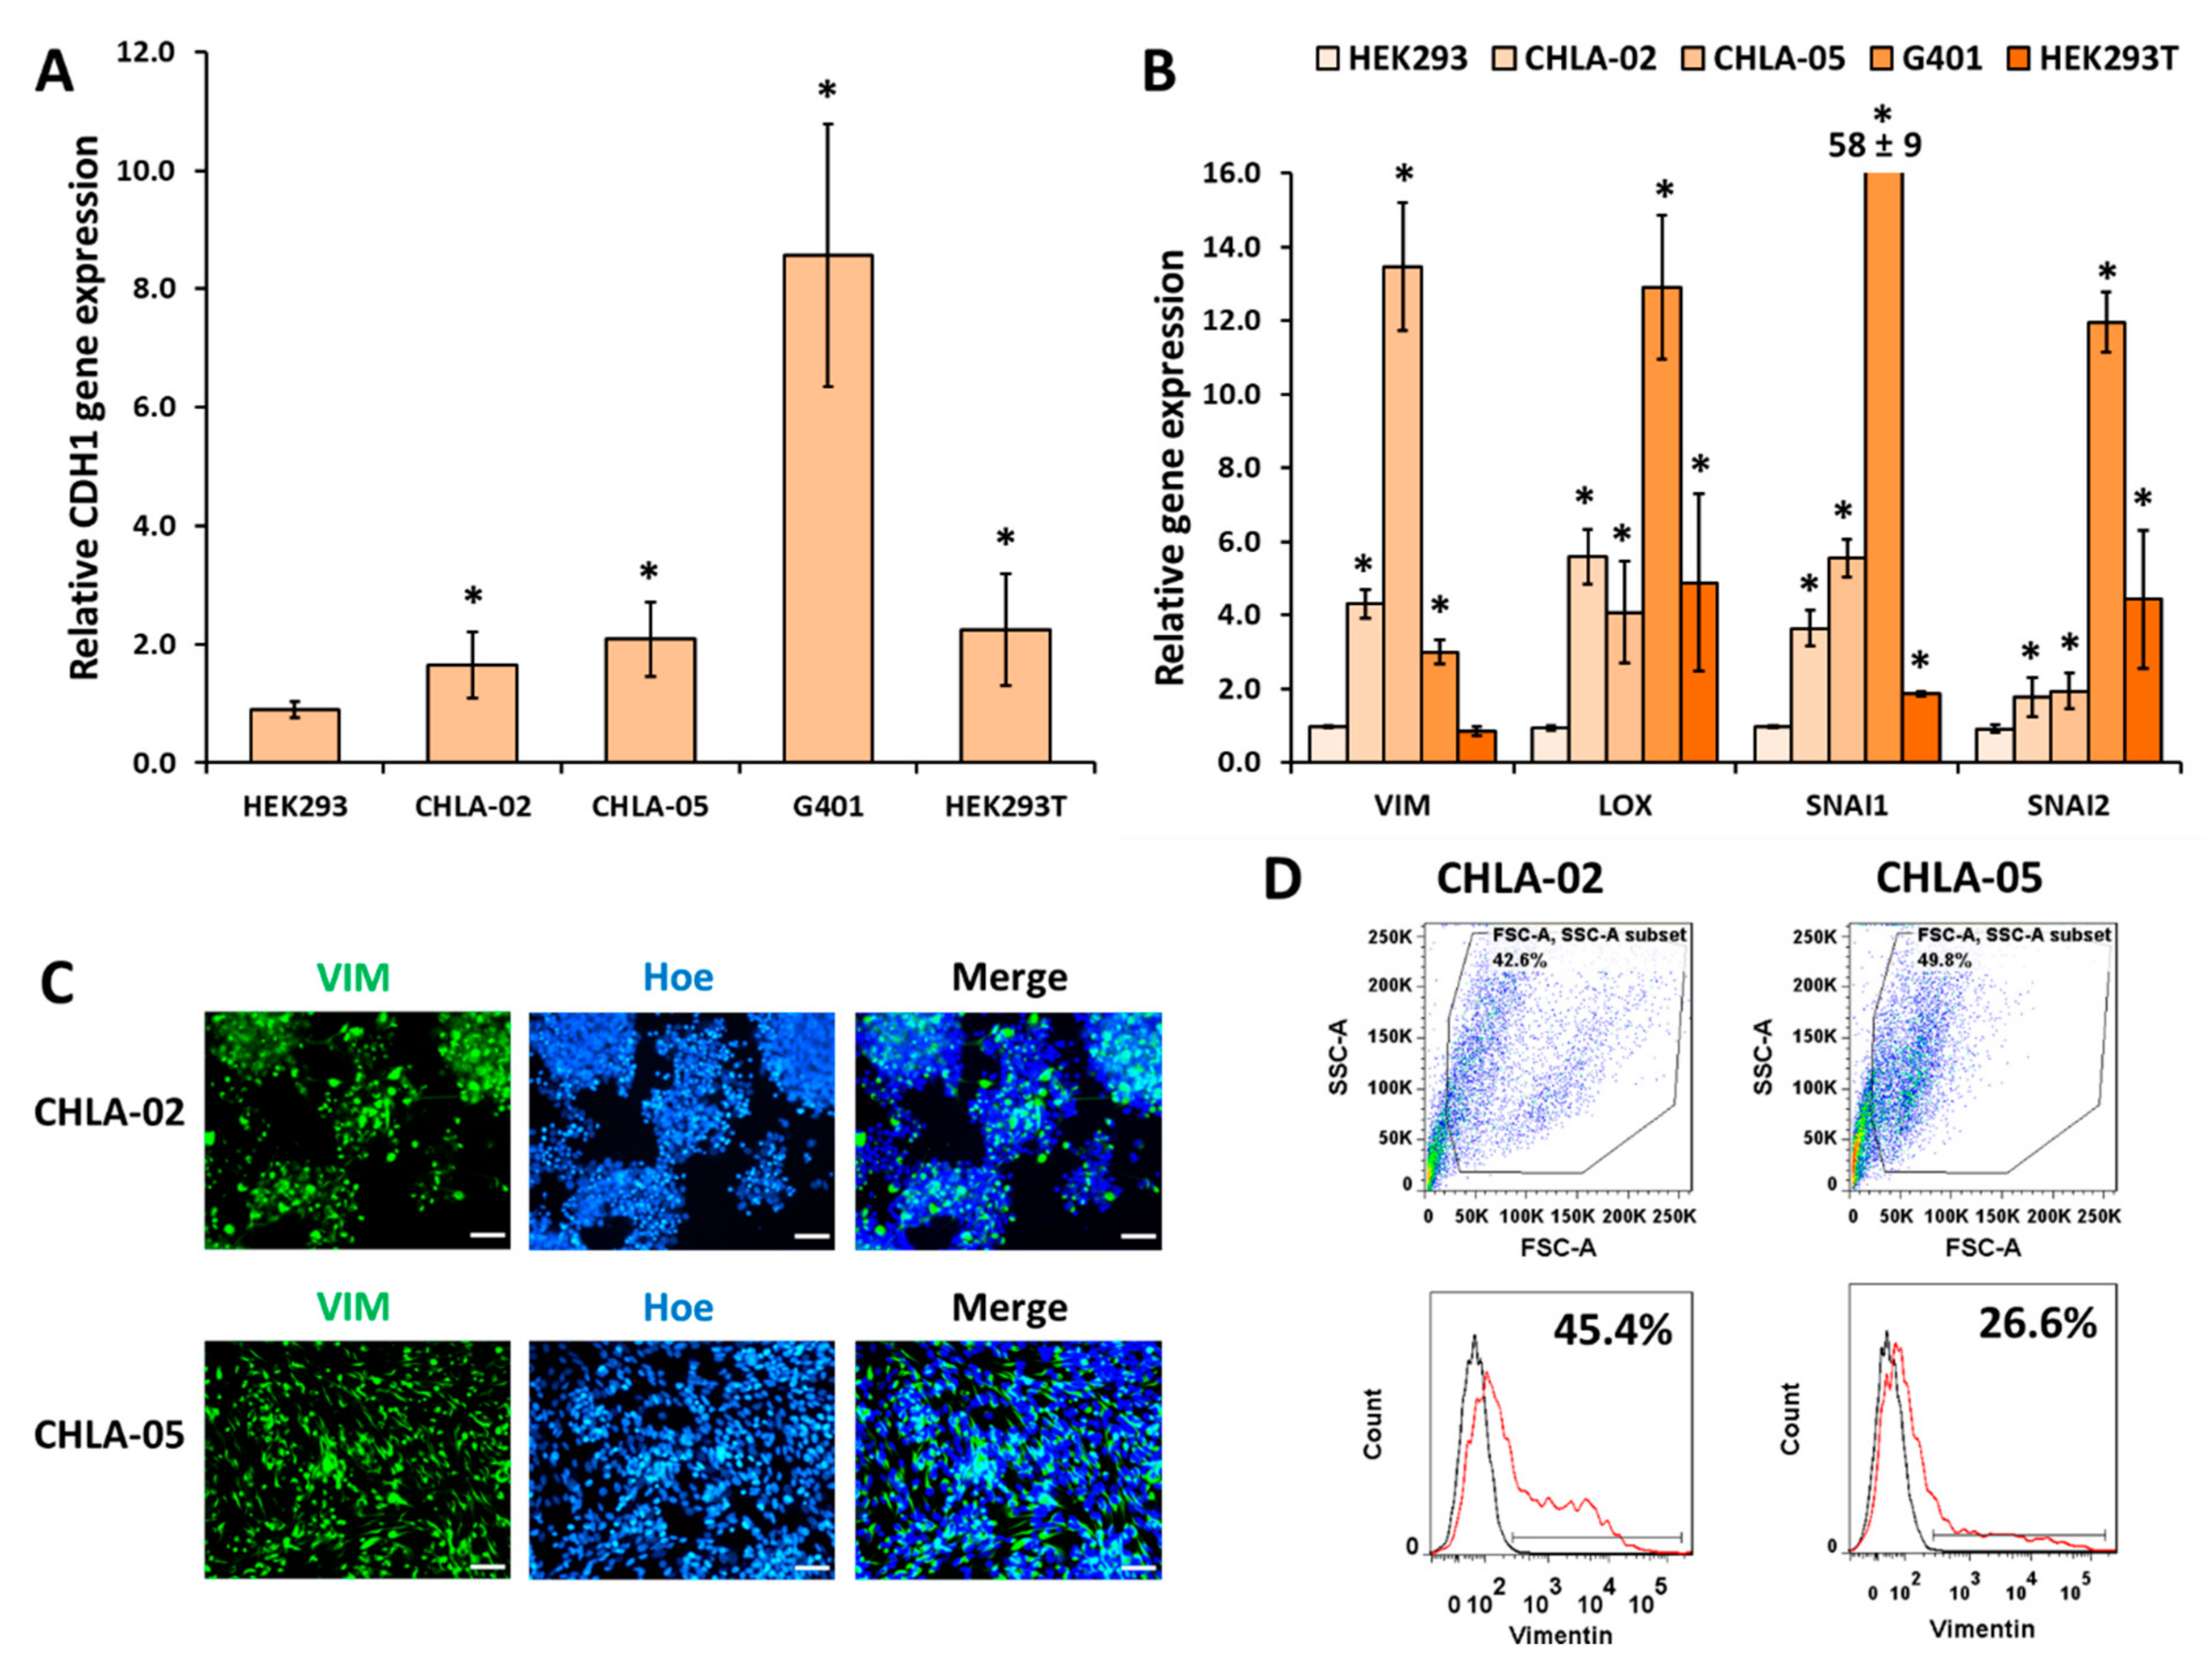
3.3. Mesenchymal Markers Were Highly Upregulated in the Malignant Rhabdoid Tumors

All five cell lines were characterized for epithelial (CDH1) and mesenchymal markers (VIM, LOX, SNAI1, and SNAI2). The epithelial gene expression of CDH1 was higher in all the cell lines when compared with HEK293 cells, and it was highest in G401 cells (Figure 4A). All the mesenchymal markers were highly expressed in both CHLA-05 and CHLA-02 (Figure 4B). Both ATRT cell lines expressed high levels of VIM based on ICC and flow cytometry (Figure 4C,D respectively).

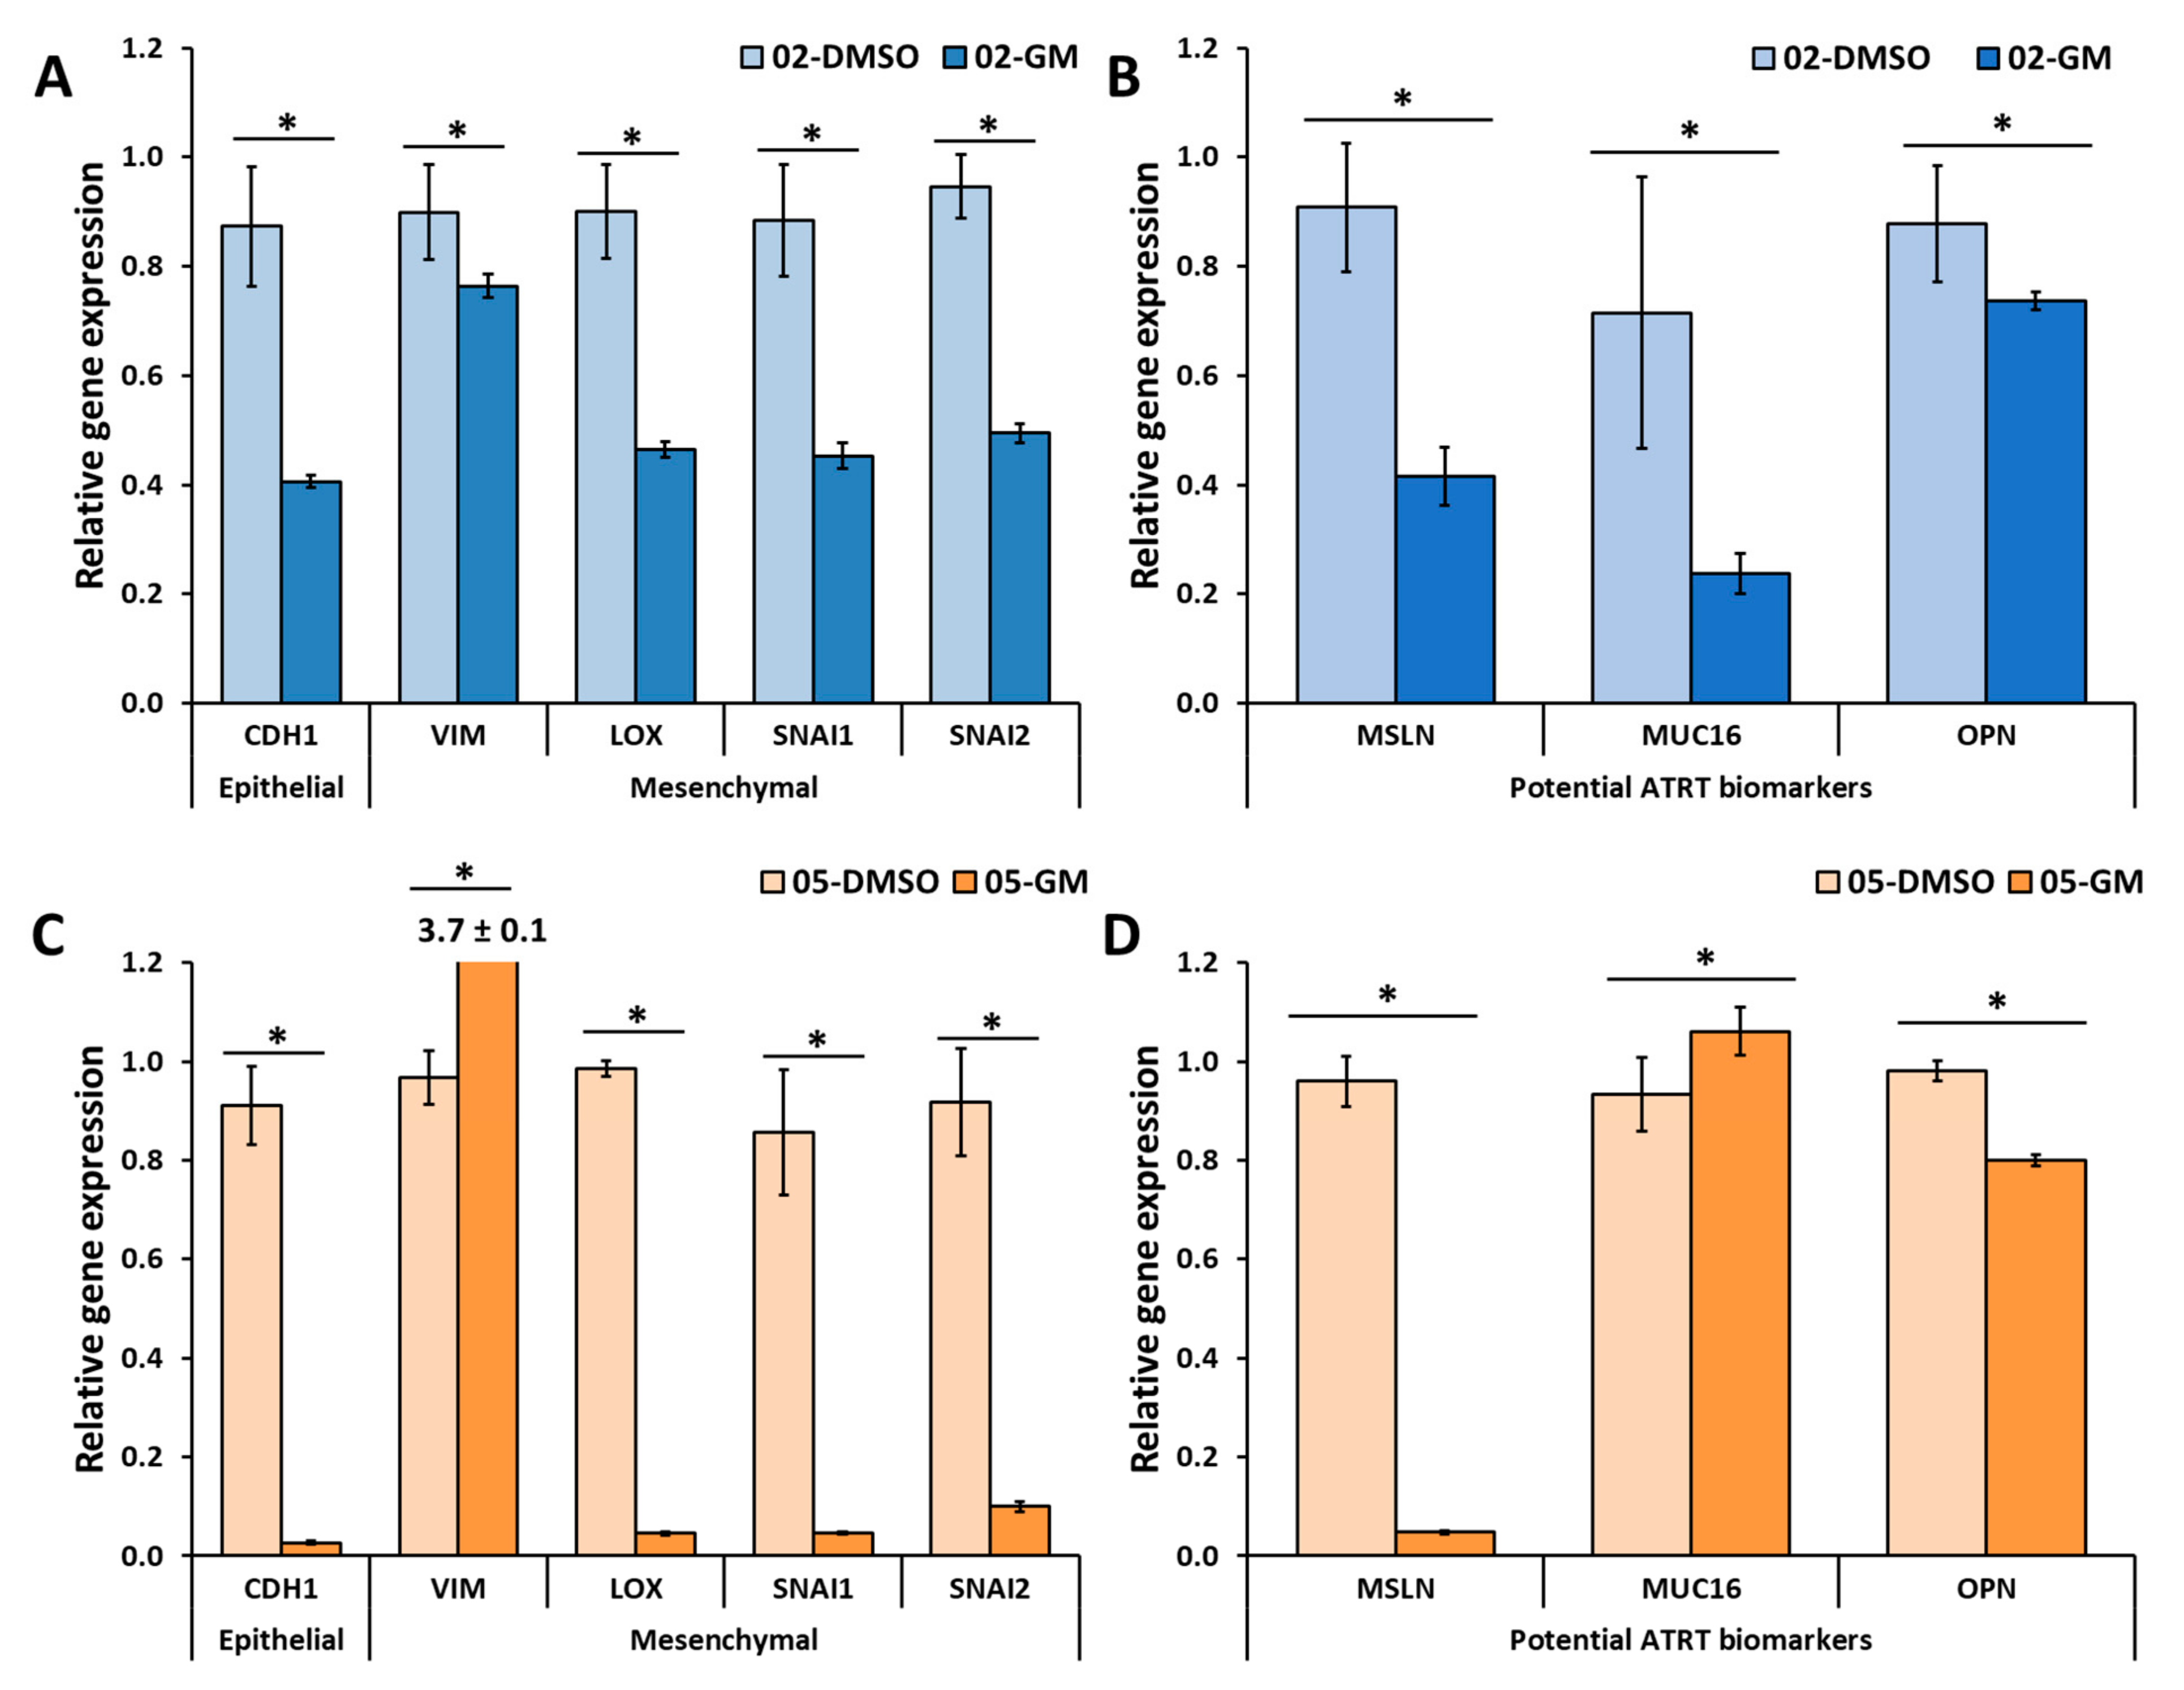
3.4. GM6001 Significantly Decreased Cell Proliferation and the Gene Expression of Several Markers in Both ATRT Cell Lines

The effect of GM6001, a broad-spectrum MMPs inhibitor, on CHLA-02 and CHLA-05 was investigated. Under the treatment of 10 µM of GM6001, both cell lines did not show any differences in morphology in the aggregates or when replating them on a Matrigel-coated surface compared with the control (DMSO treatment) (Figure 5A,B). In addition, the treatment decreased cell proliferation compared with the control in both cell lines. The effect was more significant in the CHLA-02 than in the CHLA-05 and long-term cultures. In particular, GM6001 lowered the total cell number by 60% for CHLA-02 and by 30% for CHLA-05 (Figure 5C). Despite the lower cell proliferation, there were no significant differences in cell viability between the treated and untreated conditions (Figure 5D).
The effect of GM6001 on different biomarkers in both ATRT cell lines was also investigated using the RT-PCR method (Figure 6). The presence of GM6001 significantly decreased the gene expression by at least 50% of one epithelial marker (CDH1) and most mesenchymal markers (LOX, SNAI1, and SNAI2). The important ARTR biomarkers (MSLN and OPN) were also decreased by 16%. CHLA-05 showed an increase in the expression of VIM (~4 folds) and MUC16 (~0.14 folds).

4. Discussion

The two human ATRT cell lines, CHLA-02 and CHLA-05, showed distinct differences in several gene expression markers. In many cases, the investigated MMP, TIMP, and ADAM gene expression levels in CHLA-02 were higher than in CHLA-05 (Tables S2 and S6), suggesting a highly invasive phenotype requiring more energy for the cellular proliferation of CHLA-02. CHLA-02 might also have more embryonic phenotypes than CHLA-05 due to high NPM1 gene expression and AFP positivity. This could be due to a high expression of MYC and high glutamine consumption in CHLA-02 [67]. In breast cancer patients, MYC expression increased the risk of breast cancer brain metastasis [68]. In addition, glutamine was used to fuel the TCA cycle, generate glutathione to counteract reactive oxygen species, and became a precursor for nucleic acid synthesis [69].
Among all the biomarkers investigated, OPN, AFP, MUC16, and MSLN may be the most important biomarkers for ATRT. OPN is a stem cell-promoting factor in glioblastoma [70], and its gene expression levels were high in all the rhabdoid tumor cell lines. OPN can activate CD44 by forming a protein complex that could lead to radiation treatment resistance in glioma [70]. The high expression level of CD44 in CHLA-02 might suggest its invasive phenotype. AFP gene and protein expression may serve as a valuable biomarker for malignant rhabdoid tumors due to its much higher expression levels compared to nonmalignant cells.
MUC16 acts as a signaling molecule and a lubrication barrier of the epithelial surface [71]. The expression of MUC16 is associated with changes in signal transduction and gene expression that can lead to tumor invasion through the AKT/ERK pathway [72], similar to the function of the TIMP2–MMP14 complex [73,74]. Solid tumors that expressed MUC16 metastasized to MSLN-expressing locations, such as the peritoneum or pleura, in 75% of cases [75]. The ATRT cell lines expressed high levels of MSLN mRNA, but only low levels of protein were detected by immunocytochemistry (ICC), indicating that MSLN protein expression might be low, the proteins might be shed into the cell culture media, or that the sensitivity of the antibody is not sufficient. Therefore, targeting the ERK and AKT pathways and disrupting MSLN–MUC16 interactions may become novel strategies for ATRT treatment.
Our NPM1 and OCT4 expression results differed from those reported in the literature. Even though NMP1 has been suggested to be a potential target for ATRT treatment in the literature [28], NMP1 gene expression was lower in both ARTR cell lines compared with the nonmalignant HEK293 cells in this study. This could be due to the different isoforms of NMP1. OCT4 is expressed in other cancer types, such as glioma, hepatocellular carcinoma, rectal cancer, and pancreatic cancer [76,77,78,79]. In this study, two primer pairs were used to detect the expression of OCT4 mRNA in rhabdoid tumor cell lines, but the results were inconsistent with ATRT cell lines. Our results showed that gene expression levels were significantly higher in G401 than in HEK293 cells. At the protein level, all the rhabdoid tumor cell lines expressed OCT4, suggesting its important role in preserving the stem cell-like property. However, in other studies, the protein expression of OCT4 was not detected in ATRT or non-central nervous system malignant rhabdoid tumors [21,80,81,82,83]. Therefore, more studies should be carried out to investigate whether NPM1 and OCT4 would be useful biomarkers for ATRT in the future.
Investigating MMP and TIMP expression is important for understanding the invasiveness of ATRT cells. MMP1 is highly expressed in glioblastoma multiforme xenografts [84]. Furthermore, MMP1 induced the expression of proangiogenic genes in human microvascular endothelial cells by activating signaling MAPK cascades [85]. The high-level expression of MMP1 in both CHLA-02 and G401 may indicate a tumor microenvironment conducive to angiogenesis. In addition, CHLA-02 expressed a high level of MMP-26, an invasion biomarker in various cancers, including gliomas [86], astrocytic gliomas [87], colorectal cancer [88], and esophagus squamous cell carcinomas [89]. High MMP26 expression levels may indicate a poor prognosis in astrocytic glioma patients, and its expression is an independent factor associated with patient overall survival time [87]. MMP26 may promote cancer invasion and metastasis by activating proMMP-9 by cleaving the proenzyme site of Ala93-Met94 [89,90] and interacting with TIMP4 [91,92] to promote cancer progression. In addition, MMP7 is a biomarker associated with the epithelial-to-mesenchymal transition (EMT) of tumor cells that are highly invasive [93,94], as well as colon cancer [95] and gliomas [96]. MMP7 was highly expressed in CHLA-02. The gene expression profile of CHLA-02 demonstrated this cell line’s aggressive and invasive phenotype.
In addition to their inhibitory abilities against MMPs, TIMPs may promote cell proliferation and inhibit apoptosis [97]; however, brain malignant rhabdoid tumors do not express mRNA of TIMP1 or 2 [98]. This study showed that the expression of TIMP2 in both ATRT cell lines was significantly higher than in the nonmalignant HEK293 cell line. TIMP4, a biomarker for astrocytoma in glioma patients [99], was highly expressed in CHLA-02. In addition, TIMP-4 can induce tumor growth and promote tumor progenitor cells, possibly through the activation of the TGF-β and NF-κB protein network [100]. Lysyl Oxidase (LOX) and SNAI2 were highly expressed in both ATRT cell lines. LOX and SNAI2 can regulate the induction of TIMP-4, which can lead to tumor invasion, migration, and VEGF expression [101].
ADAM9 was highly expressed in both ATRT cell lines, but ADAM10 was only expressed in CHLA-02. ADAM9 is an adhesive protein and can induce cell signaling, leading to increased proteolytic activities [102] and it is overexpressed in breast cancer and plays an important role in metastasis [103,104]. ADAM9 is related to poor tumor grade and cell proliferation, migration, and invasion [105,106,107], possibly due to mediation of the interaction between cancer cells and fibroblasts [102,108]. ADAM10 may play significant roles in neuronal functions and in the pathogenesis of Alzheimer’s disease [109,110]. It is overexpressed in glioblastoma and enhances cancer progression, migration, and immune evasion [111,112]. Moreover, re-expressing ADAM10 can lead to the restoration of a cell’s ability to proliferate, migrate, and invade; it is suppressed when overexpressing miR-365 [113,114].
Epithelial–mesenchymal transition (EMT) is a process in which cells change their phenotypes from polarized epithelial to mesenchymal [115,116]. This process is essential for embryogenesis, as well as cancer invasion and metastasis [115,116]. Both the ATRT cell lines and the kidney rhabdoid tumor cell line showed high-level gene expression of both epithelial and mesenchymal markers, suggesting that all three cell lines may have a hybrid phenotype with biomarkers that spread across the epithelial–mesenchymal spectrum. The ATRT cells form aggregates in suspension, but they also form attachments when cultured on Matrigel-coated surfaces, further supporting this hybrid phenotype hypothesis. Recently, two chromatin-modifying complexes, polycomb repressive complex 2 (PRC2) and lysine methyltransferase 2D-complex of proteins associated with SET1 (KMT2D-COMPASS), have been suggested to govern epithelial–mesenchymal plasticity [117]. Thus, ATRT and kidney malignant rhabdoid tumor cells have complex genotypes and phenotypes. In addition, cancer cell phenotypes could resemble the cancer stem cell phenotype during EMT, with increased drug efflux pumps and anti-apoptotic properties [118]. Therefore, small-molecule inhibitors or miRNA-targeting genes and pathways involved in EMT have been used to alleviate drug resistance [118].
GM6001 is a potent broad-spectrum MMP inhibitor. GM6001 treatment decreased the cell proliferation and gene expression of several important biomarkers in both CHLA-02 and CHLA-05, including MSLN, OPN, and many mesenchymal markers. The effect of GM6001 was more significant in CHLA-02, perhaps due to the higher MYC and MMP expression levels in CHLA-02 than in CHLA-05 [67]. In addition, there was an increase in VIM expression in CHLA-05. The suppression of MYC protein expression in colorectal cells by knocking down MMP1 [119] may suggest possible interactions between MYC and the MMPs. Therefore, the specific MMPs and their mechanisms for reducing cell proliferation and certain biomarkers, possibly by decreasing MYC expression, remain to be investigated.
Human embryonic kidney cell line HEK293 cells were used as nonmalignant controls for G401, a kidney-derived malignant rhabdoid tumor; however, HEK293 may not be the ideal control for ATRT cell lines. The origin of ATRT is still under investigation, but it might be in neural progenitor cells [120]; however, obtaining, culturing, and maintaining human pediatric undifferentiated neural progenitor cells might be challenging and not feasible. Since both fetal non-pluripotent neural progenitor cells [121] and HEK293 cells express pluripotency markers of NANOG and OCT4 [122], HEK293 was used as a nonmalignant stem cell control for comparison in this study.
This comprehensive study investigated biomarkers of different types, epithelial, mesenchymal, MMPs, TIMPs, and ADAMs, as well as the effects of GM6001 on ATRT cells; however, these studies were limited to using two ATRT cell lines, one malignant kidney rhabdoid tumor cell line (G401), and two kidney control cell lines HEK293 and HEK293T. In the future, other ATRT cell lines and patient-derived xenograft samples need to be investigated to verify these ATRT antigens. Although CHLA-02 and CHLA-05 have different cellular pathways and metabolic regulations, they might not be able to represent all ATRT patient-derived cell lines and tissues. Thus, future large-scale studies are needed to verify our findings for therapeutic development to treat patients with ATRT and other malignant rhabdoid tumors.

5. Conclusions

In summary, CHLA-02 and CHLA-05 may represent two different subtypes of ATRT based on their gene expression profiles. AFP, MSLN, MUC16, OPN, and MT1-MMP/MMP14 may serve as biomarkers for human malignant rhabdoid tumor detection and therapeutic targets. Due to their high MT1-MMP and other MMP expression levels, ATRT cells may be highly invasive. Treating ATRT with a broad-spectrum MMP inhibitor, GM6001, decreased cell proliferation with no significant changes in viability or several important markers in both ATRT cell lines. ATRT may utilize the MYC and ERK pathways as their central metabolic regulation, suggesting an important therapeutic intervention approach. OPN and MSLN may serve as targets for immunotherapies and cancer vaccine development to treat ATRT patients. This study may also advance our knowledge of the molecular features of malignant rhabdoid tumors and their aggressiveness.

Supplementary Materials

The following supporting information can be downloaded at: https://www.mdpi.com/article/10.3390/cancers14153685/s1, Figure S1: The relative gene expression of (A) MUC16, (B) CD44, (C). SSEA1, (D) OPN, (E) AFP, and (F) MSLN using different primer pairs from Table S1. The gene expression levels of CHLA-02, CHLA-05, G401, and HEK293T cells were compared with HEK293 using the Student’s t-test. *: p-value < 0.05, Figure S2: Relative gene expression levels of (A) OCT4, (B) CD99, (C) CGB3, (D) NPM1, and (E) ENO2 using different primer pairs from Table S1. The gene expression levels of CHLA-02, CHLA-05, G401, and HEK293T cells were compared with HEK293 using the Student’s t-test. *: p-value < 0.05, Figure S3: Immunostaining of different cancerous biomarkers for CHLA-02. Scale bar: 100 µm, Figure S4: Immunostaining of different cancerous biomarkers for CHLA-05. Scale bar: 100 µm, Figure S5: Immunostaining of different cancerous biomarkers for G401. Scale bar: 100 µm, Figure S6: Immunostaining of different cancerous biomarkers for HEK293. Scale bar: 100 µm, Table S1: Primer sequences for the markers of interest, Table S2: Comparison of the relative gene expression levels of the tested biomarkers of CHLA-02, CHLA-05, G401, HEK293T with those of HEK293, Table S3: List of primary antibodies, Table S4: List of secondary antibodies, Table S5: The primer sequences for the MMPs, TIMPs, and ADAMs, Table S6: Comparison of the relative gene expression levels of extracellular matrix modifier markers of CHLA-02, CHLA-05, G401, HEK293T with those of HEK293, Table S7: The primer sequences for the epithelial (CDH1) and mesenchymal markers (LOX, SNAI1, SNAI2, and VIM).

Author Contributions

Conceptualization, T.H. and Q.-X.S.; data curation, T.H., Z.Z., J.C. and Y.X.; formal analysis, T.H., Y.L. and Q.-X.S.; funding acquisition, Y.L. and Q.-X.S.; investigation, T.H., Z.Z., J.C., Y.X. and Q.-X.S.; methodology, T.H., Y.L. and Q.-X.S.; project administration, Q.-X.S.; resources, Q.-X.S.; supervision, Y.L. and Q.-X.S.; validation, T.H. and Y.X.; visualization, T.H.; writing—original draft preparation, T.H.; writing—review and editing, T.H., Y.X., Y.L. and Q.-X.S. All authors have read and agreed to the published version of the manuscript.

Funding

This project was supported by the Florida Department of Health (FDOH) Live Like Bella awards (9LA01 and 21L10 to Q.-X.S. and Y.L.), an FSU Council on Research & Creativity (CRC) planning grant, the Pfeiffer Professorship for Cancer Research in Chemistry and Biochemistry from the College of Arts & Sciences, and an Endowed Chair Professorship in Cancer Research from anonymous donors (to Q.-X.S.). This work was also supported by the Joseph M. Schor Fellowship in Biochemistry, FSU (to T.H.).

Institutional Review Board Statement

Not Applicable.

Informed Consent Statement

Not applicable.

Data Availability Statement

The datasets generated and used/or analyzed are published in this paper and Supplementary Materials, and available from the corresponding author upon request.

Acknowledgments

The authors would like to thank Zachary Blashinsky for assisting with the literature search, Florida State University (FSU) Research Facilities, Brian K. Washburn, and Kristina Poduch for their assistance with RT-PCR experiments at the Molecular Cloning Facility at the Department of Biological Sciences, and Beth Alexander and Ruth Didier for their assistance with flow cytometry analysis at the FSU Flow Cytometry Laboratory at the College of Medicine.

Conflicts of Interest

The authors declare no conflict of interest.

References

  1. Von Hoff, K.; Hinkes, B.; Dannenmann-Stern, E.; von Bueren, A.O.; Warmuth-Metz, M.; Soerensen, N.; Emser, A.; Zwiener, I.; Schlegel, P.G.; Kuehl, J.; et al. Frequency, Risk-Factors and Survival of Children with Atypical Teratoid Rhabdoid Tumors (AT/RT) of the CNS Diagnosed between 1988 and 2004, and Registered to the German HIT Database. Pediatr. Blood Cancer 2011, 57, 978–985. [Google Scholar] [CrossRef] [PubMed]
  2. Thomas, C.; Knerlich-Lukoschus, F.; Reinhard, H.; Johann, P.D.; Sturm, D.; Sahm, F.; Bens, S.; Vogt, J.; Nemes, K.; Oyen, F.; et al. Two Molecularly Distinct Atypical Teratoid/Rhabdoid Tumors (or Tumor Components) Occurring in an Infant with Rhabdoid Tumor Predisposition Syndrome 1. Acta Neuropathol. 2019, 137, 847–850. [Google Scholar] [CrossRef] [PubMed]
  3. Rickert, C.H.; Paulus, W. Epidemiology of Central Nervous System Tumors in Childhood and Adolescence Based on the New WHO Classification. Child’s Nerv. Syst. 2001, 17, 503–511. [Google Scholar] [CrossRef] [PubMed]
  4. Ostrom, Q.T.; Chen, Y.; de Blank, P.M.; Ondracek, A.; Farah, P.; Gittleman, H.; Wolinsky, Y.; Kruchko, C.; Cohen, M.L.; Brat, D.J.; et al. The Descriptive Epidemiology of Atypical Teratoid/Rhabdoid Tumors in the United States, 2001–2010. Neuro-Oncology 2014, 16, 1392–1399. [Google Scholar] [CrossRef] [Green Version]
  5. Chi, S.N.; Zimmerman, M.A.; Yao, X.; Cohen, K.J.; Burger, P.; Biegel, J.A.; Rorke-Adams, L.B.; Fisher, M.J.; Janss, A.; Mazewski, C.; et al. Intensive Multimodality Treatment for Children with Newly Diagnosed CNS Atypical Teratoid Rhabdoid Tumor. J. Clin. Oncol. 2009, 27, 385–389. [Google Scholar] [CrossRef] [Green Version]
  6. Lafay-Cousin, L.; Hawkins, C.; Carret, A.S.; Johnston, D.; Zelcer, S.; Wilson, B.; Jabado, N.; Scheinemann, K.; Eisenstat, D.; Fryer, C.; et al. Central Nervous System Atypical Teratoid Rhabdoid Tumours: The Canadian Paediatric Brain Tumour Consortium Experience. Eur. J. Cancer 2012, 48, 353–359. [Google Scholar] [CrossRef]
  7. Parham, D.M.; Weeks, D.A.; Beckwith, J.B. The Clinicopathologic Spectrum of Putative Extrarenal Rhabdoid Tumors. An Analysis of 42 Cases Studied with Immunohistochemistry or Electron Microscopy. Am. J. Surg. Pathol. 1994, 18, 1010–1029. [Google Scholar] [CrossRef]
  8. Biegel, J.A.; Zhou, J.Y.; Rorke, L.B.; Stenstrom, C.; Wainwright, L.M.; Fogelgren, B. Germ-Line and Acquired Mutations of INI1 in Atypical Teratoid and Rhabdoid Tumors. Cancer Res. 1999, 59, 74–79. [Google Scholar]
  9. Judkins, A.R.; Mauger, J.; Ht, A.; Rorke, L.B.; Biegel, J.A. Immunohistochemical Analysis of HSNF5/INI1 in Pediatric CNS Neoplasms. Am. J. Surg. Pathol. 2004, 28, 644–650. [Google Scholar] [CrossRef]
  10. Sullivan, L.M.; Folpe, A.L.; Pawel, B.R.; Judkins, A.R.; Biegel, J.A. Epithelioid Sarcoma Is Associated with a High Percentage of SMARCB1 Deletions. Mod. Pathol. 2013, 26, 385–392. [Google Scholar] [CrossRef]
  11. Hasselblatt, M.; Isken, S.; Linge, A.; Eikmeier, K.; Jeibmann, A.; Oyen, F.; Nagel, I.; Richter, J.; Bartelheim, K.; Kordes, U.; et al. High-Resolution Genomic Analysis Suggests the Absence of Recurrent Genomic Alterations Other than SMARCB1 Aberrations in Atypical Teratoid/Rhabdoid Tumors. Genes Chromosomes Cancer 2013, 52, 185–190. [Google Scholar] [CrossRef]
  12. Calderaro, J.; Moroch, J.; Pierron, G.; Pedeutour, F.; Grison, C.; Maillé, P.; Soyeux, P.; de la Taille, A.; Couturier, J.; Vieillefond, A.; et al. SMARCB1/INI1 Inactivation in Renal Medullary Carcinoma. Histopathology 2012, 61, 428–435. [Google Scholar] [CrossRef] [Green Version]
  13. Mobley, B.C.; McKenney, J.K.; Bangs, C.D.; Callahan, K.; Yeom, K.W.; Schneppenheim, R.; Hayden, M.G.; Cherry, A.M.; Gokden, M.; Edwards, M.S.B.; et al. Loss of SMARCB1/INI1 Expression in Poorly Differentiated Chordomas. Acta Neuropathol. 2010, 120, 745–753. [Google Scholar] [CrossRef]
  14. Yang, Y.-P.; Nguyen, P.N.N.; Ma, H.-I.; Ho, W.-J.; Chen, Y.-W.; Chien, Y.; Yarmishyn, A.A.; Huang, P.-I.; Lo, W.-L.; Wang, C.-Y.; et al. Tumor Mesenchymal Stromal Cells Regulate Cell Migration of Atypical Teratoid Rhabdoid Tumor through Exosome-Mediated MiR155/SMARCA4 Pathway. Cancers 2019, 11, 720. [Google Scholar] [CrossRef] [Green Version]
  15. Strobeck, M.W.; DeCristofaro, M.F.; Banine, F.; Weissman, B.E.; Sherman, L.S.; Knudsen, E.S. The BRG-1 Subunit of the SWI/SNF Complex Regulates CD44 Expression. J. Biol. Chem. 2001, 276, 9273–9278. [Google Scholar] [CrossRef] [Green Version]
  16. Hsu, K.-H.; Tsai, H.-W.; Lin, P.-W.; Hsu, Y.-S.; Shan, Y.-S.; Lu, P.-J. Clinical Implication and Mitotic Effect of CD44 Cleavage in Relation to Osteopontin/CD44 Interaction and Dysregulated Cell Cycle Protein in Gastrointestinal Stromal Tumor. Ann. Surg. Oncol. 2010, 17, 2199–2212. [Google Scholar] [CrossRef]
  17. Schenkel, A.R.; Mamdouh, Z.; Chen, X.; Liebman, R.M.; Muller, W.A. CD99 Plays a Major Role in the Migration of Monocytes through Endothelial Junctions. Nat. Immunol. 2002, 3, 143–150. [Google Scholar] [CrossRef]
  18. Yang, C.-S.; Jan, Y.-J.; Wang, J.; Shen, C.-C.; Chen, C.C.C.; Chen, M. Spinal Atypical Teratoid/Rhabdoid Tumor in a 7-Year-Old Boy. Neuropathology 2007, 27, 139–144. [Google Scholar] [CrossRef]
  19. Las Heras, F.; Pritzker, K.P.H. Adult Variant of Atypical Teratoid/Rhabdoid Tumor: Immunohistochemical and Ultrastructural Confirmation of a Rare Tumor in the Sella Tursica. Pathol. Res. Pract. 2010, 206, 788–791. [Google Scholar] [CrossRef]
  20. Park, H.G.; Yoon, J.H.; Kim, S.H.; Cho, K.H.; Park, H.J.; Kim, S.H.; Kim, E.H. Adult-Onset Sellar and Suprasellar Atypical Teratoid Rhabdoid Tumor Treated with a Multimodal Approach: A Case Report. Brain Tumor Res. Treat. 2014, 2, 108–113. [Google Scholar] [CrossRef] [Green Version]
  21. Al-Hussaini, M.; Dissi, N.; Souki, C.; Amayiri, N. Atypical Teratoid/Rhabdoid Tumor, an Immunohistochemical Study of Potential Diagnostic and Prognostic Markers. Neuropathology 2016, 36, 17–26. [Google Scholar] [CrossRef]
  22. Acevedo, H.F.; Tong, J.Y.; Hartsock, R.J. Human Chorionic Gonadotropin-Beta Subunit Gene Expression in Cultured Human Fetal and Cancer Cells of Different Types and Origins. Cancer 1995, 76, 1467–1475. [Google Scholar] [CrossRef]
  23. García-García, A.G.; Polo-Hernández, E.; Tabernero, A.; Medina, J.M. Alpha-Fetoprotein (AFP) Modulates the Effect of Serum Albumin on Brain Development by Restraining the Neurotrophic Effect of Oleic Acid. Brain Res. 2015, 1624, 45–58. [Google Scholar] [CrossRef] [Green Version]
  24. Rizzo, A.; Galgano, M.; Mutinati, M.; Sciorsci, R.L. Alpha-Fetoprotein in Animal Reproduction. Res. Vet. Sci. 2019, 123, 281–285. [Google Scholar] [CrossRef]
  25. Okunaka, T.; Kato, H.; Konaka, C.; Yamamoto, H.; Furukawa, K. Primary Lung Cancer Producing Alpha-Fetoprotein. Ann. Thorac. Surg. 1992, 53, 151–152. [Google Scholar] [CrossRef]
  26. Van der Gaast, A.; Hoekstra, J.W.; Croles, J.J.; Splinter, T.A.W. Elevated Serum Tumor Markers in Patients with Testicular Cancer after Induction Chemotherapy Due to a Reservoir of Markers in Cystic Differentiated Mature Teratoma. J. Urol. 1991, 145, 829–831. [Google Scholar] [CrossRef]
  27. Box, J.K.; Paquet, N.; Adams, M.N.; Boucher, D.; Bolderson, E.; O’Byrne, K.J.; Richard, D.J. Nucleophosmin: From Structure and Function to Disease Development. BMC Mol. Biol. 2016, 17, 19. [Google Scholar] [CrossRef] [Green Version]
  28. Phi, J.H.; Sun, C.; Lee, S.-H.; Lee, S.; Park, I.; Choi, S.A.; Park, S.-H.; Lee, J.Y.; Wang, K.; Kim, S.; et al. NPM1 as a Potential Therapeutic Target for Atypical Teratoid/Rhabdoid Tumors. BMC Cancer 2019, 19, 848. [Google Scholar] [CrossRef] [Green Version]
  29. Ma, H.-I.I.; Kao, C.-L.L.; Lee, Y.-Y.Y.; Chiou, G.-Y.Y.; Tai, L.-K.K.; Lu, K.-H.H.; Huang, C.-S.S.; Chen, Y.-W.W.; Chiou, S.-H.H.; Cheng, I.-C.C.; et al. Differential Expression Profiling between Atypical Teratoid/Rhabdoid and Medulloblastoma Tumor in Vitro and in Vivo Using Microarray Analysis. Child’s Nerv. Syst. 2010, 26, 293–303. [Google Scholar] [CrossRef]
  30. Son, M.J.; Woolard, K.; Nam, D.H.; Lee, J.; Fine, H.A. SSEA-1 Is an Enrichment Marker for Tumor-Initiating Cells in Human Glioblastoma. Cell Stem Cell 2009, 4, 440–452. [Google Scholar] [CrossRef] [Green Version]
  31. Hollingsworth, M.A.; Swanson, B.J. Mucins in Cancer: Protection and Control of the Cell Surface. Nat. Rev. Cancer 2004, 4, 45–60. [Google Scholar] [CrossRef] [PubMed]
  32. Yang, C.; Tan, Y.; Li, S.; Zhou, J.; Wang, Q.; Wang, Y.; Xie, Y.; Chen, L.; Li, J.; Fang, C.; et al. Genomic Landscapes by Multiregion Sequencing Combined with Circulation Tumor DNA Detection Contribute to Molecular Diagnosis in Glioblastomas. Aging 2019, 11, 11224–11243. [Google Scholar] [CrossRef] [PubMed]
  33. Robbins, C.J.; Bou-Dargham, M.J.; Sanchez, K.; Rosen, M.C.; Sang, Q.-X.A. Decoding Somatic Driver Gene Mutations and Affected Signaling Pathways in Human Medulloblastoma Subgroups. J. Cancer 2018, 9, 4596–4610. [Google Scholar] [CrossRef] [PubMed]
  34. Bast, R.C.; Badgwell, D.; Lu, Z.; Marquez, R.; Rosen, D.; Liu, J.; Baggerly, K.A.; Atkinson, E.N.; Skates, S.; Zhang, Z.; et al. New Tumor Markers: CA125 and Beyond. Int. J. Gynecol. Cancer 2005, 15 (Suppl. 3), 274–281. [Google Scholar] [CrossRef]
  35. Lakshmanan, I.; Ponnusamy, M.P.; Das, S.; Chakraborty, S.; Haridas, D.; Mukhopadhyay, P.; Lele, S.M.; Batra, S.K. MUC16 Induced Rapid G2/M Transition via Interactions with JAK2 for Increased Proliferation and Anti-Apoptosis in Breast Cancer Cells. Oncogene 2012, 31, 805–817. [Google Scholar] [CrossRef] [Green Version]
  36. Cwik, G.; Wallner, G.; Skoczylas, T.; Ciechanski, A.; Zinkiewicz, K. Cancer Antigens 19-9 and 125 in the Differential Diagnosis of Pancreatic Mass Lesions. Arch. Surg. 2006, 141, 968–973, discussion 974. [Google Scholar] [CrossRef] [Green Version]
  37. Li, X.; Pasche, B.; Zhang, W.; Chen, K. Association of MUC16 Mutation With Tumor Mutation Load and Outcomes in Patients With Gastric Cancer. JAMA Oncol. 2018, 4, 1691–1698. [Google Scholar] [CrossRef]
  38. Guo, J.; Zhou, S.; Rao, N.P.; Pez, G.H. Pleomorphic Malignant Fibrous Histiocytoma/Undifferentiated High-Grade Pleomorphic Sarcoma of the Scrotum in a Patient Presenting as Fournier Gangrene: A Case Report. Appl. Immunohistochem. Mol. Morphol. 2010, 18, 473–478. [Google Scholar] [CrossRef]
  39. Das, S.; Rachagani, S.; Torres-Gonzalez, M.P.; Lakshmanan, I.; Majhi, P.D.; Smith, L.M.; Wagner, K.-U.; Batra, S.K. Carboxyl-Terminal Domain of MUC16 Imparts Tumorigenic and Metastatic Functions through Nuclear Translocation of JAK2 to Pancreatic Cancer Cells. Oncotarget 2015, 6, 5772–5787. [Google Scholar] [CrossRef] [Green Version]
  40. Haridas, D.; Ponnusamy, M.P.; Chugh, S.; Lakshmanan, I.; Seshacharyulu, P.; Batra, S.K. MUC16: Molecular Analysis and Its Functional Implications in Benign and Malignant Conditions. FASEB J. 2014, 28, 4183–4199. [Google Scholar] [CrossRef]
  41. Akita, K.; Tanaka, M.; Tanida, S.; Mori, Y.; Toda, M.; Nakada, H. CA125/MUC16 Interacts with Src Family Kinases, and over-Expression of Its C-Terminal Fragment in Human Epithelial Cancer Cells Reduces Cell-Cell Adhesion. Eur. J. Cell Biol. 2013, 92, 257–263. [Google Scholar] [CrossRef]
  42. Thériault, C.; Pinard, M.; Comamala, M.; Migneault, M.; Beaudin, J.; Matte, I.; Boivin, M.; Piché, A.; Rancourt, C. MUC16 (CA125) Regulates Epithelial Ovarian Cancer Cell Growth, Tumorigenesis and Metastasis. Gynecol. Oncol. 2011, 121, 434–443. [Google Scholar] [CrossRef]
  43. Gubbels, J.A.A.; Belisle, J.; Onda, M.; Rancourt, C.; Migneault, M.; Ho, M.; Bera, T.K.; Connor, J.; Sathyanarayana, B.K.; Lee, B.; et al. Mesothelin-MUC16 Binding Is a High Affinity, N-Glycan Dependent Interaction That Facilitates Peritoneal Metastasis of Ovarian Tumors. Mol. Cancer 2006, 5, 50. [Google Scholar] [CrossRef] [Green Version]
  44. Rump, A.; Morikawa, Y.; Tanaka, M.; Minami, S.; Umesaki, N.; Takeuchi, M.; Miyajima, A. Binding of Ovarian Cancer Antigen CA125/MUC16 to Mesothelin Mediates Cell Adhesion. J. Biol. Chem. 2004, 279, 9190–9198. [Google Scholar] [CrossRef] [Green Version]
  45. Yonezawa, S.; Goto, M.; Yamada, N.; Higashi, M.; Nomoto, M. Expression Profiles of MUC1, MUC2, and MUC4 Mucins in Human Neoplasms and Their Relationship with Biological Behavior. Proteomics 2008, 8, 3329–3341. [Google Scholar] [CrossRef]
  46. Bera, T.K.; Pastan, I. Mesothelin Is Not Required for Normal Mouse Development or Reproduction. Mol. Cell. Biol. 2000, 20, 2902–2906. [Google Scholar] [CrossRef] [Green Version]
  47. Chang, K.; Pastan, I. Molecular Cloning of Mesothelin, a Differentiation Antigen Present on Mesothelium, Mesotheliomas, and Ovarian Cancers. Proc. Natl. Acad. Sci. USA 1996, 93, 136–140. [Google Scholar] [CrossRef] [Green Version]
  48. Thomas, A.; Chen, Y.; Steinberg, S.M.; Luo, J.; Pack, S.; Raffeld, M.; Abdullaev, Z.; Alewine, C.; Rajan, A.; Giaccone, G.; et al. High Mesothelin Expression in Advanced Lung Adenocarcinoma Is Associated with KRAS Mutations and a Poor Prognosis. Oncotarget 2015, 6, 11694–11703. [Google Scholar] [CrossRef] [Green Version]
  49. Argani, P.; Iacobuzio-Donahue, C.; Ryu, B.; Rosty, C.; Goggins, M.; Wilentz, R.E.; Murugesan, S.R.; Leach, S.D.; Jaffee, E.; Yeo, C.J.; et al. Mesothelin Is Overexpressed in the Vast Majority of Ductal Adenocarcinomas of the Pancreas: Identification of a New Pancreatic Cancer Marker by Serial Analysis of Gene Expression (SAGE). Clin. Cancer Res. 2001, 7, 3862–3868. [Google Scholar]
  50. Hassan, R.; Laszik, Z.G.; Lerner, M.; Raffeld, M.; Postier, R.; Brackett, D. Mesothelin Is Overexpressed in Pancreaticobiliary Adenocarcinomas but Not in Normal Pancreas and Chronic Pancreatitis. Am. J. Clin. Pathol. 2005, 124, 838–845. [Google Scholar] [CrossRef]
  51. Hassan, R.; Kreitman, R.J.; Pastan, I.; Willingham, M.C. Localization of Mesothelin in Epithelial Ovarian Cancer. Appl. Immunohistochem. Mol. Morphol. 2005, 13, 243–247. [Google Scholar] [CrossRef]
  52. Parinyanitikul, N.; Blumenschein, G.R.; Wu, Y.; Lei, X.; Chavez-Macgregor, M.; Smart, M.; Gonzalez-Angulo, A.M. Mesothelin Expression and Survival Outcomes in Triple Receptor Negative Breast Cancer. Clin. Breast Cancer 2013, 13, 378–384. [Google Scholar] [CrossRef] [Green Version]
  53. Johnson, M.D.; Vito, F.; O’Connell, M.J. Mesothelin Expression in the Leptomeninges and Meningiomas. J. Histochem. Cytochem. 2008, 56, 579–585. [Google Scholar] [CrossRef] [Green Version]
  54. Tozbikian, G.; Brogi, E.; Kadota, K.; Catalano, J.; Akram, M.; Patil, S.; Ho, A.Y.; Reis-Filho, J.S.; Weigelt, B.; Norton, L.; et al. Mesothelin Expression in Triple Negative Breast Carcinomas Correlates Significantly with Basal-like Phenotype, Distant Metastases and Decreased Survival. PLoS ONE 2014, 9, e114900. [Google Scholar] [CrossRef] [Green Version]
  55. Roycik, M.D.; Myers, J.S.; Newcomer, R.G.; Sang, Q.-X.A. Matrix Metalloproteinase Inhibition in Atherosclerosis and Stroke. Curr. Mol. Med. 2013, 13, 1299–1313. [Google Scholar] [CrossRef]
  56. Hu, J.; Van den Steen, P.E.; Sang, Q.-X.A.; Opdenakker, G. Matrix Metalloproteinase Inhibitors as Therapy for Inflammatory and Vascular Diseases. Nat. Rev. Drug Discov. 2007, 6, 480–498. [Google Scholar] [CrossRef]
  57. Roycik, M.D.; Fang, X.; Sang, Q.-X. A Fresh Prospect of Extracellular Matrix Hydrolytic Enzymes and Their Substrates. Curr. Pharm. Des. 2009, 15, 1295–1308. [Google Scholar] [CrossRef]
  58. Qi, B.; Newcomer, R.G.; Sang, Q.-X.A. ADAM19/Adamalysin 19 Structure, Function, and Role as a Putative Target in Tumors and Inflammatory Diseases. Curr. Pharm. Des. 2009, 15, 2336–2348. [Google Scholar] [CrossRef]
  59. Sang, Q.-X.A.; Jin, Y.; Newcomer, R.G.; Monroe, S.C.; Fang, X.; Hurst, D.R.; Lee, S.; Cao, Q.; Schwartz, M.A. Matrix Metalloproteinase Inhibitors as Prospective Agents for the Prevention and Treatment of Cardiovascular and Neoplastic Diseases. Curr. Top. Med. Chem. 2006, 6, 289–316. [Google Scholar] [CrossRef]
  60. Johann, P.D.; Erkek, S.; Zapatka, M.; Kerl, K.; Buchhalter, I.; Hovestadt, V.; Jones, D.T.W.; Sturm, D.; Hermann, C.; Segura Wang, M.; et al. Atypical Teratoid/Rhabdoid Tumors Are Comprised of Three Epigenetic Subgroups with Distinct Enhancer Landscapes. Cancer Cell 2016, 29, 379–393. [Google Scholar] [CrossRef] [Green Version]
  61. Ho, B.; Johann, P.D.; Grabovska, Y.; De Dieu Andrianteranagna, M.J.; Yao, F.; Frühwald, M.; Hasselblatt, M.; Bourdeaut, F.; Williamson, D.; Huang, A.; et al. Molecular Subgrouping of Atypical Teratoid/Rhabdoid Tumors—A Reinvestigation and Current Consensus. Neuro-Oncology 2020, 22, 613–624. [Google Scholar] [CrossRef] [PubMed] [Green Version]
  62. Bosco, D.B.; Roycik, M.D.; Jin, Y.; Schwartz, M.A.; Lively, T.J.; Zorio, D.A.R.; Sang, Q.X.A. A New Synthetic Matrix Metalloproteinase Inhibitor Reduces Human Mesenchymal Stem Cell Adipogenesis. PLoS ONE 2017, 12, e0172925. [Google Scholar] [CrossRef] [PubMed]
  63. Russell, M.D.; Young, A.M.H.; Karri, S.K. Biomarkers of Pediatric Brain Tumors. Front. Pediatr. 2013, 1, 7. [Google Scholar] [CrossRef] [PubMed] [Green Version]
  64. Cardoso, L.C.; Soares, R.d.S.; Laurentino, T.D.S.; Lerario, A.M.; Marie, S.K.N.; Oba-Shinjo, S.M. CD99 Expression in Glioblastoma Molecular Subtypes and Role in Migration and Invasion. Int. J. Mol. Sci. 2019, 20, 1137. [Google Scholar] [CrossRef] [Green Version]
  65. Sherman, L.; Sleeman, J.; Dall, P.; Hekele, A.; Moll, J.; Ponta, H.; Herrlich, P. The CD44 Proteins in Embryonic Development and in Cancer. Curr. Top. Microbiol. Immunol. 1996, 213 Pt 1, 249–269. [Google Scholar] [CrossRef]
  66. Servais, E.L.; Colovos, C.; Rodriguez, L.; Bograd, A.J.; Nitadori, J.; Sima, C.; Rusch, V.W.; Sadelain, M.; Adusumilli, P.S. Mesothelin Overexpression Promotes Mesothelioma Cell Invasion and MMP-9 Secretion in an Orthotopic Mouse Model and in Epithelioid Pleural Mesothelioma Patients. Clin. Cancer Res. 2012, 18, 2478–2489. [Google Scholar] [CrossRef] [Green Version]
  67. Wang, S.Z.; Poore, B.; Alt, J.; Price, A.; Allen, S.J.; Hanaford, A.R.; Kaur, H.; Orr, B.A.; Slusher, B.S.; Eberhart, C.G.; et al. Unbiased Metabolic Profiling Predicts Sensitivity of High MYC-Expressing Atypical Teratoid/Rhabdoid Tumors to Glutamine Inhibition with 6-Diazo-5-Oxo-L-Norleucine. Clin. Cancer Res. 2019, 25, 5925–5936. [Google Scholar] [CrossRef] [Green Version]
  68. Lee, H.Y.; Cha, J.; Kim, S.K.; Park, J.H.; Song, K.H.; Kim, P.; Kim, M.-Y. C-MYC Drives Breast Cancer Metastasis to the Brain, but Promotes Synthetic Lethality with TRAIL. Mol. Cancer Res. 2019, 17, 544–554. [Google Scholar] [CrossRef] [Green Version]
  69. Li, T.; Le, A. Glutamine Metabolism in Cancer. Adv. Exp. Med. Biol. 2018, 1063, 13–32. [Google Scholar] [CrossRef]
  70. Pietras, A.; Katz, A.M.; Ekström, E.J.; Wee, B.; Halliday, J.J.; Pitter, K.L.; Werbeck, J.L.; Amankulor, N.M.; Huse, J.T.; Holland, E.C. Osteopontin-CD44 Signaling in the Glioma Perivascular Niche Enhances Cancer Stem Cell Phenotypes and Promotes Aggressive Tumor Growth. Cell Stem Cell 2014, 14, 357–369. [Google Scholar] [CrossRef] [Green Version]
  71. Perez, B.H.; Gipson, I.K. Focus on Molecules: Human Mucin MUC16. Exp. Eye Res. 2008, 87, 400–401. [Google Scholar] [CrossRef] [Green Version]
  72. Chen, S.-H.H.; Hung, W.-C.C.; Wang, P.; Paul, C.; Konstantopoulos, K. Mesothelin Binding to CA125/MUC16 Promotes Pancreatic Cancer Cell Motility and Invasion via MMP-7 Activation. Sci. Rep. 2013, 3, 1870. [Google Scholar] [CrossRef] [Green Version]
  73. Valacca, C.; Tassone, E.; Mignatti, P. TIMP-2 Interaction with MT1-MMP Activates the AKT Pathway and Protects Tumor Cells from Apoptosis. PLoS ONE 2015, 10, e0136797. [Google Scholar] [CrossRef]
  74. D’Alessio, S.; Ferrari, G.; Cinnante, K.; Scheerer, W.; Galloway, A.C.; Roses, D.F.; Rozanov, D.V.; Remacle, A.G.; Oh, E.-S.; Shiryaev, S.A.; et al. Tissue Inhibitor of Metalloproteinases-2 Binding to Membrane-Type 1 Matrix Metalloproteinase Induces MAPK Activation and Cell Growth by a Non-Proteolytic Mechanism. J. Biol. Chem. 2008, 283, 87–99. [Google Scholar] [CrossRef]
  75. Johnson, M.D.; Vito, F.; Xu, H.H.; Xu, H.H. MUC16 Expression and Risk of Adenocarcinoma Metastases to Peritoneum, Pleura, Leptomeninges, and Brain. Appl. Immunohistochem. Mol. Morphol. 2010, 18, 250–253. [Google Scholar] [CrossRef]
  76. Holmberg, J.; He, X.; Peredo, I.; Orrego, A.; Hesselager, G.; Ericsson, C.; Hovatta, O.; Oba-Shinjo, S.M.; Marie, S.K.N.; Nistér, M.; et al. Activation of Neural and Pluripotent Stem Cell Signatures Correlates with Increased Malignancy in Human Glioma. PLoS ONE 2011, 6, e18454. [Google Scholar] [CrossRef] [Green Version]
  77. Yin, X.; Li, Y.-W.; Jin, J.-J.; Zhou, Y.; Ren, Z.-G.; Qiu, S.-J.; Zhang, B.-H. The Clinical and Prognostic Implications of Pluripotent Stem Cell Gene Expression in Hepatocellular Carcinoma. Oncol. Lett. 2013, 5, 1155–1162. [Google Scholar] [CrossRef] [Green Version]
  78. Saigusa, S.; Tanaka, K.; Toiyama, Y.; Yokoe, T.; Okugawa, Y.; Ioue, Y.; Miki, C.; Kusunoki, M. Correlation of CD133, OCT4, and SOX2 in Rectal Cancer and Their Association with Distant Recurrence after Chemoradiotherapy. Ann. Surg. Oncol. 2009, 16, 3488–3498. [Google Scholar] [CrossRef]
  79. Lu, Y.; Zhu, H.; Shan, H.; Lu, J.; Chang, X.; Li, X.; Lu, J.; Fan, X.; Zhu, S.; Wang, Y.; et al. Knockdown of Oct4 and Nanog Expression Inhibits the Stemness of Pancreatic Cancer Cells. Cancer Lett. 2013, 340, 113–123. [Google Scholar] [CrossRef]
  80. Kohashi, K.; Yamada, Y.; Hotokebuchi, Y.; Yamamoto, H.; Taguchi, T.; Iwamoto, Y.; Oda, Y. ERG and SALL4 Expressions in SMARCB1/INI1-Deficient Tumors: A Useful Tool for Distinguishing Epithelioid Sarcoma from Malignant Rhabdoid Tumor. Hum. Pathol. 2015, 46, 225–230. [Google Scholar] [CrossRef]
  81. Miettinen, M.; Wang, Z.; McCue, P.A.; Sarlomo-Rikala, M.; Rys, J.; Biernat, W.; Lasota, J.; Lee, Y.-S. SALL4 Expression in Germ Cell and Non-Germ Cell Tumors: A Systematic Immunohistochemical Study of 3215 Cases. Am. J. Surg. Pathol. 2014, 38, 410–420. [Google Scholar] [CrossRef] [Green Version]
  82. Venneti, S.; Le, P.; Martinez, D.; Xie, S.X.; Sullivan, L.M.; Rorke-Adams, L.B.; Pawel, B.; Judkins, A.R. Malignant Rhabdoid Tumors Express Stem Cell Factors, Which Relate To the Expression of EZH2 and Id Proteins. Am. J. Surg. Pathol. 2011, 35, 1463–1472. [Google Scholar] [CrossRef]
  83. Deisch, J.; Raisanen, J.; Rakheja, D. Immunohistochemical Expression of Embryonic Stem Cell Markers in Malignant Rhabdoid Tumors. Pediatr. Dev. Pathol. 2011, 14, 353–359. [Google Scholar] [CrossRef]
  84. Hodgson, J.G.; Yeh, R.-F.; Ray, A.; Wang, N.J.; Smirnov, I.; Yu, M.; Hariono, S.; Silber, J.; Feiler, H.S.; Gray, J.W.; et al. Comparative Analyses of Gene Copy Number and MRNA Expression in Glioblastoma Multiforme Tumors and Xenografts. Neuro-Oncology 2009, 11, 477–487. [Google Scholar] [CrossRef] [Green Version]
  85. Blackburn, J.S.; Brinckerhoff, C.E. Matrix Metalloproteinase-1 and Thrombin Differentially Activate Gene Expression in Endothelial Cells via PAR-1 and Promote Angiogenesis. Am. J. Pathol. 2008, 173, 1736–1746. [Google Scholar] [CrossRef] [Green Version]
  86. Deng, Y.; Li, W.; Li, Y.; Yang, H.; Xu, H.; Liang, S.; Zhang, L.; Li, Y. Expression of Matrix Metalloproteinase-26 Promotes Human Glioma U251 Cell Invasion in Vitro and in Vivo. Oncol. Rep. 2010, 23, 69–78. [Google Scholar] [CrossRef]
  87. Guo, J.-G.; Guo, C.-C.; He, Z.-Q.; Cai, X.-Y.; Mou, Y.-G. High MMP-26 Expression in Glioma Is Correlated with Poor Clinical Outcome of Patients. Oncol. Lett. 2018, 16, 2237–2242. [Google Scholar] [CrossRef] [Green Version]
  88. Hu, Q.; Yan, C.; Xu, C.; Yan, H.; Qing, L.; Pu, Y.; He, Z.; Li, X. Matrilysin-2 Expression in Colorectal Cancer Is Associated with Overall Survival of Patients. Tumour Biol. 2014, 35, 3569–3574. [Google Scholar] [CrossRef]
  89. Yamamoto, H.; Vinitketkumnuen, A.; Adachi, Y.; Taniguchi, H.; Hirata, T.; Miyamoto, N.; Nosho, K.; Imsumran, A.; Fujita, M.; Hosokawa, M.; et al. Association of Matrilysin-2 (MMP-26) Expression with Tumor Progression and Activation of MMP-9 in Esophageal Squamous Cell Carcinoma. Carcinogenesis 2004, 25, 2353–2360. [Google Scholar] [CrossRef] [Green Version]
  90. Zhao, Y.G.; Xiao, A.Z.; Newcomer, R.G.; Park, H.I.; Kang, T.; Chung, L.W.K.; Swanson, M.G.; Zhau, H.E.; Kurhanewicz, J.; Sang, Q.X.A. Activation of Pro-Gelatinase B by Endometase/Matrilysin-2 Promotes Invasion of Human Prostate Cancer Cells. J. Biol. Chem. 2003, 278, 15056–15064. [Google Scholar] [CrossRef] [Green Version]
  91. Zhang, J.; Cao, Y.-J.; Zhao, Y.-G.; Sang, Q.-X.A.; Duan, E.-K. Expression of Matrix Metalloproteinase-26 and Tissue Inhibitor of Metalloproteinase-4 in Human Normal Cytotrophoblast Cells and a Choriocarcinoma Cell Line, JEG-3. Mol. Hum. Reprod. 2002, 8, 659–666. [Google Scholar] [CrossRef] [PubMed]
  92. Lee, S.; Desai, K.K.; Iczkowski, K.A.; Newcomer, R.G.; Wu, K.J.; Zhao, Y.-G.; Tan, W.W.; Roycik, M.D.; Sang, Q.-X.A. Coordinated Peak Expression of MMP-26 and TIMP-4 in Preinvasive Human Prostate Tumor. Cell Res. 2006, 16, 750–758. [Google Scholar] [CrossRef] [PubMed] [Green Version]
  93. Scheau, C.; Badarau, I.A.; Costache, R.; Caruntu, C.; Mihai, G.L.; Didilescu, A.C.; Constantin, C.; Neagu, M. The Role of Matrix Metalloproteinases in the Epithelial-Mesenchymal Transition of Hepatocellular Carcinoma. Anal. Cell. Pathol. 2019, 2019, 9423907. [Google Scholar] [CrossRef] [Green Version]
  94. Lin, Y.; Liu, J.; Huang, Y.; Liu, D.; Zhang, G.; Kan, H. MicroRNA-489 Plays an Anti-Metastatic Role in Human Hepatocellular Carcinoma by Targeting Matrix Metalloproteinase-7. Transl. Oncol. 2017, 10, 211–220. [Google Scholar] [CrossRef] [PubMed]
  95. McDonnell, S.; Navre, M.; Coffey, R.J.; Matrisian, L.M. Expression and Localization of the Matrix Metalloproteinase Pump-1 (MMP-7) in Human Gastric and Colon Carcinomas. Mol. Carcinog. 1991, 4, 527–533. [Google Scholar] [CrossRef] [PubMed]
  96. Nakano, A.; Tani, E.; Miyazaki, K.; Yamamoto, Y.; Furuyama, J. Matrix Metalloproteinases and Tissue Inhibitors of Metalloproteinases in Human Gliomas. J. Neurosurg. 1995, 83, 298–307. [Google Scholar] [CrossRef] [PubMed] [Green Version]
  97. Brew, K.; Nagase, H. The Tissue Inhibitors of Metalloproteinases (TIMPs): An Ancient Family with Structural and Functional Diversity. Biochim. Biophys. Acta 2010, 1803, 55–71. [Google Scholar] [CrossRef] [Green Version]
  98. Muller, M.; Hubbard, S.L.; Fukuyama, K.; Dirks, P.; Matsuzawa, K.; Rutka, J.T. Characterization of a Pineal Region Malignant Rhabdoid Tumor. Towards Understanding Brain Tumor Cell Invasion. Pediatr. Neurosurg. 1995, 22, 204–209. [Google Scholar] [CrossRef]
  99. Rorive, S.; Lopez, X.M.; Maris, C.; Trepant, A.-L.; Sauvage, S.; Sadeghi, N.; Roland, I.; Decaestecker, C.; Salmon, I. TIMP-4 and CD63: New Prognostic Biomarkers in Human Astrocytomas. Mod. Pathol. 2010, 23, 1418–1428. [Google Scholar] [CrossRef] [Green Version]
  100. Lizarraga, F.; Espinosa, M.; Ceballos-Cancino, G.; Vazquez-Santillan, K.; Bahena-Ocampo, I.; Schwarz-Cruz y Celis, A.; Vega-Gordillo, M.; Garcia Lopez, P.; Maldonado, V.; Melendez-Zajgla, J. Tissue Inhibitor of Metalloproteinases-4 (TIMP-4) Regulates Stemness in Cervical Cancer Cells. Mol. Carcinog. 2016, 55, 1952–1961. [Google Scholar] [CrossRef]
  101. Boufraqech, M.; Zhang, L.; Nilubol, N.; Sadowski, S.M.; Kotian, S.; Quezado, M.; Kebebew, E. Lysyl Oxidase (LOX) Transcriptionally Regulates SNAI2 Expression and TIMP4 Secretion in Human Cancers. Clin. Cancer Res. 2016, 22, 4491–4504. [Google Scholar] [CrossRef] [Green Version]
  102. Zigrino, P.; Nischt, R.; Mauch, C. The Disintegrin-like and Cysteine-Rich Domains of ADAM-9 Mediate Interactions between Melanoma Cells and Fibroblasts. J. Biol. Chem. 2011, 286, 6801–6807. [Google Scholar] [CrossRef] [Green Version]
  103. O’Shea, C.; McKie, N.; Buggy, Y.; Duggan, C.; Hill, A.D.K.; McDermott, E.; O’Higgins, N.; Duffy, M.J. Expression of ADAM-9 MRNA and Protein in Human Breast Cancer. Int. J. Cancer 2003, 105, 754–761. [Google Scholar] [CrossRef]
  104. Micocci, K.C.; Martin, A.C.B.M.; de Freitas Montenegro, C.; Durante, A.C.; Pouliot, N.; Cominetti, M.R.; Selistre-de-Araujo, H.S. ADAM9 Silencing Inhibits Breast Tumor Cell Invasion in Vitro. Biochimie 2013, 95, 1371–1378. [Google Scholar] [CrossRef] [PubMed] [Green Version]
  105. Fan, X.; Wang, Y.; Zhang, C.; Liu, L.; Yang, S.; Wang, Y.; Liu, X.; Qian, Z.; Fang, S.; Qiao, H.; et al. ADAM9 Expression Is Associate with Glioma Tumor Grade and Histological Type, and Acts as a Prognostic Factor in Lower-Grade Gliomas. Int. J. Mol. Sci. 2016, 17, 1276. [Google Scholar] [CrossRef] [PubMed] [Green Version]
  106. Sarkar, S.; Zemp, F.J.; Senger, D.; Robbins, S.M.; Yong, V.W. ADAM-9 Is a Novel Mediator of Tenascin-C-Stimulated Invasiveness of Brain Tumor-Initiating Cells. Neuro-Oncology 2015, 17, 1095–1105. [Google Scholar] [CrossRef] [PubMed] [Green Version]
  107. Liu, X.; Wang, S.; Yuan, A.; Yuan, X.; Liu, B. MicroRNA-140 Represses Glioma Growth and Metastasis by Directly Targeting ADAM9. Oncol. Rep. 2016, 36, 2329–2338. [Google Scholar] [CrossRef] [PubMed] [Green Version]
  108. Zigrino, P.; Mauch, C.; Fox, J.W.; Nischt, R. Adam-9 Expression and Regulation in Human Skin Melanoma and Melanoma Cell Lines. Int. J. Cancer 2005, 116, 853–859. [Google Scholar] [CrossRef]
  109. Hsia, H.-E.; Tüshaus, J.; Brummer, T.; Zheng, Y.; Scilabra, S.D.; Lichtenthaler, S.F. Functions of “A Disintegrin and Metalloproteases (ADAMs)” in the Mammalian Nervous System. Cell. Mol. Life Sci. 2019, 76, 3055–3081. [Google Scholar] [CrossRef]
  110. Weber, S.; Saftig, P. Ectodomain Shedding and ADAMs in Development. Development 2012, 139, 3693–3709. [Google Scholar] [CrossRef] [Green Version]
  111. Venkatesh, H.S.; Tam, L.T.; Woo, P.J.; Lennon, J.; Nagaraja, S.; Gillespie, S.M.; Ni, J.; Duveau, D.Y.; Morris, P.J.; Zhao, J.J.; et al. Targeting Neuronal Activity-Regulated Neuroligin-3 Dependency in High-Grade Glioma. Nature 2017, 549, 533–537. [Google Scholar] [CrossRef] [Green Version]
  112. Liu, R.; Qin, X.-P.; Zhuang, Y.; Zhang, Y.; Liao, H.-B.; Tang, J.-C.; Pan, M.-X.; Zeng, F.-F.; Lei, Y.; Lei, R.-X.; et al. Glioblastoma Recurrence Correlates with NLGN3 Levels. Cancer Med. 2018, 7, 2848–2859. [Google Scholar] [CrossRef]
  113. Mullooly, M.; McGowan, P.M.; Sukor, S.U.; Madden, S.F.; McDermott, E.; Crown, J.; O’Donovan, N.; Duffy, M.J. ADAMs as New Therapeutic Targets for Triple-Negative Breast Cancer. J. Clin. Oncol. 2011, 29, 1062. [Google Scholar] [CrossRef]
  114. Liu, F.; Zhuang, L.; Wu, R.; Li, D. MiR-365 Inhibits Cell Invasion and Migration of Triple Negative Breast Cancer through ADAM10. J. Buon 2019, 24, 1905–1912. [Google Scholar]
  115. Chen, T.; You, Y.; Jiang, H.; Wang, Z.Z. Epithelial-Mesenchymal Transition (EMT): A Biological Process in the Development, Stem Cell Differentiation, and Tumorigenesis. J. Cell. Physiol. 2017, 232, 3261–3272. [Google Scholar] [CrossRef]
  116. Pastushenko, I.; Blanpain, C. EMT Transition States during Tumor Progression and Metastasis. Trends Cell Biol. 2019, 29, 212–226. [Google Scholar] [CrossRef] [Green Version]
  117. Zhang, Y.; Donaher, J.L.; Das, S.; Li, X.; Reinhardt, F.; Krall, J.A.; Lambert, A.W.; Thiru, P.; Keys, H.R.; Khan, M.; et al. Genome-Wide CRISPR Screen Identifies PRC2 and KMT2D-COMPASS as Regulators of Distinct EMT Trajectories That Contribute Differentially to Metastasis. Nat. Cell Biol. 2022, 24, 554–564. [Google Scholar] [CrossRef]
  118. Du, B.; Shim, J.S. Targeting Epithelial-Mesenchymal Transition (EMT) to Overcome Drug Resistance in Cancer. Molecules 2016, 21, 965. [Google Scholar] [CrossRef] [Green Version]
  119. Wang, K.; Zheng, J.; Yu, J.; Wu, Y.; Guo, J.; Xu, Z.; Sun, X. Knockdown of MMP-1 Inhibits the Progression of Colorectal Cancer by Suppressing the PI3K/Akt/C-myc Signaling Pathway and EMT. Oncol. Rep. 2020, 43, 1103–1112. [Google Scholar] [CrossRef]
  120. Terada, Y.; Jo, N.; Arakawa, Y.; Sakakura, M.; Yamada, Y.Y.; Ukai, T.; Kabata, M.; Mitsunaga, K.; Mineharu, Y.; Ohta, S.; et al. Human Pluripotent Stem Cell-Derived Tumor Model Uncovers the Embryonic Stem Cell Signature as a Key Driver in Atypical Teratoid/Rhabdoid Tumor. Cell Rep. 2019, 26, 2608–2621. [Google Scholar] [CrossRef] [Green Version]
  121. Vincent, P.H.; Benedikz, E.; Uhlén, P.; Hovatta, O.; Sundström, E. Expression of Pluripotency Markers in Nonpluripotent Human Neural Stem and Progenitor Cells. Stem Cells Dev. 2017, 26, 876–887. [Google Scholar] [CrossRef] [Green Version]
  122. Koçak, N.; Dönmez, H.; Yildirim, İ.H. Effects of Melatonin on Apoptosis and Cell Differentiation in MCF-7 Derived Cancer Stem Cells. Cell. Mol. Biol. 2018, 64, 56–61. [Google Scholar] [CrossRef]
Figure 1. Morphology, proliferation, and cell viability. (A) The ATRT cell lines (CHLA-02 and CHLA-05) were suspended as aggregates when cultured in a normal well plate. The rhabdoid kidney tumor and the nonmalignant cell lines demonstrated attachment as a monolayer in culture. (B) Both ATRT cell lines showed attachment when cultured on a Matrigel-coated surface after 72 h. (C) Cell proliferation and (D) viability were measured at 24 h, 36 h, 48 h, and 60 h. *: p-value < 0.05, using the Student’s t-test. Scale bar: 200 µm.
Cancers 14 03685 g001
Figure 2. Gene expression and immunofluorescence images of different cancerous biomarkers in rhabdoid tumors and nonmalignant cell lines. Relative gene expression comparison of the nonmalignant cell line HEK293 with the ATRT cell lines CHLA-02 and CHLA-05, a kidney rhabdoid tumor cell line, G401, and the transformed HEK293T cell line, respectively. The markers of interest were: (A) MUC16, CD44, SSEA1; (B) OPN; (C) AFP, MSLN, OCT4; (D) CD99, CGB3, NPM1, and ENO2. For OPN, the relative gene expression levels for HEK293T and HEK293 were too low to be visible. *: p-value < 0.05 when compared with HEK293 using the Student’s t-test. (E) Immunostaining of several biomarkers of two ATRT cell lines, CHLA-02 and CHLA-05; a kidney rhabdoid tumor cell line, G401; and a nonmalignant cell line, HEK293. Scale bar: 100 μm.
Cancers 14 03685 g002
Figure 3. Cellular expression of various MMPs, TIMPs, and ADAMs. (A,B) Gene expressions of (A) MMP1, 2, 3, 9; (B) MMP7, 14, 26; (C) TIMP1, 2, 3, 4; (D) ADAM9, 10, 17, and 19. *: p-value < 0.05 when compared to HEK293 cells using the Student’s t-test. (E) Immunostaining for MMP9. Scale bar: 100 μm. (F) Flow cytometry analysis of MMP9 expression in CHLA-02 and CHLA-05. Black line: isotype control; red line: the marker of interest.
Cancers 14 03685 g003
Figure 4. Expression of epithelial and mesenchymal markers in the CHLA-ATRT and other cell lines. Gene expressions for (A) the epithelial marker (CDH1) and (B) mesenchymal markers (VIM, LOX, SNAI1, and SNAI2). *: p-value < 0.05, when compared with HEK293 using the Student’s t-test. (C) Immunostaining for Vimentin (VIM). Scale bar: 100 μm. (D) The analysis of VIM expression by flow cytometry of both ATRT cell lines. Black line: isotype control; red line: markers of interest.
Cancers 14 03685 g004
Figure 5. The effect of GM6001 on the morphology, proliferation, and viability of the CHLA-02 and CHLA-05 cell lines. The effect of (A) DMSO and (B) GM6001 treatment on (i) CHLA-02 and (ii) CHLA-05 morphology. Scale bar: 200 µm. (C) The cell proliferation and (D) viability of (i) CHLA-02 and (ii) CHLA-05 under the treatment of either DMSO or 10 µM of GM6001. *: p-value < 0.05, based on the Student’s t-test.
Cancers 14 03685 g005
Figure 6. The effect of GM6001 on the gene expression of CHLA-02 and CHLA-05. (A,B) CHLA-02 and (C,D) CHLA-05 were treated with either DMSO or 10 µM GM6001, a broad-spectrum MMP inhibitor. The cells were characterized for various biomarkers. *The significant difference between the control (DMSO-treated) versus the GM6001 treatment was determined based on the Student’s t-test with a p-value < 0.05. * indicates statistically significant difference.
Cancers 14 03685 g006
Table 1. Biomarkers investigated in this study.
TypeGeneNameLocation
ATRTOPNOsteopontinSecreted
NPM1Nucleophosmin 1Intracellular
Common
cancer
biomarkers
MUC16Mucin-16Membrane, secreted
CD44Homing cell adhesion moleculeIntracellular, membrane, secreted
AFPAlpha-fetoprotein Secreted
MSLNMesothelinIntracellular, membrane
CD99Single-chain type-1 glycoproteinIntracellular, membrane
CGB3Chorionic gonadotropin β-3Secreted
EmbryonicSSEA1Fucosyltransferase 4Membrane
OCT4Octamer-binding transcription factor 4Intracellular
NeuronalENO2Neuron-specific enolaseIntracellular
Publisher’s Note: MDPI stays neutral with regard to jurisdictional claims in published maps and institutional affiliations.

