Simple Summary
Cancer diagnostics based on molecular imaging techniques such as positron emission tomography (PET) requires radiolabeled tracers, which are taken up by tumors. As the neurotensin receptor type 1 (NTS1R) is present in certain malignant tumors, radiolabeled NTS1R ligands can serve as molecular tools for tumor imaging. A straightforward approach for developing NTS1R PET ligands would be the preparation of fluorine-18 or gallium-68 labeled analogs of the peptide neurotensin. However, as neurotensin derivatives are prone to enzymatic cleavage, structural modifications are needed to prevent peptide degradation while retaining NTS1R affinity. Applying a new strategy for peptide stabilization, it is possible to develop a peptidic gallium-68 labeled NTS1R PET ligand with high in vivo stability and high NTS1R affinity. Investigations of the PET ligand in mice with subcutaneous NTS1R-positive tumors revealed the NTS1R-mediated visualization of the tumor. Future developments, such as NTS1R PET ligands with improved biodistribution, will benefit from these results.
Abstract
Overexpression of the neurotensin receptor type 1 (NTS1R), a peptide receptor located at the plasma membrane, has been reported for a variety of malignant tumors. Thus, targeting the NTS1R with 18F- or 68Ga-labeled ligands is considered a straightforward approach towards in vivo imaging of NTS1R-expressing tumors via positron emission tomography (PET). The development of suitable peptidic NTS1R PET ligands derived from neurotensin is challenging due to proteolytic degradation. In this study, we prepared a series of NTS1R PET ligands based on the C-terminal fragment of neurotensin (NT(8–13), Arg8-Arg9-Pro10-Tyr11-Ile12-Leu13) by attachment of the chelator 1,4,7,10-tetraazacyclododecane-1,4,7,10-tetraacetic acid (DOTA) via an Nω-carbamoylated arginine side chain. Insertion of Ga3+ in the DOTA chelator gave potential PET ligands that were evaluated concerning NTS1R affinity (range of Ki values: 1.2–21 nM) and plasma stability. Four candidates were labeled with 68Ga3+ and used for biodistribution studies in HT-29 tumor-bearing mice. [68Ga]UR-LS130 ([68Ga]56), containing an N-terminal methyl group and a β,β-dimethylated tyrosine instead of Tyr11, showed the highest in vivo stability and afforded a tumor-to-muscle ratio of 16 at 45 min p.i. Likewise, dynamic PET scans enabled a clear tumor visualization. The accumulation of [68Ga]56 in the tumor was NTS1R-mediated, as proven by blocking studies.
1. Introduction
Neurotensin (NT), a linear 13 amino acid peptide, acts as a hormone in the gastrointestinal tract, regulating, inter alia, motility and mucosal regeneration [1], and as a neurotransmitter and neuromodulator in the central nervous system, where it is involved, inter alia, in the regulation of body temperature, food intake, blood pressure, nociception, memory, and hormone secretion [2,3,4,5,6,7]. The effects of neurotensin are mainly mediated by the neurotensin receptors 1 and 2 (NTS1R, NTS2R), members of the family of G-protein coupled receptors. The NTS1R has emerged as an interesting target for tumor visualization and therapy due to its overexpression in a variety of tumors such as breast cancer, colorectal carcinoma, and (the prognostically poor) pancreatic adenocarcinoma [8,9,10]. The carboxyterminal hexapeptide of NT (NT(8-13), 1, Figure 1A) was identified as the biologically active fragment, exhibiting the potency of full-length NT [11,12,13]. Therefore, peptide 1 has previously served as a lead structure for the development of imaging agents addressing the NTS1R [14,15,16,17,18,19,20].
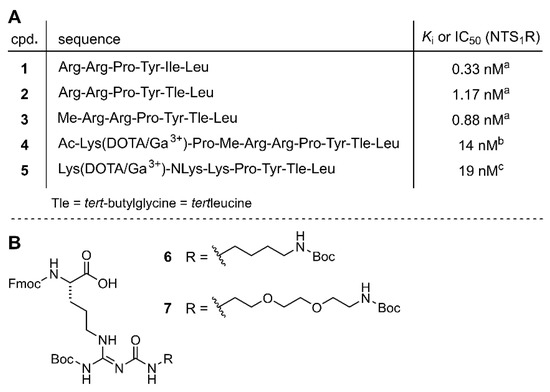
Figure 1.
(A) Amino acid sequences and NTS1R affinities of NT(8-13) (1), NT(8-13) derivatives 2 and 3, and NT(8-13)-derived potential PET ligands 4 and 5. (B) Structures of the reported arginine building blocks 6 and 7 (Keller et al. [39]) which were applied in SPPS for the preparation of amino-functionalized precursor peptides. a Ki value; Schindler et al. [40], b IC50 value; Alshoukr et al. [41], c Ki value; Maschauer et al. [42].
68Ga- and 18F-labeled ligands of cell-surface receptors that are (over-)expressed in malignant tumors are considered useful tools for in vivo cancer imaging by positron emission tomography (PET) [21,22,23,24,25,26,27,28]. 18F-labeled PET tracers are advantageous with respect to half-life (about 110 min) and achievable resolution, but require a cyclotron for radionuclide synthesis and usually two or more radiosynthetic reaction steps [29,30]. In contrast, the advantage of 68Ga-labeled PET tracers lies in their fast one-step radiosynthesis (incorporation of 68Ga in a chelator moiety) and convenient radionuclide accessibility (68Ge/68Ga-generator); however, these tracers result in lower resolution images and the short half-life (68 min) does not allow a transfer between clinics. The development of PET ligands with favorable properties (e.g., high receptor affinity, high in vivo stability and appropriate pharmacokinetics) is challenging. The development of peptidic PET tracers, often acting as receptor agonists, can be convenient with respect to high target affinity and attachment of the label [31,32,33], but high proteolytic stability in vivo might not be easily achieved [33,34]. With respect to NTS1R PET ligands, two main strategies have been pursued [25], i.e., investigations of peptidic agonists and of non-peptidic antagonists [35,36,37]. To date, reported 18F- and 68Ga-labeled NTS1R antagonists exhibit higher receptor affinities and higher in vivo stabilities compared to peptidic NTS1R PET ligands explored with regard to in vivo tumor imaging. However, the pharmacokinetic profile of the antagonists is not well-suited for PET imaging based on short-lived radionuclides [38]. Unlike antagonists, agonist binding induces receptor internalization; thus, peptidic PET ligands potentially allow for a higher tracer uptake in the tumor.
Peptide 1 exhibits a plasma half-life of only a few minutes [40,43]; thus, NT(8-13) analogs require stabilizing structural modifications when intended to be used as tracers for NTS1R-targeted tumor imaging. A previously reported approach based on the replacement of amide bonds in the core structure of 1 by triazoles revealed that high affinity of the respective 177Lu-labeled analogs could not be combined with high in vitro serum stability [44]. The recent exploration of the introduction of trimethylsilylalanine instead of Ile12 or Leu13 for the preparation of 68Ga-labeled derivatives of 1 resulted only in moderate in vitro plasma stabilities as well [38]. The replacement of Ile12 in analogs derived from 1 by Tle12 (α-tert-butyl-Gly) represents one of the most frequently applied modifications to prevent C-terminal degradation [14,15,16,17,18,19,41,42,45,46,47,48,49,50,51,52,53,54], but is insufficient to prevent proteolytic degradation when applied, e.g., to 1 as the only structural alteration (2, Figure 1A) due to persisting N-terminal degradation [40]. However, additional N-methylation of either Arg8 or Arg9 in 1 resulted in excellent in vitro plasma stabilities (e.g., compound 3, Figure 1A) [40].
Among reported 68Ga-labeled neurotensin-derived NTS1R PET ligands, peptides [68Ga]4 and [68Ga]5 (Figure 1A), and the 1,4,7-triazacyclononane-1,4,7-triacetic acid (NOTA)-conjugated analog of 5 represent the most promising candidates in terms of NTS1R affinity and achieved tumor-to-muscle activity ratios. Both peptides contain Tle in position 12, but differ with respect to the modification of the N-terminal segment. Whereas 4 is Nα-methylated at Arg8 and represents an octapeptide, the hexapeptide 5 harbors a peptoid-like moiety at the N-terminus (NLys8). For both peptides in vivo stability data were not reported. However, for the 111In-labeled analog of 4, 22% remaining intact tracer in blood plasma 15 min p.i. in mice has been reported [41], and for [68Ga]5 a high in vitro stability in human serum (93% remaining intact tracer after 1 h) has been described [42]. Notably, in 4 and 5, the 1,4,7,10-tetraazacyclododecane-1,4,7,10-tetraacetic acid (DOTA) chelator is attached to the α- or ε-amino group of Lys, which represents a common strategy for the conjugation of NT(8-13) analogs with chelating agents [16,19,52,54,55,56,57]. A recently introduced alternative strategy is the labeling of peptides via the side chain of Arg, based on amino-functionalized Nω-carbamoylated arginines derived from building blocks 6 and 7 (Figure 1B) [39,58,59]. Lately, the incorporation of 6 in the stabilized NT(8-13) core structure (3) and the subsequent attachment of a fluoroglycosyl moiety to the carbamoylated arginine side chain afforded an 18F-labeled NTS1R PET ligand showing high receptor affinity (Ki of the “cold” ligand = 4.3 nM) and high tumor uptake in vivo [60].
In the present study, we aimed at the development of a peptidic NTS1R PET ligand matching up with reported receptor antagonists in terms of NTS1R affinity and in vivo stability. For this purpose, Nω-carbamoylated arginines derived from 6 or 7 were incorporated into 3 or slightly modified analogs of 3, optimized with respect to plasma stability, followed by the attachment of a DOTA chelator to the modified arginine side chain and insertion of stable (“cold”) Ga3+ or radioactive 68Ga3+. The potential NTS1R PET ligands (“cold” compounds) were characterized with respect to NTS1R and NTS2R affinity, and plasma stability. For selected peptides, the 68Ga-labeled analogs were prepared and studied in vivo in tumor-bearing mice.
2. Materials and Methods
2.1. General Experimental Conditions
Solvents and buffer components, all purchased from commercial suppliers, were of analytical grade. Gradient grade MeOH for HPLC was obtained from Merck Chemicals (Darmstadt, Germany) and gradient grade MeCN for HPLC was from Sigma-Aldrich (Taufkirchen, Germany) or Merck. N,N-Diisopropylethylamine (DIPEA, 99%) and (R)-2-(Boc-amino)-3-(4’-fluoro-[1,1’-biphenyl]-4-yl)propanoic acid (24) were obtained from ABCR (Karlsruhe, Germany). HCOOH and K2CO3 were from Roth (Karlsruhe, Germany) and 1 M HCl was from VWR Chemicals (Fontenay-sous-Bois, France). Anhydrous N,N-Dimethylformamide (DMF) (99.8%), 1,1,1,3,3,3-hexafluoro-2-propanol (HFIP), Ga(NO3)3 hydrate, 7-methyl-1,5,7-triazabicyclo [4.4.0]dec-5-ene (MTBD), methyl-4-nitrobenzenesulfonate, 2-mercaptoethanol, n-octanol and 1-methyl-d-Trp were purchased from Sigma-Aldrich. DMF (for peptide synthesis, packed under nitrogen, code D/3848/PB17), 1-methylpyrrolidin-2-one (NMP) (for peptide synthesis, nitrogen flushed), anhydrous NMP (99.5%), CH2Cl2 and 1-hydroxy-1H-benzotriazole (HOBt) hydrate were obtained from Acros Organics/Fisher Scientific (Nidderau, Germany). When used for the coupling of non-standard Fmoc-amino acids (SPPS), HOBt hydrate, containing up to 3% water, was dried using a lyophilizer. 4-[(Boc-amino)methyl]-3-fluoro-benzoic acid (>95%) (27) was purchased from Activate Scientific (Prien am Chiemsee, Germany) and Boc-ε-aminocaproic acid succinimidyl ester (30) was purchased from Bachem (Bubendorf, Switzerland). DOTA-tris(tBu)ester succinimidyl ester (13) was from CheMatech (Dijon, France). Trifluoroacetic acid (TFA) and absolute EtOH were obtained from Honeywell (Seelze, Germany). Collidine, 2-nitrobenzenesulfonylchloride and 1,8-diazabicyclo [5.4.0] undec-7-ene (DBU) were from Alfa Aesar/ThermoFisher (Heysham, UK). Piperidine and N,N,N′,N′-tetramethyl-O-(1H-benzotriazole-1-yl)-uronium hexafluorophosphate (HBTU) were purchased from Iris Biotech (Marktredwitz, Germany). Deuterated solvents were obtained from Deutero (Kastellaun, Germany). Bovine serum albumin (BSA) was purchased from Serva (Heidelberg, Germany). Oxyma pure, N,N’-diisopropylcarbodiimide (DIC), H-Leu-2-ClTrt resin (loading: 0.79 mmol/g), Fmoc-N-Me-Arg(Pbf)-OH, Fmoc-Pro-OH, Fmoc-Ile-OH and Fmoc-Tle-OH (Fmoc-l-α-tert-butylglycine) were from Merck Biosciences (Schwalbach am Taunus, Germany). Cl-2-ClTrt resin (loading: 1.6 mmol/g), Fmoc-l-allo-Ile-OH, Fmoc-Deg-OH, Fmoc-l-cPrGly-OH and Fmoc-β,β-diMe-Tyr(tBu)-OH (rac) were obtained from Iris Biotech. Fmoc-Arg(Pbf)-OH and Fmoc-Tyr(tBu)-OH were from Iris Biotech or Carbolution (St. Ingbert, Germany). Fmoc-β-cyclopropyl-l-Ala-OH, Fmoc-β-cyclopentyl-l-Gly-OH, Fmoc-α-methyl-l-Leu-OH and (S)-Fmoc-α-ethyl-Ala-OH were from ABCR, and Fmoc-(S)-2-amino-2-cyclobutylacetic acid was from Merck Chemicals. Ultrapure 4-(2-hydroxyethyl)-1-piperazineethanesulfonic acid (HEPES) was from Gerbu (Heidelberg, Germany). Peptide 1 (tris(hydrotrifluoroacetate)) was purchased from SynPeptide (Shanghai, China). The syntheses of reference peptides 2 [40] and 3 [40], arginine building blocks 6 [39] and 7 [39], NT(8-13) derivative 10 [60] and radioligand [3H]UR-MK300 [39] have been described elsewhere. Millipore water was used throughout for the preparation of buffers, stock solutions and HPLC eluents. 1.5- and 2-mL polypropylene reaction vessels with screw cap (in the following referred to as “reaction vessel with screw cap”) from Süd-Laborbedarf (Gauting, Germany) were used for the preparation and storage of stock solutions, and for small-scale reactions. 1.5- or 2-mL polypropylene reaction vessels (in the following referred to as “reaction vessel”) from Sarstedt (Nümbrecht, Germany) were used for the preparation of serial dilutions, for the synthesis, determination of the distribution coefficient and biodistribution measurements of 68Ga-labeled PET tracers and for the determination of stabilities in plasma. For the evaporation of solvents in 1.5- or 2-mL reaction vessels, a Savant Speed-Vac Plus SC110A vacuum concentrator (Thermo Fisher Scientific, Waltham, MA) was used. NMR spectra were recorded on a Bruker Avance 600 instrument (1H: 600 MHz, 13C: 151 MHz) (Bruker, Karlsruhe, Germany) at 300 K. The spectra were calibrated based on the solvent residual peaks (1H-NMR: DMSO-d6: δ = 2.50 ppm; 13C-NMR: DMSO-d6: δ = 39.52 ppm). 1H-NMR data are reported as follows: chemical shift δ in ppm (multiplicity (s = singlet, d = doublet, m = multiplet, br s = broad singlet), integral, coupling constant J in Hz). High resolution mass spectra (HRMS) were acquired with an Agilent 6540 UHD Accurate-Mass Q-TOF LC/MS system coupled to an Agilent 1290 HPLC system (Agilent Technologies, Santa Clara, CA), using an ESI source. Analyses were performed using the following LC method: column: Luna Omega C18, 1.6 μm, 50 × 2.1 mm (Phenomenex, Aschaffenburg, Germany), column temperature: 40 °C, flow: 0.6 mL/min, solvent/linear gradient: 0–4 min: 0.1% aqueous HCOOH/0.1% HCOOH in MeCN 95:5–2:98, 4–5 min: 2:98. Preparative HPLC was performed with a system from Knauer (Berlin, Germany) consisting of two K-1800 pumps and a K-2001 detector (compounds 8, 9, 11, 12, 14–21, 23, 25, 26, 28, 29, 31–57), or a Prep 150 LC System from Waters (Eschborn, Germany) consisting of a 2545 binary gradient module, a 2489 UV/visible detector, and a Waters Fraction Collector III (compound 22). A Kinetex-XB C18, 5 μm, 250 mm × 21 mm (Phenomenex) or a Gemini-NX C18, 5 μm, 250 mm × 21 mm (Phenomenex) served as RP-columns at a flow rate of 20 mL/min. Mixtures of 0.2% aq TFA (A1) and acetonitrile (B1), or 0.1% aq TFA (A2) and B1 were used as mobile phase. A detection wavelength of 220 nm was used throughout. Collected fractions were lyophilized using an Alpha 2–4 LD apparatus (Martin Christ, Osterode am Harz, Germany) or a Scanvac CoolSafe 100-9 freeze-dryer (Labogene, Allerød, Denmark) both equipped with a Vacuubrand RZ 6 rotary vane vacuum pump. Analytical HPLC analysis of compounds 8, 9, 11, 12, 14–23, 25, 26, 28, 29 and 31–57 was performed with a system from Agilent Technologies consisting of a 1290 Infinity binary pump equipped with a degasser, a 1290 Infinity Autosampler, a 1290 Infinity Thermostated Column Compartment, a 1260 Infinity Diode Array Detector and a 1260 Infinity Fluorescence Detector. A Kinetex-XB C18, 2.6 μm, 100 × 3 mm (Phenomenex) served as stationary phase at a flow rate of 0.5 mL/min or 0.6 mL/min. The oven temperature was set to 25 °C. UV detection was performed at 220 nm and fluorescence detection at 275/305 nm. The injection volume was 20 μL. Mixtures of 0.04% aq TFA (A3), 0.05% aq HCOOH (A4) or 0.1% aq HCOOH (A5) and B1 or MeOH (B2) were used as mobile phase. The following linear gradients were applied for purity controls: compounds 8, 9, 11, 12, 14–18, 25, 26, 28, 29, 31–35 and 38–57 (flow rate 0.6 mL/min): 0–12 min: A3/B1 90:10–70:30, 12–16 min: 70:30–5:95, 16–20 min: 5:95; compounds 19–23, 36, 37 (flow rate 0.5 mL/min): 0–12 min: A4/B2 95:5–70:30, 12–16 min: 70:30–5:95, 16–20 min: 5:95. The following linear gradient was used for the analysis of plasma stability samples: 0–12 min: A3/B1 90:10–73:27, 12–16 min: 73:27–5:95, 16–20 min: 5:95. Retention (capacity) factors k were calculated from the retention times tR according to k = (tR − t0)/t0 (t0 = dead time). Peptides were characterized by 1H- and 1H-COSY NMR spectroscopy, HRMS, and RP-HPLC analysis. Additionally, 13C-NMR spectra were acquired of 50 and 51.
Annotation concerning the 1H-NMR spectra (solvent: DMSO-d6): in order to allow an integration of the signals interfering with the broad water signal at ca. 3.5 ppm, spectra were additionally recorded in DMSO-d6/D2O (4:1 v/v (8, 9, 11, 14–17, 19–22) or 5:1 v/v (12, 18, 23, 25, 26, 28, 29, 32–57)).
2.2. Cell Culture and Preparation of HEK293T Cells Stably Expressing the Human NTS2R
All cells were cultured in 75 or 175 cm2 flasks (Sarstedt, Nuümbrecht, Germany) in a humidified atmosphere (95% air, 5% CO2) at 37 °C. HT-29 colon carcinoma cells (DSMZ-no. ACC 299) were maintained in antibiotic-free RPMI medium (Sigma-Aldrich) supplemented with 7.5% fetal bovine serum (FBS) (Sigma-Aldrich). HEK293T cells stably expressing the human NTS2R (HEK293T-hNTS2R cells) were essentially generated following a previously described procedure [61]. In brief, HEK293T cells (kind gift from Prof. Dr. Wulf Schneider, Institute for Medical Microbiology and Hygiene, University of Regensburg, Germany) were seeded on a 6-well plate (Sarstedt, Nümbrecht, Germany) in Dulbecco’s modified Eagle’s medium (Sigma-Aldrich) supplemented with 10% FBS, l-glutamine (2 mM) (Sigma-Aldrich) and Penicillin-Streptomycin (100 IU/mL and 0.1 mg/mL, respectively) (Sigma-Aldrich) at a density of 6 × 10⁵ cells/well. On the next day, cells were transfected with 2 µg of cDNA encoding the hNTS2R (cDNA Resource Center, Rolla, MO, USA, catalog no. NTSR200000) using X-tremeGENETM HP (Roche Diagnostics, Mannheim, Germany) as transfection reagent according to the manufacturer’s protocol. After two days of transfection, cells were detached with trypsin-ethylenediamine-tetraacetic acid (EDTA, Biochrom, Berlin, Germany) and transferred to a 15-cm dish (Sarstedt, Nümbrecht, Germany). After the cells had attached to the dish, G418 (Biochrom, Berlin, Germany) was added at a final concentration of 1 mg/mL. Selection was achieved by exchanging the medium every two to three days for two weeks. Subsequently, a clone with high NTS2R-expression, which was assessed radiochemically after addition of 10 nM of [3H]UR-MK300, was isolated. Cultivation was then continued with a reduced G418 concentration in the culture medium of 600 µg/mL.
2.3. Radiochemical Binding Assays
2.3.1. NTS1R Binding
Radioligand competition binding experiments with [3H]UR-MK300 (specific activity: 47.0 Ci/mmol [39] or 65.0 Ci/mmol; for structure see Figure S1, Supplementary Materials) at hNTS1R-expressing intact human HT-29 colon carcinoma cells were performed at 23 ± 1 °C as described previously [39]. Two different batches of the radioligand [3H]UR-MK300 were used. The Kd values of [3H]UR-MK300 amounted to 0.55 nM (mean value from two independent saturation binding experiments, each performed in triplicate) [40] and 0.41 ± 0.12 nM (mean value ± SD from two independent saturation binding experiments, each performed in triplicate). Specific binding data (obtained by subtracting unspecific binding from total binding) were normalized (100% = specifically bound radioligand in the absence of competitor) and plotted over log(concentration of competitor) followed by a four-parameter logistic fit (SigmaPlot 12.5, Systat Software, San José, CA, USA) (note: in the case of 40, the lower curve plateau of the sigmoidal fit was constrained to >0). Resulting pIC50 values were converted to IC50 values and Ki values were calculated from the IC50 values according to the Cheng-Prusoff equation [62] using a Kd value of 0.55 nM (8, 9, 11, 14–17 and 19–22) or 0.41 nM (12, 18, 23, 25, 26, 32–50, 52 and 54–57). The Ki values from individual experiments were transformed to pKi values, followed by the calculation of mean pKi values ± SD.
2.3.2. NTS2R Binding
NTS2R saturation and competition binding experiments were performed at intact HEK293T-hNTS2R cells at 23 ± 1 °C using [3H]UR-MK300 [39] as radioligand (two different batches were used; specific activities: 47.0 Ci/mmol [39] and 65.0 Ci/mmol). Two days prior to the experiment, white 96-well plates with clear bottoms (Costar, catalog no. 3610) were treated with poly-d-lysine hydrobromide (Sigma-Aldrich) for 10 min. The wells were washed with H2O and the plates were dried on air at rt overnight. Alternatively, plates were treated with a sterile solution of 5% (w/v) gelatin (Sigma-Aldrich) in H2O (50 µL) at rt for 1.5–2 h. The gelatin solution was removed, followed by the addition of a solution of 2.5% (v/v) of glutaraldehyde (Sigma-Aldrich) in H2O (50 µL) at rt for 10 min. After removal of the glutaraldehyde solution, the wells were washed twelve times with H2O and two times with culture medium (150–300 µL). One day before the experiment, cells were seeded in the treated plates at a density of 9 × 10⁴ cells/well. On the day of the experiment, the culture medium was carefully removed using a multi-channel pipette (Transferpette S-12, Brand, Wertheim, Germany) and the cells were washed once with Dulbecco’s phosphate-buffered saline (D-PBS) containing Ca2+ and Mg2+ (1.8 mM CaCl2, 2.68 mM KCl, 1.47 mM KH2PO4, 3.98 mM MgSO4, 136.9 mM NaCl and 8.06 mM Na2HPO4) (200 μL, rt) followed by the careful pre-filling of the wells with 180 µL (total binding) or 160 µL (unspecific and competition binding) of D-PBS, supplemented with 1% BSA and 100 μg/mL bacitracin (Serva, Heidelberg, Germany) (in the following referred to as binding buffer). To determine total binding, 20 µL of a solution of the radioligand in binding buffer (10-fold concentrated compared to the final concentration) were added. For the determination of unspecific binding, 20 µL of a solution of 1 in binding buffer (10-fold concentrated, used in 500-fold excess compared to the radioligand) and 20 µL of a 10-fold concentrated solution of the radioligand in binding buffer were added. To determine the displacing effect of a compound of interest, 20 µL of a solution of the respective compound in binding buffer (10-fold concentrated) and 20 µL of a 10-fold concentrated solution of the radioligand in binding buffer were added. During the incubation period of 2 h at 23 °C, the plates were gently shaken. After incubation, the liquid was carefully removed using a multi-channel pipette and the cells were carefully washed twice with ice-cold D-PBS (200 μL). 25 μL of lysis solution (8 M urea, 3 M acetic acid, and 1% Triton-X-100 in H2O) were added to each well and the plates were shaken at rt for 25 min, followed by the addition of liquid scintillator (Ultima Gold, PerkinElmer, Waltham, MA, USA) (200 μL). The plates were sealed with a transparent sealing tape (permanent seal for microplates, PerkinElmer, product no. 1450–461) and turned upside down several times to achieve complete mixing. Prior to the measurement of the radioactivity with a MicroBeta2 plate counter (PerkinElmer), the plates were kept in the dark for at least 1 h. All experiments were performed in triplicate. The Kd values of [3H]UR-MK300, determined for the different batches of radioligand by saturation binding experiments, amounted to 6.9 ± 1.8 nM (mean value ± SD from six independent determinations, each performed in triplicate) and 4.0 ± 1.5 nM (mean value ± SD from three independent determinations, each performed in triplicate) (for representative saturation binding curves see Figure S2, Supplementary Materials). Data from competition binding experiments were analyzed as described for NTS1R binding using a Kd value of 6.9 nM (1, 8, 9, 14, 15, and 19) or 4.0 nM (3, 9–11, 15–17, 19–22, 48–53, and 56). Note: in the cases of 49–53 and 56, the lower curve plateau of the sigmoidal fit was constrained to >0.
2.4. Fura-2 Ca2+-Assay
The fura-2 calcium assay on intact hNTS1R-expressing HT-29 cells was performed as previously described for human erythroleukemia cells [63] using a Perkin-Elmer LS50 B spectrofluorimeter (PerkinElmer, Rodgau, Germany). At a confluency of 80–95%, cells were trypsinized, detached from the culture flask and the assay was performed as described in the protocol. Net Ca2+ responses (basal cytosolic Ca2+ concentration subtracted from the measured Ca2+ concentration), induced by 1, 21, and 56, were normalized (100% = effect elicited by 300 nM NT(8-13)) and plotted over log(concentration of agonist) followed by a four-parameter logistic fit (SigmaPlot 12.5, Systat Software).
2.5. Investigation of the Stability of 8, 9, 11, 12, 14–23, 38–49 and 54–57 in Human Plasma
The proteolytic stabilities of 8, 9, 11, 12, 14–23, 38–49, and 54–57 were investigated in human blood plasma/PBS (136.9 mM NaCl, 2.68 mM KCl, 5.62 mM Na2HPO4, 1.09 mM NaH2PO4 and 1.47 mM KH2PO4) pH 7.4 (1:2, v/v) according to a described procedure [40] with the following modifications: 5 mM stock solutions in MeCN/0.04% aq TFA (30:70 v/v) were used throughout for the addition of the peptides to plasma/PBS (1:2 v/v). As the RP-HPLC purity of 1-methyl-d-Trp, used as internal standard (IS) was <95%, the compound was purified by preparative HPLC to give a purity of >99%. The concentration of the peptides in plasma/PBS (1:2 v/v) was 80 and 4 µM (recovery determination) or 100 µM (stability tests). Data analysis was based on UV detection at 220 nm (8, 9, 11, 12, 14–18, 21–23, 38–49, and 54–57) or fluorescence detection at 275/305 nm (19 and 20). Reference samples, representing 100% recovery, were prepared in duplicate (8, 9, 11, 14–16, and 19–21) or quadruplicate (12, 17, 18, 22, 23, 38–49, and 54–57). Recovery ratios were obtained by dividing the recovery of the peptide by the recovery of IS for each individual sample (n = 3–5). The obtained recoveries and the recovery ratios are summarized in Table S2, Supplementary Materials. Note: in the case of compounds 38–49, which were prepared for testing the effects of various unnatural amino acids on peptide stability, no recovery ratios were determined. Instead, the recovery ratios determined for the previously reported, structurally closely related peptide Me-Arg-Arg-Pro-Tyr-Ile-Leu [40] were used for calculating the amount of remaining intact peptide in plasma.
2.6. Circular Dichroism (CD) Analysis
CD spectra of 100 µM aqueous solutions of 48 and 49 and a reference compound with the amino acid sequence Me-Arg-Arg-Pro-Tyr-Ile-Leu [40] were recorded in a 1 cm path length cuvette at 20 °C with a Jasco J-810 spectropolarimeter (Jasco, Tokyo, Japan) equipped with a PTC-423S Peltier temperature controller (Jasco). Instrumental parameters: spectral range, 180−300 nm; bandwidth, 1 nm; scanning speed, 500 nm/min. Each spectrum represents the average of three spectra, each recorded with 20 accumulations, after solvent subtraction. An “economy-size” singular-value decomposition (SVD) on a set of nine spectra (matrix A consisting of three spectra for each of 48, 49 and the reference compound) was calculated in MATLAB (MathWorks, Natick, MA) as A = U·S·VT. Here, U is a matrix whose columns contain the linearly independent spectral components, S is a diagonal matrix containing the singular values, and VT is the transpose of matrix V, which contains the linear coefficients associated with the spectral components in U.
2.7. Synthesis, In Vitro and In Vivo Characterization of PET Tracers [68Ga]21, [68Ga]33, [68Ga]37 and [68Ga]56
2.7.1. PET Tracer Synthesis
The preparation of the 68Ga-labeled PET ligands [68Ga]21, [68Ga]33, [68Ga]37 and [68Ga]56 was performed on a Scintomics GRP® synthesizer module (Scintomics GmbH, Fürstenfeldbruck, Germany) with the Scintomics Control Center software, the Reagent and Hardware Kit SC-01 and SC-01-H (ABX, Radeberg, Germany) and a Isomed 2010 activimeter (MED Nuklear-Medizintechnik, Dresden, Germany) for activity measurements. [68Ga]GaCl3 was eluted from a 68Ge/68Ga-generator GalliaPharm (Eckert&Ziegler, Berlin, Germany) with 0.1 M HCl (Eckert&Ziegler) (approximately 9 mL). A 0.12–0.15 mM solution of the precursor compound (16, 32, 35 or 54) in ultrapure H2O (Merck) (100 µL) was added to a HEPES buffer (ABX Kit; 1.5 M, pH 5.5) (3 mL), combined with the gallium eluate and the mixture was incubated for 6 min ([68Ga]21, [68Ga]33, [68Ga]56) or 16 min ([68Ga]37) at 125 °C, cooled down to approximately 120 °C and loaded on a C18 cartridge (Sep-Pak C18 Plus Short Cartridge, 55–105 µm, Waters, Milford, MA, USA). After a washing step with H2O (ca. 8 mL), the product was eluted from the cartridge with EtOH (effective volume ca. 1 mL) and the eluate was transferred into a 2-mL reaction vessel. The solvent was evaporated in a Savant Speed-Vac SVC100H vacuum concentrator (Savant Instruments, Farmingdale, NY, USA) equipped with pre-heated (100 °C) rotor inserts (aluminum blocks with bores for 1.5- and 2-mL reaction vessels) for approximately 50 min (note: a complete evaporation to dryness was avoided; the residual volume was approximately 10–30 µL), followed by uptake in 0.1% aq HCOOH (80–100 µL). The solution was subjected to preparative work-up using an HPLC system composed of a P4000 pump (Thermo Separation Products), a Degassex DG-4400 degasser (Phenomenex), a 2487 UV/visible detector (Waters) and a Rheodyne manual injector equipped with a 200 µL loop (note: the pump was directly controlled via the front panel and the UV/Vis-detectorwas remote-controlled using Waters Millennium Software). For the detection of γ-radiation, a B20/G-10 RADEye (Thermo Scientific, Erlangen, Germany) was placed close to the outlet tubing of the UV/Vis-detector (note: the vessel used for waste collection was shielded from the RADEye by 2 cm of lead). The stationary phase, a Luna C18(2), 3 μm, 150 × 4.6 mm (Phenomenex), was placed in a box of lead (wall thickness: 2 cm). The flow rate was 0.5 mL/min. Mixtures of A5 and B2 were used as mobile phase. The following linear gradients were applied: [68Ga]21: 0–16 min: A5/B2 85:15–65:35, 16–17 min: 65:35–5:95, 17–22 min: 5:95; [68Ga]33 and [68Ga]37: 0–16 min: A5/B2 65:35–45:55, 16–17 min: 45:55–5:95, 17–22 min: 5:95; [68Ga]56: 0–16 min: A5/B2 80:20–60:40, 16–17 min: 60:40–5:95, 17–22 min: 5:95. UV detection was performed at 220 nm and 275 nm (note: the chosen conditions enabled a separation of excessive labeling precursor from the Ga3+-labeled species. For an exemplary chromatogram of a co-injection of 32 and 33 (50 µM each, injection volume 75 µL), and a chromatogram of the separation of [68Ga]33 from remaining 32 after radiosynthesis see Figure S7, Supplementary Materials). The eluate, containing the PET ligand, was collected in a 2-mL reaction vessel immediately followed by removal of the solvent in a vacuum concentrator equipped with pre-heated (100 °C) aluminum blocks (35–40 min). However, a complete evaporation of the solvent was avoided. The aqueous residue (20–40 µL) was taken up in PBS (ABX Kit) (80–500 µL) yielding a solution referred to as “tracer stock” in the following (final activity 0.157–1.69 GBq/mL). Quality controls of the PET ligands were performed by HPLC analysis using a system from Agilent Technologies (Waldbronn, Germany) consisting of a 1100 Series quaternary pump equipped with a 1260 Infinity degasser, a 1100 Series Autosampler, a 1100 Series Thermostated Column Compartment, a 1100 Series Diode Array Detector, and a GABI Star radiometric detector (Raytest Isotopenmessgeräte GmbH, Straubenhardt, Germany). A Luna C18(2), 3 μm, 100 × 4.6 mm (Phenomenex) served as stationary phase. The flow rate was 0.95 mL/min and the temperature of the Column Compartment was set to 25 °C. The following linear gradients were applied: [68Ga]21: 0–9 min: A3/B1 95:5–72:28, 9–12 min: 72:28–5:95, 12–16 min: 5:95; [68Ga]33 and [68Ga]37: 0–9 min: A3/B1 95:5–55:45, 9–12 min: 55:45–5:95, 12–16 min: 5:95; [68Ga]56: 0–9 min: A3/B1 95:5–65:35, 9–12 min: 65:35–5:95, 12–16 min: 5:95. UV detection was performed at 220 nm. Dilutions of the tracer stocks (5–25 µL, 0.17–1.39 MBq) were injected into the HPLC system. PET tracer-specific details about the syntheses including radiochemical yields and purities are provided in Table 1.

Table 1.
PET ligand specific parameters for the radiosynthesis of [68Ga]21, [68Ga]33, [68Ga]37 and [68Ga]56.
2.7.2. Determination of the Distribution Coefficient logD7.4 of PET Ligands [68Ga]21, [68Ga]33, [68Ga]37 and [68Ga]56
The distribution coefficients logD7.4 of the radiotracers [68Ga]21, [68Ga]33, [68Ga]37 and [68Ga]56 were determined by adding a solution of the tracer in PBS (100 μL, ca. 0.20–0.34 MBq) to a mixture of n-octanol (500 μL) and PBS (pH 7.4) (400 μL) in a 2-mL HPLC vial (Agilent, article number 5182-0714) with a screw cap equipped with a septum (Agilent, article number 5182-0717). After vortexing the mixture for 2 min, two 100 μL aliquots of the upper phase (n-octanol) were taken. To obtain a sample of the lower phase (PBS), the HPLC vial was held upside down and approximately 100–150 µL of the aqueous phase were removed using a syringe equipped with a canula and collected in a reaction vessel. Two 10 µL aliquots of the aqueous phase were subjected to measurement. The activity of the aliquots was measured with a Canberra Genie 2000 system (Canberra, Rüsselsheim, Germany) using the Gamma Acquisition & Analysis Software Genie 2000 3.4.1. Experiments were performed in triplicate. The decay-corrected counts per minute (cpm) values were averaged (n = 3) and transformed to a distribution coefficient logD7.4 according to logD7.4 = log(Aoctanol/Aaqueous), where Aoctanol is the mean of the decay-corrected cpm values obtained for samples of the n-octanol phase, and Aaqueous is the mean of the decay-corrected cpm values obtained for samples of the aqueous phase.
2.7.3. Mouse Xenograft Model
8–12 weeks old female NMRI nude (nu/nu) mice (body weight 22–32 g) (Charles River, Sulzfeld, Germany) were kept under specified pathogen free (SPF) conditions at 23 °C, 55% relative humidity and a 12 h light/dark cycle in the central animal facility of the University of Regensburg using type III cages from Tecniplast (Hohenpeißenberg, Germany). The animals took food (Ssniff, Soest, Germay) and autoclaved tap water ad libitum. For tumor cell implantation, the culture medium of HT-29 cells was removed, the cells were detached from the culture flask by incubation for 2 min in trypsin-EDTA and the suspension was centrifuged (5 min, rt, 164 g). The supernatant was removed, and the cell pellet was washed twice with sterile PBS or serum-free medium (5–6 mL). The cells were resuspended in sterile PBS to a final density of 1 × 10⁷ cells/mL. Mice were injected subcutaneously into the right flank with the HT-29 cell suspension (100 µL). After 2–4 weeks, when the tumors had reached a size of 50–500 mm3, animals were used for biodistribution and PET/computed tomography (CT) imaging studies (note: for PET/CT studies, the tumor size was at least 200 mm3).
2.7.4. Animal Anesthetization
Mice were anesthetized by i.p. injection (100 µL per 10 g body weight) using a mixture that was prepared by addition of ketamin (Medistar Arzneimittelvertrieb, Ascheberg, Germany, 10 wt%, 800 µL) and xylazine (Serumwerk, Bernburg (Saale), Germany, 2 wt%, 200 µL) to PBS (9 mL).
2.7.5. Biodistribution Studies
Aliquots of the tracer stock were diluted in PBS to give a volume of 200 µL. 80–100 µL (0.9–5.9 MBq) of this solution were injected into anesthetized HT-29 tumor-bearing nude mice via the tail vein. Animals were kept on a heating plate (set to 40 °C) or a pre-heated (ca. 45 °C) gel cushion and were killed by cardiac puncture 10 min, 25 min or 45 min p.i. immediately followed by taking blood, urine and tissue (i.e., tumor, kidney, liver, gall bladder, spleen, small intestine, heart, lung, brain, pancreas, femur and muscle) samples. Radioactivity measurement of the samples was performed with the Canberra Genie 2000 system described for the determination of the distribution coefficient logD7.4. Decay-corrected measured activities (cpm) were converted into activities (MBq) on the basis of an activity measurement with a 68Ge-calibration standard source (Eckert&Ziegler, Berlin, Germany). Sample activities were converted to percentage of injected dose per gram tissue (%ID/g). Blocking experiments were performed by co-injection of the tracer with NTS1R ligand 48 (ca. 700 nmol per mouse). Mice were killed 45 min p.i. and analyzed as described above. The animals used for the 45-min biodistribution experiments were the same as used for the PET/CT imaging studies.
2.7.6. HPLC Analysis of Urine from Mice Injected with [68Ga]21, [68Ga]33, [68Ga]37 or [68Ga]56
The analysis was performed with the urine obtained from biodistribution and PET imaging studies, respectively (t = 10 or 45 min). The urine was diluted with H2O (1:2–1:100 depending on the activity in the urine) and 10–80 µL of this solution were subjected to analysis by analytical HPLC using the same HPLC system and conditions as described for the quality controls of the PET ligands. To confirm the identity of [68Ga]56 in the 45-min urine samples, an additional analysis was performed, using the aforementioned injection solution spiked with 100 µM 56. Representative chromatograms of the HPLC analysis of the urine samples are shown in Figures S9–S11, Supplementary Materials.
2.7.7. HPLC Analysis of Blood Plasma from Mice Injected with [68Ga]56
This analysis was performed with the blood obtained from biodistribution studies with [68Ga]56 (t = 10 min). Blood (ca. 200 µL) was taken from the heart using a syringe that was rinsed with sodium heparin (25000 I.E., Ratiopharm, Ulm, Germany). The heparinized blood was transferred into a 1.5-mL reaction vessel immediately followed by centrifugation (5 min, 4 °C, 1200 g) using a Biofuge fresco centrifuge (Heraeus, Hanau, Germany). The supernatant (ca. 100 µL) was treated with the same volume of 10% aq TFA (precipitation of proteins) and the mixture was centrifuged (10 min, 4 °C, 16,100 g). The supernatant (70–100 µL) was subjected to analysis by analytical HPLC using the same HPLC system and conditions as described for the quality control of the PET ligand. To confirm the identity of [68Ga]56 in the plasma samples, an additional analysis was performed, using the aforementioned injection solution spiked with 100 µM 56. Representative chromatograms of the HPLC analysis of the plasma samples are shown in Figure S11C–E, Supplementary Materials.
2.7.8. Determination of the Internalization of [68Ga]56 in HT-29 Tumor Cells
HT-29 cells were seeded in 24-well TC plates (Sarstedt, catalog no. 83.3922) one day prior to the experiment at a density of 4.5 × 10⁵ cells/well. Shortly before the experiment, the culture medium was removed and the cells were washed once with PBS (500 μL, rt) followed by pre-filling of the wells with 250 µL of binding buffer (see procedure for NTS2R binding studies). For the determination of unspecific binding, the binding buffer was supplemented with 1 (2 µM). 50 µL aliquots of the [68Ga]56 stock in PBS (1.5–2.8 MBq) were added to the wells, and the cells were incubated at 37 °C for 5, 10, 15, 25, 35, 55, or 75 min under gentle shaking. After completed incubation, the plates were immediately placed on ice, the liquid was removed by suction and the cells were washed twice with ice-cold PBS (500 μL). The cells were washed twice with ice-cold acid strip buffer (50 mM glycine and 125 mM NaCl in H2O, pH 3.0) (300 µL) for 5 min each, and the washings were combined in 5-mL polypropylene tubes. The cells were then lysed by the addition of lysis solution (see procedure for NTS2R binding studies) (250 µL) and shaken at 37 °C for 15 min. The lysates were transferred into 5-mL polypropylene tubes, the wells were washed with lysis solution (250 µL) and the washings were combined with the lysates. The activities were measured with the Canberra Genie 2000 system as described for the determination of the distribution coefficient logD7.4. The decay-corrected cpm values of unspecific binding were subtracted from the decay-corrected cpm values of total binding to obtain specific binding data for both surface-bound [68Ga]56 (acid strip) and internalized [68Ga]56 (cell lysate). The amount of internalized specific binding was normalized based on total specific binding, and the mean values from two independent experiments (each performed in triplicate) were plotted against the incubation time.
2.7.9. PET/CT Imaging with [68Ga]56
PET/computed tomography (CT) imaging was performed using an EARL-certified clinical PET/CT scanner (Biograph mCT-S(40) with TrueV and Flow-4R technology, Siemens Healthcare, Erlangen, Germany) exhibiting, at 1 cm off-center, a spatial resolution for 18F of 4.1 mm in transversal and 4.7 mm in axial direction according to the NEMA NU2-2007 standard [64]. This PET/CT scanner is capable of obtaining PET images in small animal experiments with reported recovery coefficients from NEMA NU 4 phantom measurements of 0.21, 0.59, and 1.16 in rods with a diameter of 2, 3, and 4 mm, respectively [65]. After positioning the animal, topograms were acquired (70 kVp, 60 mA, slice 0.6 mm, manually terminated craniocaudal movement) with tube position at bottom and lateral for anteroposterior and lateral view, respectively. A CT scan (70 kVp, 140 mA) was performed without dose reduction (CARE Dose 4D and CARE kV off) with the minimal slice scanning thickness of 0.6 mm (40 × 0.6 mm) with a pitch of 0.35 and a rotation time of 0.5 s resulting in a typical acquisition time of about 27 s. For attenuation correction of the PET data acquisition, axial CT images were reconstructed with the full field of view (FoV) of 780 mm by the FAST reconstruction algorithm using the “B30f medium smooth” kernel with an increment of 0.6 mm, typically resulting in 369 images. For visual analysis, axial CT images were reconstructed with a reduced FoV of 100 mm by the SAFIRE reconstruction algorithm (strength = 3) by the “I49f medium” kernel with an increment of 0.3 mm, typically resulting in 737 images. For PET data acquisition, the animal bed was positioned in the center of the PET detector. Simultaneously with the injection of the tracer, a dynamic PET scan (list mode for 45 min in a single bed position) was started.
2.7.10. Tracer Administration
Aliquots of the tracer stock of [68Ga]56 were diluted in PBS to give a volume of 200 µL. 80–100 µL of this solution (3.2–5.9 MBq per mouse) were injected into the tail vein of anesthetized HT-29 tumor-bearing nude mice placed in the scanner. During the PET scan, mice were kept on a pre-warmed (approximately 45 °C) gel pad. Immediately after the PET scan, mice were killed followed by taking blood, urine, tumor tissue and organ tissues. Blocking experiments were carried out by co-injection of the tracer with 48 (ca. 700 nmol per mouse).
2.7.11. Imaging Analysis
For dynamic analysis of the PET images, list mode data were replayed according to the following frame scheme: 6 × 10 s, 4 × 30 s, 1 × 2 min, 4 × 5 min, 2 × 10 min. All PET scans were corrected for normalization, detector dead time, attenuation, scatter, decay, random coincidences and prompt gamma coincidences. Attenuation corrected PET images (512 × 512 pixels, pixel size 0.40 mm, slice thickness 2.03 mm) were reconstructed by iterative reconstruction (8 iterations, 24 subsets, point spread function modelling) with a Gaussian post reconstruction filter with 1.0 mm full width at half maximum (FWHM). Additionally, static frames from 5 min to 10 min and for the entire acquisition of 45 min were reconstructed (512 × 512 pixels, pixel size 0.40 mm, slice thickness 0.6 mm) from the list mode data. By means of static recording over the complete acquisition period, possible movements of the mouse could be excluded. For determination of the tracer uptake in tumors and kidneys corresponding regions of interest (ROIs) were generated using a fixed threshold of 45% of the maximum tracer accumulation for tumors and 40% of the maximum tracer accumulation for kidneys. The resulting delineations were inspected visually and corrected manually if necessary. Manual correction was performed for all tumors in mice used for blocking experiments which exhibited only low diffuse tracer accumulation. For determination of the tracer uptake in the muscles, a ROI was delineated manually in the left femoral muscles observing a volume of approximately 0.05 mL. The ROIs were transferred to all time frames of the respective dynamic study. Time-activity-curves (TACs) were generated by computing the mean standardized uptake value normalized to body weight (SUVmean) in each frame. ROI definition and ROI analyses were performed using the ROVER software, version 3.0.64 (ABX GmbH, Radeberg, Germany).
3. Results and Discussion
3.1. Chemistry
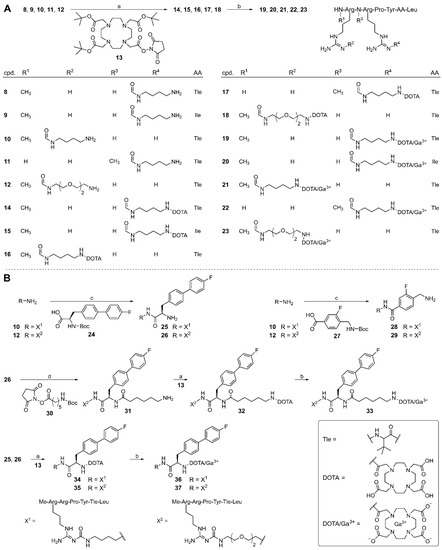
Standard Fmoc strategy solid-phase peptide synthesis (SPPS) was used for the preparation of the NT(8-13)-derived peptides 8, 9, 10 [60], 11, and 12, containing an amino-functionalized arginine (position 8 or 9) derived from the reported Fmoc- and Boc-protected Nω-carbamoylated arginine building blocks 6 or 7 [39] (structures shown in Figure 1B) (Scheme 1). Peptides 8–12 were Nα-methylated in position 8 (8–10 and 12) or 9 (11), and α-tert-butyl-Gly (Tle) was incorporated in position 12 in peptides 8 and 10–12 instead of Ile12. Details on the coupling conditions are provided in Table S1, Supplementary Materials.
Scheme 1.
(A) Synthesis of the potential NTS1R PET ligands 19–23 from the amino-functionalized precursor peptides 8–12. (B) Synthesis of amino-functionalized NT(8-13) derivatives containing a fluorinated biphenyl or benzoyl moiety (25, 26, 28, 29, and 31) and preparation of the potential NTS1R PET ligands 33, 36 and 37. Reagents and conditions: (a) (1) DIPEA, solvent: DMF/NMP 75:25 or 80:20 v/v, rt, 30 min, (2) TFA/H2O 80:20 v/v, 50 °C, overnight, 72% (14), 62% (15), 75% (16), 28% (17), 93% (18), 69% (32), 78% (34), 81% (35); (b) preheating of a solution of the peptide (4 mM) in HEPES buffer (0.2 M, pH 4.2) to 60 °C, 5 min, addition of Ga(NO3)3 × H2O in 10 mM HCl, 100 °C, 10–30 min, 95% (19), >99% (20), 92% (21), 99% (22), 92% (23), 99% (33), 96% (36), 95% (37); (c) (1) DIPEA, HOBt, HBTU, solvent: DMF/NMP 80:20 v/v, rt, 60–75 min, (2) TFA/H2O 95:5 v/v, rt, 3.5 h, 46% (25), 47% (26), 24% (28), 32% (29); (d) (1) DIPEA, solvent: DMF/NMP 75:25 v/v, rt, 45 min, (2) TFA/H2O 95:5 v/v, rt, 3.5 h, 66% (31).
A reported procedure for the on-resin Nα-methylation of peptides [66], which was recently used for Nα-methylation of the carbamoylated arginine in 10 [60], was also successfully applied for Nα-methylation of the carbamoylated arginines in 11 and 12. Coupling of Fmoc amino acids to an Nα-methylated N-terminal amino acid using the standard coupling reagents HOBt, HBTU and DIPEA proved to be unfeasible; therefore, 11 was prepared by applying a combination of oxyma and DIC as activation reagents. Detailed information on the synthesis procedures and the applied coupling conditions are given in the Supplementary Materials.
Compounds 8–12 served as starting materials for the syntheses of the chelator-conjugated peptides 14–18 using the tris-tBu-protected DOTA reagent 13 for coupling to the amino-functionality of the Nω-carbamoylated arginine in 8–12. Attempts to introduce the DOTA moiety using a non-protected DOTA succinimidyl ester caused severe separation problems due to nearly identical HPLC retention times of precursor peptide and product. However, the tBu-protected intermediates could easily be separated from the remaining starting material, followed by deprotection with acid overnight and purification, yielding 14–18 with HPLC purities of >99%.
The “cold” PET ligands 19–23 were prepared by incubation of 14–18 with natural 69Ga3+ in a HEPES buffer pH 4.2 at 100 °C (Scheme 1). Complete conversion of the starting material was achieved after only 10 min. Under these conditions, the peptides proved to be stable. It should be noted that the potential PET ligands 19–23 could not be separated from the remaining respective precursor peptide (C18 RP-HPLC) when using acetonitrile and 0.04% aqueous TFA as eluent. However, baseline separation was achieved using MeOH and 0.05% formic acid as mobile phase.
For the purpose of the preparation of less polar PET ligands, peptides 10 and 12, containing a tetramethylene and a dioxaoctamethylene linker, respectively, in the amino-functionalized Nω-carbamoylated arginine, were conjugated to the fluorinated biphenyl-Ala spacer 24, yielding 25 and 26 (after subsequent Boc-deprotection), or to the fluorinated aminomethyl-benzoyl spacer 27, affording 28 and 29 (after subsequent Boc-deprotection), using HOBt, HBTU and DIPEA as coupling reagents. The side chain of the carbamoylated arginine in 26 was further elongated by treatment with succinimidyl ester 30, yielding a terminal aminohexanoyl moiety in the arginine side chain after subsequent Boc-deprotection (31).
Compounds 31, 25, and 26 were treated with 13 as described above, giving the DOTA-conjugated compounds 32, 34 and 35 after removal of protecting groups (note: 28 and 29 were not further processed by coupling to DOTA as they proved to be more polar (shorter RP-HPLC retention times) than 25, 31 and 26). Finally, 32, 34, and 35 were converted into the potential PET ligands 33, 36, and 37 by insertion of Ga3+. Unlike the synthesis of 19–23, complete conversion of the starting material was only achieved after incubation at 100 °C for 30 min (as verified by analytical HPLC).
Aiming at a PET ligand with high in vivo stability, a series of N-terminally methylated NT(8-13) derivatives was synthesized by SPPS containing various commercially available unnatural amino acids in position 12 (38–45), 13 (46 and 47), or 11 (48 and 49) (Figure 2). Whereas the unnatural amino acids incorporated in peptides 38–47 represent enantiomerically pure derivatives of Ile and Leu, the incorporation of racemic β,β-dimethyl-tyrosine (β,β-diMe-Tyr) in position 11 yielded the epimers 48 and 49 (see Figure 2). In the case of 46 and 47, a 2-ClTrt-Cl resin had to be used instead of a H-Leu-2-ClTrt resin. For the coupling of the carboxy-terminal amino acid, the 2-ClTrt-Cl resin was treated with the respective Fmoc amino acid and DIPEA in CH2Cl2 overnight. After quenching of unreacted starting material with MeOH, the loading of the resin with β-cyclopropyl-Ala (46) or α-methyl-Leu (47) was estimated to amount to 50% compared to the original loading of the resin with chloride. After side chain deprotection and cleavage from the resin, the overall-yields of 38–49 amounted to 15–74%.
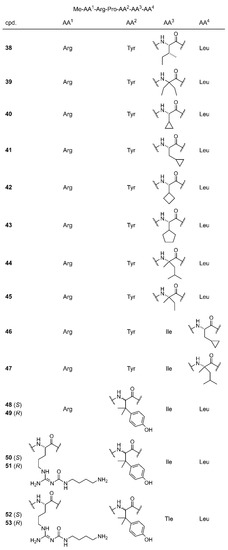
Figure 2.
Structures of the C-terminally modified NT(8-13) derivatives 38–49 and the amino-functionalized precursor compounds 50–53, representing derivatives of 48 and 49.
Replacement of the Nα-methylated Arg8 in 48 and 49 by an Nα-methylated, Nω-carbamoylated arginine derived from 6, led to peptides 50 and 51, and the additional replacement of Ile by Tle yielded 52 and 53 (Figure 2). Isolation of the epimers 50/51 and 52/53, respectively, from one batch was necessary due to the usage of the same racemic β,β-diMe-Tyr building block as described for 48 and 49.
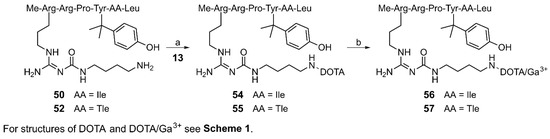
The amino-functionalized peptides 50 and 52 were treated with 13 as described above for the synthesis of 8–12 (cf. Scheme 1) to give the DOTA-conjugated compounds 54 and 55, respectively, in high yields (76% and 79%) after subsequent Boc-deprotection (Scheme 2). Insertion of Ga3+ into the chelator moiety resulted in the PET ligand candidates 56 (UR-LS130) and 57 in high yields of 97% and 91%, respectively.
Scheme 2.
Synthesis of the potential NTS1R PET ligands 56 and 57 containing a β,β-dimethylated tyrosine. Reagents and conditions: (a) (1) DIPEA, solvent: DMF/NMP 80:20 v/v, rt, 30 min, (2) TFA/H2O 80:20 v/v, 50 °C, overnight, 76% (54), 79% (55); (b) preheating of a solution of the peptide (4 mM) in HEPES buffer (0.2 M, pH 4.2) to 60 °C, 5 min, addition of Ga(NO3)3 × H2O in 10 mM HCl, 100 °C, 30 min, 97% (56), 91% (57).
3.2. Circular Dichoism (CD) Analysis
To determine the configuration at the α-carbon of the β,β-dimethylated tyrosine at position 11, we measured CD spectra of 48 and 49 and compared them to the CD spectrum of the peptide Me-Arg-Arg-Pro-Tyr-Ile-Leu [40], representing an all-l-configured reference compound with tyrosine instead of β,β-dimethylated tyrosine in position 11 as the only difference to 48 and 49 (Figure 3). To facilitate the assignment, we factorized the CD spectra into linearly independent spectral components by singular value decomposition (SVD), as described elsewhere [67]. As the three compounds differ in two properties, i.e., configuration at the α-carbon, β,β-dimethylation, or both, we expected three linear components, each contributing with a certain linear coefficient with either a positive or a negative sign. Indeed, performing the SVD on a set of nine spectra (three spectra each) resulted in three components being different from noise (cf. Figure 3B), whose reconstruction (under omission of linear components supposedly containing noise contribution only) resulted in nearly identical spectra as in Figure 3A (Figure 3C). Despite factorizing the SVD according to numerical variance and not to structural origin of spectral features, a rough assignment of the linear components was possible. Reconstruction of the spectra exclusively from spectral component 1 and the corresponding linear coefficients resulted in the spectra shown in Figure 3D. As this component represents the features with highest agreement between the three species, they are presumably associated with the backbone conformation of the peptides. In agreement with previous NMR and CD data on neurotensin in water [68], the maximum at 220 nm and the minimum at 190 nm indicate a lack of consecutive order in these peptides. After reconstruction of spectra with linear component 2, the resulting spectra for the reference compound and peptide 48 were nearly identical, whereas the spectrum reconstructed for 49 had the opposite sign. Therefore, component 2 is the one that indicates the configuration of the α-carbon, which allows assignment of the l-configuration to the β,β-dimethylated tyrosine in 48 and the d-configuration to the β,β-dimethylated tyrosine in 49. Finally, component 3 accounts for all the remaining spectral differences between the three species such as contributions from presence or absence of β,β-dimethylation. The configuration (R or S) of the emethylated tyrosine in 50–53 was assigned based on the comparison of elution orders in RP-HPLC (48, 50 and 52 elute before 49, 51 and 53, respectively).
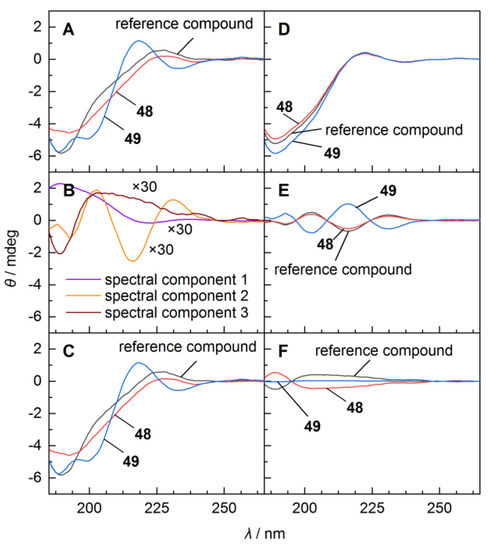
Figure 3.
Circular dichroism (CD)-based identification of the absolute configuration of the dimethylated Tyr11 in 48 and 49 through spectral deconvolution and assignment of linearly independent spectral features to stereochemical and structural properties. (A) CD spectra of the two diastereomers 48 and 49 and an all-ʟ-reference compound (Me-Arg-Arg-Pro-Tyr-Ile-Leu [40]). (B) Linearly independent components (“abstract spectra”) from SVD, shared by the two diastereomers and the reference compound (rescaled by a factor of 30 for better comparison). (C) Reconstruction of full spectra from linear combination of the “abstract spectra” in panel B. (D) Contributions of component 1 to the full spectra in A or C correlating with CD contributions from the peptide backbone minus contributions from the fourth amino acid (tyrosine in the reference compound or β,β-dimethylated tyrosine in 48 and 49). (E) Contributions of component 2 correlating with the configuration at the α-carbon of the fourth amino acid. Identical signs of the bands of this spectral component indicate the same configuration in 48 and the reference compound. (F) Contributions of component 3 accounting for spectral differences due to β,β-dimethylation that have not been considered in component 1 and component 2. As the SVD factorizes the experimental spectra with respect to highest spectral agreement, i.e., a ‘compromise’ spectrum formed from the spectra of the reference compound, 48 and 49, absence of β,β-dimethylation in the reference compound is reflected by a negative contribution of component 3.
3.3. Peptide Stability in Human Plasma
The stability of compounds 8, 9, 11, 12, 14–23, 38–49, and 54–57 against proteolytic degradation was investigated in human plasma for up to 48 h as previously described [40]. For compounds 1–3 [40], 19–23, 56, and 57, the amount of remaining intact peptide after incubation in plasma at 37 °C is shown in Table 2 (for plasma stability data of compounds 8–12, 14–18, 38–49, 54 and 55 (Table S3) and recovery ratios of compounds 8, 9, 11, 12, 14–23, and 54–57 (Table S2) see Supplementary Materials.
Table 2.
NTS1R affinities of 1–3, 19–23, 33, 36, 37, 56, and 57, NTS2R affinities of 1, 3, 19–22 and 56, NTS1R selectivities of 1, 3, 19–22 and 56, and in vitro plasma stabilities of 1–3, 19–23, 56, and 57, determined at 37 °C.
The Nα-unmethylated peptides 1 and 2 were reported to undergo very rapid degradation in plasma [40,43]. Therefore, N-terminal methylation or methylation of Arg9, both impairing NTS1R binding only to a minor extent [40], was applied to the synthesized peptides throughout.
In the initial set of prepared peptides (8, 9, 11, 12, and 14–23) low stability in plasma (≤15% intact peptide after 24 h) was found for compounds containing Ile in position 12 (9, 15 and 20), confirming the importance of Tle12 for the stabilization of the C-terminus against proteolytic degradation. Compounds with Tle12, devoid of a Ga3+-occupied chelator (8, 10–12, 14, and 16–18), showed a high stability towards proteolytic degradation (≥93% intact peptide after 24 h). However, insertion of Ga3+ (19 and 21–23) led to a considerable decrease in stability (≤46% intact peptide after 24 h, Table 2). This observation can be explained by changes in compound structure, hydrophilicity and charge distribution upon insertion of the gallium cation and rearrangement of the carboxylic arms of the chelators, thereby facilitating the recognition by proteases.
In the final set of compounds (38–57), high plasma stabilities (≥91% intact peptide after 24 h) were found for peptides 39, 44, 48, and 49, as well as for the labeling precursors 54 and 55, the latter even showing >99% intact peptide after 48 h. Strikingly, peptides 48, 49 and 54 do not comprise Tle but Ile in position 12. Therefore, the stabilizing effect must result from the diMe-Tyr in position 11. Insertion of Ga3+ in 54 and 55 (giving 56 and 57) again provoked a substantial decrease in stability towards proteolytic degradation, nonetheless, the plasma half-lives of 56 and 57 were higher than those of the potential PET ligands 19–23 (cf. Table 2).
3.4. In Vitro Binding Studies at the NTS1R and NTS2R and NTS1R Agonistic Activities
Except for compounds 28 and 29, NTS1R affinities were determined for all synthesized peptides (8, 9, 11, 12, 14–23, 25, 26, 32–50, 52, and 54–57) in a radiochemical competition binding assay using intact HT-29 colon carcinoma cells expressing the hNTS1R [69], but not the NTS2R [39]. The previously described radioligand [3H]UR-MK300 [39] (structure see Figure S1, Supplementary Materials) was used as radioligand. Selected compounds (1, 3, 8–11, 14–17, 19–22, 48–53, and 56) were also investigated with respect to NTS2R binding using the same radioligand and HEK293T cells stably expressing the hNTS2R. The obtained Ki values are presented in Table 2 and Table S3 (Supplementary Materials). The Ile-containing peptides 9, 15, 20, 50, 54 and 56 yielded lower Ki values (NTS1R) than their respective Tle-containing analogs 8, 14, 19, 52, 55 and 57, confirming the described affinity-decreasing effect of the Ile12/Tle12 exchange in NT(8-13) analogs [14,40,50,52,54,70,71]. Ga3+-containing DOTA-conjugated peptides consistently showed slightly higher NTS1 and NTS2 receptor affinities compared to the respective precursor compounds with an empty DOTA chelator (cf. Table 2 and Table S3, Supplementary Materials). In terms of NTS1R binding, the effect was most pronounced for the compound pairs 32/33 and 54/56 (4.8-fold and 4.9-fold increase in affinity upon insertion of Ga3+). This phenomenon is in agreement with reported findings for DOTA- and (1,4,7-triazacyclononane-4,7-diyl)diacetic acid-1-glutaric acid (NODA-GA)-conjugated 68Ga-labeled NTS1R ligands [16,42], which were explained by changes in ligand structure as discussed above for the reduced plasma stabilities of the Ga3+-containing peptides [16,42].
The difference with respect to the linker in the side chain of the Nω-carbamoylated arginines of compounds 10 and 12 did not affect NTS1R receptor affinity (Ki = 2.8 and 2.7 nM, respectively), but the change in the position of the Nα-methylated and Nω-carbamoylated arginine (position 8 in 10, position 9 in 11) led to a slight decrease in NTS1R affinity from Ki = 2.8 nM (10) to 13 nM (11). The latter finding is in agreement with reports on the higher importance of Arg9 for NTS1R binding compared to Arg8 [41,72,73].
The initially prepared set of PET ligand candidates with Tle in position 12 (19 and 21–23) exhibited Ki values (NTS1R) in the range of 7.5–20 nM. The second set of potential PET ligands (33, 36, and 37), containing a lipophilic fluorinated biphenyl moiety, showed higher NTS1R affinities with Ki values of 2.5–4.2 nM. The position and the type of carbamoylated arginine played only a minor role in terms of NTS1R binding for the potential PET ligands and their precursors. Within the final set of potential PET ligands (56 and 57), containing S-configured β,β-diMe-Tyr in position 11, the peptide with Ile in position 12 (56) displayed excellent NTS1R binding (Ki = 1.2 nM), while its congener 57, containing Tle in position 12, showed 18-fold lower NTS1R affinity (Ki = 21 nM).
The series of NT(8–13) derivatives containing various unnatural amino acids in position 11, 12 or 13 (38–49) was prepared to develop a PET ligand with improved in vivo stability. As the side chains of Ile12 and Leu13 in 1 were hypothesized to contribute to receptor binding via hydrophobic interactions with aliphatic residues in the binding pocket of the NTS1R [73,74], hydrophobic unnatural amino acids structurally related to Ile and Leu, were incorporated in position 12 or 13 (38–47, cf. Figure 2). The artificial amino acids were quite well tolerated with respect to NTS1R binding, provided that they contained no additional alkyl substituent at the α-carbon (38, 40–43, and 46). The incorporation of amino acids with an additional alkyl group (methyl, ethyl) at the α-carbon resulted in a loss of NTS1R binding (Table S3, Supplementary Materials). Strikingly, sub-nanomolar NTS1R affinity (Ki = 0.14 nM) was achieved with compound 48, containing S-configured β,β-diMe-Tyr11 instead of Tyr11. As 48 showed also excellent in vitro plasma stability (see Table S3, Supplementary Materials), it served as a lead structure for the synthesis of the PET ligand candidates 56 and 57. The epimer of 48 (peptide 49), containing R-configured β,β-diMe-Tyr11, displayed considerably lower NTS1R binding compared to 48. This was in agreement with the results of variations in position 11 of 1, including the incorporation of d-configured tyrosine derivatives, revealing that d-configured tyrosine analogs caused a decrease in NTS1R binding [40,71,75,76,77].
All compounds that were investigated at the NTS2R showed lower Ki values at the NTS1R than at the NTS2R (difference most pronounced for peptide 15: Ki values of 2.4 and 55 nM, respectively) revealing moderate NTS1R selectivity (Table 2). However, it is unlikely that low or missing NTS1R selectivity hampers the imaging of NTS1R-expressing tumors in the periphery, as the NTS2R is primarily expressed in the central nervous system [78,79,80].
In addition to the investigation of NTS1R and NTS2R binding, the agonistic activities of 21 and 56 at the Gq-coupled NTS1R were determined in a Fura-2 Ca2+-assay using HT-29 colon carcinoma cells. The potential PET ligands 21 and 56 proved to be full agonists with maximal responses comparable to that of 1 (see Figure S6, Supplementary Materials). As also found for 1, the NTS1R agonistic potencies of 21 and 56 were lower compared to their NTS1R binding affinities (cf. Table 2 and Figure S6). A plausible explanation for this observation is in the non-equilibrium conditions in the case of the functional Ca2+-assay precluding a complete association of the agonist to the receptor (signal is recorded within 3 min after agonist addition), which must be compensated by higher agonist concentrations.
3.5. Radiosynthesis and Distribution Coefficients
The potential PET tracers 21, 33, 37 and 56 all showed high NTS1R affinity and high in vitro plasma stability. Thus, radiolabeling with 68Ga3+ was performed to prepare the respective PET tracers, i.e., [68Ga]21, [68Ga]33, [68Ga]37 and [68Ga]56. This selection included two highly polar PET ligands ([68Ga]21, [68Ga]56) and two ligands bearing a lipophilic spacer ([68Ga]33, [68Ga]37), which can possibly result in different pharmacokinetic properties.
Radiosynthesis was performed by incubation of the precursor compounds 16, 32, 35 or 54 (7.5–15 nmol) in HEPES buffer pH 5.5 with [68Ga]GaCl3 at 125 °C for 6 or 16 min (for details see Table 1). After the synthesis, the PET tracers were separated from the respective precursor using an analytical HPLC system in order to increase specific activity and to obtain a homogenous tracer preparation. The isolation from the precursors was feasible on a C18 reversed-phase material with mixtures of MeOH and 0.1% formic acid as mobile phase (comparable conditions as used for the purification of the “cold” PET ligands). For an exemplary chromatogram of the micro-preparative HPLC see Figure S7 (Supplementary Materials). Radiosynthesis and evaporation of the solvent was accomplished in approximately 90 min, and the separation of the PET tracer from the precursor including the second evaporation step took approximately another 50–60 min.
3.6. Biodistribution of PET Ligands [68Ga]21, [68Ga]33, [68Ga]37 and [68Ga]56, and Cellular Uptake of [68Ga]56
The hydrophilicity values of the PET ligands [68Ga]21, [68Ga]33, [68Ga]37 and [68Ga]56 were evaluated by the determination of the n-octanol/PBS distribution coefficients logD7.4, which amounted to −3.87, −2.48, −2.59 and −3.06, respectively. Notably, compared to the most polar PET ligand ([68Ga]21), the introduction of a lipophilic spacer ([68Ga]33, [68Ga]37) only led to an increase in logD7.4 by less than 1.4 log units.
Biodistribution studies in HT-29 tumor-bearing nude mice were firstly performed with [68Ga]21 and resulted in a tumor-to-muscle ratio of 9.5 at 45 min after injection of the tracer (cf. Figure S8 and Table S4, Supplementary Materials). This result was comparable with the data reported for studies of the 68Ga-labeled NTS1R PET ligands [68Ga]4 [41] and [68Ga]5 [42] in the same xenograft mouse model (tumor-to-muscle ratios 60 min p.i.; approximately 14 and 8.8, respectively). As the fast renal elimination of [68Ga]21 potentially compromises its accumulation in the tumor, a second attempt with the less hydrophilic tracers [68Ga]33 and [68Ga]37, potentially exhibiting longer systemic circulation, which could, in turn, result in an increased tumor uptake, was made. Although the introduction of the hydrophobic spacer in [68Ga]33 and [68Ga]37 had a marked impact on the predominant way of tracer elimination (shift from renal to nearly balanced renal and hepatobiliary excretion, cf. Figure 4A), tumor-to-muscle ratios 45 min p.i. (4.1 ([68Ga]33) and 3.4 ([68Ga]37)) were diminished even in comparison to [68Ga]21 (cf. Figure S8 and Table S4, Supplementary Materials). These results show that shifting the elimination pathway towards hepatobiliary excretion by decreasing the hydrophilicity of the tracer does not warrant an enhanced accumulation in the tumor, which might be explained by retained fast elimination despite an altered route of excretion. Irrespective of their different physicochemical properties, [68Ga]21, [68Ga]33 or [68Ga]37 showed low in vivo stability, as concluded from HPLC analyses of urine samples revealing that intact [68Ga]21, [68Ga]33 or [68Ga]37 accounted for less than 6% of the radioactivity in urine 45 min after tracer injection (Figure S9, Supplementary Materials). Notably, for these tracers, only one main metabolite was found in the urine samples, being more polar than the respective intact tracer.
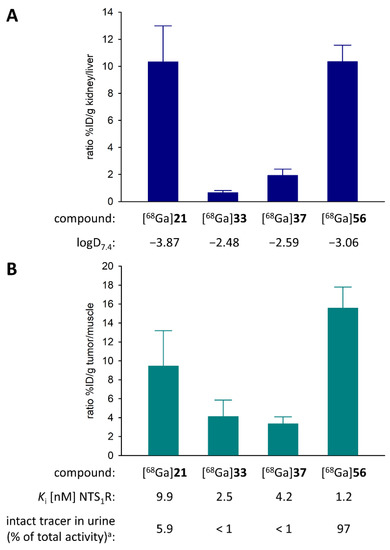
Figure 4.
Ratio of the %ID/g values of (A) kidney and liver and of (B) tumor and muscle, obtained from biodistribution experiments with [68Ga]21, [68Ga]33, [68Ga]37 and [68Ga]56 in HT-29 tumor-bearing mice. Given are mean values ± SD from three ([68Ga]33, [68Ga]37) or four ([68Ga]21, [68Ga]56) independent experiments. a Given is the relative area (as percentage of the total peak area) of the peak corresponding to the intact PET ligand in the radiochromatogram of the HPLC analysis of the urine sample obtained 45 min after injection of the tracer.
Prompted by these findings, the focus was set on the development of NT(8-13) derived PET tracers with higher proteolytic stability, as a low in vivo stability of the tracers could also be a major reason (other than fast elimination) for the low tracer accumulation in the tumor. The preparation and in vitro characterization of peptides 38–49 brought forth the potential PET tracer 56 exhibiting high NTS1R affinity (Ki = 1.2 nM) and high in vitro plasma stability (Table 2). The biodistribution of [68Ga]56 in HT-29 tumor-bearing nude mice was investigated at 10, 25, and 45 min p.i. (Figure 5 and Table 3). Blocking experiments were performed for the time of highest tumor-uptake (45 min p.i.). At 10 min after injection of [68Ga]56, the major fraction of activity was found in the kidneys (47% ID/g), remaining at this level over time (47% ID/g and 55% ID/g after 25 min and 45 min, respectively). The activity in the liver was much lower (7.2, 5.7 and 5.2% ID/g after 10, 25 and 45 min, respectively), indicating predominant renal excretion of [68Ga]56, which was expected for this highly hydrophilic tracer (Table 3, Figure 4A). The activity in the blood dropped from 3.1% ID/g (10 min p.i.) to 1.3% ID/g (45 min p.i.), while it increased in the tumor from 3.6% ID/g (10 min) over 7.3% ID/g (25 min) to 8.4% ID/g (45 min). Tumor-to-muscle ratios increased over time (3.3 at 10 min p.i. and 13 at 25 min p.i.), reaching a value of 16 after 45 min, which was considerably higher than the tumor-to-muscle ratios of [68Ga]21, [68Ga]33 and [68Ga]37 at 45 min p.i. (Table 3 and Table S4, Supplementary Materials). Co-injection of the non-labeled compound 48 with [68Ga]56 (blocking experiments) resulted in a tumor-to-muscle ratio of 1.8 (45 min p.i.), indicating that the uptake of [68Ga]56 in the tumor was NTS1R-mediated. To evaluate the in vivo stability of [68Ga]56, HPLC analyses of urine samples obtained 10 min and 45 min after tracer injection were performed, revealing that, in contrast to [68Ga]21, [68Ga]33 and [68Ga]37, intact [68Ga]56 accounted for more than 80% of the activity in urine (cf. Figure S11B and Figure S10, Supplementary Materials). The high in vivo stability of [68Ga]56, which obviously contributes to an increased tracer accumulation in the tumor, was confirmed by HPLC analysis of an ex vivo blood plasma sample at 10 min p.i. showing that intact [68Ga]56 (identity confirmed by spiking of the plasma sample with 56) accounted for more than 80% of the radioactivity in the processed sample (cf. Figure S11C–E, Supplementary Materials).
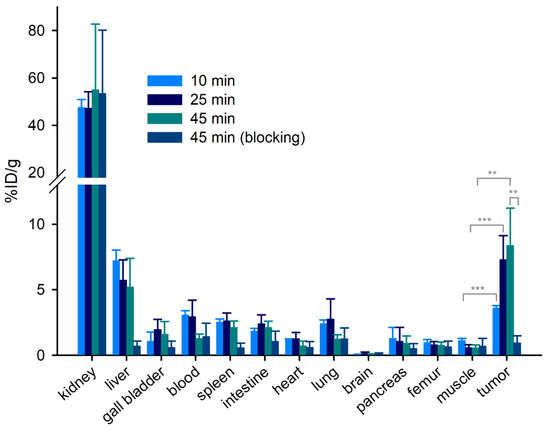
Figure 5.
Biodistribution data (%ID/g tissue) of [68Ga]56 obtained from HT-29 tumor-bearing mice. Given are mean values ± SD (n = 4). Blocking data were obtained by co-injection of 48 (560–700 nmol/mouse). Statistical analysis of differences between tracer accumulation in the tumor of unblocked and blocked animals was performed by an unpaired two-tailed t-test (p <0.05 was considered statistically significant). ** p <0.01. *** p <0.001.
Table 3.
Ex vivo biodistribution data and tumor-to-muscle ratios of [68Ga]56 obtained from HT-29 tumor-bearing mice a.
In reported studies, the 111In-labeled analog of compound 4 was investigated in terms of in vivo stability 15 min after injection in mice, revealing 22% of remaining intact tracer in the plasma sample [41]. The 68Ga-labeled analog of 5, investigated in vitro in human serum, gave 93% intact tracer after 60 min of incubation [42]. In vivo studies in mice with a 68Ga-labeled tracer structurally closely related to 5, showing low NTS1R affinity (Ki = 180 nM), resulted in 90% intact tracer in blood plasma 10 min after tracer administration [16]. Noteworthy, a recently reported 18F-labeled fluoroglycosylated NTS1R PET ligand derived from 10, containing the same peptide core structure as [68Ga]21, [68Ga]33 and [68Ga]37, exhibited low in vivo stability in mice (30% of remaining intact tracer in plasma 10 min p.i., and no detectable tracer in plasma 20 min p.i.) [60]. Consequently, the high in vivo stability accomplished with [68Ga]56 in combination with retained high NTS1R affinity, represents an important achievement in the field of peptidic NTS1R PET ligands.
To estimate the internalization rate of NTS1 receptors occupied by [68Ga]56, HT-29 tumor cells were incubated with [68Ga]56 at 37 °C for up to 75 min followed by removal of extracellularly bound peptidic receptor ligand using the acid-trip method. This experiment showed that the fraction of internalized tracer was >80% after only 5 min of incubation, reaching a plateau of approximately 95% after 55 min (Figure 6). This feature is considered favorable with respect to an accumulation of the tracer in the tumor in vivo, particularly when it comes to therapeutic applications using, e.g., alpha-emitting tracers such as 225Ac-labeled radiopharmaceuticals.
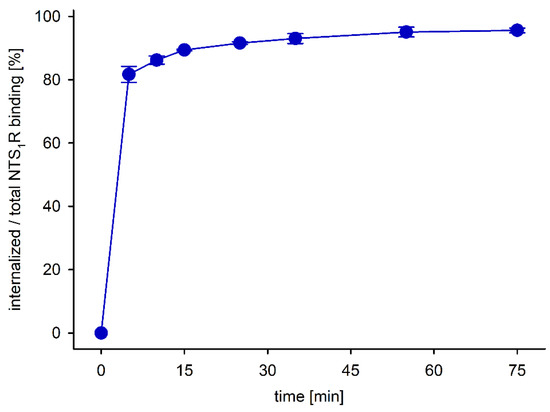
Figure 6.
Fraction of specifically bound and internalized [68Ga]56 in HT-29 cells relative to the entire specific binding determined at 37 °C. Given are mean values ± SD of two independent experiments, each performed in triplicate.
3.7. PET/CT Imaging with [68Ga]56
Dynamic PET scans of HT-29 tumor-bearing nude mice injected with [68Ga]56 were performed for 45 min. Notably, a PET/CT scanner (Siemens Biograph mCT-S(40)) for clinical routine tumor diagnostics in patients was used for these studies. It was shown previously that this instrument is applicable for imaging of small animals with sufficiently large tumor implants [65,81]. Blocking experiments were carried out by co-injection of an excess of the NTS1R ligand 48. Time-activity-curves (TACs) for the tumor and muscle (from non-blocking and blocking experiments) as well as for the kidneys, generated from the SUVs acquired for the respective ROIs, are depicted in Figure 7A,B. These data confirmed the results from the biodistribution studies with [68Ga]56: the tracer uptake in the tumor increased over time and the activity level in the kidneys reached a plateau after approximately 10 min. Thus, tumor-to-muscle ratios, determined from the SUVs (cf. inset table in Figure 7A), were comparable with the tumor-to-muscle ratios obtained from biodistribution studies. The blocking experiments confirmed the specific (NTS1R-mediated) uptake of [68Ga]56 in the tumor (Figure 7A). Representative PET images of tumor-bearing mice injected with [68Ga]56 alone or with [68Ga]56 and an excess of 48 are shown in Figure 7C. Accumulation of the tracer in the tumor was clearly visible.
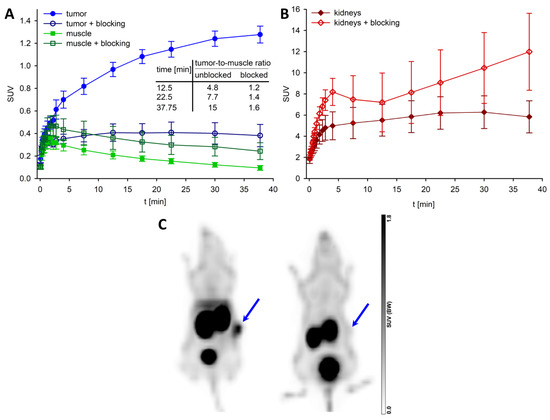
Figure 7.
TACs and representative PET images from studies with [68Ga]56 in HT-29 tumor-bearing mice. (A) SUVmean ± SD (n = 4) from 45 min-PET scans for the tumor (circles) and muscle (squares), and tumor-to-muscle ratios for selected times calculated based on the SUV values (inset table). Blocking data were obtained by co-injection of 48 (560–700 nmol/mouse). (B) SUVmean ± SD (n = 4) for the kidneys (same PET scans as under (A)). (C) Maximum intensity projections of two representative PET images of HT-29 tumor-bearing mice after injection of [68Ga]56 (left) or co-injection of [68Ga]56 and 48 (right) (time frame: 10–45 min p.i.). The blue arrows indicate the tumors.
4. Conclusions
We herein describe the preparation, analysis and biological characterization of a series of peptidic PET tracer candidates, which led to the discovery of the DOTA(Ga3+)-conjugated NTS1R ligand UR-LS130 (56) showing high stability in human plasma (t1/2 >24 h) and higher NTS1R affinity (Ki = 1.2 nM) compared to previously reported NTS1R PET ligands with high in vitro plasma stability. A novel feature of this Ga3+-containing peptidic PET ligand is the attachment of the chelator via the side chain of an arginine. [68Ga]56 displayed high in vivo stability and a clear accumulation in NTS1R-expressing HT-29 tumors. Notably, 56 contains no Tle, but Ile in position 12, like endogenous neurotensin. Instead, 56 contains a β,β-diMe-Tyr in position 11, leading to excellent stability in vitro and in vivo. To date, replacement of Ile12 by Tle12 is the state of the art to achieve proteolytic stabilization of the C-terminus of NT(8-13) derived PET tracers. However, in the present study, we show that the Ile12/Tle12 exchange can be insufficient to achieve high in vivo stability. Unlike the Ile12/Tle12 exchange, which affects NTS1R binding, the recently introduced alternative based on the exchange of Leu13 by trimethylsilylalanine proved to be beneficial with respect to NTS1R binding, but turned out to be less favorable than the Tle12-approach regarding proteolytic stability [38]. In contrast, the new diMe-Tyr11-approach combines retained NTS1R affinity and high tracer stability. Taking into consideration the reported impact of the metal ion chelator on a tracer’s biodistribution profile and accumulation in the tumor [37,82], further improvement of the tracer [68Ga]56 could be undertaken by conjugation to a chelator different from DOTA. With [68Ga]56 we present the first peptidic NTS1R PET ligand with high in vivo stability exhibiting comparable NTS1R affinity as reported 177Lu-labeled NTS1R antagonists [83,84], which are favored over peptides for tumor endoradiotherapy due to higher in vivo stability [85]. Thus, the achievements of this work could promote the development of NT(8-13)-derived radiotherapeutics for cancer treatment, as an alternative to 177Lu-labeled NTS1R antagonists.
Supplementary Materials
The following supporting information can be downloaded at: https://www.mdpi.com/article/10.3390/cancers14194922/s1; Figure S1: Structure of the tritium-labeled NT(8-13)-derived radioligand [3H]UR-MK300 used for NTS1R and NTS2R binding studies; Figure S2: Representative saturation isotherms and unspecific binding curves from experiments with two batches of [3H]UR-MK300 at HEK293T-hNTS2R cells, giving Kd values of (A) 6.9 ± 1.8 nM (mean value ± SD from six independent determinations, each performed in triplicate) and (B) 4.0 ± 1.5 nM (mean value ± SD from three independent determinations, each performed in triplicate); Figure S3: Radioligand displacement curves from competition binding experiments with [3H]UR-MK300 (Kd = 0.55 nM or 0.41 nM, c = 1 nM) and 8, 9, 11, 12, 14-23, 25, 26 and 32-37 at intact hNTS1R-expressing HT-29 cells. Amino-functionalized precursor peptides are represented by circles, DOTA-conjugated peptides are represented by triangles, and Ga3+-containing compounds are represented by squares. Data represent mean values ± SD from at least two independent experiments (performed in triplicate); Figure S4: Radioligand displacement curves from competition binding experiments with [3H]UR-MK300 (Kd = 0.41 nM, c = 1 nM) and 38-50, 52 and 54-57 at intact hNTS1R-expressing HT-29 cells. Amino-functionalized precursor peptides are represented by circles, DOTA-conjugated peptides are represented by triangles, and Ga3+-containing compounds are represented by squares. Data represent mean values ± SD from at least two independent experiments (performed in triplicate); Figure S5: Radioligand displacement curves from competition binding experiments with [3H]UR-MK300 (Kd = 6.9 nM or 4.0 nM, c = 10 nM) and 1, 3, 8-11, 14-17, 19-22, 48-53 or 56 at intact HEK293T-hNTS2R cells. Reference compounds and amino-functionalized precursor peptides are represented by circles, DOTA-conjugated peptides are represented by triangles, and Ga3+-containing compounds are represented by squares. Data represent mean values ± SD from at least two independent experiments (performed in triplicate); Figure S6: Concentration response curves and agonistic potencies (pEC50, EC50) of 1, 21 and 56 from fura-2 Ca2+-assays using intact hNTS1R-expressing HT-29 cells. Data represent mean values ± SD from three or four independent experiments (performed in singlet); Figure S7: Chromatogram of the RP-HPLC analysis of a mixture of the labeling precursor 32 and the "cold" PET ligand 33 (50 µM each, injection volume 75 µL) (black line), and chromatogram of the preparative HPLC run for the separation of the PET tracer [68Ga]33 from 32 after radiosynthesis (blue line). The vertical blue lines give the beginning and the end of tracer collection; Figure S8: Biodistribution data (%ID/g tissue) of [68Ga]21, [68Ga]33 and [68Ga]37 from HT-29 tumor bearing mice. Given are mean values ± SD (n = 3 ([68Ga]33, [68Ga]37) or n = 4 ([68Ga]21)) gained at 45 min p.i; Figure S9: Representative chromatograms of the RP-HPLC quality controls of the PET tracers [68Ga]21 (A), [68Ga]33 (B) and [68Ga]37 (C) after radiosynthesis (black lines) and of the RP-HPLC analyses of urine samples obtained from mice 45 min after injection of the respective PET tracers; Figure S10: RP-HPLC analysis of an ex vivo urine sample from a mouse 45 min after injection of [68Ga]56, spiked with 56 (100 µM). The blue line shows radiodetection and the black line shows UV detection at 220 nm; Figure S11: Chromatograms of the RP-HPLC analyses of different samples of [68Ga]56 using radio- or UV-detection. (A) quality control after radiosynthesis; (B) ex vivo urine sample obtained from a mouse 10 min after injection of [68Ga]56; (C) ex vivo plasma sample (10 min p.i.) from the same mouse as under B; (D) UV-detection of the analysis from C; (E) plasma sample from C and D spiked with 56 (100 µM); Table S1: Equivalents and conditions applied for SPPS; Table S2: Recoveries of peptides 8, 9, 11, 12, 14-23 and 54-57 from human plasma/PBS (1:2 v/v) and ratios of peptide-recovery over recovery of IS; Table S3: NTS1R affinities of 8-12, 14-18, 25, 26, 32, 34, 35, 38-50, 52, 54 and 55, NTS2R affinities of 8-11, 14-17 and 48-53, NTS1R selectivities of 8-11, 14-17, 48-50 and 52, and in vitro plasma stabilities of 8-12, 14-18, 38-49, 54 and 55, determined at 37 °C; Table S4: Ex vivo biodistribution data and tumor-to-muscle ratios of [68Ga]21, [68Ga]33 and [68Ga]37; Synthesis protocols and analytical data of compounds 8, 9, 11, 12, 14–23, 25, 26, 28, 29 and 31–57; RP-HPLC chromatograms of compounds 8, 9, 11, 12, 14–23, 25, 26, 28, 29 and 31–57; 1H-NMR spectra of compounds 8, 9, 11, 12, 14–23, 25, 26, 28, 29 and 32–57, and 13C-NMR spectra of compounds 50 and 51.
Author Contributions
Conceptualization, L.S., G.B., D.H., and M.K.; methodology, L.S., J.M., D.S., T.S., S.L., D.H., and M.K.; validation, L.S., D.S., F.H., J.P., D.H., and M.K.; formal analysis, L.S., D.S., S.L., F.H., S.M., D.H., and M.K.; investigation, L.S., J.M., D.S., T.S., L.G., S.L., B.E., and M.K.; resources, L.S., J.P., D.H., and M.K.; data curation, L.S., D.S., F.H., S.M., D.H., and M.K.; writing—original draft preparation, L.S., D.S., L.G., S.L., F.H., D.H., and M.K.; writing—review and editing, L.S., J.M., D.S., T.S., L.G., S.L., F.H., S.M., B.E., G.B., J.P., D.H., and M.K.; supervision, T.S., B.E., G.B., J.P., D.H., and M.K.; project administration, D.H. and M.K.; funding acquisition, D.H. and M.K. All authors have read and agreed to the published version of the manuscript.
Funding
This research was funded by Deutsche Forschungsgemeinschaft (Research Grants KE 1857/1-2 and KE 1857/1-3).
Institutional Review Board Statement
The animal study protocol was approved by the Regierung von Unterfranken, Bavaria, Germany (approval no. RUF 55.2.2-2532.2-761-22, 7 February 2019).
Informed Consent Statement
Not applicable.
Data Availability Statement
The data presented in this study are available in this article.
Acknowledgments
The authors thank Franz Wiesenmayer, Anja Wege, Maria Beer-Krön, Brigitte Wenzl, and Susanne Bollwein for excellent technical assistance with animal studies, cell culture and binding assays. We greatly acknowledge the help of Emina Cokljat with CD measurements, and Michael Müller for providing the equipment for CD-measurements. The authors are grateful to Ernst Fuchs, Laura Berschneider, Verena Schmitzer, Marina Geigenfeind, and Lukas Reimer for excellent technical assistance with PET/CT imaging. This work was funded by the Deutsche Forschungsgemeinschaft (DFG) (research grants KE 1857/1-2 and KE 1857/1-3), and additionally supported by the DFG Research training group GRK1910.
Conflicts of Interest
The authors declare no conflict of interest.
References
- Bugni, J.M.; Pothoulakis, C. Neurotensin. In Handbook of Biologically Active Peptides (Section XIII: Gastrointestinal Peptides), 2nd ed.; Kastin, A.J., Ed.; Academic Press: Cambridge, MA, USA, 2013; pp. 1265–1270. [Google Scholar]
- St-Gelais, F.; Jomphe, C.; Trudeau, L.E. The role of neurotensin in central nervous system pathophysiology: What is the evi-dence? J. Psychiatry Neurosci. 2006, 31, 229–245. [Google Scholar] [PubMed]
- Mazella, J.; Vincent, J.-P. Functional roles of the NTS2 and NTS3 receptors. Peptides 2006, 27, 2469–2475. [Google Scholar] [CrossRef]
- Boules, M.; Li, Z.; Smith, K.; Fredrickson, P.; Richelson, E. Diverse Roles of Neurotensin Agonists in the Central Nervous System. Front. Endocrinol. 2013, 4, 36. [Google Scholar] [CrossRef]
- Xiao, Z.Y.; Cilz, N.I.; Kurada, L.; Hu, B.Q.; Yang, C.X.; Wada, E.; Combs, C.K.; Porter, J.E.; Lesage, F.; Lei, S.B. Activation of Neurotensin Receptor 1 Facilitates Neuronal Excitability and Spatial Learning and Memory in the Entorhinal Cortex: Beneficial Actions in an Alzheimer’s Disease Model. J. Neurosci. 2014, 34, 7027–7042. [Google Scholar] [CrossRef] [PubMed]
- Schroeder, L.E.; Leinninger, G.M. Role of central neurotensin in regulating feeding: Implications for the development and treatment of body weight disorders. Biochim. Biophys. Acta (BBA) Mol. Basis Dis. 2018, 1864, 900–916. [Google Scholar] [CrossRef] [PubMed]
- Sarret, P.; Cavelier, F. Neurotensin and its receptors. In Reference Module in Neuroscience and Biobehavioral Psychology; Elsevier: Amsterdam, The Netherlands, 2017. [Google Scholar]
- Maoret, J.J.; Pospai, D.; Rouyerfessard, C.; Couvineau, A.; Laboisse, C.; Voisin, T.; Laburthe, M. Neurotensin Receptor and Its mRNA Are Expressed in Many Human Colon Cancer Cell Lines but Not in Normal Colonic Epithelium: Binding Studies and RT-PCR Experiments. Biochem. Biophys. Res. Commun. 1994, 203, 465–471. [Google Scholar] [CrossRef]
- Reubi, J.C.; Waser, B.; Friess, H.; Buchler, M.; Laissue, J. Neurotensin receptors: A new marker for human ductal pancreatic adenocarcinoma. Gut 1998, 42, 546–550. [Google Scholar] [CrossRef]
- Souazé, F.; Dupouy, S.; Viardot-Foucault, V.; Bruyneel, E.; Attoub, S.; Gespach, C.; Gompel, A.; Forgez, P. Expression of Neurotensin and NT1 Receptor in Human Breast Cancer: A Potential Role in Tumor Progression. Cancer Res. 2006, 66, 6243–6249. [Google Scholar] [CrossRef]
- Carraway, R.; Leeman, S.E. The amino acid sequence of a hypothalamic peptide, neurotensin. J. Biol. Chem. 1975, 250, 1907–1911. [Google Scholar] [CrossRef]
- Tyler, B.M.; Douglas, C.L.; Fauq, A.; Pang, Y.-P.; Stewart, J.A.; Cusack, B.; McCormick, D.J.; Richelson, E. In vitro binding and CNS effects of novel neurotensin agonists that cross the blood–brain barrier. Neuropharmacology 1999, 38, 1027–1034. [Google Scholar] [CrossRef]
- Vincent, J.-P.; Mazella, J.; Kitabgi, P. Neurotensin and neurotensin receptors. Trends Pharmacol. Sci. 1999, 20, 302–309. [Google Scholar] [CrossRef]
- Bergmann, R.; Scheunemann, M.; Heichert, C.; Mäding, P.; Wittrisch, H.; Kretzschmar, M.; Rodig, H.; Tourwé, D.; Iterbeke, K.; Chavatte, K.; et al. Biodistribution and catabolism of 18F-labeled neurotensin (8–13) analogs. Nucl. Med. Biol. 2002, 29, 61–72. [Google Scholar] [CrossRef]
- García-Garayoa, E.; Bläuenstein, P.; Blanc, A.; Maes, V.; Tourwé, D.; Schubiger, P.A. A stable neurotensin-based radiopharmaceutical for targeted imaging and therapy of neurotensin receptor-positive tumours. Eur. J. Pediatr. 2008, 36, 37–47. [Google Scholar] [CrossRef]
- Maschauer, S.; Einsiedel, J.; Hocke, C.; Hübner, H.; Kuwert, T.; Gmeiner, P.; Prante, O. Synthesis of a 68Ga-Labeled Peptoid−Peptide Hybrid for Imaging of Neurotensin Receptor Expression in Vivo. ACS Med. Chem. Lett. 2010, 1, 224–228. [Google Scholar] [CrossRef]
- Maschauer, S.; Einsiedel, J.; Haubner, R.; Hocke, C.; Ocker, M.; Hübner, H.; Kuwert, T.; Gmeiner, P.; Prante, O. Labeling and Glycosylation of Peptides Using Click Chemistry: A General Approach to 18F-Glycopeptides as Effective Imaging Probes for Positron Emission Tomography. Angew. Chem. Int. Ed. 2009, 49, 976–979. [Google Scholar] [CrossRef] [PubMed]
- Maschauer, S.; Ruckdeschel, T.; Tripal, P.; Haubner, R.; Einsiedel, J.; Hübner, H.; Gmeiner, P.; Kuwert, T.; Prante, O. In Vivo Monitoring of the Antiangiogenic Effect of Neurotensin Receptor-Mediated Radiotherapy by Small-Animal Positron Emission Tomography: A Pilot Study. Pharmaceuticals 2014, 7, 464–481. [Google Scholar] [CrossRef]
- Jia, Y.; Shi, W.; Zhou, Z.; Wagh, N.K.; Fan, W.; Brusnahan, S.K.; Garrison, J.C. Evaluation of DOTA-chelated neurotensin analogs with spacer-enhanced biological performance for neurotensin-receptor-1-positive tumor targeting. Nucl. Med. Biol. 2015, 42, 816–823. [Google Scholar] [CrossRef]
- Deng, H.; Wang, H.; Zhang, H.; Wang, M.; Giglio, B.; Ma, X.; Jiang, G.; Yuan, H.; Wu, Z.; Li, Z. Imaging Neurotensin Receptor in Prostate Cancer With 64Cu-Labeled Neurotensin Analogs. Mol. Imaging 2017, 16, 1536012117711369. [Google Scholar] [CrossRef] [PubMed]
- Mankoff, D.A.; Link, J.M.; Linden, H.M.; Sundararajan, L.; Krohn, K.A. Tumor Receptor Imaging. J. Nucl. Med. 2008, 49 (Suppl. 2), 149S–163S. [Google Scholar] [CrossRef] [PubMed]
- Correia, J.D.G.; Paulo, A.; Raposinho, P.D.; Santos, I. Radiometallated peptides for molecular imaging and targeted therapy. Dalton Trans. 2011, 40, 6144–6167. [Google Scholar] [CrossRef]
- Morgat, C.; Mishra, A.K.; Varshney, R.; Allard, M.; Fernandez, P.; Hindié, E. Targeting Neuropeptide Receptors for Cancer Imaging and Therapy: Perspectives with Bombesin, Neurotensin, and Neuropeptide-Y Receptors. J. Nucl. Med. 2014, 55, 1650–1657. [Google Scholar] [CrossRef] [PubMed]
- Hofman, M.S.; Lau, W.F.E.; Hicks, R.J. Somatostatin Receptor Imaging with68Ga DOTATATE PET/CT: Clinical Utility, Normal Patterns, Pearls, and Pitfalls in Interpretation. RadioGraphics 2015, 35, 500–516. [Google Scholar] [CrossRef] [PubMed]
- Maschauer, S.; Prante, O. Radiopharmaceuticals for imaging and endoradiotherapy of neurotensin receptor-positive tumors. J. Label. Compd. Radiopharm. 2018, 61, 309–325. [Google Scholar] [CrossRef] [PubMed]
- Desai, H.; Borges-Neto, S.; Wong, T.Z. Molecular Imaging and Therapy for Neuroendocrine Tumors. Curr. Treat. Options Oncol. 2019, 20, 78. [Google Scholar] [CrossRef]
- Damuka, N.; Solingapuram Sai, K.K. Method to development of PET radiopharmaceutical for cancer imaging. In Cancer Biomarkers, 1st ed.; Deep, G., Ed.; Humana: New York, NY, USA, 2022; Volume 2413, pp. 13–22. [Google Scholar]
- Fani, M.; Maecke, H.R. Radiopharmaceutical development of radiolabelled peptides. Eur. J. Nucl. Med. Mol. Imaging 2012, 39 (Suppl. 1), S11–S30. [Google Scholar] [CrossRef]
- Richter, S.; Wuest, F. 18F-Labeled Peptides: The Future Is Bright. Molecules 2014, 19, 20536–20556. [Google Scholar] [CrossRef]
- Kumar, K.; Ghosh, A. 18F-AlF Labeled Peptide and Protein Conjugates as Positron Emission Tomography Imaging Pharmaceuticals. Bioconjugate Chem. 2018, 29, 953–975. [Google Scholar] [CrossRef]
- Schottelius, M.; Wester, H.-J. Molecular imaging targeting peptide receptors. Methods 2009, 48, 161–177. [Google Scholar] [CrossRef] [PubMed]
- Lee, S.; Xie, J.; Chen, X. Peptide-Based Probes for Targeted Molecular Imaging. Biochemistry 2010, 49, 1364–1376. [Google Scholar] [CrossRef]
- Fani, M.; Maecke, H.R.; Okarvi, S.M. Radiolabeled Peptides: Valuable Tools for the Detection and Treatment of Cancer. Theranostics 2012, 2, 481–501. [Google Scholar] [CrossRef]
- Werle, M.; Bernkop-Schnürch, A. Strategies to improve plasma half life time of peptide and protein drugs. Amino Acids 2006, 30, 351–367. [Google Scholar] [CrossRef] [PubMed]
- Lang, C.; Maschauer, S.; Hübner, H.; Gmeiner, P.; Prante, O. Synthesis and Evaluation of a 18F-Labeled Diarylpyrazole Glycoconjugate for the Imaging of NTS1-Positive Tumors. J. Med. Chem. 2013, 56, 9361–9365. [Google Scholar] [CrossRef] [PubMed]
- Schulz, J.; Rohracker, M.; Stiebler, M.; Goldschmidt, J.; Grosser, O.S.; Osterkamp, F.; Pethe, A.; Reineke, U.; Smerling, C.; Amthauer, H. Comparative Evaluation of the Biodistribution Profiles of a Series of Nonpeptidic Neurotensin Receptor-1 Antagonists Reveals a Promising Candidate for Theranostic Applications. J. Nucl. Med. 2016, 57, 1120–1123. [Google Scholar] [CrossRef] [PubMed]
- Renard, E.; Moreau, M.; Bellaye, P.-S.; Guillemin, M.; Collin, B.; Prignon, A.; Denat, F.; Goncalves, V. Positron Emission Tomography Imaging of Neurotensin Receptor-Positive Tumors with 68Ga-Labeled Antagonists: The Chelate Makes the Difference Again. J. Med. Chem. 2021, 64, 8564–8578. [Google Scholar] [CrossRef] [PubMed]
- Fanelli, R.; Chastel, A.; Previti, S.; Hindié, E.; Vimont, D.; Zanotti-Fregonara, P.; Fernandez, P.; Garrigue, P.; Lamare, F.; Schollhammer, R.; et al. Silicon-Containing Neurotensin Analogues as Radiopharmaceuticals for NTS1-Positive Tumors Imaging. Bioconjugate Chem. 2020, 31, 2339–2349. [Google Scholar] [CrossRef]
- Keller, M.; Kuhn, K.K.; Einsiedel, J.; Hübner, H.; Biselli, S.; Mollereau, C.; Wifling, D.; Svobodová, J.; Bernhardt, G.; Cabrele, C.; et al. Mimicking of Arginine by Functionalized Nω-Carbamoylated Arginine as a New Broadly Applicable Approach to Labeled Bioactive Peptides: High Affinity Angiotensin, Neuropeptide Y, Neuropeptide FF, and Neurotensin Receptor Ligands As Examples. J. Med. Chem. 2016, 59, 1925–1945. [Google Scholar] [CrossRef]
- Schindler, L.; Bernhardt, G.; Keller, M. Modifications at Arg and Ile Give Neurotensin(8–13) Derivatives with High Stability and Retained NTS1 Receptor Affinity. ACS Med. Chem. Lett. 2019, 10, 960–965. [Google Scholar] [CrossRef]
- Alshoukr, F.; Prignon, A.; Brans, L.; Jallane, A.; Mendes, S.; Talbot, J.-N.; Tourwé, D.; Barbet, J.; Gruaz-Guyon, A. Novel DOTA-Neurotensin Analogues for 111In Scintigraphy and 68Ga PET Imaging of Neurotensin Receptor-Positive Tumors. Bioconjugate Chem. 2011, 22, 1374–1385. [Google Scholar] [CrossRef]
- Maschauer, S.; Einsiedel, J.; Hübner, H.; Gmeiner, P.; Prante, O. 18F- and 68Ga-Labeled Neurotensin Peptides for PET Imaging of Neurotensin Receptor 1. J. Med. Chem. 2016, 59, 6480–6492. [Google Scholar] [CrossRef]
- García-Garayoa, E.; Allemann-Tannahill, L.; Bläuenstein, P.; Willmann, M.; Carrel-Rémy, N.; Tourwé, D.; Iterbeke, K.; Conrath, P.; Schubiger, P.A. In vitro and in vivo evaluation of new radiolabeled neurotensin(8–13) analogues with high affinity for NT1 receptors. Nucl. Med. Biol. 2001, 28, 75–84. [Google Scholar] [CrossRef]
- Mascarin, A.; Valverde, I.E.; Vomstein, S.; Mindt, T.L. 1,2,3-Triazole Stabilized Neurotensin-Based Radiopeptidomimetics for Improved Tumor Targeting. Bioconjugate Chem. 2015, 26, 2143–2152. [Google Scholar] [CrossRef] [PubMed]
- Tyler-McMahon, B.M.; Stewart, J.A.; Farinas, F.; McCormick, D.J.; Richelson, E. Highly potent neurotensin analog that causes hypothermia and antinociception. Eur. J. Pharmacol. 2000, 390, 107–111. [Google Scholar] [CrossRef]
- Bruehlmeier, M.; Garayoa, E.G.; Blanc, A.; Holzer, B.; Gergely, S.; Tourwé, D.; Schubiger, P.A.; Bläuenstein, P. Stabilization of neurotensin analogues: Effect on peptide catabolism, biodistribution and tumor binding. Nucl. Med. Biol. 2002, 29, 321–327. [Google Scholar] [CrossRef]
- García-Garayoa, E.; Bläuenstein, P.; Bruehlmeier, M.; Blanc, A.; Iterbeke, K.; Conrath, P.; Tourwé, D.; Schubiger, P.A. Preclin-ical evaluation of a new, stabilized neurotensin(8-13) pseudopeptide radiolabeled with 99mTc. J. Nucl. Med. 2002, 43, 374–383. [Google Scholar]
- Bläuenstein, P.; Garayoa, E.G.; Rüegg, D.; Blanc, A.; Tourwé, D.; Beck-Sickinger, A.; Schubiger, P.A. Improving the Tumor Uptake of 99mTc-Labeled Neuropeptides Using Stabilized Peptide Analogues. Cancer Biother. Radiopharm. 2004, 19, 181–188. [Google Scholar] [CrossRef]
- Maes, V.; Garcia-Garayoa, E.; Bläuenstein, P.; Tourwé, D. Novel 99mTc-Labeled Neurotensin Analogues with Optimized Biodistribution Properties. J. Med. Chem. 2006, 49, 1833–1836. [Google Scholar] [CrossRef]
- Nock, B.A.; Nikolopoulou, A.; Reubi, J.-C.; Maes, V.; Conrath, P.; Tourwé, D.; Maina, T. Toward Stable N4-Modified Neurotensins for NTS1-Receptor-Targeted Tumor Imaging with 99mTc. J. Med. Chem. 2006, 49, 4767–4776. [Google Scholar] [CrossRef]
- Maina, T.; Nikolopoulou, A.; Stathopoulou, E.; Galanis, A.S.; Cordopatis, P.; Nock, B.A. [99mTc]Demotensin 5 and 6 in the NTS1-R-targeted imaging of tumours: Synthesis and preclinical results. Eur. J. Pediatr. 2007, 34, 1804–1814. [Google Scholar] [CrossRef]
- Alshoukr, F.; Rosant, C.; Maes, V.; Abdelhak, J.; Raguin, O.; Burg, S.; Sarda, L.; Barbet, J.; Tourwé, D.; Pelaprat, D.; et al. Novel Neurotensin Analogues for Radioisotope Targeting to Neurotensin Receptor-Positive Tumors. Bioconjugate Chem. 2009, 20, 1602–1610. [Google Scholar] [CrossRef]
- Boules, M.; Liang, Y.; Briody, S.; Miura, T.; Fauq, I.; Oliveros, A.; Wilson, M.; Khaniyev, S.; Williams, K.; Li, Z.; et al. NT79: A novel neurotensin analog with selective behavioral effects. Brain Res. 2010, 1308, 35–46. [Google Scholar] [CrossRef]
- Mascarin, A.; Valverde, I.E.; Mindt, T.L. Structure-Activity Relationship Studies of Amino Acid Substitutions in Radiolabeled Neurotensin Conjugates. ChemMedChem 2015, 11, 102–107. [Google Scholar] [CrossRef]
- Chavatte, K.; Terriere, D.; Jeannin, L.; Iterbeke, K.; Briejer, M.; Schuurkes, J.; Mertens, J.J.R.; Bruyneel, E.; Tourwé, D.; Leysen, J.E.; et al. Labelling and evaluation of new stabilised neurotensin(8-13) analogues for single photon emission tomography (SPET). J. Label. Comp. Radiopharm. 1999, 42, 423–435. [Google Scholar] [CrossRef]
- De León-Rodriguez, L.M.; Kovacs, Z.; Dieckmann, G.R.; Sherry, A.D. Solid-Phase Synthesis of DOTA–Peptides. Chem. A Eur. J. 2004, 10, 1149–1155. [Google Scholar] [CrossRef]
- Guérin, B.; Ait-Mohand, S.; Tremblay, M.-C.; Dumulon-Perreault, V.; Fournier, P.; Bénard, F. Total Solid-Phase Synthesis of NOTA-Functionalized Peptides for PET Imaging. Org. Lett. 2009, 12, 280–283. [Google Scholar] [CrossRef] [PubMed]
- Kuhn, K.K.; Ertl, T.; Dukorn, S.; Keller, M.; Bernhardt, G.; Reiser, O.; Buschauer, A. High Affinity Agonists of the Neuropeptide Y (NPY) Y4 Receptor Derived from the C-Terminal Pentapeptide of Human Pancreatic Polypeptide (hPP): Synthesis, Stereochemical Discrimination, and Radiolabeling. J. Med. Chem. 2016, 59, 6045–6058. [Google Scholar] [CrossRef]
- Keller, M.; Mahuroof, S.A.; Yee, V.H.; Carpenter, J.; Schindler, L.; Littmann, T.; Pegoli, A.; Hübner, H.; Bernhardt, G.; Gmeiner, P.; et al. Fluorescence Labeling of Neurotensin(8–13) via Arginine Residues Gives Molecular Tools with High Receptor Affinity. ACS Med. Chem. Lett. 2019, 11, 16–22. [Google Scholar] [CrossRef]
- Schindler, L.; Wohlfahrt, K.; von Krüchten, L.G.; Prante, O.; Keller, M.; Maschauer, S. Neurotensin analogs by fluoroglycosylation at Nω-carbamoylated arginines for PET imaging of NTS1-positive tumors. Sci. Rep. 2022, 12, 15028. [Google Scholar] [CrossRef]
- Grätz, L.; Laasfeld, T.; Allikalt, A.; Gruber, C.G.; Pegoli, A.; Tahk, M.-J.; Tsernant, M.-L.; Keller, M.; Rinken, A. BRET- and fluorescence anisotropy-based assays for real-time monitoring of ligand binding to M2 muscarinic acetylcholine receptors. Biochim. Biophys. Acta 2020, 1868, 118930. [Google Scholar] [CrossRef]
- Cheng, Y.-C.; Prusoff, W.H. Relationship between the inhibition constant (KI) and the concentration of inhibitor which causes 50 per cent inhibition (I50) of an enzymatic reaction. Biochem. Pharmacol. 1973, 22, 3099–3108. [Google Scholar] [CrossRef]
- Müller, M.; Knieps, S.; Geßele, K.; Dove, S.; Bernhardt, G.; Buschauer, A. Synthesis and Neuropeptide Y Y1 Receptor Antagonistic Activity ofN,N-Disubstituted ω-Guanidino- and ω-Aminoalkanoic Acid Amides. Arch. Pharm. 1997, 330, 333–342. [Google Scholar] [CrossRef]
- Jakoby, B.W.; Bercier, Y.; Conti, M.; Casey, M.E.; Bendriem, B.; Townsend, D.W. Physical and clinical performance of the mCT time-of-flight PET/CT scanner. Phys. Med. Biol. 2011, 56, 2375–2389. [Google Scholar] [CrossRef]
- DiFilippo, F.P.; Patel, S.; Asosingh, K.; Erzurum, S.C. Small-animal imaging using clinical positron emission tomogra-phy/computed tomography and super-resolution. Mol. Imaging 2012, 11, 210–219. [Google Scholar] [CrossRef]
- Miller, S.C.; Scanlan, T.S. Site-Selective N-Methylation of Peptides on Solid Support. J. Am. Chem. Soc. 1997, 119, 2301–2302. [Google Scholar] [CrossRef]
- Müller, C.; Gleixner, J.; Tahk, M.-J.; Kopanchuk, S.; Laasfeld, T.; Weinhart, M.; Schollmeyer, D.; Betschart, M.U.; Lüdeke, S.; Koch, P.; et al. Structure-Based Design of High-Affinity Fluorescent Probes for the Neuropeptide Y Y1 Receptor. J. Med. Chem. 2022, 65, 4832–4853. [Google Scholar] [CrossRef]
- Khatun, U.L.; Goswami, S.K.; Mukhopadhyay, C. Modulation of the neurotensin solution structure in the presence of ganglioside GM1 bicelle. Biophys. Chem. 2012, 168–169, 48–59. [Google Scholar] [CrossRef]
- Vita, N.; Laurent, P.; Lefort, S.; Chalon, P.; Dumont, X.; Kaghad, M.; Gully, D.; Le Fur, G.; Ferrara, P.; Caput, D. Cloning and expression of a complementary DNA encoding a high affinity human neurotensin receptor. FEBS Lett. 1993, 317, 139–142. [Google Scholar] [CrossRef]
- Kokko, K.P.; Hadden, M.K.; Orwig, K.S.; Mazella, J.; Dix, T.A. In Vitro Analysis of Stable, Receptor-Selective Neurotensin[8–13] Analogues. J. Med. Chem. 2003, 46, 4141–4148. [Google Scholar] [CrossRef]
- Richelson, E.; McCormick, D.J.; Pang, Y.P.; Phillips, K.S. Peptide analogs that are potent and selective for human neurotensin receptor subtype 2. U.S. Patent Application US2009/0062212A1, 5 March 2009. [Google Scholar]
- Cusack, B.; McCormick, D.J.; Pang, Y.-P.; Souder, T.; Garcia, R.; Fauq, A.; Richelson, E. Pharmacological and Biochemical Profiles of Unique Neurotensin 8-13 Analogs Exhibiting Species Selectivity, Stereoselectivity, and Superagonism. J. Biol. Chem. 1995, 270, 18359–18366. [Google Scholar] [CrossRef]
- Barroso, S.; Richard, F.; Nicolas-Ethève, D.; Reversat, J.-L.; Bernassau, J.-M.; Kitabgi, P.; Labbé-Jullié, C. Identification of Residues Involved in Neurotensin Binding and Modeling of the Agonist Binding Site in Neurotensin Receptor 1. J. Biol. Chem. 2000, 275, 328–336. [Google Scholar] [CrossRef]
- Pang, Y.-P.; Cusack, B.; Groshan, K.; Richelson, E. Proposed Ligand Binding Site of the Transmembrane Receptor for Neurotensin(8–13). J. Biol. Chem. 1996, 271, 15060–15068. [Google Scholar] [CrossRef]
- Härterich, S.; Koschatzky, S.; Einsiedel, J.; Gmeiner, P. Novel insights into GPCR—Peptide interactions: Mutations in extracellular loop 1, ligand backbone methylations and molecular modeling of neurotensin receptor 1. Bioorganic Med. Chem. 2008, 16, 9359–9368. [Google Scholar] [CrossRef]
- Einsiedel, J.; Held, C.; Hervet, M.; Plomer, M.; Tschammer, N.; Hübner, H.; Gmeiner, P. Discovery of Highly Potent and Neurotensin Receptor 2 Selective Neurotensin Mimetics. J. Med. Chem. 2011, 54, 2915–2923. [Google Scholar] [CrossRef] [PubMed]
- Eiselt, E.; Gonzalez, S.; Martin, C.; Chartier, M.; Betti, C.; Longpré, J.-M.; Cavelier, F.; Tourwè, D.; Gendron, L.; Ballet, S.; et al. Neurotensin Analogues Containing Cyclic Surrogates of Tyrosine at Position 11 Improve NTS2 Selectivity Leading to Analgesia without Hypotension and Hypothermia. ACS Chem. Neurosci. 2019, 10, 4535–4544. [Google Scholar] [CrossRef]
- Chalon, P.; Vita, N.; Kaghad, M.; Guillemot, M.; Bonnin, J.; Delpech, B.; Le Fur, G.; Ferrara, P.; Caput, D. Molecular cloning of a levocabastine-sensitive neurotensin binding site. FEBS Lett. 1996, 386, 91–94. [Google Scholar] [CrossRef]
- Mazella, J.; Botto, J.-M.; Guillemare, E.; Coppola, T.; Sarret, P.; Vincent, J.-P. Structure, Functional Expression, and Cerebral Localization of the Levocabastine-Sensitive Neurotensin/Neuromedin N Receptor from Mouse Brain. J. Neurosci. 1996, 16, 5613–5620. [Google Scholar] [CrossRef]
- Vita, N.; Oury-Donat, F.; Chalon, P.; Guillemot, M.; Kaghad, M.; Bachy, A.; Thurneyssen, O.; Garcia, S.; Poinot-Chazel, C.; Casellas, P.; et al. Neurotensin is an antagonist of the human neurotensin NT2 receptor expressed in Chinese hamster ovary cells. Eur. J. Pharmacol. 1998, 360, 265–272. [Google Scholar] [CrossRef]
- Kayed, H.; Meyer, P.; He, Y.; Kraenzlin, B.; Fink, C.; Gretz, N.; Schoenberg, S.O.; Sadick, M. Evaluation of the Metabolic Response to Cyclopamine Therapy in Pancreatic Cancer Xenografts Using a Clinical PET-CT System. Transl. Oncol. 2012, 5, 335–343. [Google Scholar] [CrossRef]
- Fani, M.; Del Pozzo, L.; Abiraj, K.; Mansi, R.; Tamma, M.L.; Cescato, R.; Waser, B.; Weber, W.A.; Reubi, J.C.; Maecke, H.R. PET of Somatostatin Receptor–Positive Tumors Using 64Cu- and 68Ga-Somatostatin Antagonists: The Chelate Makes the Difference. J. Nucl. Med. 2011, 52, 1110–1118. [Google Scholar] [CrossRef]
- Schulz, J.; Rohracker, M.; Stiebler, M.; Goldschmidt, J.; Stöber, F.; Noriega, M.; Pethe, A.; Lukas, M.; Osterkamp, F.; Reineke, U.; et al. Proof of Therapeutic Efficacy of a 177Lu-Labeled Neurotensin Receptor 1 Antagonist in a Colon Carcinoma Xenograft Model. J. Nucl. Med. 2017, 58, 936–941. [Google Scholar] [CrossRef]
- Osterkamp, F.; Smerling, C.; Reineke, U.; Haase, C.; Ungewiss, J. Neurotensin receptor ligands. US10961199B2, 30 March 2021. [Google Scholar]
- Baum, R.P.; Singh, A.; Schuchardt, C.; Kulkarni, H.R.; Klette, I.; Wiessalla, S.; Osterkamp, F.; Reineke, U.; Smerling, C. 177Lu-3BP-227 for Neurotensin Receptor 1–Targeted Therapy of Metastatic Pancreatic Adenocarcinoma: First Clinical Results. J. Nucl. Med. 2018, 59, 809–814. [Google Scholar] [CrossRef]


Publisher’s Note: MDPI stays neutral with regard to jurisdictional claims in published maps and institutional affiliations. |
© 2022 by the authors. Licensee MDPI, Basel, Switzerland. This article is an open access article distributed under the terms and conditions of the Creative Commons Attribution (CC BY) license (https://creativecommons.org/licenses/by/4.0/).