
Identifying Transcripts with Tandem Duplications from RNA-Sequencing Data to Predict BRCA1-Type Primary Breast Cancer


Abstract
:Simple Summary
Abstract

1. Introduction
2. Materials and Methods
2.1. Sequencing Data
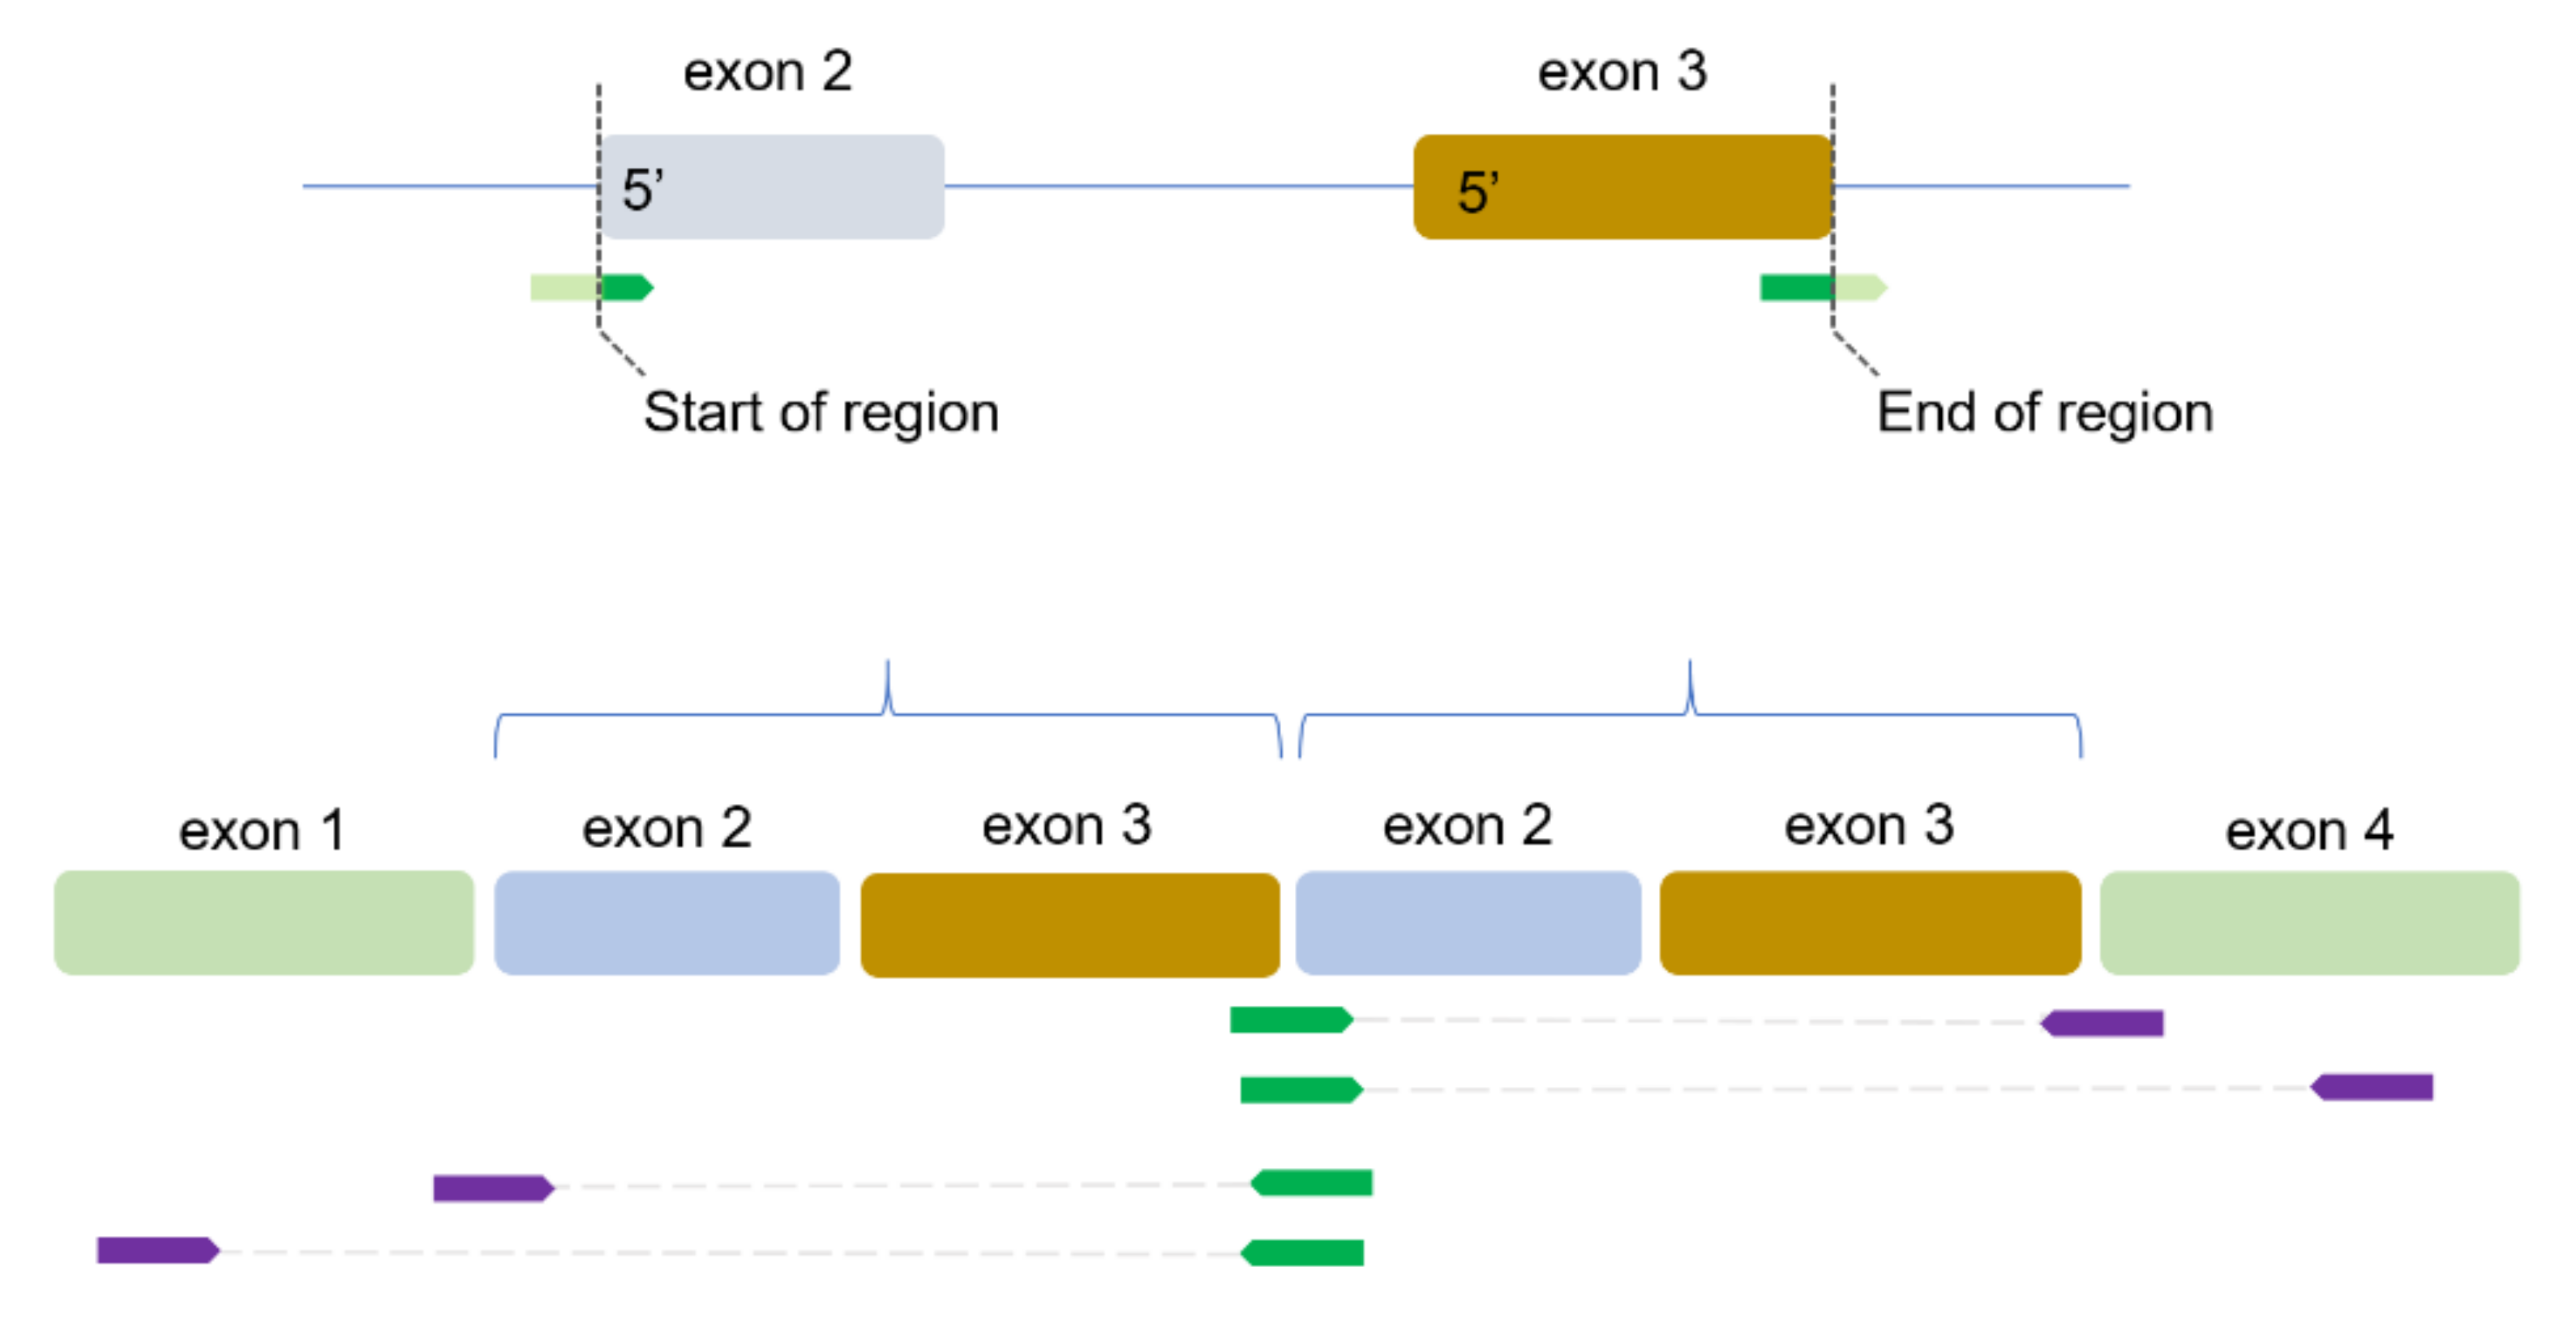
2.2. Identification of TDs
2.3. Enrichment Analysis
2.4. Statistical Analyses
3. Results
3.1. Abundance of TD Regions
3.2. Power of the TD-Score to Predict BRCA1-Type HRD
3.3. Genes Affected by TDs in BRCA1-Type Samples
4. Discussion
5. Conclusions
Supplementary Materials
Author Contributions
Funding
Institutional Review Board Statement
Informed Consent Statement
Data Availability Statement
Acknowledgments
Conflicts of Interest
References
- DeSantis, C.E.; Ma, J.; Gaudet, M.M.; Newman, L.A.; Miller, K.D.; Goding Sauer, A.; Jemal, A.; Siegel, R.L. Breast cancer statistics, 2019. CA Cancer J. Clin. 2019, 69, 438–451. [Google Scholar] [CrossRef]
- Collaborative Group on Hormonal Factors in Breast Cancer. Familial breast cancer: Collaborative reanalysis of individual data from 52 epidemiological studies including 58,209 women with breast cancer and 101,986 women without the disease. Lancet 2001, 358, 1389–1399. [Google Scholar] [CrossRef]
- Kuchenbaecker, K.B.; Hopper, J.L.; Barnes, D.R.; Phillips, K.A.; Mooij, T.M.; Roos-Blom, M.J.; Jervis, S.; van Leeuwen, F.E.; Milne, R.L.; Andrieu, N.; et al. Risks of Breast, Ovarian, and Contralateral Breast Cancer for BRCA1 and BRCA2 Mutation Carriers. JAMA 2017, 317, 2402–2416. [Google Scholar] [CrossRef] [Green Version]
- Roy, R.; Chun, J.; Powell, S.N. BRCA1 and BRCA2: Different roles in a common pathway of genome protection. Nat. Rev. Cancer 2011, 12, 68–78. [Google Scholar] [CrossRef] [Green Version]
- Elia, A.E.; Elledge, S.J. BRCA1 as tumor suppressor: Lord without its RING? Breast Cancer Res. 2012, 14, 306. [Google Scholar] [CrossRef]
- Clark, S.L.; Rodriguez, A.M.; Snyder, R.R.; Hankins, G.D.; Boehning, D. Structure-Function Of The Tumor Suppressor BRCA1. Comput. Struct. Biotechnol. J. 2012, 1, e201204005. [Google Scholar] [CrossRef] [Green Version]
- Dietlein, F.; Thelen, L.; Reinhardt, H.C. Cancer-specific defects in DNA repair pathways as targets for personalized therapeutic approaches. Trends Genet. 2014, 30, 326–339. [Google Scholar] [CrossRef]
- Davies, H.; Glodzik, D.; Morganella, S.; Yates, L.R.; Staaf, J.; Zou, X.; Ramakrishna, M.; Martin, S.; Boyault, S.; Sieuwerts, A.M.; et al. HRDetect is a predictor of BRCA1 and BRCA2 deficiency based on mutational signatures. Nat. Med. 2017, 23, 517–525. [Google Scholar] [CrossRef]
- Francica, P.; Rottenberg, S. Mechanisms of PARP inhibitor resistance in cancer and insights into the DNA damage response. Genome Med. 2018, 10, 101. [Google Scholar] [CrossRef] [Green Version]
- Gogola, E.; Rottenberg, S.; Jonkers, J. Resistance to PARP inhibitors: Lessons from preclinical models of BRCA-associated cancer. Annu. Rev. Cancer Biol. 2019, 3, 235–254. [Google Scholar] [CrossRef]
- Meijer, T.G.; Verkaik, N.S.; Sieuwerts, A.M.; van Riet, J.; Naipal, K.A.T.; van Deurzen, C.H.M.; den Bakker, M.A.; Sleddens, H.F.; Dubbink, H.J.; den Toom, T.D.; et al. Functional Ex Vivo Assay Reveals Homologous Recombination Deficiency in Breast Cancer Beyond BRCA Gene Defects. Clin. Cancer Res. 2018, 24, 6277–6287. [Google Scholar] [CrossRef] [Green Version]
- Nik-Zainal, S.; Morganella, S. Mutational Signatures in Breast Cancer: The Problem at the DNA Level. Clin. Cancer Res. 2017, 23, 2617–2629. [Google Scholar] [CrossRef] [Green Version]
- Alexandrov, L.B.; Kim, J.; Haradhvala, N.J.; Huang, M.N.; Tian Ng, A.W.; Wu, Y.; Boot, A.; Covington, K.R.; Gordenin, D.A.; Bergstrom, E.N.; et al. The repertoire of mutational signatures in human cancer. Nature 2020, 578, 94–101. [Google Scholar] [CrossRef] [Green Version]
- Nik-Zainal, S.; Davies, H.; Staaf, J.; Ramakrishna, M.; Glodzik, D.; Zou, X.; Martincorena, I.; Alexandrov, L.B.; Martin, S.; Wedge, D.C.; et al. Landscape of somatic mutations in 560 breast cancer whole-genome sequences. Nature 2016, 534, 47–54. [Google Scholar] [CrossRef]
- Willis, N.A.; Frock, R.L.; Menghi, F.; Duffey, E.E.; Panday, A.; Camacho, V.; Hasty, E.P.; Liu, E.T.; Alt, F.W.; Scully, R. Mechanism of tandem duplication formation in BRCA1-mutant cells. Nature 2017, 551, 590–595. [Google Scholar] [CrossRef]
- Nguyen, L.; Martens, J.W.; van Hoeck, A.; Cuppen, E. Pan-cancer landscape of homologous recombination deficiency. Nat. Commun. 2020, 11, 5584. [Google Scholar] [CrossRef]
- Smid, M.; Rodriguez-Gonzalez, F.G.; Sieuwerts, A.M.; Salgado, R.; Prager-Van der Smissen, W.J.; van der Vlugt-Daane, M.; van Galen, A.; Nik-Zainal, S.; Staaf, J.; Brinkman, A.B.; et al. Breast cancer genome and transcriptome integration implicates specific mutational signatures with immune cell infiltration. Nat. Commun 2016, 7, 12910. [Google Scholar] [CrossRef]
- Dobin, A.; Davis, C.A.; Schlesinger, F.; Drenkow, J.; Zaleski, C.; Jha, S.; Batut, P.; Chaisson, M.; Gingeras, T.R. STAR: Ultrafast universal RNA-seq aligner. Bioinformatics 2013, 29, 15–21. [Google Scholar] [CrossRef]
- Tarasov, A.; Vilella, A.J.; Cuppen, E.; Nijman, I.J.; Prins, P. Sambamba: Fast processing of NGS alignment formats. Bioinformatics 2015, 31, 2032–2034. [Google Scholar] [CrossRef]
- Smid, M.; Wilting, S.M.; Uhr, K.; Rodriguez-Gonzalez, F.G.; de Weerd, V.; Prager-Van der Smissen, W.J.C.; van der Vlugt-Daane, M.; van Galen, A.; Nik-Zainal, S.; Butler, A.; et al. The circular RNome of primary breast cancer. Genome Res. 2019, 29, 356–366. [Google Scholar] [CrossRef]
- Huang, H.W.; Sherman, B.T.; Lempicki, R.A. Bioinformatics enrichment tools: Paths toward the comprehensive functional analysis of large gene lists. Nucleic Acids Res. 2009, 37, 1–13. [Google Scholar] [CrossRef] [PubMed] [Green Version]
- Couch, F.J.; Hart, S.N.; Sharma, P.; Toland, A.E.; Wang, X.; Miron, P.; Olson, J.E.; Godwin, A.K.; Pankratz, V.S.; Olswold, C.; et al. Inherited mutations in 17 breast cancer susceptibility genes among a large triple-negative breast cancer cohort unselected for family history of breast cancer. J. Clin. Oncol. 2015, 33, 304–311. [Google Scholar] [CrossRef]
- Priestley, P.; Baber, J.; Lolkema, M.P.; Steeghs, N.; de Bruijn, E.; Shale, C.; Duyvesteyn, K.; Haidari, S.; van Hoeck, A.; Onstenk, W.; et al. Pan-cancer whole-genome analyses of metastatic solid tumours. Nature 2019, 575, 210–216. [Google Scholar] [CrossRef] [PubMed] [Green Version]
- Angus, L.; Smid, M.; Wilting, S.M.; van Riet, J.; van Hoeck, A.; Nguyen, L.; Nik-Zainal, S.; Steenbruggen, T.G.; Tjan-Heijnen, V.C.; Labots, M.; et al. The genomic landscape of metastatic breast cancer highlights changes in mutation and signature frequencies. Nat. Genet. 2019, 51, 1450–1458. [Google Scholar] [CrossRef] [PubMed]
- Saal, L.H.; Gruvberger-Saal, S.K.; Persson, C.; Lovgren, K.; Jumppanen, M.; Staaf, J.; Jönsson, G.; Pires, M.M.; Maurer, M.; Holm, K.; et al. Recurrent gross mutations of the PTEN tumor suppressor gene in breast cancers with deficient DSB repair. Nat. Genet. 2008, 40, 102–107. [Google Scholar] [CrossRef] [PubMed]
- Foulkes, W.D. BRCA1-sowing the seeds crooked in the furrow. Nat. Genet. 2008, 40, 8–9. [Google Scholar] [CrossRef] [PubMed]
- Mendes-Pereira, A.M.; Martin, S.A.; Brough, R.; McCarthy, A.; Taylor, J.R.; Kim, J.S.; Waldman, T.; Lord, C.J.; Ashworth, A. Synthetic lethal targeting of PTEN mutant cells with PARP inhibitors. EMBO Mol. Med. 2009, 1, 315–322. [Google Scholar] [CrossRef] [PubMed]
- Shen, W.H.; Balajee, A.S.; Wang, J.; Wu, H.; Eng, C.; Pandolfi, P.P.; Yin, Y. Essential role for nuclear PTEN in maintaining chromosomal integrity. Cell 2007, 128, 157–170. [Google Scholar] [CrossRef] [PubMed] [Green Version]
- Peng, G.; Lin, C.; Mo, W.; Dai, H.; Park, Y.; Kim, S.M.; Peng, Y.; Mo, Q.; Siwko, S.; Hu, R.; et al. Genome-wide transcriptome profiling of homologous recombination DNA repair. Nat. Commun. 2014, 5, 3361. [Google Scholar] [CrossRef] [Green Version]
- Hussmann, J.A.; Ling, J.; Ravisankar, P.; Yan, J.; Cirincione, A.; Xu, A.; Simpson, D.; Yang, D.; Bothmer, A.; Cotta-Ramusino, C.; et al. Mapping the genetic landscape of DNA double-strand break repair. Cell 2021, 184, 5653–5669. [Google Scholar] [CrossRef]


| Gene | N of BRCA1-Type Samples with a TD | N of BRCA2-Type & HRP Samples with a TD | Nominal p-Value | FDR |
|---|---|---|---|---|
| POMT1 | 4 | 13 | 0.257 | 0.627 |
| ASPH | 3 | 12 | 0.431 | 0.627 |
| CDKAL1 | 3 | 1 | 0.008 | 0.119 |
| PTEN | 3 | 0 | 0.002 | 0.034 |
| RAP1B | 3 | 4 | 0.052 | 0.26 |
| AACS | 2 | 0 | 0.017 | 0.119 |
| AKT3 | 2 | 1 | 0.048 | 0.26 |
| AMY2B | 2 | 8 | 0.627 | 0.627 |
| CREBBP | 2 | 0 | 0.017 | 0.119 |
| EZH2 | 2 | 0 | 0.017 | 0.119 |
| KIAA1217 | 2 | 0 | 0.017 | 0.119 |
| LRP6 | 2 | 0 | 0.017 | 0.119 |
| NPM1 | 2 | 4 | 0.184 | 0.627 |
| PPP6R3 | 2 | 0 | 0.017 | 0.119 |
| PRPSAP2 | 2 | 0 | 0.017 | 0.119 |
| TTC23 | 2 | 0 | 0.017 | 0.119 |
| ZNF562 | 2 | 0 | 0.017 | 0.119 |
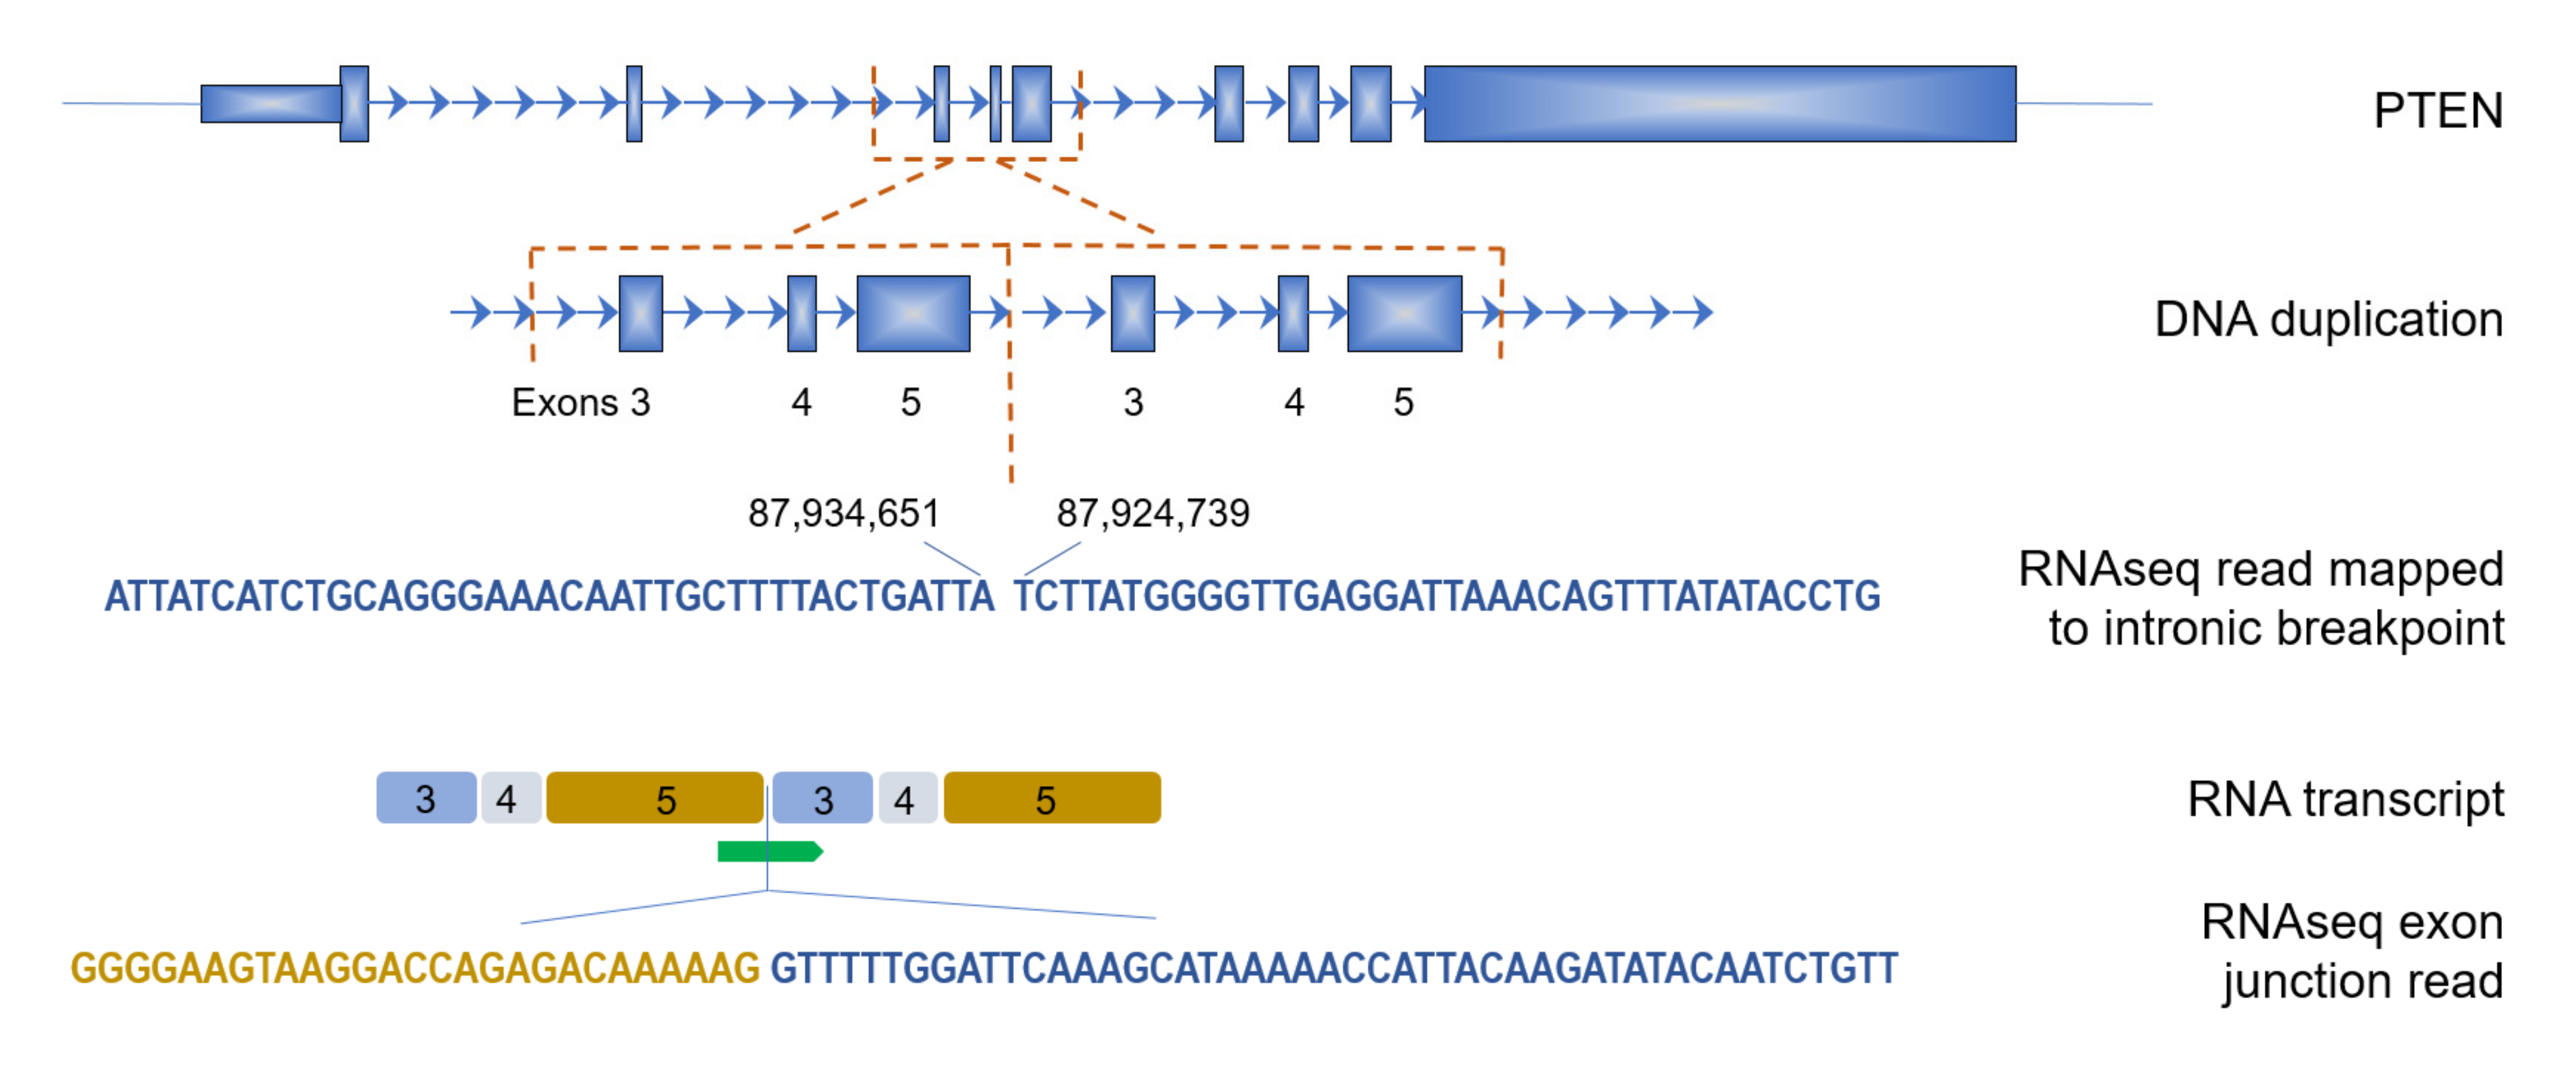
| Sample | N TD Read-Pairs | Size (bp) | Start of Region (Exon N) | End of Region (Exon N) | Effect on Protein | DNA 5’ Breakpoint | DNA 3’ Breakpoint |
|---|---|---|---|---|---|---|---|
| p1 | 6 | 7739 | 3 | 5 | out of frame | 87,924,739 | 87,934,651 |
| p2 | 13 | 2206 | 4 | 5 | out of frame | 87,926,191 | 87,941,211 |
| p3 | 2 | 239 | 5 | 5 | in frame | 87,932,213 | 87,935,777 |
Publisher’s Note: MDPI stays neutral with regard to jurisdictional claims in published maps and institutional affiliations. |
© 2022 by the authors. Licensee MDPI, Basel, Switzerland. This article is an open access article distributed under the terms and conditions of the Creative Commons Attribution (CC BY) license (https://creativecommons.org/licenses/by/4.0/).
Share and Cite
Qu, S.; Martens, J.W.M.; Hollestelle, A.; Smid, M. Identifying Transcripts with Tandem Duplications from RNA-Sequencing Data to Predict BRCA1-Type Primary Breast Cancer. Cancers 2022, 14, 753. https://doi.org/10.3390/cancers14030753
Qu S, Martens JWM, Hollestelle A, Smid M. Identifying Transcripts with Tandem Duplications from RNA-Sequencing Data to Predict BRCA1-Type Primary Breast Cancer. Cancers. 2022; 14(3):753. https://doi.org/10.3390/cancers14030753
Chicago/Turabian StyleQu, Shuoying, John W. M. Martens, Antoinette Hollestelle, and Marcel Smid. 2022. "Identifying Transcripts with Tandem Duplications from RNA-Sequencing Data to Predict BRCA1-Type Primary Breast Cancer" Cancers 14, no. 3: 753. https://doi.org/10.3390/cancers14030753
APA StyleQu, S., Martens, J. W. M., Hollestelle, A., & Smid, M. (2022). Identifying Transcripts with Tandem Duplications from RNA-Sequencing Data to Predict BRCA1-Type Primary Breast Cancer. Cancers, 14(3), 753. https://doi.org/10.3390/cancers14030753