1. Introduction
Breast cancer (BrCa) represents the second most common malignancy in women, with thousands of new cases diagnosed every year [
1] and a five-year survival rate around 90% [
1]. It is estimated that 20–45% of “disease-free” patients experience tumour recurrence 7–25 years after mastectomy [
1,
2]. This has been correlated with the ability of a subpopulation of BrCa cells to survive in the host in a dormant state [
3]. Dormant cells are resistant to conventional therapies and are difficult to detect, making their eradication a real challenge in clinical practice [
4,
5]. The dormancy of BrCa cells is an unharmful event until these cells reactivate and initiate secondary tumours. Therefore, dormancy and tumour initiation ability, also known as tumour cell stemness, must co-exist in the same cancer cell. Indeed, recent studies have demonstrated that dormant breast cancer cells have the added ability to initiate new tumours, displaying cellular and molecular features typical of stem cells [
6,
7].
The bone marrow microenvironment has been identified as the main site in which BrCa dormant cells are lodged and kept in a quiescence status by specific signals and cell-cell interactions [
8]. Bone marrow is known to contribute to the maintenance of long-term haematopoetic stem cell (LT-HSC) stemness and quiescence through specific niches. One of these niches is represented by a specialized subtype of osteoblasts, lining the endosteal surface and expressing high levels of Neural (N)-Cadherin, named spindle-shaped N-Cadherin
+/CD45
− osteoblasts (SNOs) [
9,
10].
Recent work has established that the endosteal niche is also implicated in BrCa cell dormancy [
11], and we have demonstrated that dormant BrCa cells, expressing a high level of N-Cadherin and Notch2, are in the proximity of the endosteal niche enriched in SNOs [
12]. Our work suggested that SNOs keep the tumour cells dormant by a mechanism such as that of LT-HSC quiescence [
12]. Moreover, this BrCa subpopulation shows a stem signature similar to LT-HSCs [
12], thus suggesting an HSC mimicry.
N-Cadherin is a member of the cadherin family, mediating homophilic cell-cell adhesion and migration, encoded by the Cdh2 gene [
13,
14]. High N-cadherin expression is often associated with a reduction in cell proliferation [
15,
16] that, in osteoblasts, is mediated by the activation of Wnt3a signalling, which inhibits cyclin D1 expression [
17,
18]. Moreover, Zhao et al. demonstrated that N-Cadherin
High bone and marrow stromal progenitors are involved in the maintenance of the reserve (r)HSCs [
19]. In cancer, N-cadherin has a different function according to the cellular context [
16,
20,
21]. For example, in osteosarcoma, N-Cadherin works as a tumour suppressor [
22], while in other cancers it promotes invasion [
21]. In normal breast epithelial cells, N-Cadherin interacts with the fibroblast growth factor receptor (FGFR) and the Rho GTPase, activating the ERK signalling pathways and the expression of MMP9, eventually promoting cell motility [
23]. In BrCa cells, N-Cadherin is mis-regulated and increases the Rho GTPase-induced cell motility. In addition, N-Cadherin provides BrCa cells with the capability to interact with the stroma and the endothelial cells, in order to migrate and become metastatic [
24,
25]. Moreover, a recent work demonstrated that N-Cadherin, in association with the connexin 43 expressed by the BrCa stem cells, mediates the communication between these latter and bone marrow cells [
26]. Finally, although the data about the role of N-Cadherin in HSCs are conflicting [
19,
27,
28,
29], it is expressed by HSCs and promotes LT-HSC engraftment and quiescence in the bone marrow [
29]. Nevertheless, the role of N-Cadherin in mediating SNO-induced BrCa cell dormancy and in HSCs mimicry is not fully understood and needs further investigation.
Based on this background, we hypothesised that N-Cadherin could play a role in BrCa dormancy and HSC-like stemness, cooperating with the Notch2 pathway in the process of dormancy and subsequent new tumour initiation ability. To demonstrate our hypothesis, we used mouse and human BrCa cell models in vitro and in vivo. We observed significant differences between human MDA and mouse 4T1 BrCa cells, unveiling a positive role of N-Cadherin in SNO-induced dormancy and HSC mimicry associated with the expression of Notch2 in MDA cells, and a negative role of N-Cadherin in 4T1 cell stemness and HSC mimicry, with a full independence of Notch2 and SNOs on the ability to inhibit cell proliferation.
2. Material and Methods
2.1. Materials
Dulbecco’s Modified Eagle Medium (DMEM) (cat: ECB7501L) penicillin–streptomycin (cat: ECB3001D), Dulbecco’s Phosphate Buffered Saline (DPBS) (cat: ECB4004L), Hanks’ Balanced Salt Solution (cat: ECB4007L) and disposable plastic were from Euroclone (Milan, Italy). Fetal bovine serum (FBS) (cat: 26140-079), Ethylene-Diamine-Tetra-acetic Acid (EDTA) (cat: 15576-028), TRIzol
® (Life Technologies, Carlsbad, CA, USA, cat: 15596018), N2 and B27 supplements (cat: 17502048, 17504044) and primers synthesis were from Invitrogen (Carlsbad, CA, USA). The cDNA Synthesis Kit (cat: K1622) was from ThermoFisher, Waltham, MA, USA. OneTaq
® Hot Start 2X Master Mix (cat: M0484S) and Luna
® Universal qPCR Master Mix (cat: M3003) were from New England BioLabs (Ipswich, MA, USA). Osteodec (cat: 05-03005E) and all reagents for histology were from Bio-Optica (Milano, Italy). SignalStain
® Boost IHC Detection Reagent (cat:8125S (anti-mouse) 8114S (anti-rabbit)) was from Cell Signaling (Danvers, MA, USA). All regents for magnetic-activated cell sorting (MACS) were from Miltenyi Biotec (Bergisch Gladbach, Germany). Mouse Cdh2 CRISPR/Cas9 plasmid (cat: KN503008) was from Origene (Rockville, MD, USA). Supplier, product code and dilution of primary and secondary antibodies used for the study are listed in
Supplementary Table S1. Breast cancer tissue array was from BioChain
® (Newark, CA, USA) (cat: T8235721-5). ON-TARGET plus Human CDH2 siRNA (cat: FE5LHUMANXX0005) were purchased from Horizon Discovery, Waterbeach, UK. All other reagents, including Bovine Serum Albunin (BSA) (cat: A9418) and Clostridium histolyticum type IV collagenase (cat: C8051) were from Sigma Aldrich Co. (St. Louis, MO, USA).
2.2. Breast Cancer Cell Culture
Human MDA-MB-231 (MDA) and mouse 4T1 breast cancer cell lines, parental or transfected with turbo-GFP (MDAGFP and 4T1GFP), were used for all experiments. Cells were cultured in high glucose Dulbecco’s Modified Eagle Medium (DMEM) with the addition of 1% glutamine, 1% penicillin–streptomycin and 10% FBS.
2.3. Genetically Modified 4T1 Breast Cancer Cells
Parental 4T1 cells were evaluated for N-cadherin expression by cytofluorimetry revealing, as expected, the presence of a 4T1 N-cadherin high subpopulation (
Supplementary Figure S1a). N-Cadherin expression was then subjected to non-homology mediated CRISPR/Cas9 knockout by plasmids carrying two gRNAs targeting the N-Cadherin gene co-transfected with a linear donor containing genes encoding for the GFP tag and puromycin resistance (
Supplementary Figure S1b). After stable transfection, the integration of the linear donor was confirmed in two 4T1 N-cadherin knock-out cell populations (4T1
Cdh2KO1-GFP and 4T1
Cdh2KO2-GFP) using a primer pair specific for puromycin, confirming the success of the transfection protocol (
Supplementary Figure S1c). Non-transfected 4T1 cells were included in the analyses as control. Cytofluorimetric analyses further confirmed the absence of N-Cadherin expression in the GFP-positive cells (knock-out cells) (
Supplementary Figure S1d–g). After validation of transfection, 4T1
Cdh2KO1-GFP and 4T1
Cdh2KO2-GFP were sorted by FACS using the GFP tag. Then, to generate a rescued model, the FACS-sorted 4T1
Cdh2KO1-GFP and 4T1
Cdh2KO2-GFP were stably transfected with the mouse Cdh2-turboGFP expression vector (4T1
Cdh2Res1-GFP and 4T1
Cdh2Res2-GFP), which restored N-Cadherin expression (
Supplementary Figure S1h). Cells transfected with the empty-turboGFP vector (4T1
Cdh2KO1-GFP and 4T1
Cdh2KO2-GFP) were used as control. Finally, the 4T1
Cdh2Res2-GFP that showed a non-stable Cdh2 over-expression, and the relative control knock-out cells (4T1
Cdh2KO2-GFP) were excluded from the analysis (
Supplementary Figure S1i). On the contrary, the 4T1
Cdh2KO1-GFP and the 4T1
Cdh2Res1-GFP were used for the experiments and labelled 4T1
Cdh2KO-GFP and 4T1
Cdh2Res-GFP.
2.4. Mouse Primary Osteoblast Cell Isolation
Mouse primary osteoblasts were isolated from the calvariae of 8-day-old CD1 mice using three-step enzymatic digestion with a solution containing 25 mg/mL of porcine trypsin and 1 mg/mL of Clostridium histolyticum type IV collagenase in Hanks’ Balanced Salt Solution. The supernatant from the first digestion, containing mainly fibroblasts, was discarded, while those from the second and the third digestions, enriched in primary murine osteoblasts, were centrifuged at 300× g for 8 min and the cells were then cultured in high glucose DMEM supplemented with 1% glutamine, 1% penicillin–streptomycin and 10% FBS. At confluence, cells were trypsinised and plated according to the experimental protocol.
2.5. Magnetic-Activated Cell Sorting (MACS)
MDA and 4T1 parental or genetically modified cells, and primary mouse osteoblasts were sorted using MACS. Cells were detached with sorting buffer containing DPBS, 5% BSA and 0.5 M of EDTA. Resuspended cells were incubated for 20 min at 4 °C using N-Cadherin or Notch2 biotinylated primary antibodies. Then, cells were incubated again in the same condition using streptavidin-conjugated magnetic microbeads and were eluted through the magnetic column to separate the antigen-depleted and antigen-enriched cell populations. The cells obtained from this procedure were used for RNA isolation, in vitro assays, and in vivo experiments. Supplier, product code and dilution of the primary and secondary antibodies used for the MACS are listed in
Supplementary Table S2.
2.6. RNA Extraction, RNA Deep Sequencing (RNAdSeq) Analysis and Gene Expression
RNA was extracted using TRIzol® according to the manufacturer’s instructions. The RNA quality was assessed using electrophoresis agarose gel and was quantified by Nanodrop® using an absorbance of 260 nm wavelength. The RNA purity was assessed measuring the 260/280 nm ratio and 260/230 nm ratio for the protein and phenol presence respectively.
For RNA dSeq, 3 independent RNA preparations for Notch2High and Notch2Low MDA cells were precipitated in ethanol and sent to Omega Bioservice (Norcross, GA, USA) for the RNA dSeq analysis. The generated RNA dSeq datasets, containing the expression profile of 36,000 genes for each sample/condition, was interrogated to examine the expression of the CDH2 gene.
For conventional gene expression analyses, 1 µg of RNA was retro-transcribed using Revertaid First Strand cDNA Synthesis. Semiquantitative PCR was performed using OneTaq
® Hot Start 2X Master Mix, while real-time PCR was performed using Luna
® Universal qPCR Master. Primer sequences used to assess gene expression are listed in
Supplementary Table S1. Full agarose gel pictures are shown in
Figures S6–S8.
2.7. Flow Cytometry
Cells were detached with a sorting buffer containing DPBS, 5% BSA and 0.5 M of EDTA. Resuspended cells were incubated with primary antibodies against Notch2 and N-Cadherin for 1 h at 4 °C. Then, secondary incubation was performed using fluorochrome-conjugated secondary antibodies; then, cells were analysed by the FACS Melody® (BD) and FlowJO software. Unmarked cells were used to set the laser for the fluorescence threshold.
For the analysis of cells sorted from genetically modified 4T1 (4T1
Cdh2KO-GFP and 4T1
Cdh2Res-GFP), the cell gaiting was performed using the GFP fluorescence. Supplier, product code and dilution of the primary and secondary antibodies used for the analyses are listed in
Supplementary Table S1.
2.8. Animals
For the in vivo experiment, 4-week-old CD1 or Balb-C nude/nude (nu/nu) female mice were purchased from Charles River (Écully, France). Procedures involving animals and their care were conducted in conformity with national and international laws and policies (European Economic Community Council Directive 86/609, OJ L 358, 1, 12 December 1987; Italian Legislative Decree 116/92, Gazzetta Ufficiale della Repubblica Italiana no. 40, 18 February 1992; National Institutes of Health Guide for the Care and Use of Laboratory Animals, National Institutes of Health, 8th edition, 2011). The procedures were approved by the Institutional Ethical Review Board of the University of L’Aquila and by the Ministry of Health (Authorizations n° 270/2018-PR and 1151/2020-PR). The study was conducted according to the Animal Research Reporting In Vivo Experiments (ARRIVE) requirements.
2.9. Intratibial Injection of N-CadherinHigh and N-CadherinLow MDA and 4T1 Cells
Human MDA and mouse 4T1 BrCa cells were injected into the left tibia of 4-week-old female Balb/c nu/nu immunocompromised (for human cells) or Balb/c immunocompetent (for mouse cells) mice (1 × 10⁴ cells/0.01 mL PBS) anesthetized with intraperitoneal injection of 80 mg/kg of ketamine and 10 mg/kg of xylazine. Animals were monitored daily for body weight, food intake, behaviour, and survival.
To follow the progression of osteolytic lesions, mice were subjected to weekly X-ray analysis (X-ray parameters: peak kilovoltage [kVp] = 36 kV for 10 s) using a Cabinet X-ray system (Faxitron model no. 43855A; Faxitron X-Ray Corp., Buffalo Grove, IL, USA). At the end of the experiment, mice were subjected to final X-ray analysis and then sacrificed to perform anatomical dissection for the evaluation of bone and visceral metastases.
2.10. Limiting Dilution Assay (LDA)
Different dilutions (50,000 to 100 cells/mice) of human MDA cells MACS-sorted into N-Cadherin
High and N-Cadherin
Low subpopulations were subcutaneously injected in Balb/c nu/nu immunocompromised female mice anesthetized with intraperitoneal injection of 80 mg/kg of ketamine and 10 mg/kg of xylazine. Animals were monitored daily for body weight, food intake, behaviour, and survival. The tumor incidence was evaluated after 4 weeks from the injection of the tumor cells. The stem cell frequency was estimated using the Extreme Limiting Dilution Assay (ELDA) [
30] available at
https://bioinf.wehi.edu.au/software/elda/ (accessed on 25 February 2022).
2.11. Micro-Computed Tomography (µCT) Analysis
Left tibias harvested from the tumour cell-injected mice were fixed in 4% formaldehyde for 48 h and then scanned by μCT SkyScan 1174. The scan was performed with a 9.80 μm resolution using the X-ray voltage of 50 kV. The Skyscan NRecon software was used to reconstruct the images using a modified Feldkamp algorithm. Three-dimensional (3D) analysis was carried out employing a marching cubes-type model with a rendered surface. The cortical bone parameters were calculated on 300 consecutive slides starting from 100 µm below the growth plate, where the osteolytic lesions were located. Pratt’s algorithm was adopted to take 2D measurements. Threshold values were applied for segmenting trabecular bone. Bone cortical variables were selected according to Bouxsein et al. [
31].
2.12. Histology
Left tibias were decalcified for 48 h in Osteodec and then embedded in paraffin. Livers were fixed in 4% paraformaldehyde and embedded in paraffin. Microtome sectioning was used to obtain tissue slices of 5-μm thickness. Liver sections were stained with haematoxylin and eosin while tibia sections were also processed for immunohistochemistry or immunofluorescence staining.
2.13. Immunohistochemistry and Immunofluorescence
For immunohistochemistry, mouse tibia sections and human primary BrCa tissue arrays were deparaffined and incubated with 0.07 M citrate buffer (pH 6) for 30 min at 96 °C and for 10 min at room temperature. The blocking was made with 3% H2O2 and 5% BSA. Then samples were incubated overnight at 4 °C with primary antibodies against N-Cadherin or human pan-Cytokeratin AE1/AE3. The staining signals were revealed using the SignalStain® Boost IHC Detection Reagent (HPR rabbit or mouse). Sections were counterstained using Gill’s No.3 haematoxylin for 10 s. Positive and negative controls were performed in parallel.
For immunofluorescence, tissue sections or fixed cells (4% paraformaldehyde) were incubated with primary antibodies against human pan-Cytokeratin AE1/AE3, N-Cadherin or Ki67, either singularly or in combinations. Primary antibody incubations were carried out at room temperature for 1 h, then overnight at 4 °C. Then, incubations with secondary antibodies conjugated with AlexaFluor 488 or 594 were performed for 1 h at room temperature. Nuc-Spot
® or DAPI were used to stain the nuclei. The supplier, product code and dilution of the primary and secondary antibodies used for the analyses are listed in
Supplementary Table S2.
2.14. Histomorphometry
Endosteal niche colonization analysis was performed for counting the number of cytokeratin positive cells in proximity of the endosteum (4 mm
2 in area, 50 μm away from the growth plate and 20 μm away from the endocortical surface) [
12], and their distance from the endosteal surface was measured. For liver metastases, sections were evaluated for metastasis number/mm
2 and for the percentage of metastasis area over total tissue area. Primary BrCa tissue arrays were analysed counting the number of N-Cadherin
+ cells on total surface. All histomorphometric analyses were performed using the software Fiji
® by ImageJ (version 1.53).
2.15. Osteoblast/BrCa Cells Coculture Assay
Mouse primary calvarial osteoblasts were MACS-sorted into SNOs or NON-SNOs using anti-N-Cadherin-biotin antibody and Streptavidin-conjugated magnetic microbeads, as described above. For the knock-down experiment, MACS-sorted MDA cells were incubated with CDH2- or Scramble (SCR)-siRNA for 48 h before proceeding with the coculture. 7 × 10⁴–1 × 10⁵ sorted cells were seeded in 96-well plates and incubated overnight in a humidified CO2 incubator (5% CO2, 37 °C). The day after, the MDAGFP or the 4T1GFP, MACS-sorted into N-CadherinHigh and N-CadherinLow or Notch2High and Notch2Low, or the non-sorted 4T1Cdh2-KO-GFP and 4T1Cdh2-Res-GFP were seeded on SNO or NON-SNO monolayers as above. After 1 h, cultures were extensively washed and the number of GFP+ cells were counted using an Olympus IX inverted fluorescence microscope. The counting was repeated after 24, 48, 72 h. BrCa cell density in the cocultures were 1 × 10³ for MDAGFP cells and 1 × 10² for 4T1GFP cells.
2.16. Primary and Secondary Mammosphere Formation Assay
Primary mammosphere assays were performed using 8 × 10³ suspended cells seeded in non-adhesive Petri dishes with serum-free DMEM, supplemented with 1% N2, 1% B27, 1% penicillin/streptomycin and 1% L-glutamine. They were incubated for 6 days in a humidified CO2 incubator. For secondary mammospheres, the primary mammospheres were disaggregated using trypsin to obtain single-cell suspensions and cultured again under the same conditions. Imaging for the analysis was performed using the SXView Software (version 2.2.0.172). Mammosphere volume was calculated using the formula:
2.17. TaqMan™ Array Mouse Stem Cell Pluripotency
Two micrograms of total RNA isolated from 4T1Cdh2KO-GFP and the 4T1Cdh2Res-GFP cells were retrotranscribed into cDNA using Revertaid First Strand cDNA Synthesis. Then 200 ng of cDNA per condition were loaded in the TaqMan™ Array Mouse Stem Cell Pluripotency plates (Applied Biosystem cat: 4414080) containing specific Fluorescein Amidite (FAM)-tagged probes for mRNAs involved in mouse stemness and pluripotency. Real-time PCR was performed using the TaqMan™ Fast Advanced Master Mix (Applied Biosystem cat: 4444556). Gene expression was normalized by mouse Gapdh and expressed as fold vs. the 4T1Cdh2KO-GFP. The real-time arrays were run in triplicate.
2.18. Statistical Analyses
Results are expressed as mean ± Standard Deviation (SD). Sample size is indicated in the figure legends. Groups’ comparisons were performed carrying out independent samples Student’s
t-tests and non-linear regression, fitting with F-test when dealing with continuous parameters. Data from RNA dSeq were analysed using a false discovery rate (FDR)-adjusted
p-value. To assess the distributional pattern of the BrCa cells in the bone marrow in relation to the endosteal surface we used a cumulative frequency distribution with Gaussian regression and the F-test. For the ELDA, the
p-value was calculated using a Student’s
t-tests with 95% of confidence [
30]. The statistical methods are indicated in the figure legends and the
p values are indicated in the figures.
4. Discussion
Tumour cell dormancy is an intricate mechanism involving different molecular pathways and cell-cell interactions in accordance with the type of cancer and the microenvironmental signalling [
32]. In our previous work we demonstrated that dormant BrCa cells interact with a specific osteoblast subpopulation, known as spindle-shaped N-Cadherin
High osteoblasts (SNOs), remaining cell cycle arrested due to the Notch2 pathway. Moreover, we demonstrated that dormant BrCa cells compete with HSCs for bone marrow engraftment and endosteal niche colonization thanks to their HSC mimicry features [
12]. In this work, we added a new piece in this complex puzzle showing a potential role of N-Cadherin in the SNO-mediated BrCa cell dormancy and cellular stemness.
The role of N-Cadherin in tumour biology is very complex, and varies according to the cellular context and the type of tumour [
21]. N-cadherin has been reported to induce or suppress tumour development and spreading according to the type of cancer [
22,
24,
25,
26]. In the BrCa context, the role of N-Cadherin is still poorly understood, probably because its function is tightly related to cellular and microenvironmental conditions. Data in the literature demonstrate that the expression of N-Cadherin increases BrCa cell adhesion to the stroma and stimulates motility, enhancing metastatic spread [
15,
25,
26,
33]. In contrast, a recent paper demonstrated that N-Cadherin drives human BrCa dormancy in the bone marrow in association with connexin 43 [
26]. Moreover, in line with our findings, the author showed that N-Cadherin was expressed by the stem compartment of BrCa cells, contributing to the maintenance of the cellular dormancy [
26].
We found the expression of N-Cadherin in the dormant Notch2High MDA BrCa cells, confirming the possible association between N-Cadherin expression and BrCa cellular dormancy. In line with this, MDA cells expressing high level of N-Cadherin showed a lower aggressiveness in the bone microenvironment associated with a lower incidence of osteolytic lesions alongside an increased endosteal niche engraftment, indicating that the N-Cadherin signalling prompted the tumour cells to acquire a dormant-like phenotype. The ability to lodge in proximity of the endosteal niche led us to assume that they were able to interact with the SNOs. Our assumption was confirmed in vitro by experiments showing that MDA cells expressing N-Cadherin were able to interact with SNOs and that the presence of N-Cadherin increased the ability of tumour cells to adhere to SNOs. This observation was further confirmed by the fact that the knock-down of the N-Cadherin expression in MDA cells reduced their ability to adhere to SNOs. Of note, unlike Notch2High cells, the proliferation of the N-CadherinHigh MDA cells in the presence of SNOs was unremarkable, suggesting that N-Cadherin mediates the adhesion of BrCa cells to SNOs, while Notch2 mediates the inhibition of SNO-induced cell proliferation. Accordingly, further analyses confirmed that only about 58% of N-CadherinHigh MDA expressed high levels of Notch2. Altogether these data prompted us to hypothesize that the homophilic N-Cadherin interaction between MDA cells and SNOs is used by tumour cells for engraftment to the endosteal niche, while only a small subpopulation co-expressing Notch2 also acquires the dormant phenotype.
As mentioned, the ability to colonize the endosteal niche and interact with SNOs is a typical feature of HSCs [
10,
19] shared also by the dormant Notch2
High MDA cells [
12]. Intriguingly, although conflicting data about the role of N-cadherin in HSCs are described in literature [
19,
27,
28,
29], Arai et al. demonstrated that N-Cadherin is expressed by HSCs and that its overexpression promotes HSC quiescence [
29]. In agreement with this observation, our data showed that the N-Cadherin expression was associated with the acquisition of a bone marrow-specific cancer stem cell phenotype and HSC like-signature in MDA cells. In fact, we found a higher expression of the canonical HSC markers CXCR4, TIE-2 and CD34 and of the stem cell related markers SOX2 and NANOG in the N-Cadherin
High MDA cells along with a lower cell proliferation rate and a higher ability to form primary and secondary mammospheres. Moreover, in vivo LDA showed a higher stem cell frequency in the N-Cadherin
High MDA cells, further confirming their ability to initiate a new cancer. Interestingly, the analysis of canonical cancer stem cell markers revealed that both N-Cadherin
High and N-Cadherin
Low MDA cells display the typical cancer stem cell phenotype CD44
High/CD24
Low/ALDH
+ [
34]. These findings suggest that N-Cadherin expression identifies a specific subpopulation, expressing HSC- and stem cell-related markers, within the canonical CD44
High/CD24
Low/ALDH
+ cancer stem cell population. These data were in line with the ability of the N-Cadherin
High to colonize the endosteal niche resulting in lower aggressiveness in the bone/bone marrow microenvironment and in the concept that dormant cells should have stem features to initiate a new tumour after their reactivation [
6,
7].
We also performed our experiments using the mouse BrCa cell line 4T1, and were able to establish syngeneic interactions with mouse bone cells in vitro and in vivo. We demonstrated that N-Cadherin is required in 4T1 cells for the interaction with SNOs in vitro. Indeed, the lack of N-Cadherin reverted the impairment of the 4T1 cell proliferation induced by SNOs. On the other hand, the re-expression of the N-Cadherin enhanced the adhesion of 4T1 cells onto SNOs, slowing down their proliferation. On the contrary, in vivo analysis of 4T1 revealed no differences associated with N-Cadherin expression. This was probably because 4T1 are characterised by a strong aggressiveness and extremely high proliferation rate in the bone microenvironment. Interestingly, in 4T1 cells there was no co-expression of N-Cadherin and Notch2, indicating that different signalling pathways could be involved in mouse BrCa cellular dormancy. This was also confirmed by the observation that, unlike MDA cells, 4T1 cells expressing a high level of Notch2 showed a higher proliferation rate when co-cultured with SNOs.
Surprisingly, when we analysed the stem features of 4T1 cells expressing N-Cadherin we found an opposite effect compared to the MDA cells. Indeed, we observed that high N-Cadherin expression was associated with a lower expression of the HSC marker Cxcr4 and the mouse stem related genes Bxdc2, Dnmt3b, Gata4, Grb7, Il6st, Lamb1-1, Lamc1, Nog and Tert, along with a lower ability to form primary and secondary mammospheres. Other HSC markers including Tie-2 and Sca-1 were not expressed by 4T1 cells in our experimental conditions. These results were confirmed using both genetic manipulation of the N-Cadherin and cell sorting for N-Cadherin status.
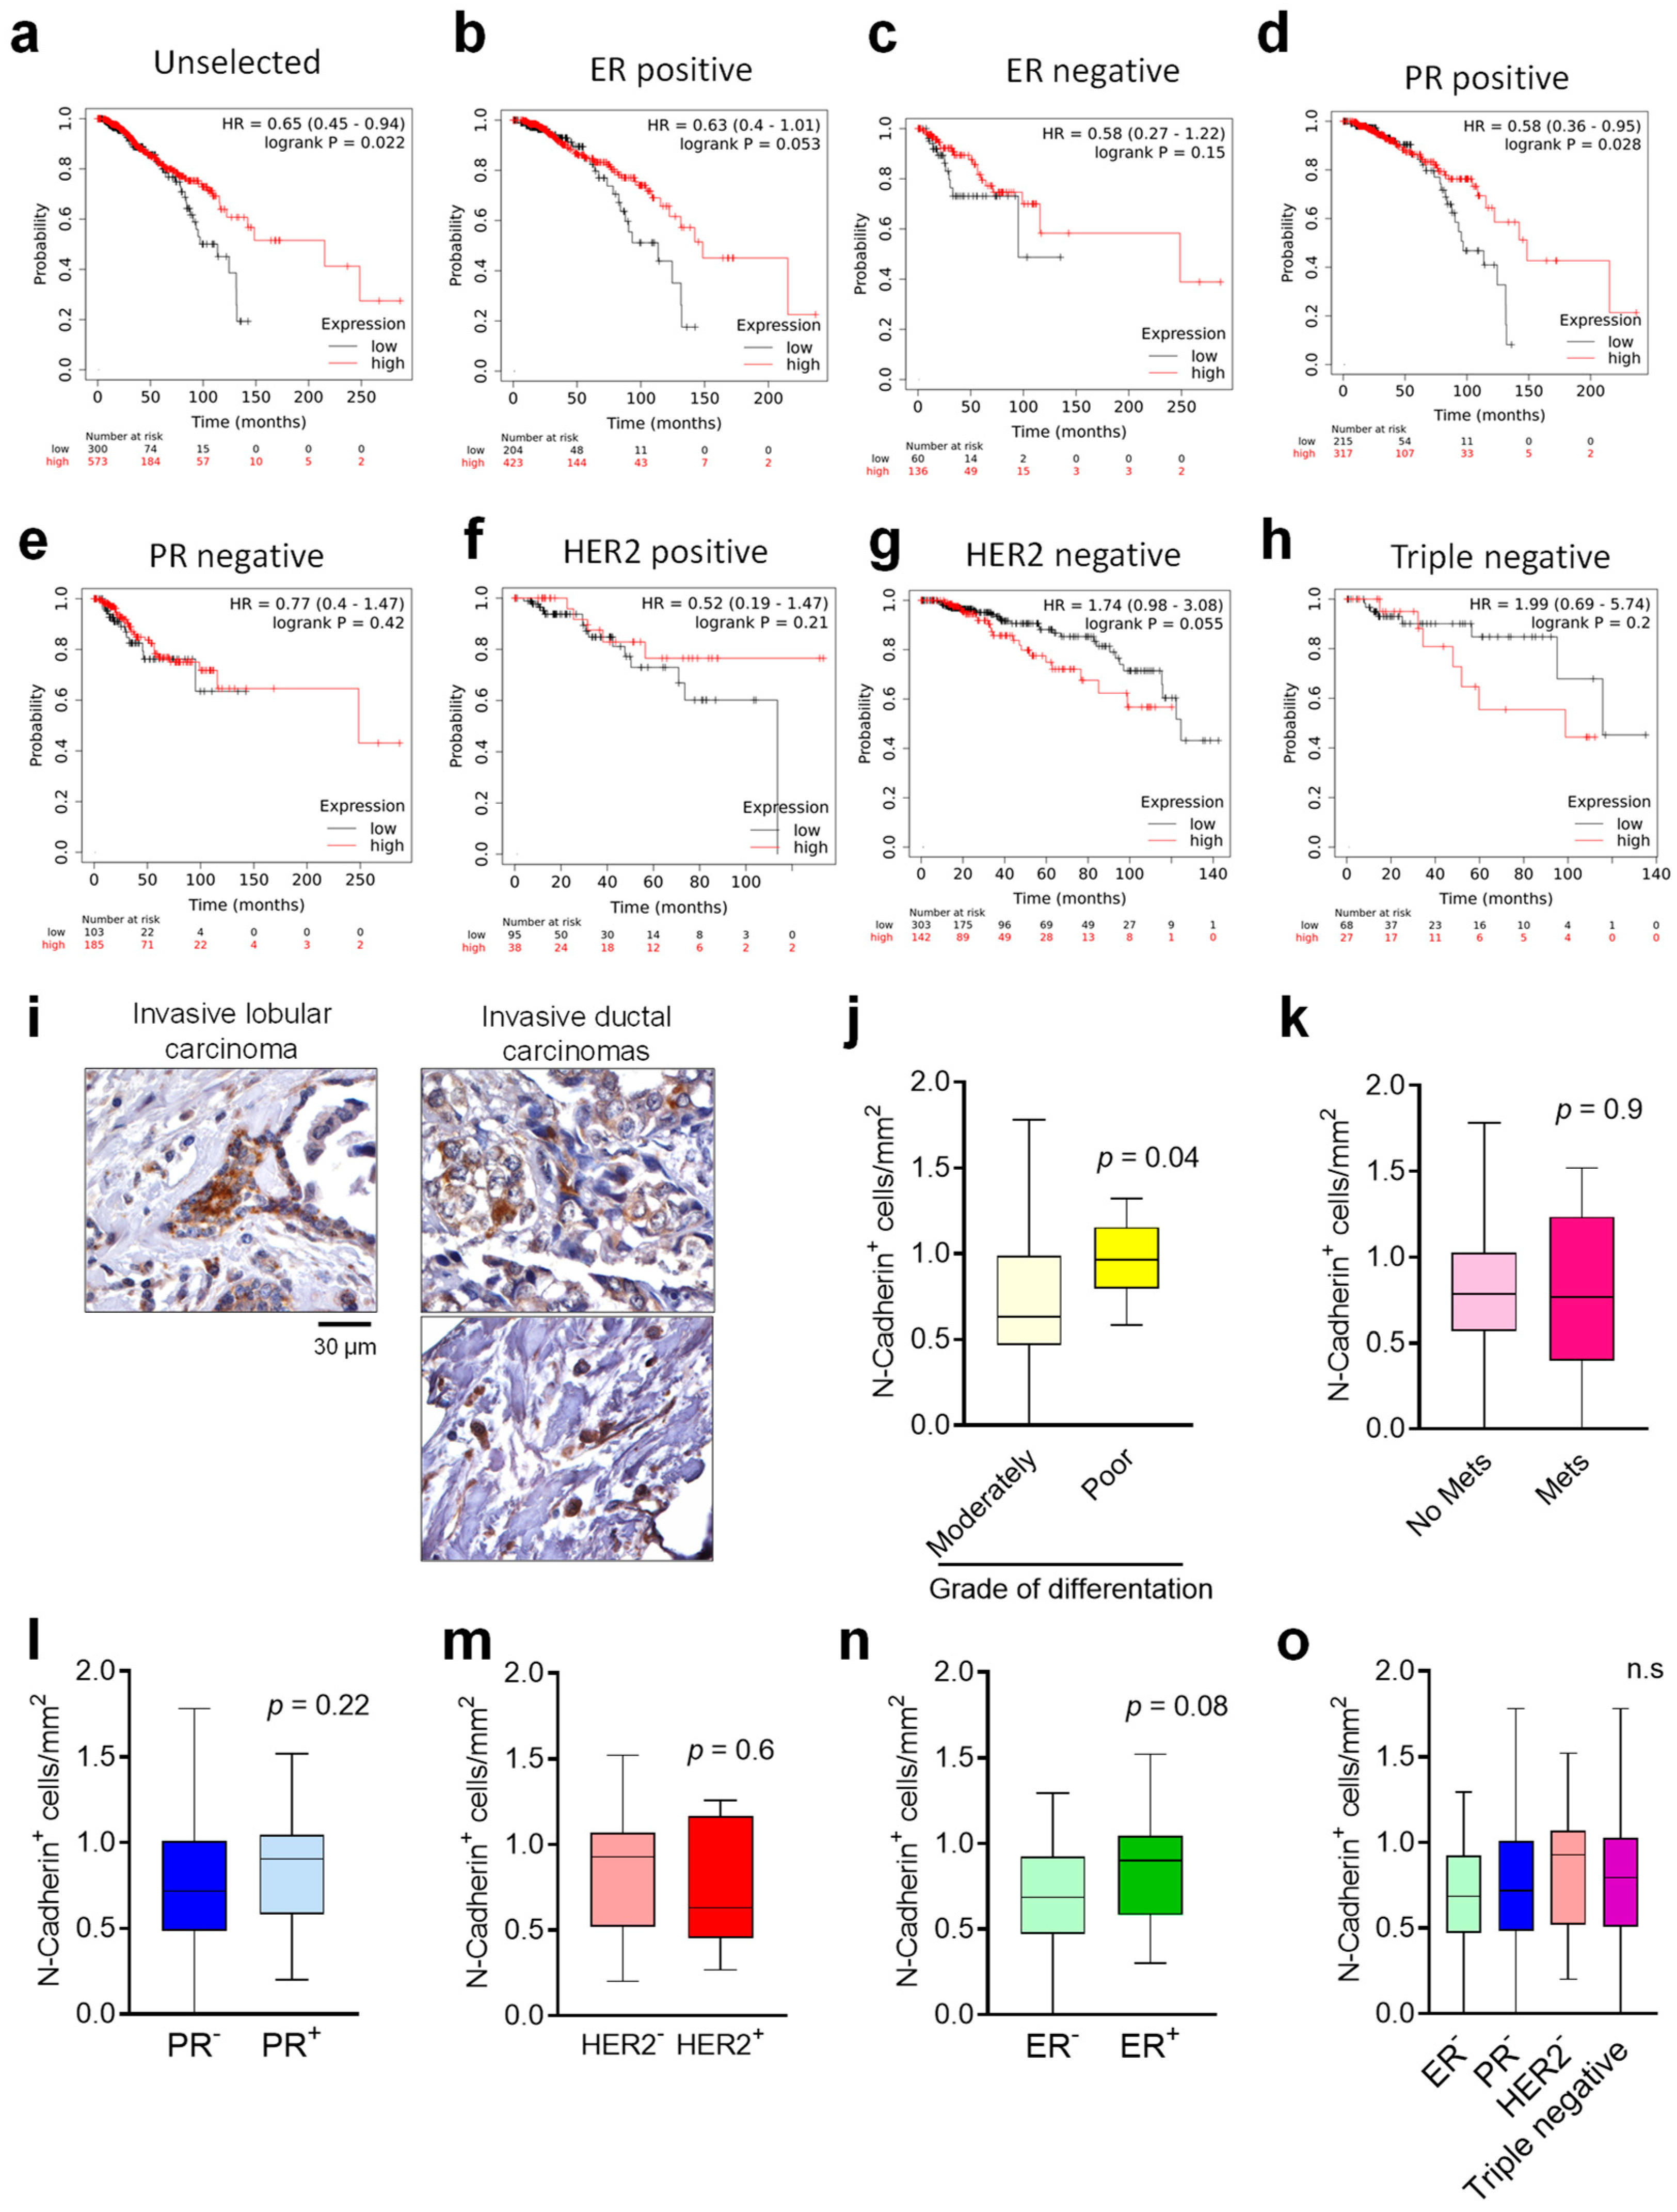
Finally, according to the fact that there are no reliable markers to predict tumour dormancy in clinical practice [
35], we investigated whether N-Cadherin could be useful to this scope. The analyses carried out using public datasets demonstrated that N-Cadherin protein expression in the primary tumour was correlated with a better prognosis in an unselected BrCa patients’ cohort. In line with this, the analyses of a primary BrCa tissues array demonstrated a trend of increase in the number of N-Cadherin positive cells in ER positive tumours, known to be less malignant, suggesting that N-Cadherin expression could be associated with less aggressive human primary tumours. However, we also found a higher number of N-Cadherin-positive cells in primary tumours classified as less differentiated, which are known to be more aggressive [
36]. This is in line with a recent publication showing that N-Cadherin expression in patients with ductal carcinoma in situ is predictive of synchronous invasion [
37]. Another explanation of this conflicting result could be represented by the fact that less differentiated tumour cells usually show a stem-like phenotype. In confirmation, according to our and other’s [
12,
26,
38] results, N-Cadherin is likely to be expressed mainly in the stem cellular compartment. A limitation of this study is that most of the tumours analysed were ductal carcinomas, and that the absence of more differentiated tumours in our BrCa tissue array did not allow a complete correlation analysis between type and differentiation grade of primary tumours and N-Cadherin expression. Moreover, even if our data were generated using triple negative BrCa cell lines, we did not find association between N-Cadherin expression and the overall survival in patients harboring triple negative breast cancers. Similar results were found when we analysed the number of N-Cadherin positive cells in triple negative specimens present in our BrCa tissues array. This could be partially explained by the fact that the number of patients derived from the public dataset carrying a triple negative tumor was relatively low (68 N-Cadherin
Low and 27 N-Cadherin
High samples) and the absence of triple positive specimens in our BrCa tissue array forced us to compare the triple negative samples only with the ER, PR and HER2 single negative tumors.
For this reason, further larger studies are needed to clarify the possible role of N-Cadherin as an early dormancy marker in BrCa patients.


