Author Contributions
Conceptualization, G.H., G.W. and S.T.; methodology, G.H., S.S., C.C., I.R. and T.T.-W.; software, G.H., P.L., S.S., C.C., L.H., S.M. and B.S.; validation, G.H., B.H., T.R.-P., W.B. and S.T.; formal analysis, G.H. and S.S.; investigation, G.H., J.F., M.P., A.W., W.B., G.W., K.R., T.T.-W. and S.T.; resources, G.H., J.F., M.P., A.W., W.B., G.W., K.R., T.T.-W. and S.T.; data curation, G.H., P.L., S.S., B.H., C.C., J.F., A.L., E.N. and T.R.-P.; writing—original draft preparation, G.H., I.R., W.B. and T.T.-W.; writing—review and editing, G.H., P.L., S.S., B.H., C.C., J.F., I.R., A.L., E.N., L.H., S.M., S.G., B.S., B.K., M.P., T.R.-P., A.W., W.B., G.W., K.R., T.T.-W. and S.T.; visualization, G.H., P.L., S.S., B.H., C.C. and J.F.; supervision, G.H., S.G., M.P., W.B., G.W., K.R., T.T.-W. and S.T.; project administration, G.H., W.B., K.R. and S.T.; funding acquisition, G.H. and W.B. All authors have read and agreed to the published version of the manuscript.
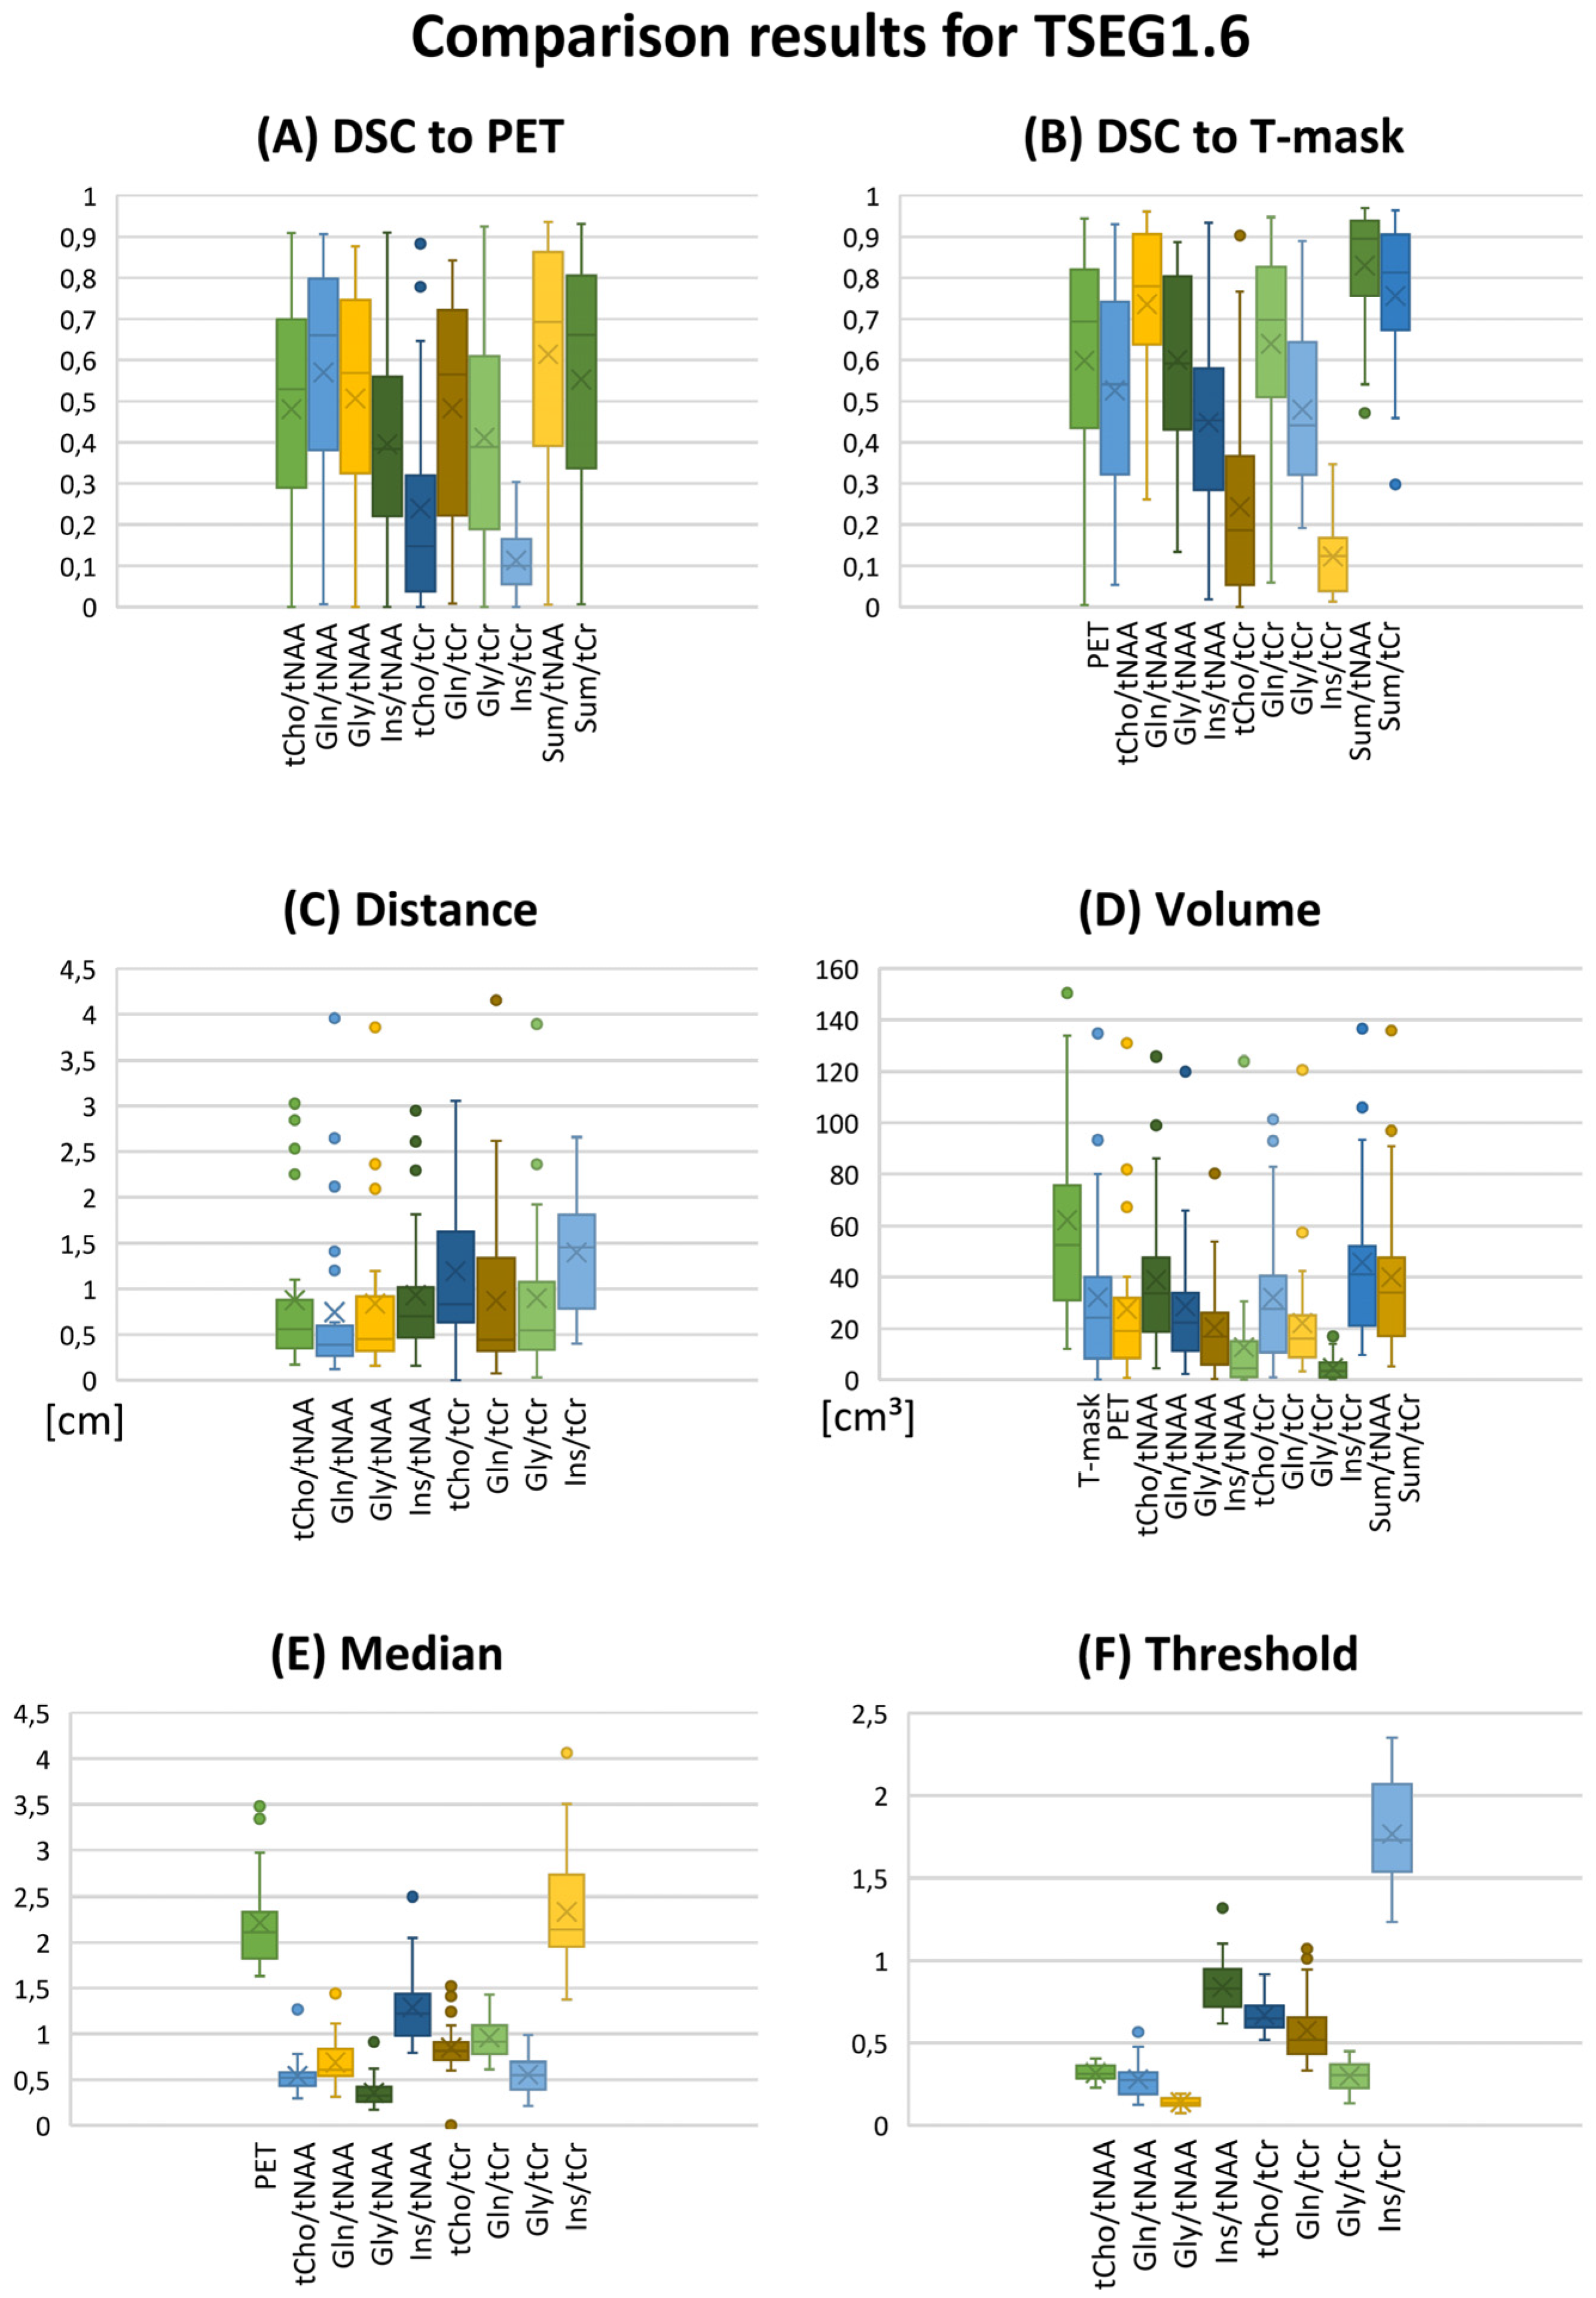
Figure 1.
Overview of evaluation results as boxplots for the TSEG1.6 VOI definition. (A,B) DSCs for the comparison of MRSI ratios to PET and the T-segmentation. (C) CoI distance and (D) VOI volume. (E) Median ratios and (F) the calculated VOI thresholds. Gln/tNAA ratios show the best correspondence to PET. Key to the plot: Cross, mean; line, median; box, 2nd–3rd quartiles; whiskers, 1st and 4th quartiles.
Figure 2.
Histograms of the DCSs between PET TBR and Gln/tNAA for all six VOI definitions add to the finding that the TSEG1.15 and PSEG1.15 cases (A,B) were not as specific as the other two thresholds. The difference between 1.6 (C,D) and 2.0 (E,F) as cutoff appeared smaller.
Figure 2.
Histograms of the DCSs between PET TBR and Gln/tNAA for all six VOI definitions add to the finding that the TSEG1.15 and PSEG1.15 cases (A,B) were not as specific as the other two thresholds. The difference between 1.6 (C,D) and 2.0 (E,F) as cutoff appeared smaller.
Figure 3.
Overview of metabolic ratio images, PET TBR images, and the different applied thresholds, together with tumor segmentation for four patients. Heterogeneity between the different ratio maps is quite visible, as are the differences between cutoff values. The actual evaluation as performed only within the defined tumor segmentations is shown in green. PET maps were resampled to MRSI resolution.
Figure 4.
Example images of a patient with a high intratumoral correspondence between PET and MRSI ratios to tNAA (DSCs for TSEG1.6: 0.91/0.89/0.88/0.54 for tCho/Gln/Gly/Ins). Notably, the difference between the 1.6 and 2.0 cutoffs for the MRSI ratios is minimal. The actual evaluation as performed only within the defined tumor segmentations is shown in green. PET maps were resampled to MRSI resolution. Red lines indicate slice positions.
Figure 5.
Example images of a patient with a low-to-moderate intratumoral correspondence between PET and MRSI ratios to tCr. While Gln/tCr and Gly/tCr align most directly with MET (DSCs for TSEG1.6: 0.59 and 0.55), tCho/tCr extends clearly beyond (DSC for TSEG1.6: 0.25), and Ins/tCr is located only more basally (DSC for TSEG1.6: 0.13). The actual evaluation as performed only within the defined tumor segmentations is shown in green. PET maps were resampled to MRSI resolution.
Figure 6.
Correlation matrix for the TSEG1.6 VOI. An expected negative correlation between distance and the other parameters is the most visible feature. All correlation matrices are presented with higher readability in the
supplementary data.
Figure 6.
Correlation matrix for the TSEG1.6 VOI. An expected negative correlation between distance and the other parameters is the most visible feature. All correlation matrices are presented with higher readability in the
supplementary data.
Table 1.
Patient cohort overview.
Table 1.
Patient cohort overview.
| Patient | Classification [WHO 2021] | Age | Sex | PET | IDH | TERT | MGMT Methylation | 1p/19q Codeletion | CDKN2A/B hom.loss |
|---|
| 1 | Astrocytoma grade 4 | 51 | male | MET | IDH1 | C250T | yes | no | no |
| 2 | Astrocytoma grade 3 | 46 | female | MET | IDH1 | no | yes | no | no |
| 3 | Astrocytoma grade 3 | 29 | male | MET | IDH1 | no | yes | no | no |
| 4 | Glioblastoma grade 4 | 52 | male | FET | WT | no | yes | N/A | N/A |
| 5 | Astrocytoma grade 2 | 33 | male | FET | IDH1 | no | yes | no | no |
| 6 | Astrocytoma grade 2 | 77 | female | FET | IDH1 | no | yes | no | no |
| 7 | Glioblastoma grade 4 | 65 | female | MET | WT | C228T | no | N/A | N/A |
| 8 | Oligodendroglioma grade 3 | 51 | male | FET | IDH1 | C228T | yes | yes | no |
| 9 | Astrocytoma grade 3 | 62 | male | MET | IDH1 | no | yes | no | no |
| 10 | Diffuse hemispheric glioma grade 4 | 30 | female | FET | WT | no | yes | no | yes |
| 11 | Astrocytoma grade 2 | 34 | male | MET | IDH1 | no | yes | no | no |
| 12 | Oligodendroglioma grade 3 | 56 | male | FET | IDH1 | N/A | yes | yes | yes |
| 13 | Astrocytoma grade 3 | 28 | female | MET | IDH1 | no | yes | no | no |
| 14 | Oligodendroglioma grade 2 | 50 | female | MET | IDH1 | no | yes | yes | no |
| 15 | Oligodendroglioma grade 2 | 38 | female | FET | IDH1 | no | yes | yes | no |
| 16 | Oligodendroglioma grade 2 | 61 | male | FET | IDH1 | C250T | yes | yes | no |
| 17 | Astrocytoma grade 2 | 33 | male | MET | IDH1 | no | no | no | no |
| 18 | Glioblastoma grade 4 | 58 | male | FET | WT | N/A | no | N/A | N/A |
| 19 | Oligodendroglioma grade 3 | 57 | female | FET | IDH1 | N/A | yes | yes | N/A |
| 20 | Astrocytoma grade 3 | 40 | male | FET | IDH1 | no | yes | no | no |
| 21 | Glioblastoma grade 4 | 58 | male | FET | WT | N/A | N/A | N/A | N/A |
| 22 | Astrocytoma grade 4 | 26 | female | FET | IDH1 | no | yes | no | yes |
| 23 | Glioblastoma grade 4 | 59 | male | FET | WT | N/A | yes | N/A | N/A |
| 24 | Glioblastoma grade 4 | 46 | female | FET | WT | no | no | no | yes |
Table 2.
DSCs to PET over all ratios and VOI thresholds.
Table 2.
DSCs to PET over all ratios and VOI thresholds.
| DSC to PET | tCho/tNAA | Gln/tNAA | Gly/tNAA | Ins/tNAA | Sum/tNAA | tCho/tCr | Gln/tCr | Gly/TCr | Ins/tCr | Sum/tCr |
|---|
| TSEG1.15 | 0.71 ± 0.40 | 0.82 ± 0.27 | 0.67 ± 0.28 | 0.67 ± 0.39 | 0.90 ± 0.17 | 0.42 ± 0.34 | 0.80 ± 0.34 | 0.58 ± 0.23 | 0.33 ± 0.22 | 0.90 ± 0.27 |
| TSEG1.6 | 0.53 ± 0.36 | 0.66 ± 0.40 | 0.57 ± 0.36 | 0.38 ± 0.31 | 0.69 ± 0.43 | 0.15 ± 0.24 | 0.56 ± 0.40 | 0.39 ± 0.38 | 0.10 ± 0.09 | 0.66 ± 0.42 |
| TSEG2.0 | 0.36 ± 0.54 | 0.49 ± 0.52 | 0.43 ± 0.52 | 0.28 ± 0.33 | 0.49 ± 0.56 | 0.09 ± 0.20 | 0.38 ± 0.47 | 0.27 ± 0.48 | 0.05 ± 0.06 | 0.43 ± 0.50 |
| PSEG1.15 | 0.51 ± 0.30 | 0.73 ± 0.19 | 0.52 ± 0.18 | 0.55 ± 0.20 | 0.80 ± 0.12 | 0.25 ± 0.15 | 0.71 ± 0.17 | 0.44 ± 0.17 | 0.26 ± 0.20 | 0.80 ± 0.17 |
| PSEG1.6 | 0.32 ± 0.27 | 0.52 ± 0.31 | 0.39 ± 0.23 | 0.31 ± 0.26 | 0.56 ± 0.29 | 0.12 ± 0.09 | 0.45 ± 0.32 | 0.29 ± 0.20 | 0.10 ± 0.08 | 0.51 ± 0.33 |
| PSEG2.0 | 0.25 ± 0.35 | 0.30 ± 0.34 | 0.31 ± 0.34 | 0.19 ± 0.24 | 0.30 ± 0.34 | 0.07 ± 0.09 | 0.26 ± 0.34 | 0.20 ± 0.28 | 0.04 ± 0.04 | 0.30 ± 0.34 |
| | Medians and IQRs over all patients | | | | | |
Table 3.
DSCs to the T-Segmentation over all ratios and VOI thresholds.
Table 3.
DSCs to the T-Segmentation over all ratios and VOI thresholds.
| DSC to T-Mask | PET TBR | tCho/tNAA | Gln/tNAA | Gly/tNAA | Ins/tNAA | Sum/tNAA | tCho/tCr | Gln/tCr | Gly/tCr | Ins/tCr | Sum/tCr |
|---|
| TSEG1.15 | 0.90 ± 0.25 | 0.67 ± 0.30 | 0.85 ± 0.22 | 0.71 ± 0.30 | 0.67 ± 0.20 | 0.92 ± 0.11 | 0.38 ± 0.37 | 0.79 ± 0.18 | 0.59 ± 0.30 | 0.30 ± 0.21 | 0.92 ± 0.15 |
| TSEG1.6 | 0.69 ± 0.35 | 0.54 ± 0.37 | 0.78 ± 0.26 | 0.59 ± 0.33 | 0.45 ± 0.27 | 0.90 ± 0.18 | 0.19 ± 0.25 | 0.70 ± 0.30 | 0.44 ± 0.30 | 0.12 ± 0.11 | 0.81 ± 0.22 |
| TSEG2.0 | 0.46 ± 0.54 | 0.46 ± 0.37 | 0.74 ± 0.30 | 0.54 ± 0.31 | 0.32 ± 0.23 | 0.85 ± 0.22 | 0.09 ± 0.17 | 0.62 ± 0.35 | 0.37 ± 0.22 | 0.06 ± 0.06 | 0.71 ± 0.30 |
| PSEG1.15 | 0.34 ± 0.18 | 0.42 ± 0.19 | 0.39 ± 0.19 | 0.39 ± 0.14 | 0.35 ± 0.17 | 0.38 ± 0.14 | 0.29 ± 0.27 | 0.39 ± 0.19 | 0.35 ± 0.14 | 0.23 ± 0.14 | 0.38 ± 0.14 |
| PSEG1.6 | 0.42 ± 0.31 | 0.41 ± 0.27 | 0.41 ± 0.20 | 0.38 ± 0.18 | 0.33 ± 0.20 | 0.42 ± 0.17 | 0.17 ± 0.24 | 0.35 ± 0.21 | 0.31 ± 0.18 | 0.10 ± 0.09 | 0.39 ± 0.18 |
| PSEG2.0 | 0.39 ± 0.43 | 0.40 ± 0.30 | 0.42 ± 0.24 | 0.38 ± 0.22 | 0.26 ± 0.20 | 0.42 ± 0.19 | 0.08 ± 0.16 | 0.34 ± 0.24 | 0.26 ± 0.19 | 0.05 ± 0.05 | 0.37 ± 0.18 |
| | Medians and IQRs over all patients | | | | | | | |
Table 4.
CoI distances of MRSI to PET over all ratios and VOI thresholds.
Table 4.
CoI distances of MRSI to PET over all ratios and VOI thresholds.
| CoI Distance [cm] | tCho/tNAA | Gln/tNAA | Gly/tNAA | Ins/tNAA | tCho/tCr | Gln/tCr | Gly/tCr | Ins/tCr |
|---|
| TSEG1.15 | 0.36 ± 0.32 | 0.21 ± 0.30 | 0.34 ± 0.26 | 0.34 ± 0.36 | 0.63 ± 0.46 | 0.24 ± 0.36 | 0.33 ± 0.29 | 0.81 ± 0.43 |
| TSEG1.6 | 0.56 ± 0.43 | 0.39 ± 0.22 | 0.45 ± 0.48 | 0.70 ± 0.46 | 0.84 ± 0.91 | 0.44 ± 0.94 | 0.55 ± 0.67 | 1.46 ± 0.97 |
| TSEG2.0 | 0.71 ± 0.68 | 0.63 ± 0.92 | 0.61 ± 1.04 | 0.97 ± 0.85 | 0.93 ± 0.96 | 0.71 ± 0.90 | 0.70 ± 1.31 | 1.43 ± 1.14 |
| PSEG1.15 | 0.52 ± 0.45 | 0.33 ± 0.25 | 0.32 ± 0.24 | 0.48 ± 0.50 | 0.73 ± 0.72 | 0.28 ± 0.31 | 0.41 ± 0.30 | 0.67 ± 0.52 |
| PSEG1.6 | 0.65 ± 0.98 | 0.54 ± 0.76 | 0.57 ± 0.68 | 0.83 ± 0.88 | 1.24 ± 1.05 | 0.59 ± 0.74 | 0.81 ± 1.18 | 1.42 ± 1.06 |
| PSEG2.0 | 1.01 ± 1.33 | 0.97 ± 0.92 | 1.11 ± 1.27 | 1.17 ± 1.12 | 1.55 ± 1.48 | 1.07 ± 0.80 | 1.32 ± 1.30 | 1.74 ± 1.42 |
| | Medians and IQRs over all patients | | | | |
Table 5.
VOI volumes for all ratios and VOI thresholds.
Table 5.
VOI volumes for all ratios and VOI thresholds.
| Volume [cm3] | T-Mask | PET | tCho/tNAA | Gln/tNAA | Gly/tNAA | Ins/tNAA | Sum/tNAA | tCho/tCr | Gln/tCr | Gly/TCr | Ins/tCr | Sum/tCr |
|---|
| TSEG1.15 | 52.47 ± 41.99 | 33.57 ± 40.25 | 29.67 ± 33.45 | 35.81 ± 24.91 | 23.96 ± 22.64 | 28.32 ± 17.89 | 43.90 ± 29.00 | 11.93 ± 23.03 | 30.78 ± 27.01 | 21.99 ± 22.15 | 11.24 ± 17.01 | 43.47 ± 29.96 |
| TSEG1.6 | 52.47 ± 41.99 | 24.33 ± 30.46 | 19.08 ± 23.10 | 33.68 ± 24.60 | 22.38 ± 18.49 | 16.90 ± 15.86 | 41.09 ± 27.49 | 4.52 ± 12.36 | 27.63 ± 26.92 | 16.13 ± 14.06 | 3.44 ± 5.46 | 33.90 ± 28.71 |
| TSEG2.0 | 52.47 ± 41.99 | 13.28 ± 23.96 | 14.01 ± 20.69 | 25.59 ± 23.22 | 21.07 ± 17.00 | 11.32 ± 12.70 | 35.59 ± 22.03 | 1.89 ± 6.63 | 22.89 ± 24.26 | 13.30 ± 11.21 | 1.75 ± 1.93 | 26.94 ± 20.85 |
| PSEG1.15 | 52.47 ± 41.99 | 180.44 ± 125.94 | 84.21 ± 62.99 | 132.53 ± 84.20 | 83.40 ± 54.22 | 88.38 ± 53.65 | 192.18 ± 127.82 | 39.17 ± 34.25 | 122.92 ± 62.23 | 77.65 ± 51.67 | 47.15 ± 29.39 | 166.14 ± 121.33 |
| PSEG1.6 | 52.47 ± 41.99 | 80.06 ± 100.20 | 37.97 ± 42.01 | 102.68 ± 60.21 | 65.22 ± 46.68 | 42.88 ± 33.70 | 148.49 ± 87.73 | 11.91 ± 14.72 | 88.49 ± 61.38 | 51.02 ± 41.27 | 13.32 ± 12.00 | 118.15 ± 67.73 |
| PSEG2.0 | 52.47 ± 41.99 | 26.10 ± 57.49 | 25.06 ± 31.31 | 77.43 ± 58.93 | 48.11 ± 41.48 | 25.86 ± 21.01 | 114.87 ± 68.43 | 6.98 ± 8.46 | 62.26 ± 52.46 | 36.45 ± 31.54 | 7.07 ± 5.92 | 84.29 ± 49.31 |
| | Medians and IQRs over all patients | | | | | | | |
Table 6.
VOI medians for all ratios and VOI thresholds.
Table 6.
VOI medians for all ratios and VOI thresholds.
| Medians | PET TBR | tCho/tNAA | Gln/tNAA | Gly/tNAA | Ins/tNAA | tCho/tCr | Gln/tCr | Gly/tCr | Ins/tCr |
|---|
| TSEG1.15 | 1.86 ± 0.53 | 0.45 ± 0.14 | 0.59 ± 0.31 | 0.27 ± 0.17 | 0.90 ± 0.36 | 0.60 ± 0.11 | 0.82 ± 0.28 | 0.41 ± 0.23 | 1.49 ± 0.37 |
| TSEG1.6 | 2.11 ± 0.42 | 0.52 ± 0.13 | 0.61 ± 0.25 | 0.33 ± 0.15 | 1.22 ± 0.36 | 0.83 ± 0.17 | 0.91 ± 0.29 | 0.55 ± 0.27 | 2.14 ± 0.73 |
| TSEG2.0 | 2.42 ± 0.30 | 0.63 ± 0.14 | 0.68 ± 0.27 | 0.36 ± 0.14 | 1.42 ± 0.50 | 1.17 ± 0.39 | 1.01 ± 0.26 | 0.66 ± 0.30 | 2.88 ± 0.95 |
| PSEG1.15 | 1.59 ± 0.27 | 0.33 ± 0.07 | 0.40 ± 0.10 | 0.21 ± 0.10 | 0.79 ± 0.22 | 0.57 ± 0.25 | 0.69 ± 0.25 | 0.40 ± 0.18 | 1.45 ± 0.38 |
| PSEG1.6 | 1.88 ± 0.27 | 0.47 ± 0.11 | 0.45 ± 0.13 | 0.26 ± 0.12 | 1.11 ± 0.31 | 0.85 ± 0.27 | 0.85 ± 0.26 | 0.54 ± 0.24 | 2.20 ± 0.71 |
| PSEG2.0 | 2.29 ± 0.27 | 0.59 ± 0.14 | 0.54 ± 0.15 | 0.32 ± 0.13 | 1.42 ± 0.43 | 1.14 ± 0.43 | 1.06 ± 0.27 | 0.69 ± 0.28 | 3.04 ± 1.08 |
| | Medians and IQRs over all patients | | | | |
Table 7.
Explicit VOI thresholds for all ratios and VOI threshold definitions.
Table 7.
Explicit VOI thresholds for all ratios and VOI threshold definitions.
| Threshold | PET TBR | tCho/tNAA | Gln/tNAA | Gly/tNAA | Ins/tNAA | tCho/tCr | Gln/tCr | Gly/tCr | Ins/tCr |
|---|
| T/PSEG1.15 | 1.15 | 0.22 ± 0.05 | 0.20 ± 0.09 | 0.10 ± 0.03 | 0.60 ± 0.16 | 0.47 ± 0.09 | 0.37 ± 0.14 | 0.22 ± 0.10 | 1.24 ± 0.29 |
| T/PSEG1.6 | 1.60 | 0.31 ± 0.07 | 0.28 ± 0.13 | 0.14 ± 0.04 | 0.83 ± 0.22 | 0.65 ± 0.12 | 0.52 ± 0.20 | 0.31 ± 0.14 | 1.73 ± 0.41 |
| T/PSEG2.0 | 2.00 | 0.39 ± 0.09 | 0.34 ± 0.16 | 0.17 ± 0.05 | 1.04 ± 0.28 | 0.81 ± 0.16 | 0.65 ± 0.25 | 0.65 ± 0.25 | 2.16 ± 0.51 |
| | Medians and IQRs over all patients | | | | | |


 ,
, 


