
Sequential and Hybrid PET/MRI Acquisition in Follow-Up Examination of Glioblastoma Show Similar Diagnostic Performance
 , , , , and
Abstract
:Simple Summary
Abstract
1. Introduction
2. Materials and Methods
2.1. Patient Selection
2.2. Imaging Data
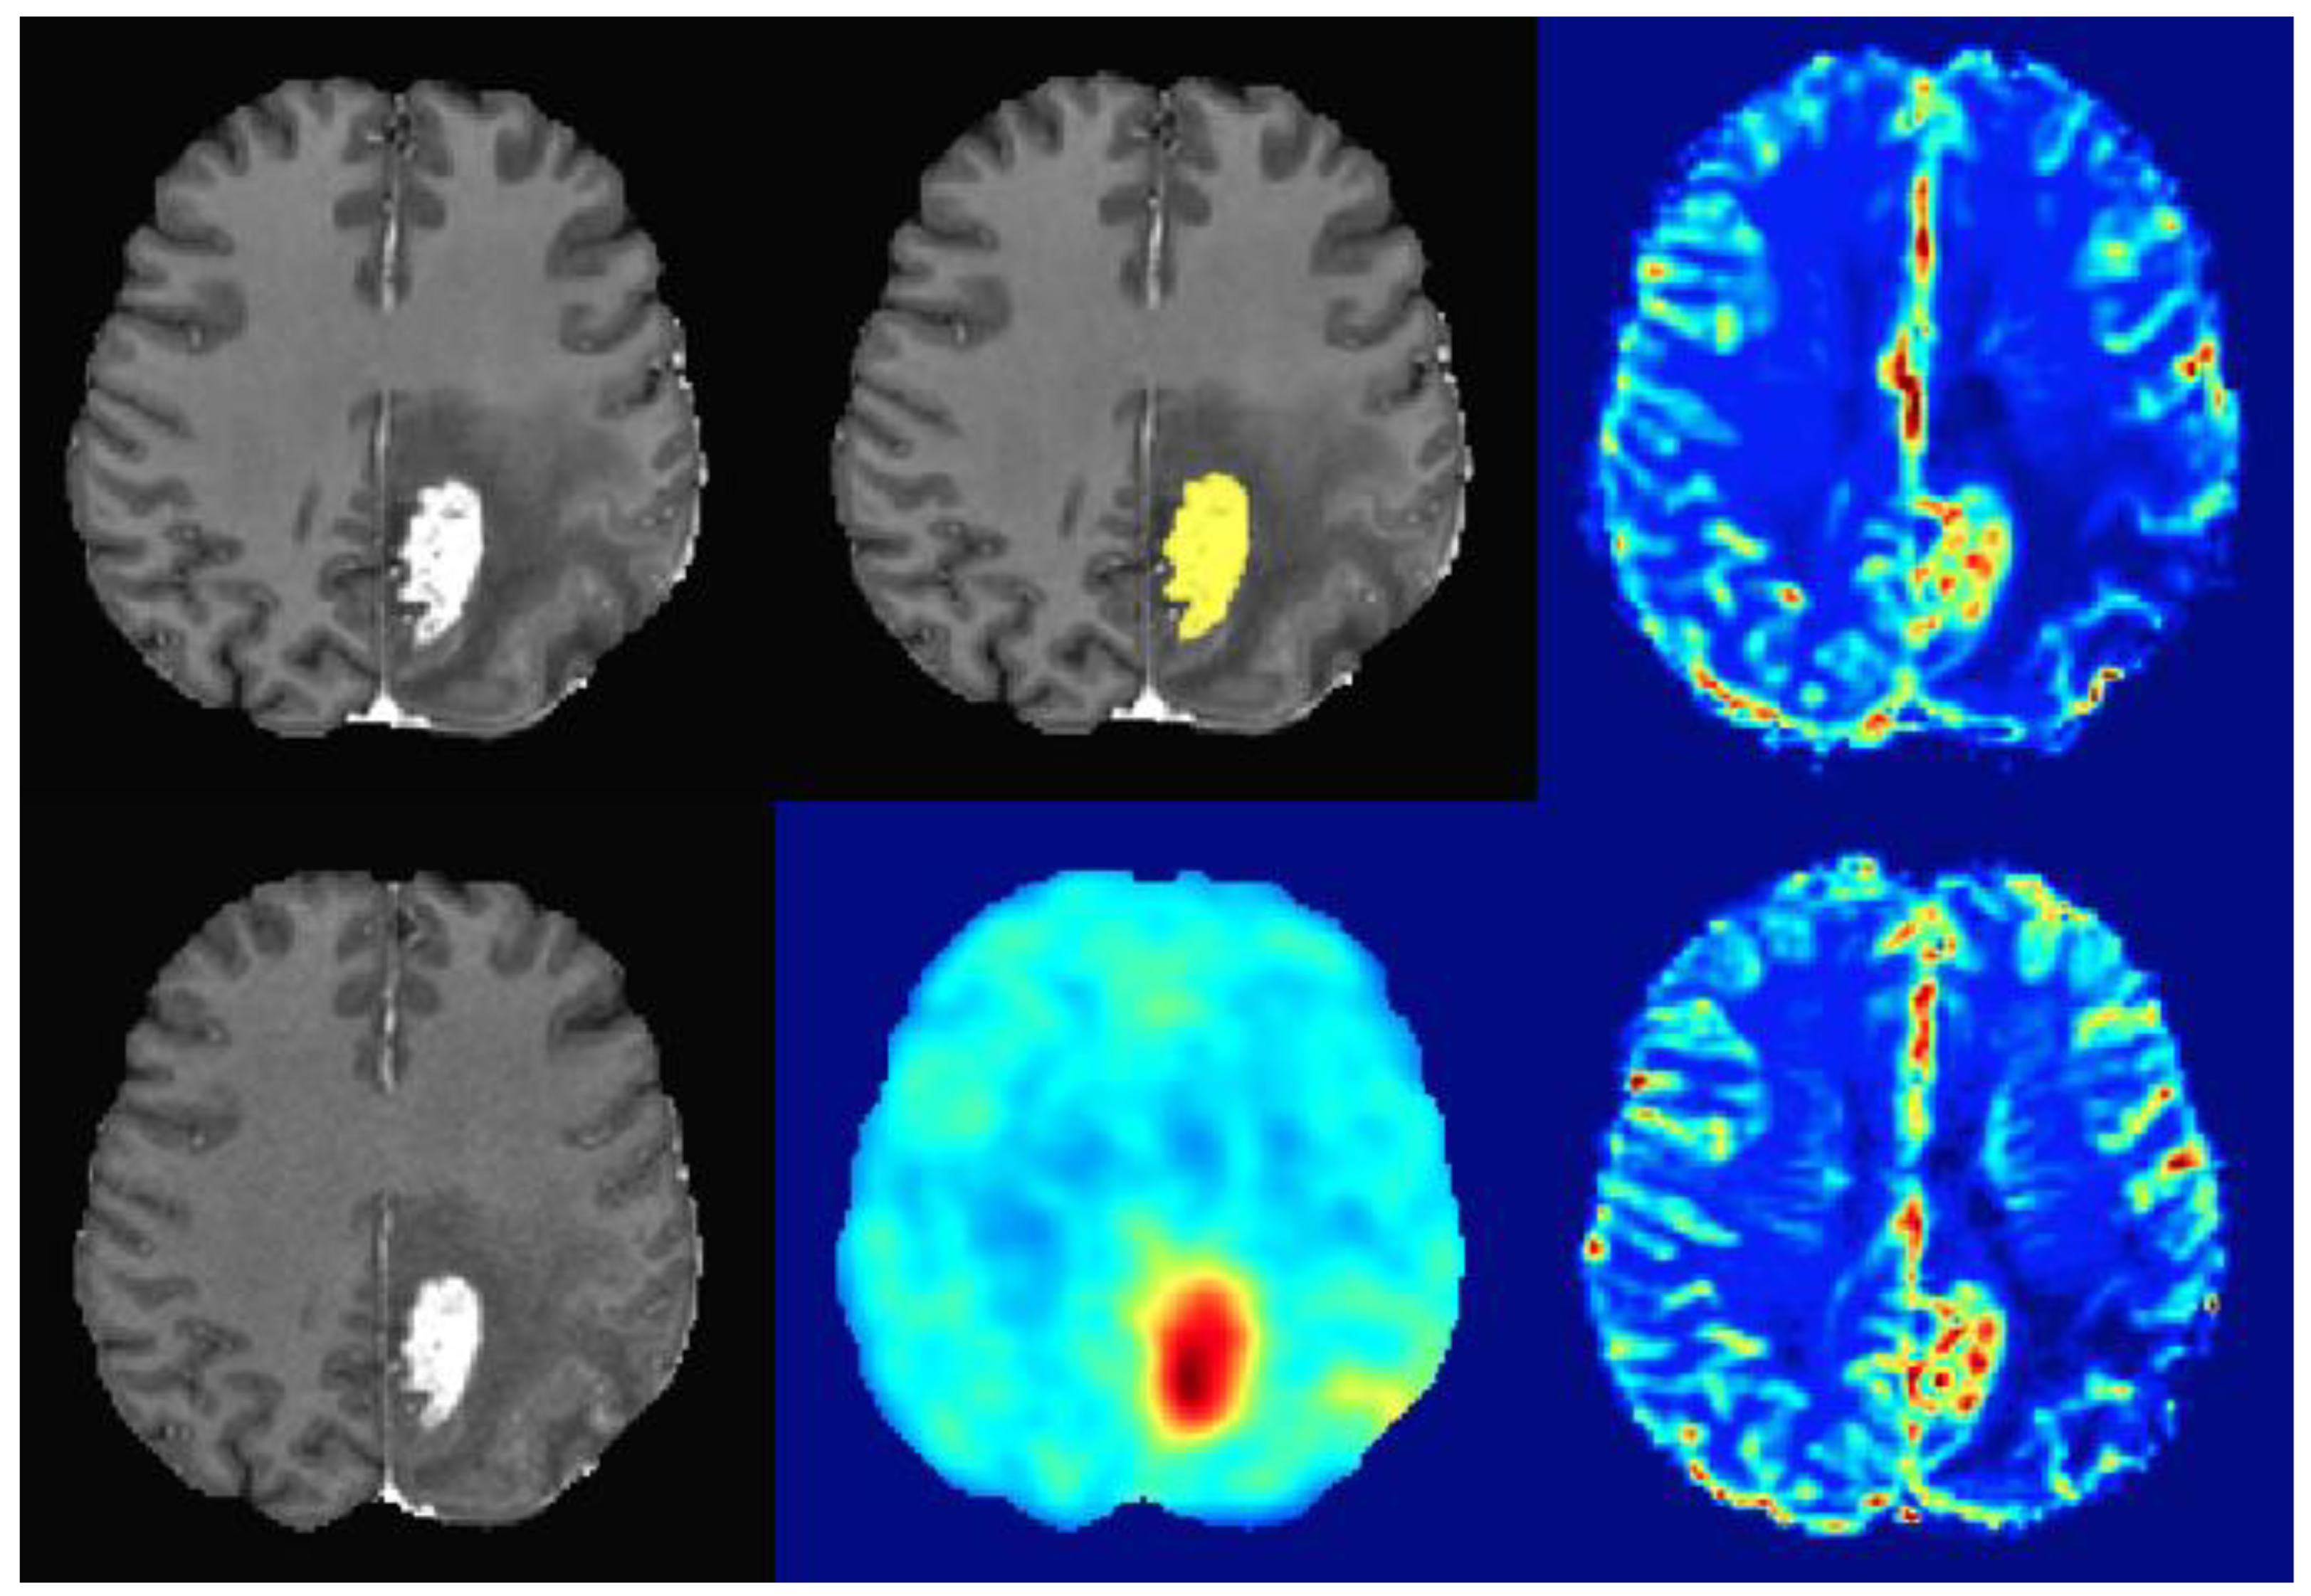
2.3. Image Analysis
2.4. Statistical Analysis
3. Results
3.1. Patient Cohort
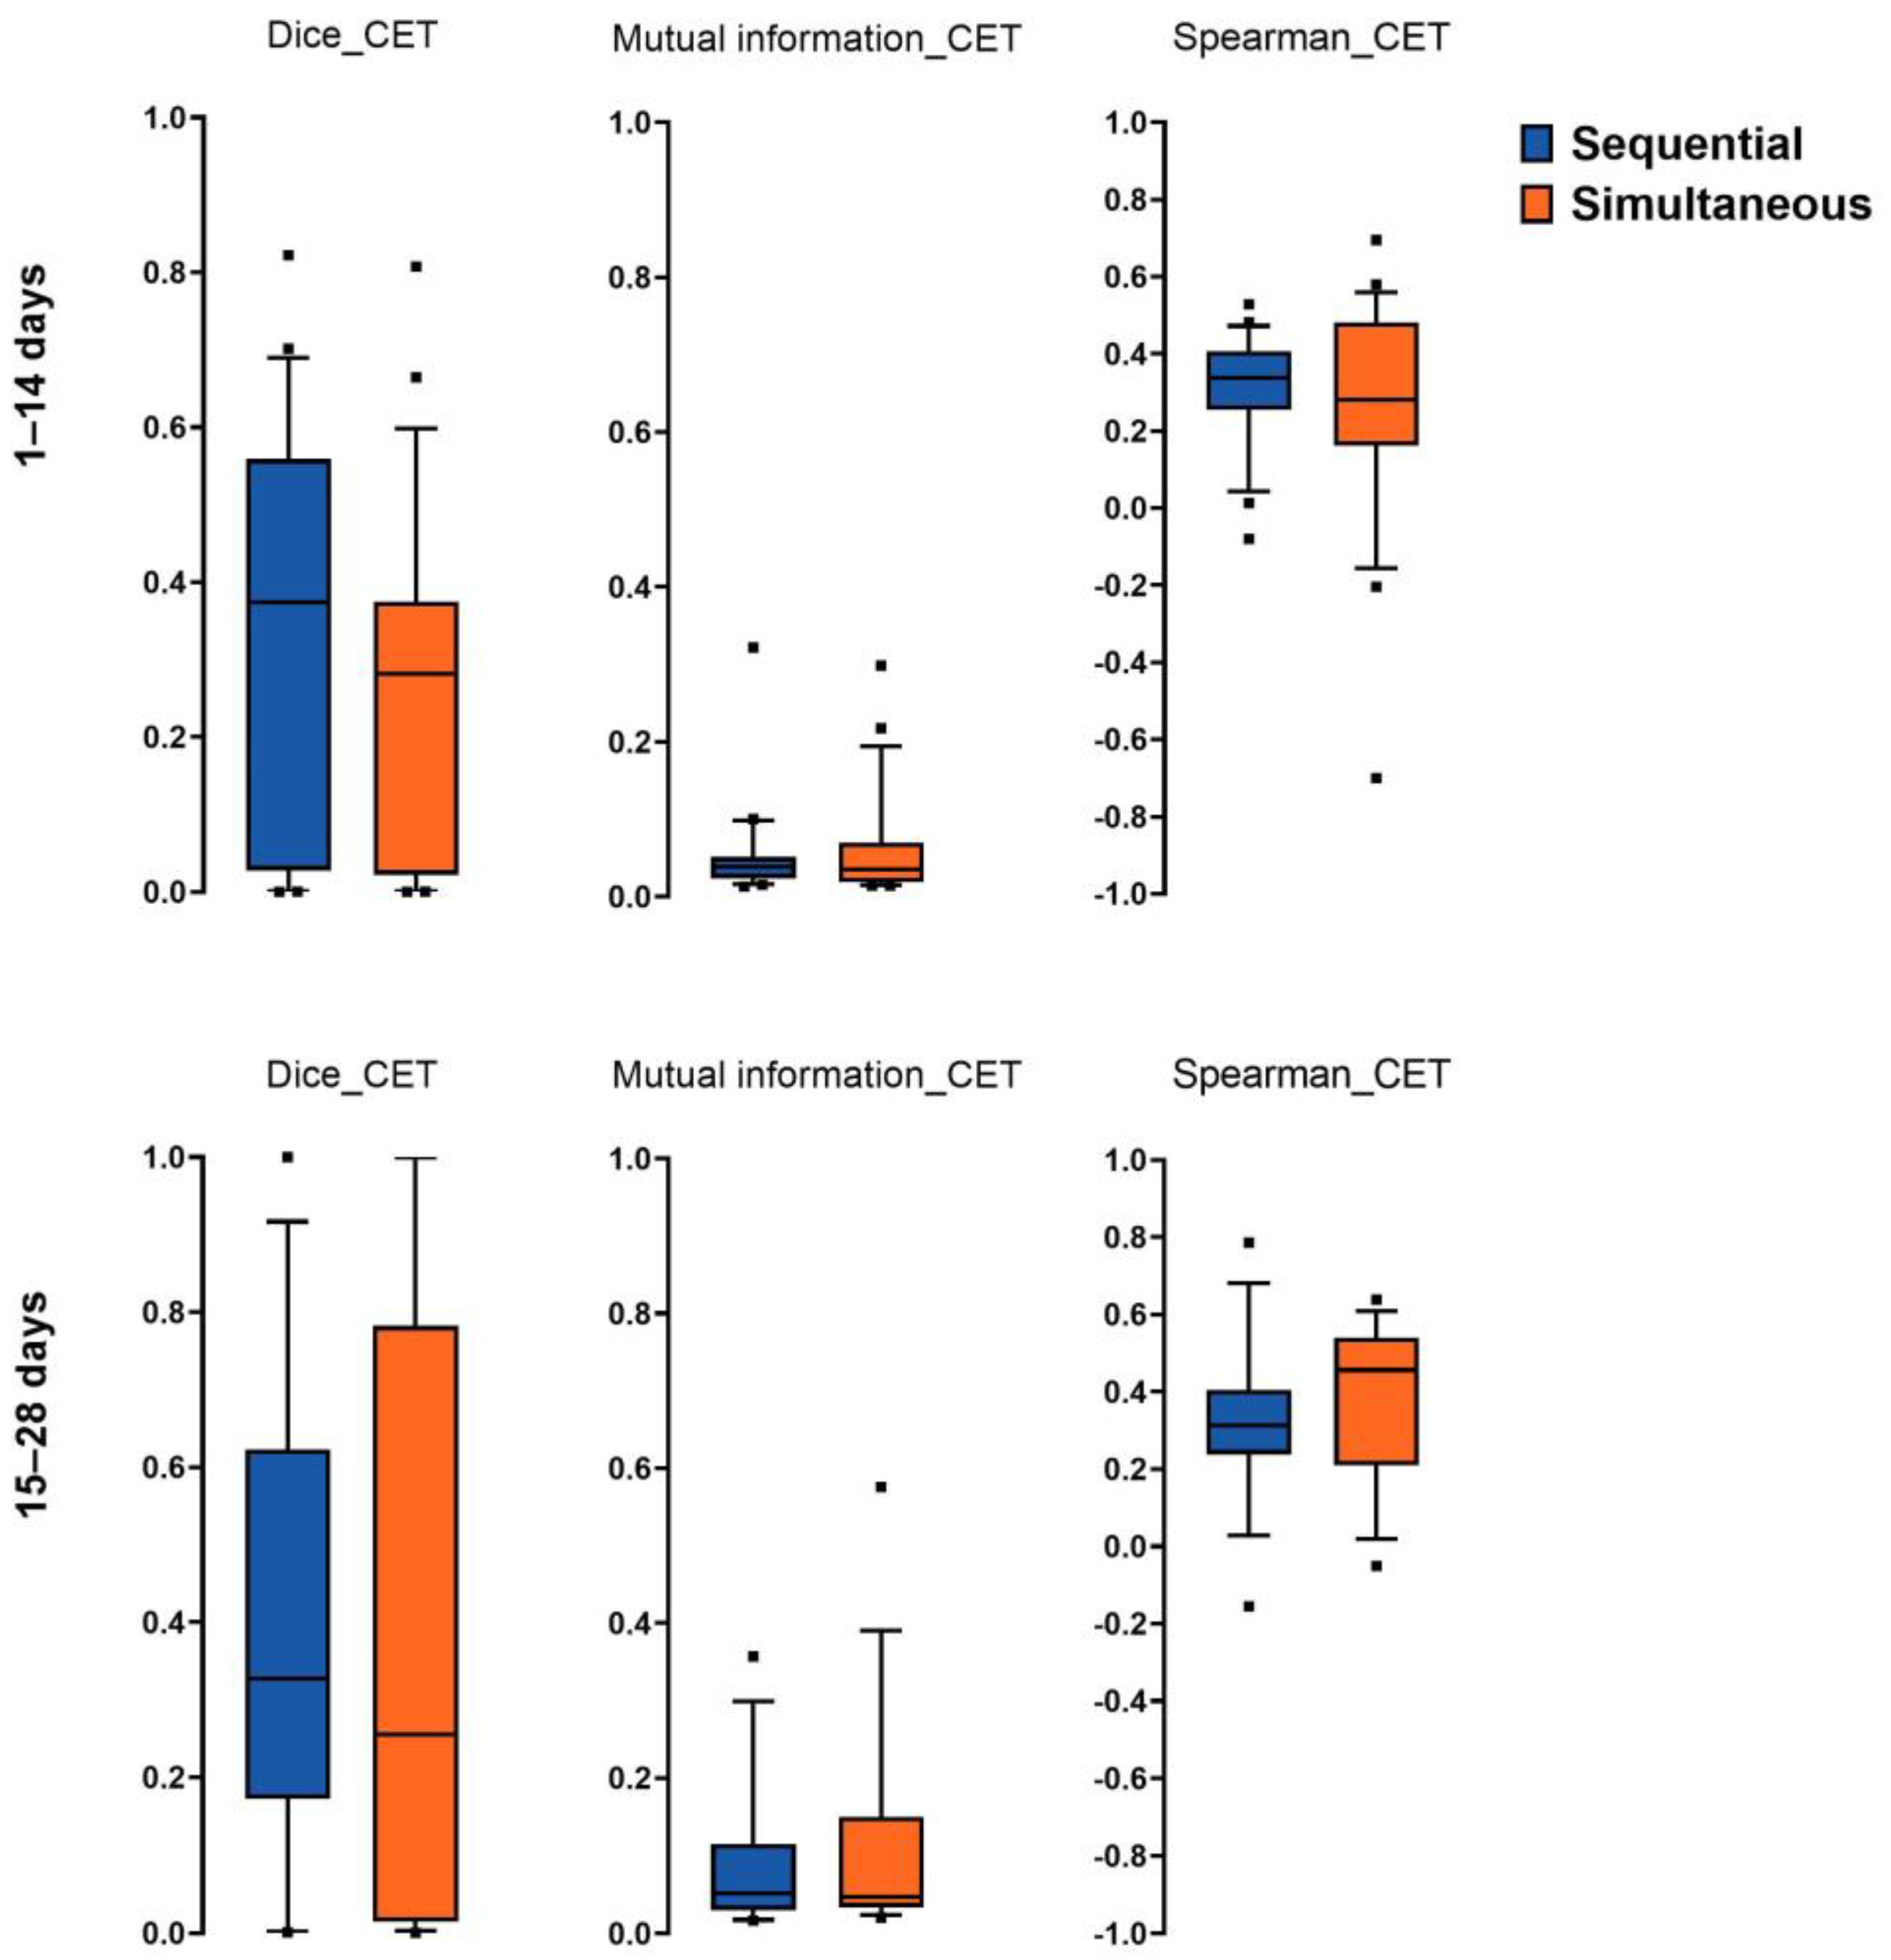
3.2. Spatial Overlap, Mutual Information, and Spearman Correlation of Imaging Hotspots
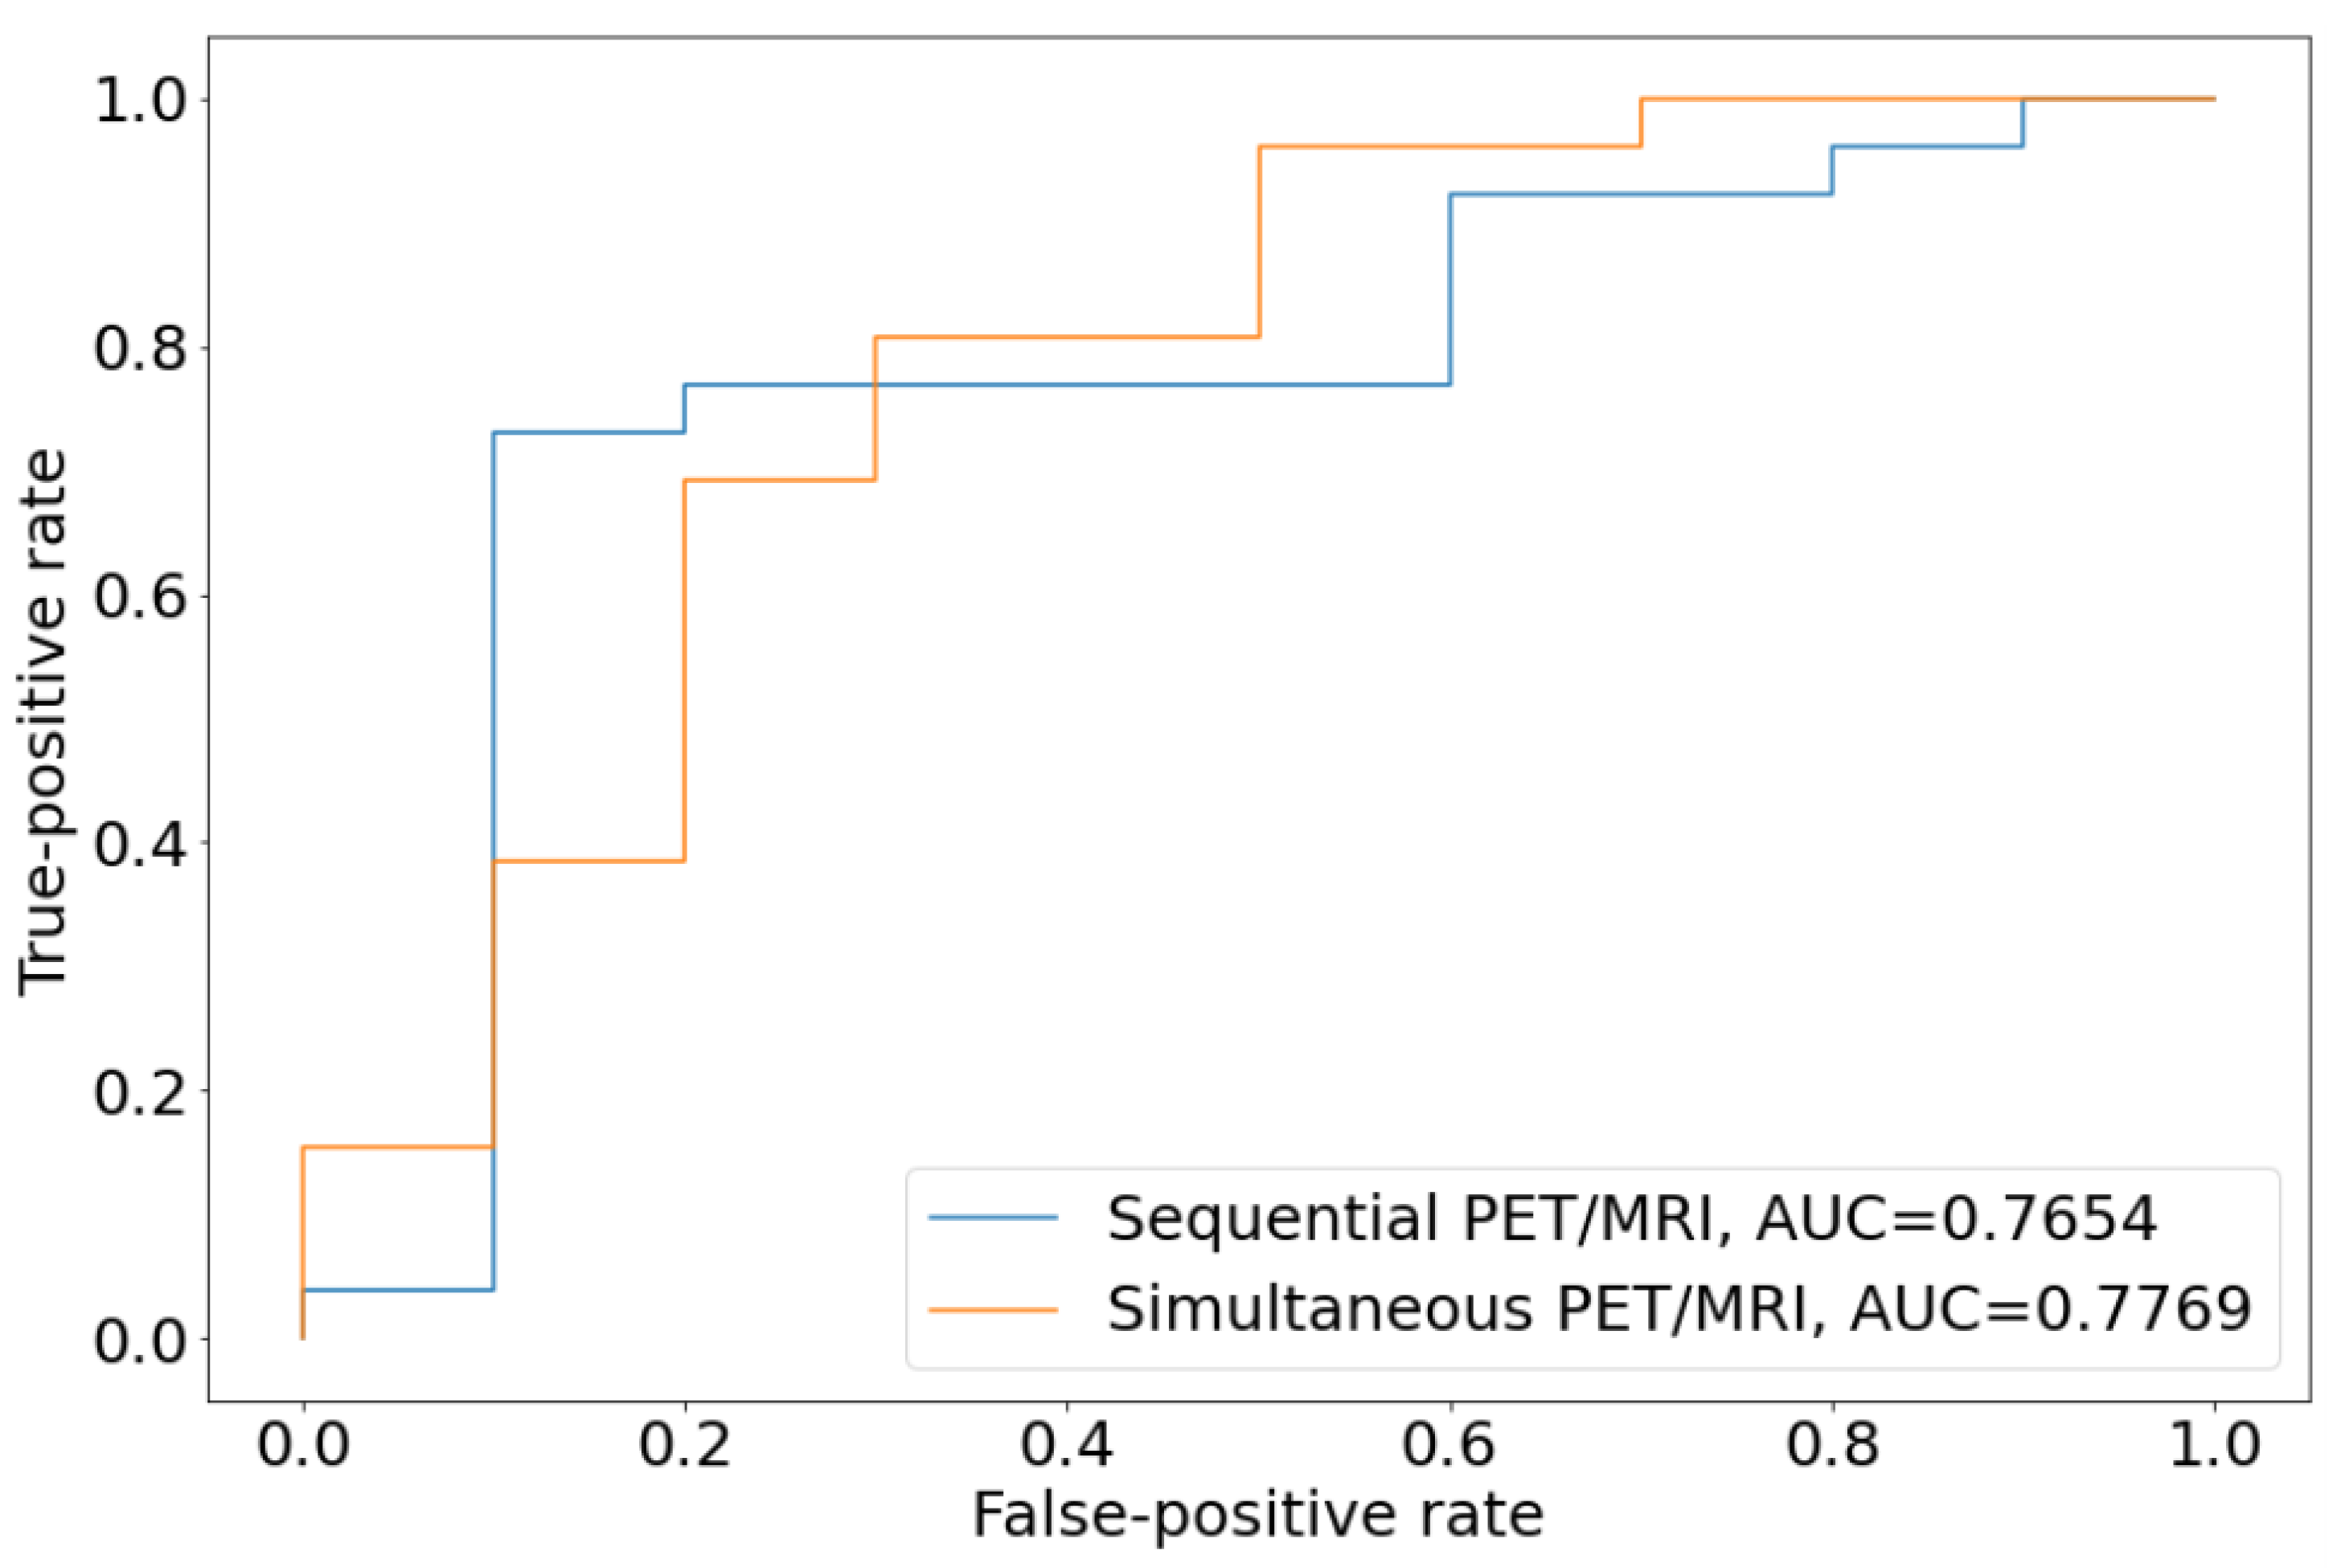
3.3. Diagnostic Power of Sequential PET/MRI Acquisition
4. Discussion
Limitations
5. Conclusions
Author Contributions
Funding
Institutional Review Board Statement
Informed Consent Statement
Data Availability Statement
Conflicts of Interest
References
- Ostrom, Q.T.; Price, M.; Neff, C.; Cioffi, G.; Waite, K.A.; Kruchko, C.; Barnholtz-Sloan, J.S. CBTRUS Statistical Report: Primary Brain and Other Central Nervous System Tumors Diagnosed in the United States in 2015–2019. Neuro Oncol. 2022, 24, v1–v95. [Google Scholar] [CrossRef] [PubMed]
- McBain, C.; Lawrie, T.A.; Rogozińska, E.; Kernohan, A.; Robinson, T.; Jefferies, S. Treatment Options for Progression or Recurrence of Glioblastoma: A Network Meta-Analysis. Cochrane Database Syst. Rev. 2021, 5, CD013579. [Google Scholar] [CrossRef]
- Shiroishi, M.S.; Boxerman, J.L.; Pope, W.B. Physiologic MRI for Assessment of Response to Therapy and Prognosis in Glioblastoma. Neuro Oncol. 2016, 18, 467–478. [Google Scholar] [CrossRef] [Green Version]
- Brandsma, D.; Stalpers, L.; Taal, W.; Sminia, P.; van den Bent, M.J. Clinical Features, Mechanisms, and Management of Pseudoprogression in Malignant Gliomas. Lancet Oncol. 2008, 9, 453–461. [Google Scholar] [CrossRef] [PubMed]
- Kumar, A.J.; Leeds, N.E.; Fuller, G.N.; Van Tassel, P.; Maor, M.H.; Sawaya, R.E.; Levin, V.A. Malignant Gliomas: MR Imaging Spectrum of Radiation Therapy- and Chemotherapy-Induced Necrosis of the Brain after Treatment. Radiology 2000, 217, 377–384. [Google Scholar] [CrossRef] [PubMed] [Green Version]
- Jain, R.; Gutierrez, J.; Narang, J.; Scarpace, L.; Schultz, L.R.; Lemke, N.; Patel, S.C.; Mikkelsen, T.; Rock, J.P. In Vivo Correlation of Tumor Blood Volume and Permeability with Histologic and Molecular Angiogenic Markers in Gliomas. Am. J. Neuroradiol. 2011, 32, 388–394. [Google Scholar] [CrossRef] [PubMed] [Green Version]
- Abdulla, S.; Saada, J.; Johnson, G.; Jefferies, S.; Ajithkumar, T. Tumour Progression or Pseudoprogression? A Review of Post-Treatment Radiological Appearances of Glioblastoma. Clin. Radiol. 2015, 70, 1299–1312. [Google Scholar] [CrossRef] [Green Version]
- Boxerman, J.L.; Quarles, C.C.; Hu, L.S.; Erickson, B.J.; Gerstner, E.R.; Smits, M.; Kaufmann, T.J.; Barboriak, D.P.; Huang, R.H.; Wick, W.; et al. Consensus Recommendations for a Dynamic Susceptibility Contrast MRI Protocol for Use in High-Grade Gliomas. Neuro Oncol. 2020, 22, 1262–1275. [Google Scholar] [CrossRef]
- Law, I.; Albert, N.L.; Arbizu, J.; Boellaard, R.; Drzezga, A.; Galldiks, N.; la Fougère, C.; Langen, K.-J.; Lopci, E.; Lowe, V.; et al. Joint EANM/EANO/RANO Practice Guidelines/SNMMI Procedure Standards for Imaging of Gliomas Using PET with Radiolabelled Amino Acids and [18F]FDG: Version 1.0. Eur. J. Nucl. Med. Mol. Imaging 2019, 46, 540–557. [Google Scholar] [CrossRef] [Green Version]
- Johnson, D.R.; Glenn, C.A.; Javan, R.; Olson, J.J. Congress of Neurological Surgeons Systematic Review and Evidence-Based Guidelines Update on the Role of Imaging in the Management of Progressive Glioblastoma in Adults. J. Neurooncol. 2022, 158, 139–165. [Google Scholar] [CrossRef]
- Zhang, J.; Wang, Y.; Wang, Y.; Xiao, H.; Chen, X.; Lei, Y.; Feng, Z.; Ma, X.; Ma, L. Perfusion Magnetic Resonance Imaging in the Differentiation between Glioma Recurrence and Pseudoprogression: A Systematic Review, Meta-Analysis and Meta-Regression. Quant. Imaging Med. Surg. 2022, 12, 4805–4822. [Google Scholar] [CrossRef] [PubMed]
- Prather, K.Y.; O’Neal, C.M.; Westrup, A.M.; Tullos, H.J.; Hughes, K.L.; Conner, A.K.; Glenn, C.A.; Battiste, J.D. A Systematic Review of Amino Acid PET in Assessing Treatment Response to Temozolomide in Glioma. Neuro Oncol. Adv. 2022, 4, vdac008. [Google Scholar] [CrossRef] [PubMed]
- Steidl, E.; Langen, K.-J.; Hmeidan, S.A.; Polomac, N.; Filss, C.P.; Galldiks, N.; Lohmann, P.; Keil, F.; Filipski, K.; Mottaghy, F.M.; et al. Sequential Implementation of DSC-MR Perfusion and Dynamic [18F]FET PET Allows Efficient Differentiation of Glioma Progression from Treatment-Related Changes. Eur. J. Nucl. Med. Mol. Imaging 2021, 48, 1956–1965. [Google Scholar] [CrossRef] [PubMed]
- Paprottka, K.J.; Kleiner, S.; Preibisch, C.; Kofler, F.; Schmidt-Graf, F.; Delbridge, C.; Bernhardt, D.; Combs, S.E.; Gempt, J.; Meyer, B.; et al. Fully Automated Analysis Combining [18F]-FET-PET and Multiparametric MRI Including DSC Perfusion and APTw Imaging: A Promising Tool for Objective Evaluation of Glioma Progression. Eur. J. Nucl. Med. Mol. Imaging 2021, 48, 4445–4455. [Google Scholar] [CrossRef] [PubMed]
- Zhu, M.; Li, S.; Kuang, Y.; Hill, V.B.; Heimberger, A.B.; Zhai, L.; Zhai, S. Artificial Intelligence in the Radiomic Analysis of Glioblastomas: A Review, Taxonomy, and Perspective. Front. Oncol. 2022, 12, 924245. [Google Scholar] [CrossRef]
- Louis, D.N.; Perry, A.; Wesseling, P.; Brat, D.J.; Cree, I.A.; Figarella-Branger, D.; Hawkins, C.; Ng, H.K.; Pfister, S.M.; Reifenberger, G.; et al. The 2021 WHO Classification of Tumors of the Central Nervous System: A Summary. Neuro Oncol. 2021, 23, 1231–1251. [Google Scholar] [CrossRef]
- Stupp, R.; Mason, W.P.; van den Bent, M.J.; Weller, M.; Fisher, B.; Taphoorn, M.J.B.; Belanger, K.; Brandes, A.A.; Marosi, C.; Bogdahn, U.; et al. Radiotherapy plus Concomitant and Adjuvant Temozolomide for Glioblastoma. N. Engl. J. Med. 2005, 352, 987–996. [Google Scholar] [CrossRef] [Green Version]
- Thomas, M.F.; Kofler, F.; Grundl, L.; Finck, T.; Li, H.; Zimmer, C.; Menze, B.; Wiestler, B. Improving Automated Glioma Segmentation in Routine Clinical Use Through Artificial Intelligence-Based Replacement of Missing Sequences with Synthetic Magnetic Resonance Imaging Scans. Invest. Radiol. 2022, 57, 187–193. [Google Scholar] [CrossRef]
- Wen, P.Y.; Macdonald, D.R.; Reardon, D.A.; Cloughesy, T.F.; Sorensen, A.G.; Galanis, E.; Degroot, J.; Wick, W.; Gilbert, M.R.; Lassman, A.B.; et al. Updated Response Assessment Criteria for High-Grade Gliomas: Response Assessment in Neuro-Oncology Working Group. J. Clin. Oncol. 2010, 28, 1963–1972. [Google Scholar] [CrossRef]
- Rohlfing, T.; Zahr, N.M.; Sullivan, E.V.; Pfefferbaum, A. The SRI24 Multichannel Atlas of Normal Adult Human Brain Structure. Hum. Brain Mapp. 2009, 31, 798–819. [Google Scholar] [CrossRef]
- Kofler, F.; Berger, C.; Waldmannstetter, D.; Lipkova, J.; Ezhov, I.; Tetteh, G.; Kirschke, J.; Zimmer, C.; Wiestler, B.; Menze, B.H. BraTS Toolkit: Translating BraTS Brain Tumor Segmentation Algorithms into Clinical and Scientific Practice. Front. Neurosci. 2020, 14, 125. [Google Scholar] [CrossRef] [PubMed]
- Avants, B.B.; Tustison, N.J.; Wu, J.; Cook, P.A.; Gee, J.C. An Open Source Multivariate Framework for N-Tissue Segmentation with Evaluation on Public Data. Neuroinformatics 2011, 9, 381–400. [Google Scholar] [CrossRef] [PubMed] [Green Version]
- Arzanforoosh, F.; Croal, P.L.; van Garderen, K.A.; Smits, M.; Chappell, M.A.; Warnert, E.A.H. Effect of Applying Leakage Correction on RCBV Measurement Derived From DSC-MRI in Enhancing and Nonenhancing Glioma. Front. Oncol. 2021, 11, 648528. [Google Scholar] [CrossRef] [PubMed]
- Studholme, C.; Hawkes, D.J.; Hill, D.L. Normalized Entropy Measure for Multimodality Image Alignment; Hanson, K.M., Ed.; SPIE: San Diego, CA, USA, 1998; pp. 132–143. [Google Scholar]
- Brendle, C.; Maier, C.; Bender, B.; Schittenhelm, J.; Paulsen, F.; Renovanz, M.; Roder, C.; Castaneda-Vega, S.; Tabatabai, G.; Ernemann, U.; et al. Impact of 18F-FET PET/MRI on Clinical Management of Brain Tumor Patients. J. Nucl. Med. 2022, 63, 522–527. [Google Scholar] [CrossRef]
- Schön, S.; Cabello, J.; Liesche-Starnecker, F.; Molina-Romero, M.; Eichinger, P.; Metz, M.; Karimov, I.; Preibisch, C.; Keupp, J.; Hock, A.; et al. Imaging Glioma Biology: Spatial Comparison of Amino Acid PET, Amide Proton Transfer, and Perfusion-Weighted MRI in Newly Diagnosed Gliomas. Eur. J. Nucl. Med. Mol. Imaging 2020, 47, 1468–1475. [Google Scholar] [CrossRef]
Disclaimer/Publisher’s Note: The statements, opinions and data contained in all publications are solely those of the individual author(s) and contributor(s) and not of MDPI and/or the editor(s). MDPI and/or the editor(s) disclaim responsibility for any injury to people or property resulting from any ideas, methods, instructions or products referred to in the content. |
© 2022 by the authors. Licensee MDPI, Basel, Switzerland. This article is an open access article distributed under the terms and conditions of the Creative Commons Attribution (CC BY) license (https://creativecommons.org/licenses/by/4.0/).
Share and Cite
Ziegenfeuter, J.; Delbridge, C.; Bernhardt, D.; Gempt, J.; Schmidt-Graf, F.; Griessmair, M.; Thomas, M.; Meyer, H.S.; Zimmer, C.; Meyer, B.; et al. Sequential and Hybrid PET/MRI Acquisition in Follow-Up Examination of Glioblastoma Show Similar Diagnostic Performance. Cancers 2023, 15, 83. https://doi.org/10.3390/cancers15010083
Ziegenfeuter J, Delbridge C, Bernhardt D, Gempt J, Schmidt-Graf F, Griessmair M, Thomas M, Meyer HS, Zimmer C, Meyer B, et al. Sequential and Hybrid PET/MRI Acquisition in Follow-Up Examination of Glioblastoma Show Similar Diagnostic Performance. Cancers. 2023; 15(1):83. https://doi.org/10.3390/cancers15010083
Chicago/Turabian StyleZiegenfeuter, Julian, Claire Delbridge, Denise Bernhardt, Jens Gempt, Friederike Schmidt-Graf, Michael Griessmair, Marie Thomas, Hanno S. Meyer, Claus Zimmer, Bernhard Meyer, and et al. 2023. "Sequential and Hybrid PET/MRI Acquisition in Follow-Up Examination of Glioblastoma Show Similar Diagnostic Performance" Cancers 15, no. 1: 83. https://doi.org/10.3390/cancers15010083