
Downfield Proton MRSI at 3 Tesla: A Pilot Study in Human Brain Tumors

 , and
, and
Abstract
:Simple Summary
Abstract
1. Introduction
2. Methods
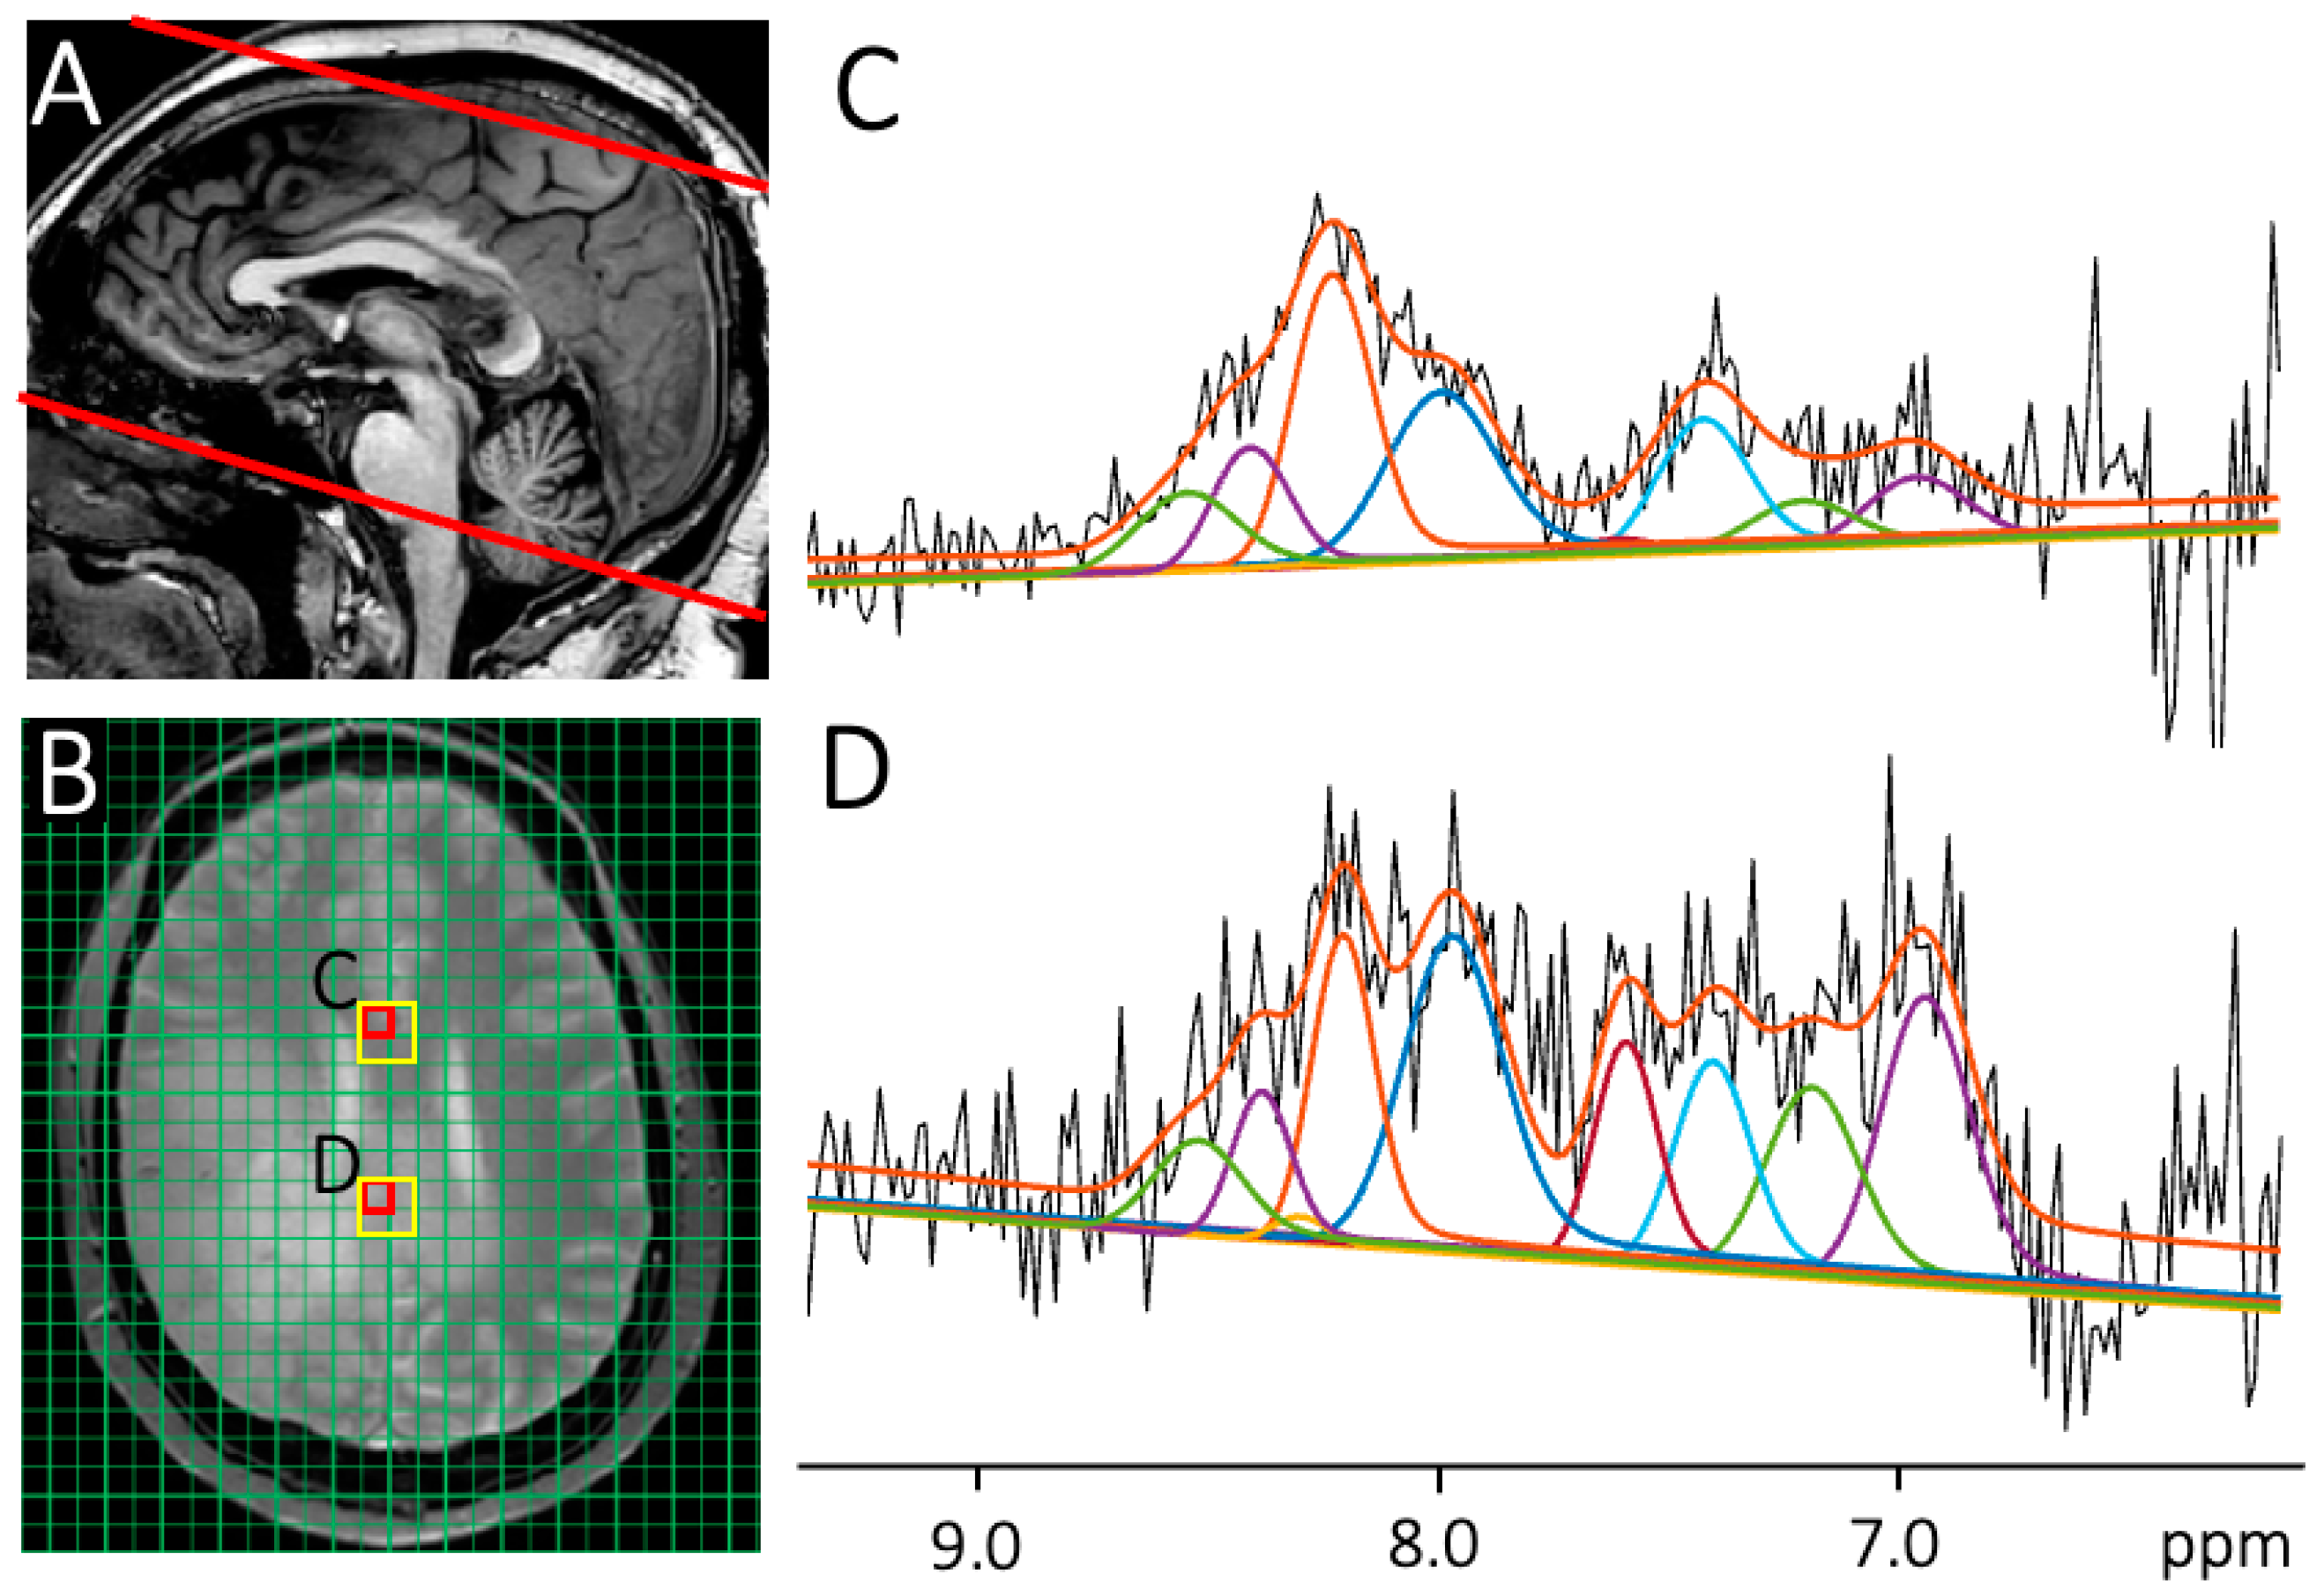
2.1. Data Acquisition
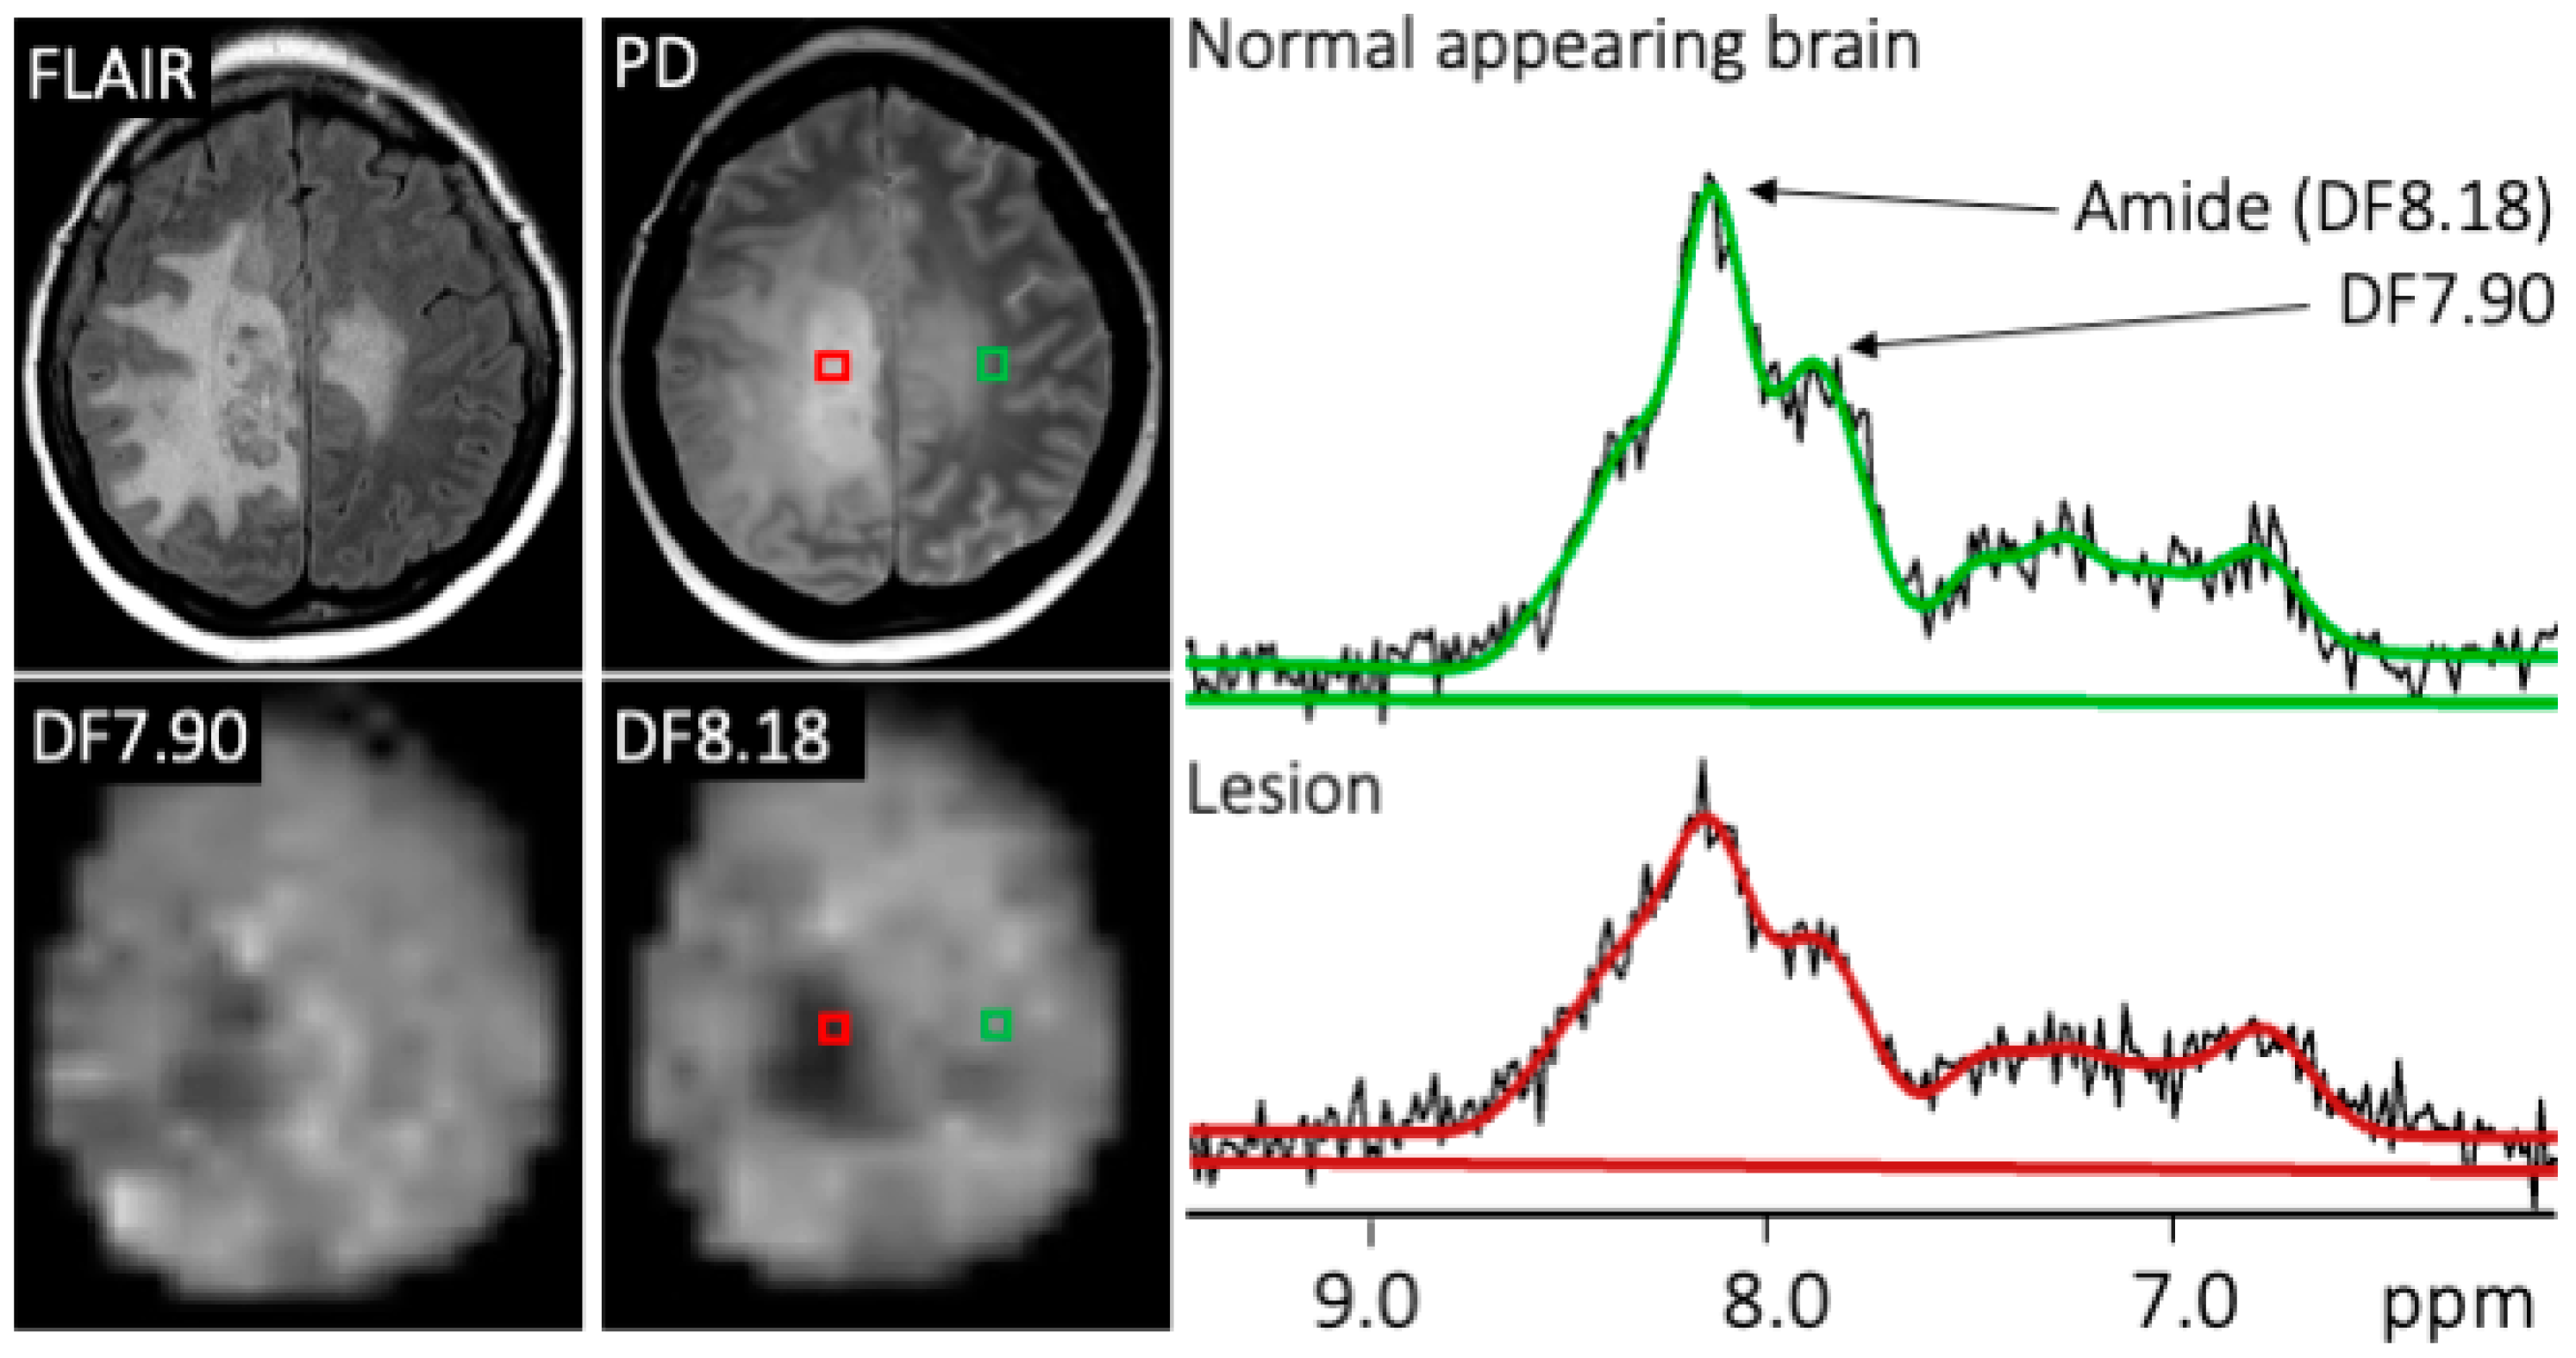
2.2. Diagnosis and Region of Interest Analysis
2.3. DF-MRSI Post-Processing and Quantification
2.4. Statistical Analysis
3. Results
4. Discussion
Supplementary Materials
Author Contributions
Funding
Institutional Review Board Statement
Informed Consent Statement
Data Availability Statement
Conflicts of Interest
References
- Deorah, S.; Lynch, C.F.; Sibenaller, Z.A.; Ryken, T.C. Trends in brain cancer incidence and survival in the United States: Surveillance, Epidemiology, and End Results Program, 1973 to 2001. Neurosurg. Focus 2006, 20, E1. [Google Scholar] [CrossRef] [PubMed]
- Rees, J.H. Diagnosis and treatment in neuro-oncology: An oncological perspective. Br. J. Radiol. 2011, 84, S82–S89. [Google Scholar] [CrossRef]
- Watts, C.; Sanai, N. Surgical approaches for the gliomas. Handb. Clin. Neurol. 2016, 134, 51–69. [Google Scholar] [CrossRef] [PubMed]
- Gilbert, M.R.; Dignam, J.J.; Armstrong, T.S.; Wefel, J.S.; Blumenthal, D.T.; Vogelbaum, M.A.; Colman, H.; Chakravarti, A.; Pugh, S.; Won, M.; et al. A Randomized Trial of Bevacizumab for Newly Diagnosed Glioblastoma. N. Engl. J. Med. 2014, 370, 699–708. [Google Scholar] [CrossRef]
- Stupp, R.; Taillibert, S.; Kanner, A.; Read, W.; Steinberg, D.; Lhermitte, B.; Toms, S.; Idbaih, A.; Ahluwalia, M.S.; Fink, K.; et al. Effect of Tumor-Treating Fields Plus Maintenance Temozolomide vs Maintenance Temozolomide Alone on Survival in Patients with Glioblastoma: A Randomized Clinical Trial. JAMA 2017, 318, 2306–2316. [Google Scholar] [CrossRef]
- Gilbert, M.R.; Wang, M.; Aldape, K.D.; Stupp, R.; Hegi, M.E.; Jaeckle, K.A.; Armstrong, T.S.; Wefel, J.S.; Won, M.; Blumenthal, D.T.; et al. Dose-dense temozolomide for newly diagnosed glioblastoma: A randomized phase III clinical trial. J. Clin. Oncol. 2013, 31, 4085–4091. [Google Scholar] [CrossRef] [PubMed]
- Chawla, S.; Bukhari, S.; Afridi, O.M.; Wang, S.; Yadav, S.K.; Akbari, H.; Verma, G.; Nath, K.; Haris, M.; Bagley, S.; et al. Metabolic and physiologic magnetic resonance imaging in distinguishing true progression from pseudoprogression in patients with glioblastoma. NMR Biomed. 2022, 35, e4719. [Google Scholar] [CrossRef]
- Jain, R.; Narang, J.; Sundgren, P.M.; Hearshen, D.; Saksena, S.; Rock, J.P.; Gutierrez, J.; Mikkelsen, T. Treatment induced necrosis versus recurrent/progressing brain tumor: Going beyond the boundaries of conventional morphologic imaging. J. Neuro Oncol. 2010, 100, 17–29. [Google Scholar] [CrossRef]
- Chao, S.T.; Suh, J.H.; Raja, S.; Lee, S.-Y.; Barnett, G. The sensitivity and specificity of FDG PET in distinguishing recurrent brain tumor from radionecrosis in patients treated with stereotactic radiosurgery. Int. J. Cancer 2001, 96, 191–197. Available online: https://pubmed.ncbi.nlm.nih.gov/11410888/ (accessed on 14 February 2023). [CrossRef]
- Van Zijl, P.C.M.; Zhou, J.; Mori, N.; Payen, J.F.; Wilson, D.; Mori, S. Mechanism of magnetization transfer during on-resonance water saturation. A new approach to detect mobile proteins, peptides, and lipids. Magn. Reson. Med. 2003, 49, 440–449. [Google Scholar] [CrossRef]
- Ge, X.; Song, K.-H.; Engelbach, J.A.; Yuan, L.; Gao, F.; Dahiya, S.; Rich, K.M.; Ackerman, J.J.H.; Garbow, J.R. Distinguishing Tumor Admixed in a Radiation Necrosis (RN) Background: 1H and 2H MR with a Novel Mouse Brain-Tumor/RN Model. Front. Oncol. 2022, 12, 885480. [Google Scholar] [CrossRef]
- Zeng, Q.-S.; Li, C.-F.; Liu, H.; Zhen, J.-H.; Feng, D.-C. Distinction Between Recurrent Glioma and Radiation Injury Using Magnetic Resonance Spectroscopy in Combination with Diffusion-Weighted Imaging. Int. J. Radiat. Oncol. 2007, 68, 151–158. [Google Scholar] [CrossRef]
- Barajas, R.F.; Chang, J.S.; Segal, M.R.; Parsa, A.T.; McDermott, M.W.; Berger, M.S.; Cha, S. Differentiation of Recurrent Glioblastoma Multiforme from Radiation Necrosis after External Beam Radiation Therapy with Dynamic Susceptibility-weighted Contrast-enhanced Perfusion MR Imaging. Radiology 2009, 253, 486–496. [Google Scholar] [CrossRef] [PubMed]
- Hu, L.; Baxter, L.; Smith, K.; Feuerstein, B.; Karis, J.; Eschbacher, J.; Coons, S.; Nakaji, P.; Yeh, R.; Debbins, J.; et al. Relative Cerebral Blood Volume Values to Differentiate High-Grade Glioma Recurrence from Posttreatment Radiation Effect: Direct Correlation between Image-Guided Tissue Histopathology and Localized Dynamic Susceptibility-Weighted Contrast-Enhanced Perfusion MR Imaging Measurements. Am. J. Neuroradiol. 2009, 30, 552–558. [Google Scholar] [CrossRef]
- Shah, A.H.; Snelling, B.; Bregy, A.; Patel, P.R.; Tememe, D.; Bhatia, R.; Sklar, E.; Komotar, R.J. Discriminating radiation necrosis from tumor progression in gliomas: A systematic review what is the best imaging modality? J. Neurooncol. 2013, 112, 141–152. [Google Scholar] [CrossRef] [PubMed]
- Kim, H.S.; Goh, M.J.; Kim, N.; Choi, C.G.; Kim, S.J.; Kim, J.H. Which Combination of MR Imaging Modalities Is Best for Predicting Recurrent Glioblastoma? Study of Diagnostic Accuracy and Reproducibility. Radiology 2014, 273, 831–843. [Google Scholar] [CrossRef]
- Mountz, J.M.; Ahmed, R.; Oborski, M.J.; Lieberman, F.S.; Hwang, M. Malignant gliomas: Current perspectives in diagnosis, treatment, and early response assessment using advanced quantitative imaging methods. Cancer Manag. Res. 2014, 6, 149–170. [Google Scholar] [CrossRef]
- Ma, B.; Blakeley, J.O.; Hong, X.; Zhang, H.; Jiang, S.; Blair, L.; Zhang, Y.; Heo, H.-Y.; Zhang, M.; van Zijl, P.C.M.; et al. Applying amide proton transfer-weighted MRI to distinguish pseudoprogression from true progression in malignant gliomas. J. Magn. Reson. Imaging 2016, 44, 456–462. [Google Scholar] [CrossRef] [PubMed]
- Zhou, J.; Zaiss, M.; Knutsson, L.; Sun, P.Z.; Ahn, S.S.; Aime, S.; Bachert, P.; Blakeley, J.O.; Cai, K.; Chappell, M.A.; et al. Review and consensus recommendations on clinical APT-weighted imaging approaches at 3T: Application to brain tumors. Magn. Reson. Med. 2022, 88, 546–574. [Google Scholar] [CrossRef]
- Zhou, J.; Zhu, H.; Lim, M.; Blair, L.; Quinones-Hinojosa, A.; Messina, S.A.; Eberhart, C.G.; Pomper, M.G.; Laterra, J.; Barker, P.B.; et al. Three-dimensional amide proton transfer MR imaging of gliomas: Initial experience and comparison with gadolinium enhancement. J. Magn. Reson. Imaging 2013, 38, 1119–1128. [Google Scholar] [CrossRef]
- Zhou, J.; Heo, H.-Y.; Knutsson, L.; Van Zijl, P.C.; Jiang, S. APT-weighted MRI: Techniques, current neuro applications, and challenging issues. J. Magn. Reson. Imaging 2019, 50, 347–364. [Google Scholar] [CrossRef]
- Zhou, J.; Payen, J.-F.; A Wilson, D.; Traystman, R.J.; Van Zijl, P.C.M. Using the amide proton signals of intracellular proteins and peptides to detect pH effects in MRI. Nat. Med. 2003, 9, 1085–1090. [Google Scholar] [CrossRef] [PubMed]
- Zhou, J.; van Zijl, P.C.M. Chemical exchange saturation transfer imaging and spectroscopy. Prog. Nucl. Magn. Reson. Spectrosc. 2006, 48, 109–136. [Google Scholar] [CrossRef]
- Borbath, T.; Murali-Manohar, S.; Wright, A.M.; Henning, A. In vivo characterization of downfield peaks at 9.4 T: T2 relaxation times, quantification, pH estimation, and assignments. Magn. Reson. Med. 2021, 85, 587–600. [Google Scholar] [CrossRef]
- Fichtner, N.D.; Giapitzakis, I.-A.; Avdievich, N.; Mekle, R.; Zaldivar, D.; Henning, A.; Kreis, R. In vivo characterization of the downfield part of 1H MR spectra of human brain at 9.4 T: Magnetization exchange with water and relation to conventionally determined metabolite content. Magn. Reson. Med. 2018, 79, 2863–2873. [Google Scholar] [CrossRef]
- Fichtner, N.D.; Henning, A.; Zoelch, N.; Boesch, C.; Kreis, R. Elucidation of the downfield spectrum of human brain at 7 T using multiple inversion recovery delays and echo times. Magn. Reson. Med. 2017, 78, 11–19. [Google Scholar] [CrossRef] [PubMed]
- MacMillan, E.L.; Chong, D.G.Q.; Dreher, W.; Henning, A.; Boesch, C.; Kreis, R. Magnetization exchange with water and T1 relaxation of the downfield resonances in human brain spectra at 3.0 T. Magn. Reson. Med. 2011, 65, 1239–1246. [Google Scholar] [CrossRef] [PubMed]
- Gonçalves, S.I.; Simões, R.V.; Shemesh, N. Short TE downfield magnetic resonance spectroscopy in a mouse model of brain glioma. Magn. Reson. Med. 2022, 88, 524–536. [Google Scholar] [CrossRef]
- Považan, M.; Schär, M.; Gillen, J.; Barker, P.B. Magnetic resonance spectroscopic imaging of downfield proton resonances in the human brain at 3 T. Magn. Reson. Med. 2022, 87, 1661–1672. [Google Scholar] [CrossRef] [PubMed]
- Özdemir, I.; Ganji, S.; Gillen, J.; Etyemez, S.; Považan, M.; Barker, P.B. Downfield proton MRSI with whole-brain coverage at 3 T. Magn. Reson. Med. 2023, 90, 814–822. [Google Scholar] [CrossRef]
- Zhu, H.; Barker, P.B. MR Spectroscopy and Spectroscopic Imaging of the Brain. Methods Mol. Biol. 2011, 711, 203–226. [Google Scholar] [CrossRef] [PubMed]
- Pomper, M.G.; Constantinides, C.D.; Barker, P.B.; Bizzi, A.; Dobgan, A.; Yokoi, F.; McArthur, J.C.; Wong, D.F. Quantitative MR Spectroscopic Imaging of Brain Lesions in Patients with AIDS: Correlation with [11C-Methyl]thymidine PET and Thallium-201 SPECT. Acad. Radiol. 2002, 9, 398–409. [Google Scholar] [CrossRef] [PubMed]
- Kreis, R.; Zwygart, K.; Boesch, C.; Nuoffer, J.-M. Reproducibility of cerebral phenylalanine levels in patients with phenylketonuria determined by 1H-MR spectroscopy. Magn. Reson. Med. 2009, 62, 11–16. [Google Scholar] [CrossRef]
- Vermathen, P.; Capizzano, A.A.; Maudsley, A.A. Administration and (1)H MRS detection of histidine in human brain: Application to in vivo pH measurement. Magn. Reson. Med. 2000, 43, 665–675. [Google Scholar] [CrossRef]
- Nanga, R.P.R.; Elliott, M.A.; Swain, A.; Wilson, N.; Swago, S.; Soni, N.D.; Witschey, W.R.; Reddy, R. Identification of l-Tryptophan by down-field (1) H MRS: A precursor for brain NAD(+) and serotonin syntheses. Magn. Reson. Med. 2022, 88, 2371–2377. [Google Scholar] [CrossRef]
- Gonçalves, S.I.; Ligneul, C.; Shemesh, N. Short echo time relaxation-enhanced MR spectroscopy reveals broad downfield resonances. Magn. Reson. Med. 2019, 82, 1266–1277. [Google Scholar] [CrossRef]
- Klauser, A.; Courvoisier, S.; Kasten, J.; Kocher, M.; Guerquin-Kern, M.; Van De Ville, D.; Lazeyras, F. Fast high-resolution brain metabolite mapping on a clinical 3T MRI by accelerated 1H-FID-MRSI and low-rank constrained reconstruction. Magn. Reson. Med. 2019, 81, 2841–2857. [Google Scholar] [CrossRef]
- Wen, P.Y.; Macdonald, D.R.; Reardon, D.A.; Cloughesy, T.F.; Sorensen, A.G.; Galanis, E.; DeGroot, J.; Wick, W.; Gilbert, M.R.; Lassman, A.B.; et al. Updated Response Assessment Criteria for High-Grade Gliomas: Response Assessment in Neuro-Oncology Working Group. J. Clin. Oncol. 2010, 28, 1963–1972. [Google Scholar] [CrossRef] [PubMed]
- Simpson, R.; Devenyi, G.A.; Jezzard, P.; Hennessy, T.J.; Near, J. Advanced processing and simulation of MRS data using the FID appliance (FID-A)-An open source, MATLAB-based toolkit. Magn. Reson. Med. 2017, 77, 23–33. [Google Scholar] [CrossRef]
- Barkhuijsen, H.; de Beer, R.; van Ormondt, D. Improved algorithm for noniterative time-domain model fitting to exponentially damped magnetic resonance signals. J. Magn. Reson. 1987, 73, 553–557. [Google Scholar] [CrossRef]
- Oeltzschner, G.; Zöllner, H.J.; Hui, S.C.; Mikkelsen, M.; Saleh, M.G.; Tapper, S.; Edden, R.A. Osprey: Open-source processing, reconstruction & estimation of magnetic resonance spectroscopy data. J. Neurosci. Methods 2020, 343, 108827. [Google Scholar] [CrossRef] [PubMed]
- Provencher, S.W. Automatic quantitation of localized in vivo 1H spectra with LCModel. NMR Biomed. 2001, 14, 260–264. [Google Scholar] [CrossRef] [PubMed]
- Provencher, S.W. Estimation of metabolite concentrations from localized in vivo proton NMR spectra. Magn. Reson. Med. 1993, 30, 672–679. [Google Scholar] [CrossRef] [PubMed]
- Kreis, R.; Boer, V.; Choi, I.Y.; Cudalbu, C.; de Graaf, R.A.; Gasparovic, C.; Heerschap, A.; Krššák, M.; Lanz, B.; Maudsley, A.A.; et al. Terminology and concepts for the characterization of in vivo MR spectroscopy methods and MR spectra: Background and experts’ consensus recommendations. NMR Biomed. 2020, 34, e4347. [Google Scholar] [CrossRef] [PubMed]
- R Development Core Team. R: A Language and Environment for Statistical Computing. In R Foundation for Statistical Computing; R Development Core Team: Vienna, Austria, 2020; Available online: https://www.r-project.org/ (accessed on 24 August 2023).
- Govindaraju, V.; Young, K.; Maudsley, A.A. Proton NMR chemical shifts and coupling constants for brain metabolites. NMR Biomed. 2000, 13, 129–153. [Google Scholar] [CrossRef]
- Barker, P.B. N-acetyl aspartate—A neuronal marker? Ann. Neurol. 2001, 49, 423–424. [Google Scholar] [CrossRef]
- Horská, A.; Barker, P.B. Imaging of Brain Tumors: MR Spectroscopy and Metabolic Imaging. Neuroimaging Clin. N. Am. 2010, 20, 293–310. [Google Scholar] [CrossRef]


| Case | M/F | Age | Molecular Diagnosis | Treatment History | Time Since End of Last XRT/TMZ Treatment |
|---|---|---|---|---|---|
| 1 | F | 59 | MGMT unmethylated | Surgery × 5, XRT/TMZ × 2, adjuvant TMZ × 10 cycles | 60 weeks (2nd course) |
| 2 | F | 63 | MGMT unmethylated, TERT, EGFR, CDKN2A deletion | Surgery, XRT/TMZ | 6 weeks |
| 3 | F | 45 | MGMT methylated, TERT, NF1, CDKN2A deletion | Surgery, XRT/TMZ, adjuvant TMZ × 1 cycle | 14 weeks (adjuvant TMZ: 4 weeks) |
| 4 | F | 64 | MGMT methylation, TERT, EGFR, PIK3CA | Surgery with Gliadel, XRT/TMZ × 2, adjuvant TMZ × 6 cycles, Optune device | 4 weeks (2nd course) |
| 5 | M | 66 | MGMT unmethylated. No NGS/molecular testing | Surgery, XRT/TMZ, adjuvant TMZ × 5 cycles | 35 weeks |
| 6 | M | 59 | MGMT unmethylated, TERT, NF1 | Surgery, XRT/TMZ, adjuvant TMZ × 5 cycles | 20 weeks (adjuvant TMZ: 2 weeks) |
| 7 | M | 66 | MGMT unmethylated, TERT, EGFR amplification, CDKN2A deletion | Surgery, XRT/TMZ | 4 weeks |
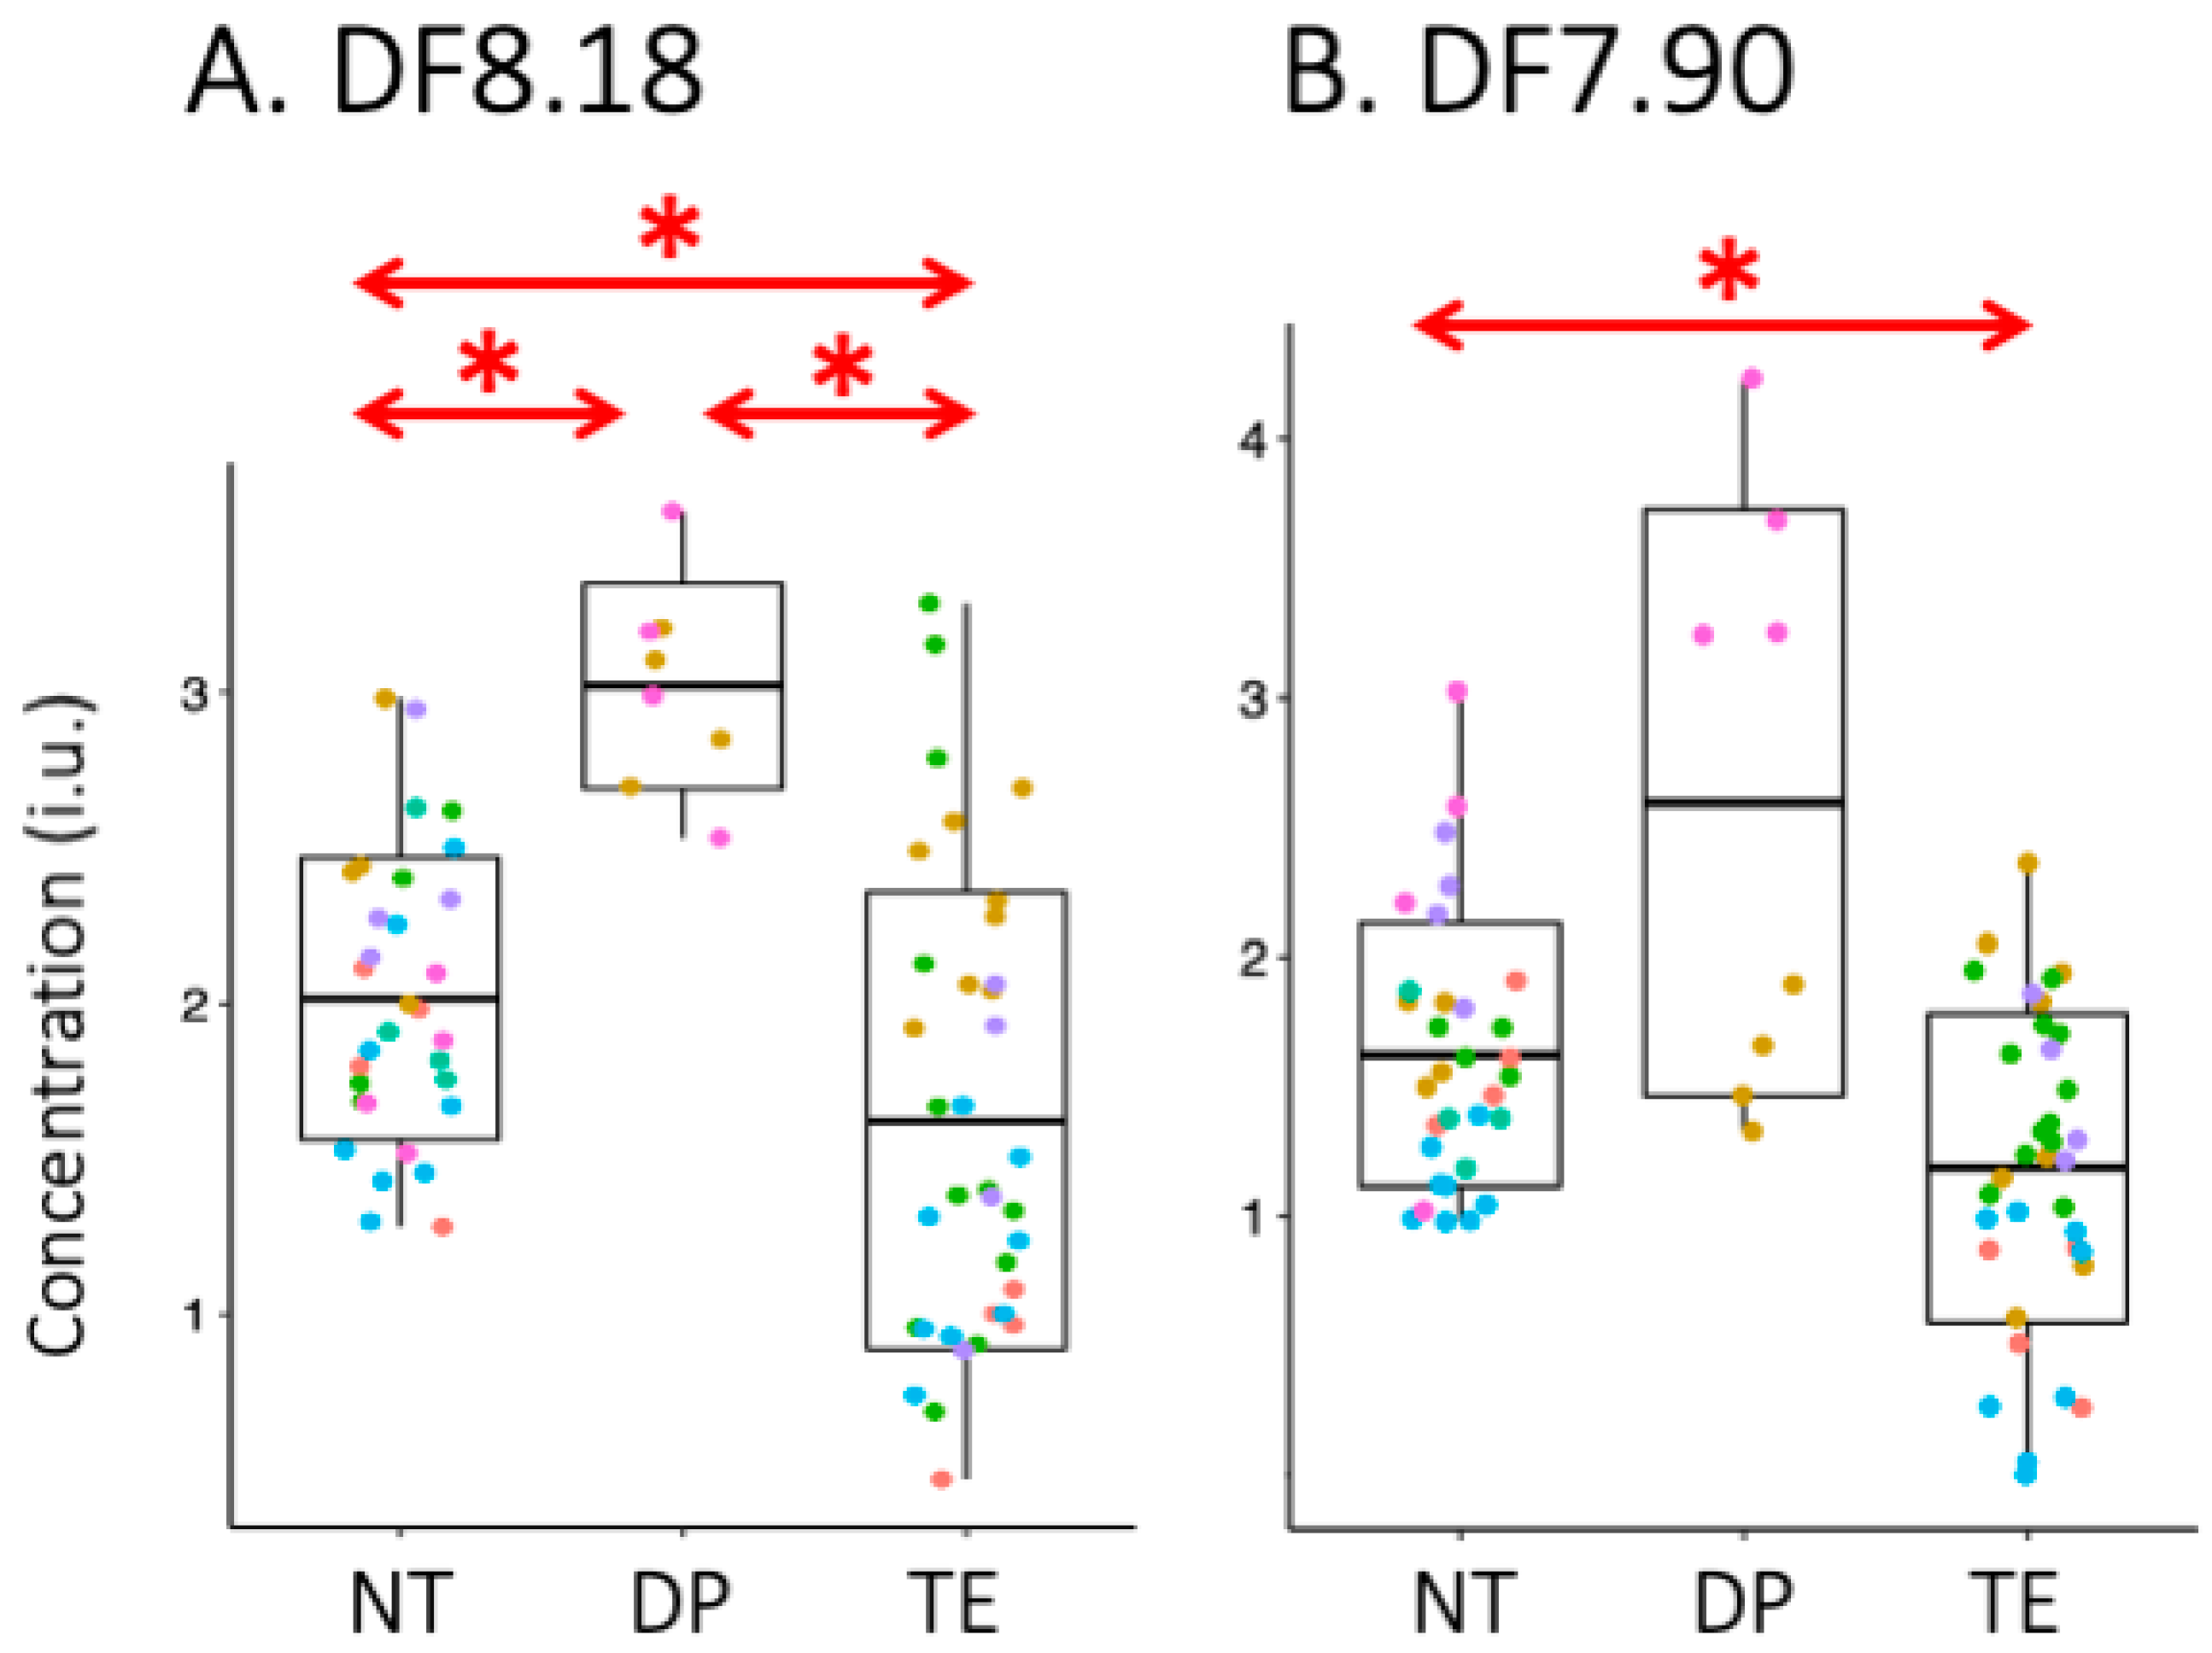
| NT Mean ± s.d. | DP Mean ± s.d. | TE Mean ± s.d. | TE vs. DP (p-Value) | TE vs. NT (p-Value) | DP vs. NT (p-Value) | |
|---|---|---|---|---|---|---|
| [Amide]n | 1.00 ± 0.00 | 1.5 ± 0.4 | 0.7 ± 0.2 | 0.012 | 0.002 | 0.003 |
| [DF7.90]n | 1.00 ± 0.00 | 1.4 ± 0.7 | 0.7 ± 0.2 | 0.058 | 0.004 | 0.083 |
Disclaimer/Publisher’s Note: The statements, opinions and data contained in all publications are solely those of the individual author(s) and contributor(s) and not of MDPI and/or the editor(s). MDPI and/or the editor(s) disclaim responsibility for any injury to people or property resulting from any ideas, methods, instructions or products referred to in the content. |
© 2023 by the authors. Licensee MDPI, Basel, Switzerland. This article is an open access article distributed under the terms and conditions of the Creative Commons Attribution (CC BY) license (https://creativecommons.org/licenses/by/4.0/).
Share and Cite
Özdemir, İ.; Kamson, D.O.; Etyemez, S.; Blair, L.; Lin, D.D.M.; Barker, P.B. Downfield Proton MRSI at 3 Tesla: A Pilot Study in Human Brain Tumors. Cancers 2023, 15, 4311. https://doi.org/10.3390/cancers15174311
Özdemir İ, Kamson DO, Etyemez S, Blair L, Lin DDM, Barker PB. Downfield Proton MRSI at 3 Tesla: A Pilot Study in Human Brain Tumors. Cancers. 2023; 15(17):4311. https://doi.org/10.3390/cancers15174311
Chicago/Turabian StyleÖzdemir, İpek, David O. Kamson, Semra Etyemez, Lindsay Blair, Doris D. M. Lin, and Peter B. Barker. 2023. "Downfield Proton MRSI at 3 Tesla: A Pilot Study in Human Brain Tumors" Cancers 15, no. 17: 4311. https://doi.org/10.3390/cancers15174311