
Use of Optical Genome Mapping to Detect Structural Variants in Neuroblastoma

 , , , and
Abstract
:Simple Summary
Abstract
1. Introduction
2. Methods
2.1. Cell Lines and Tumour Samples
2.1.1. Cell Lines
2.1.2. Tumour Samples
2.2. Cell Culture
2.3. RNA Fusion Panel
2.4. Whole Genome Sequencing (WGS)
2.5. Single-Nucleotide Polymorphism Array
2.6. TERT Fluorescent In Situ Hybridisation
2.7. Optical Genome Mapping
2.7.1. Isolation of UHMW DNA
2.7.2. Labelling of UHMW gDNA
2.7.3. Data Collection
2.7.4. OGM Data Analysis
3. Results
3.1. DNA Molecule Quality Report
3.2. Comparison of OGM of NB Cell Lines with Other Cytogenetic Analyses
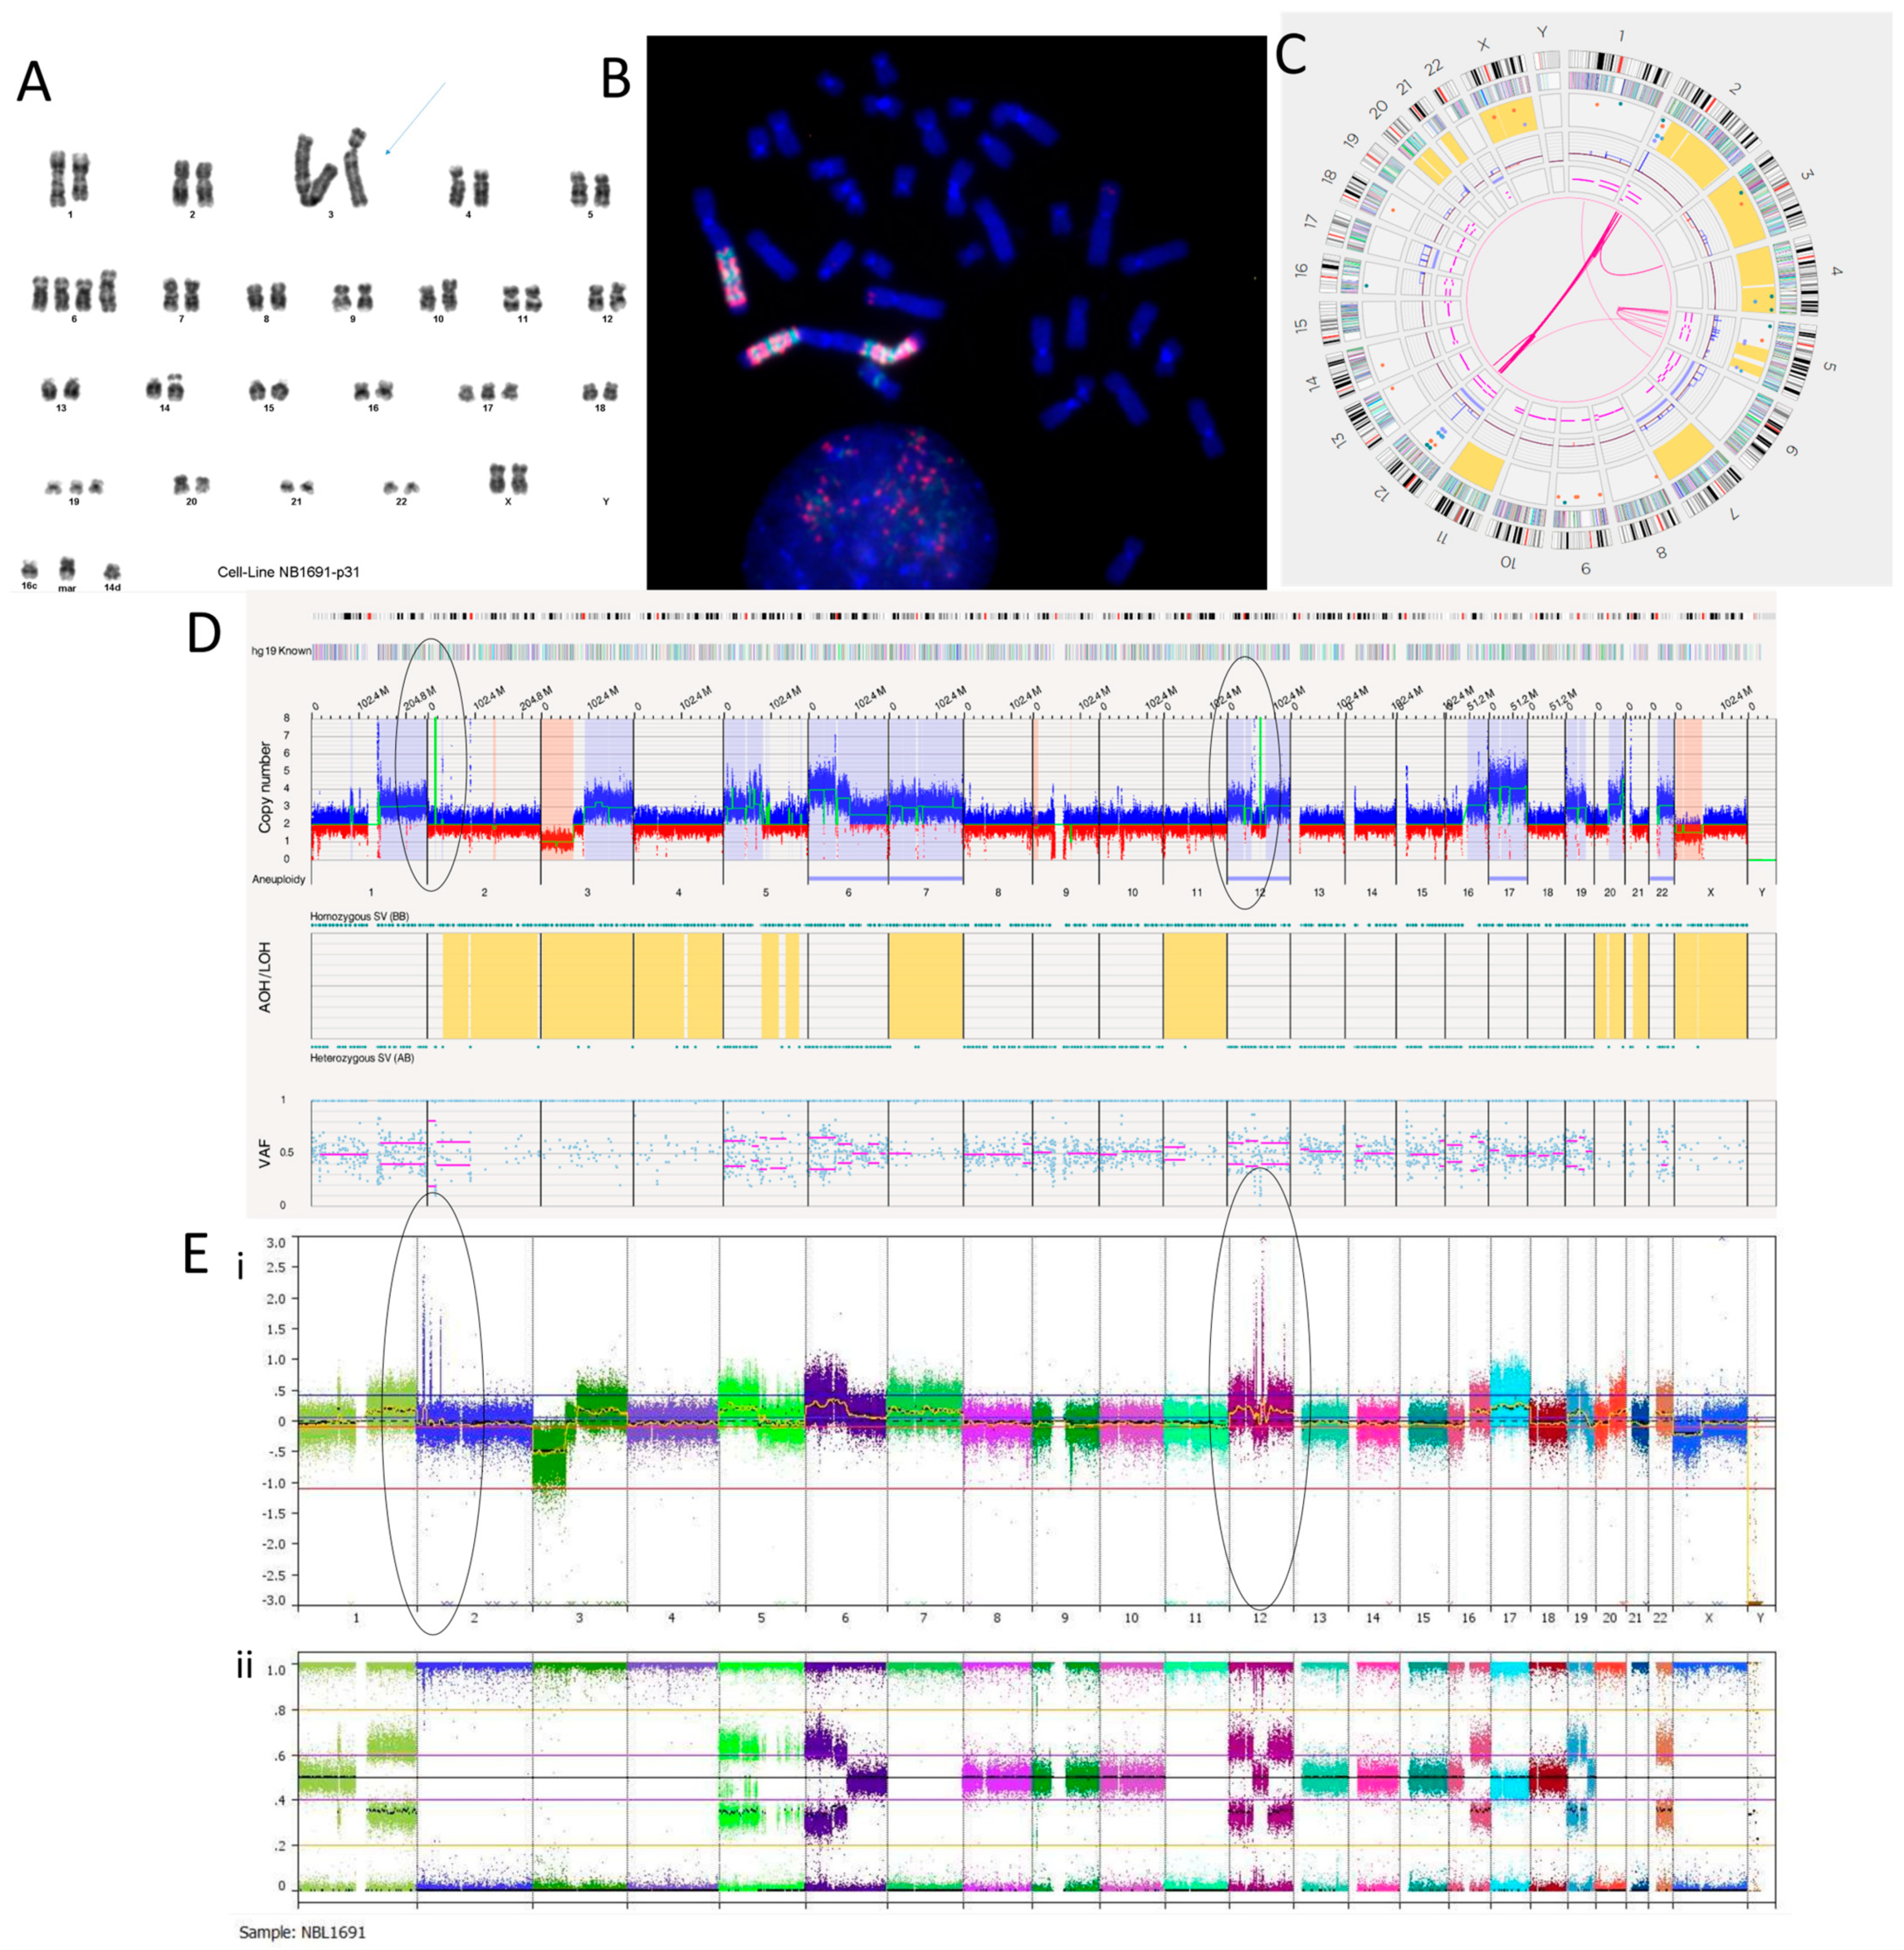
3.2.1. NB1691 Cell Line
3.2.2. SH-SY5Y Cell Line
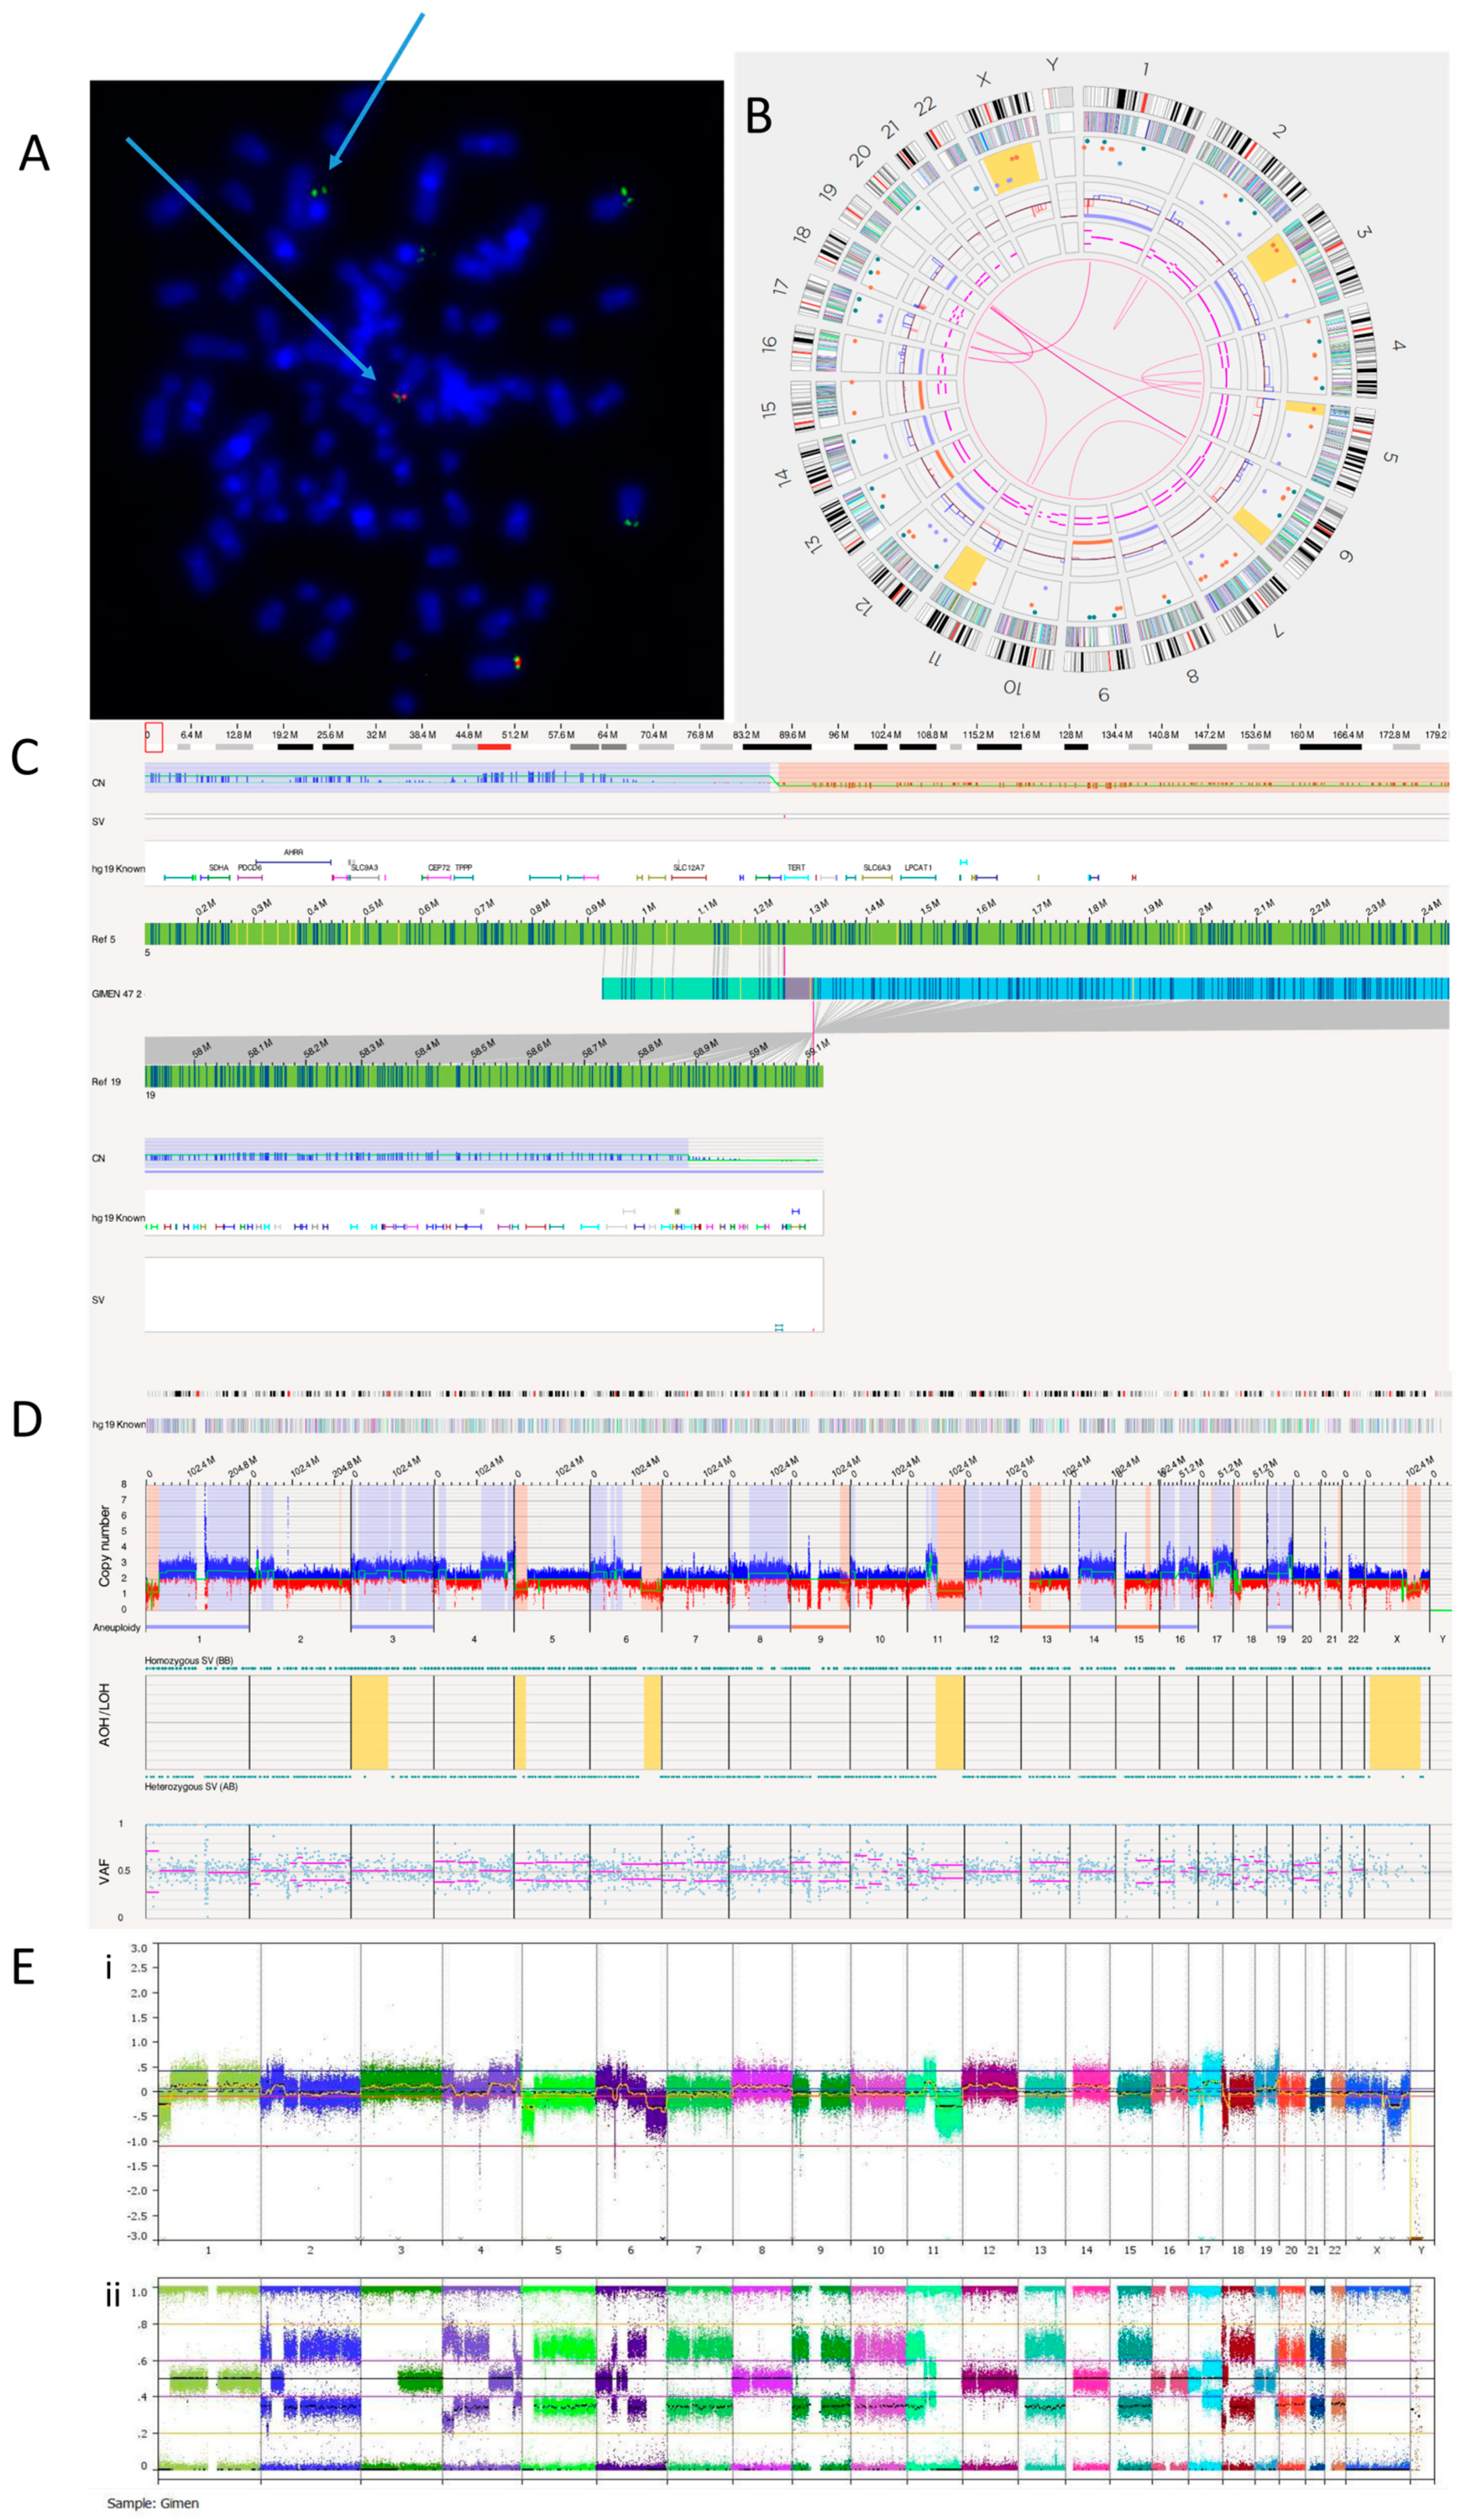
3.2.3. GI-ME-N Cell Line
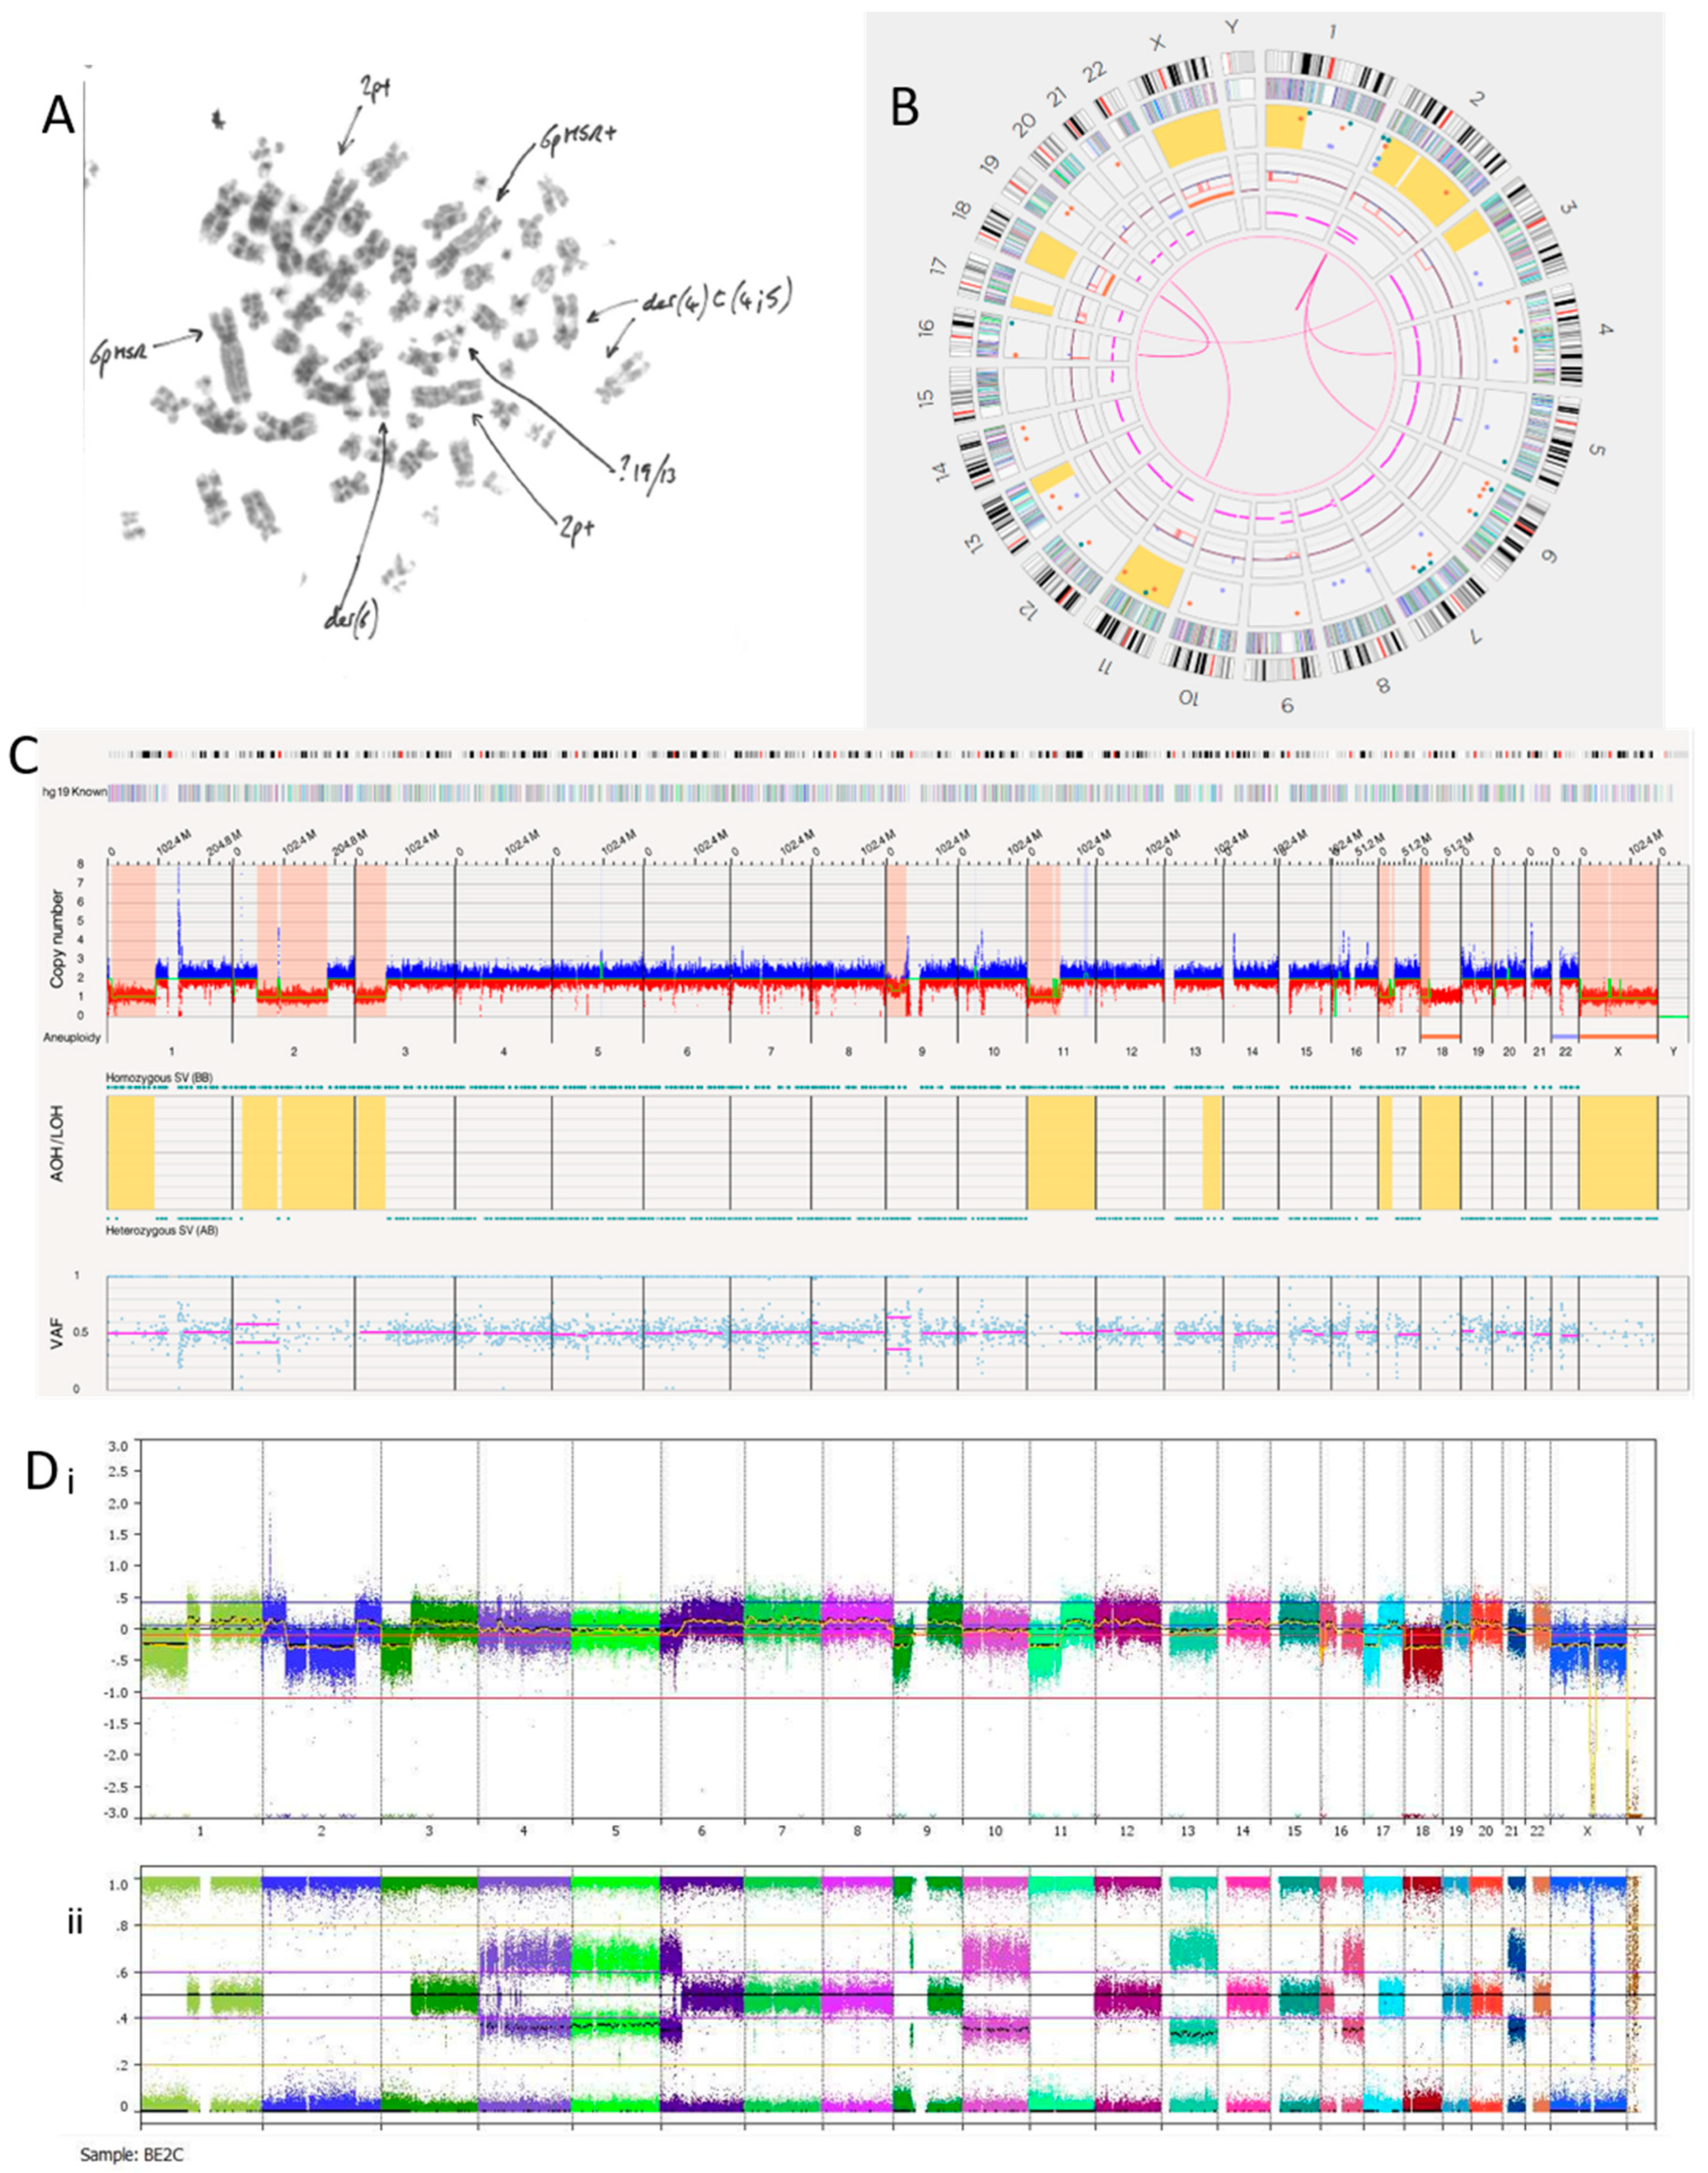
3.2.4. SK-N-BE(2)C Cell Line
3.2.5. NBLW Cell Line
3.3. Tumour Samples
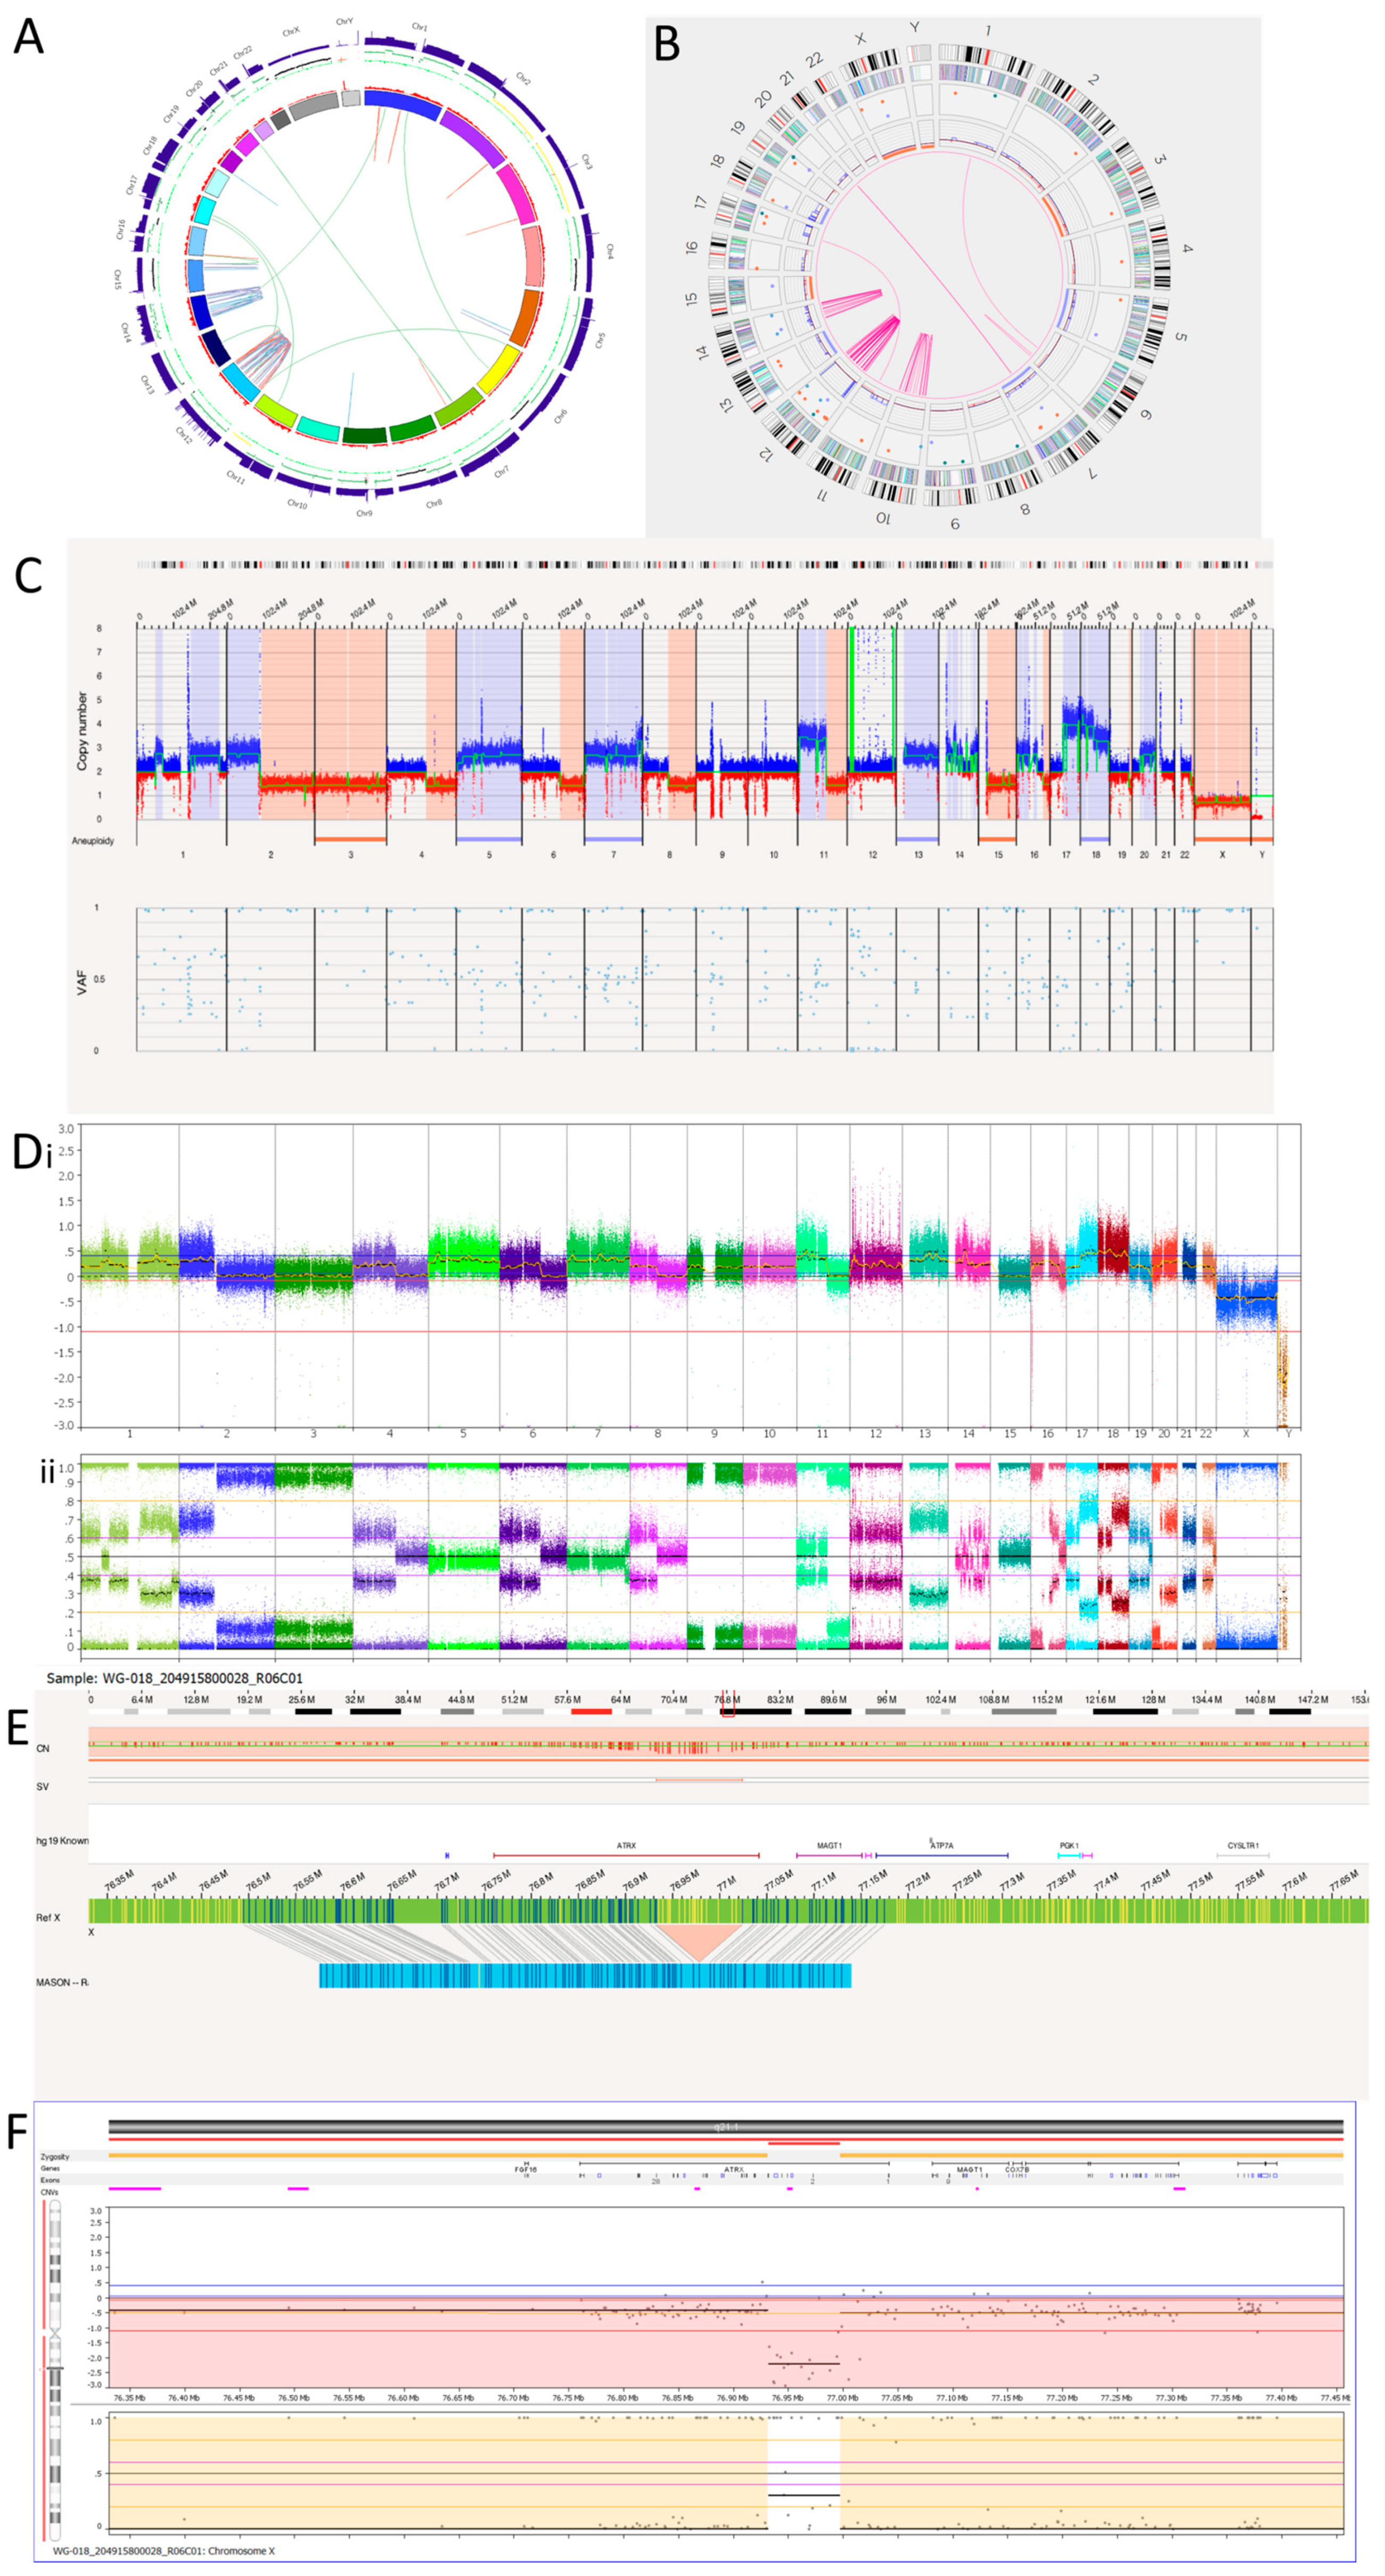
3.3.1. Tumour 1
3.3.2. Tumour 2
4. Discussion
5. Conclusions
Supplementary Materials
Author Contributions
Funding
Institutional Review Board Statement
Informed Consent Statement
Data Availability Statement
Acknowledgments
Conflicts of Interest
Abbreviations
References
- Zafar, A.; Wang, W.; Liu, G.; Wang, X.; Xian, W.; McKeon, F.; Foster, J.; Zhou, J.; Zhang, R. Molecular targeting therapies for neuroblastoma: Progress and challenges. Med. Res. Rev. 2021, 41, 961–1021. [Google Scholar] [CrossRef]
- Matthay, K.K.; Maris, J.M.; Schleiermacher, G.; Nakagawara, A.; Mackall, C.L.; Diller, L.; Weiss, W.A. Neuroblastoma. Nat. Rev. Dis. Prim. 2016, 2, 16078. [Google Scholar] [CrossRef] [PubMed]
- Kimura, S.; Sekiguchi, M.; Watanabe, K.; Hiwatarai, M.; Seki, M.; Yoshida, K.; Isobe, T.; Shiozawa, Y.; Suzuki, H.; Hoshino, N.; et al. Association of high-risk neuroblastoma classification based on expression profiles with differentiation and metabolism. PLoS ONE 2021, 16, e0245526. [Google Scholar] [CrossRef]
- Brodeur, G.M. Neuroblastoma: Biological insights into a clinical enigma. Nat. Rev. Cancer 2003, 3, 203–216. [Google Scholar] [CrossRef] [PubMed]
- Cohn, S.L.; Pearson, A.D.; London, W.B.; Monclair, T.; Ambros, P.F.; Brodeur, G.M.; Faldum, A.; Hero, B.; Iehara, T.; Machin, D.; et al. The International Neuroblastoma Risk Group (INRG) classification system: An INRG Task Force report. J. Clin. Oncol. 2009, 27, 289–297. [Google Scholar] [CrossRef] [PubMed]
- Brodeur, G.M.; Pritchard, J.; Berthold, F.; Carlsen, N.L.; Castel, V.; Castelberry, R.P.; De Bernardi, B.; Evans, A.E.; Favrot, M.; Hedborg, F.; et al. Revisions of the international criteria for neuroblastoma diagnosis, staging, and response to treatment. J. Clin. Oncol. 1993, 11, 1466–1477. [Google Scholar] [CrossRef]
- Cohn, S.L.; Tweddle, D.A. MYCN amplification remains prognostically strong 20 years after its “clinical debut”. Eur. J. Cancer 2004, 40, 2639–2642. [Google Scholar] [CrossRef]
- Molenaar, J.J.; Koster, J.; Zwijnenburg, D.A.; van Sluis, P.; Valentijn, L.J.; van der Ploeg, I.; Hamdi, M.; van Nes, J.; Westerman, B.A.; van Arkel, J.; et al. Sequencing of neuroblastoma identifies chromothripsis and defects in neuritogenesis genes. Nature 2012, 483, 589–593. [Google Scholar] [CrossRef]
- Schleiermacher, G.; Javanmardi, N.; Bernard, V.; Leroy, Q.; Cappo, J.; Rio Frio, T.; Pierron, G.; Lapouble, E.; Combaret, V.; Speleman, F.; et al. Emergence of new ALK mutations at relapse of neuroblastoma. J. Clin. Oncol. 2014, 32, 2727–2734. [Google Scholar] [CrossRef]
- Peifer, M.; Hertwig, F.; Roels, F.; Dreidax, D.; Gartlgruber, M.; Menon, R.; Krämer, A.; Roncaioli, J.L.; Sand, F.; Heuckmann, J.M.; et al. Telomerase activation by genomic rearrangements in high-risk neuroblastoma. Nature 2015, 526, 700–704. [Google Scholar] [CrossRef]
- Allinson, L.M.; Potts, A.; Goodman, A.; Bown, N.; Bashton, M.; Thompson, D.; Basta, N.O.; Gabriel, A.S.; McCorkindale, M.; Ng, A.; et al. Loss of ALK hotspot mutations in relapsed neuroblastoma. Genes Chromosom. Cancer 2022, 61, 747–753. [Google Scholar] [CrossRef] [PubMed]
- Eleveld, T.F.; Oldridge, D.A.; Bernard, V.; Koster, J.; Colmet Daage, L.; Diskin, S.J.; Schild, L.; Bentahar, N.B.; Bellini, A.; Chicard, M.; et al. Relapsed neuroblastomas show frequent RAS-MAPK pathway mutations. Nat. Genet. 2015, 47, 864–871. [Google Scholar] [CrossRef]
- Schleiermacher, G.; Michon, J.; Ribeiro, A.; Pierron, G.; Mosseri, V.; Rubie, H.; Munzer, C.; Bénard, J.; Auger, N.; Combaret, V.; et al. Segmental chromosomal alterations lead to a higher risk of relapse in infants with MYCN-non-amplified localised unresectable/disseminated neuroblastoma (a SIOPEN collaborative study). Br. J. Cancer 2011, 105, 1940–1948. [Google Scholar] [CrossRef] [PubMed]
- Janoueix-Lerosey, I.; Schleiermacher, G.; Michels, E.; Mosseri, V.; Ribeiro, A.; Lequin, D.; Vermeulen, J.; Couturier, J.; Peuchmaur, M.; Valent, A.; et al. Overall genomic pattern is a predictor of outcome in neuroblastoma. J. Clin. Oncol. 2009, 27, 1026–1033. [Google Scholar] [CrossRef]
- Pellestor, F. Chromoanagenesis: Cataclysms behind complex chromosomal rearrangements. Mol. Cytogenet. 2019, 12, 6. [Google Scholar] [CrossRef] [PubMed]
- Stephens, P.J.; Greenman, C.D.; Fu, B.; Yang, F.; Bignell, G.R.; Mudie, L.J.; Pleasance, E.D.; Lau, K.W.; Beare, D.; Stebbings, L.A.; et al. Massive genomic rearrangement acquired in a single catastrophic event during cancer development. Cell 2011, 144, 27–40. [Google Scholar] [CrossRef] [PubMed]
- Rosswog, C.; Bartenhagen, C.; Welte, A.; Kahlert, Y.; Hemstedt, N.; Lorenz, W.; Cartolano, M.; Ackermann, S.; Perner, S.; Vogel, W.; et al. Chromothripsis followed by circular recombination drives oncogene amplification in human cancer. Nat. Genet. 2021, 53, 1673–1685. [Google Scholar] [CrossRef]
- Cortés-Ciriano, I.; Gulhan, D.C.; Lee, J.J.; Melloni, G.E.M.; Park, P.J. Computational analysis of cancer genome sequencing data. Nat. Rev. Genet. 2022, 23, 298–314. [Google Scholar] [CrossRef]
- Shen, M.M. Chromoplexy: A new category of complex rearrangements in the cancer genome. Cancer Cell 2013, 23, 567–569. [Google Scholar] [CrossRef]
- Baca, S.C.; Prandi, D.; Lawrence, M.S.; Mosquera, J.M.; Romanel, A.; Drier, Y.; Park, K.; Kitabayashi, N.; MacDonald, T.Y.; Ghandi, M.; et al. Punctuated evolution of prostate cancer genomes. Cell 2013, 153, 666–677. [Google Scholar] [CrossRef]
- Lee, J.J.; Jung, Y.L.; Cheong, T.C.; Espejo Valle-Inclan, J.; Chu, C.; Gulhan, D.C.; Ljungström, V.; Jin, H.; Viswanadham, V.V.; Watson, E.V.; et al. ERα-associated translocations underlie oncogene amplifications in breast cancer. Nature 2023, 618, 1024–1032. [Google Scholar] [CrossRef] [PubMed]
- Lundberg, G.; Sehic, D.; Länsberg, J.K.; Øra, I.; Frigyesi, A.; Castel, V.; Navarro, S.; Piqueras, M.; Martinsson, T.; Noguera, R.; et al. Alternative lengthening of telomeres—An enhanced chromosomal instability in aggressive non-MYCN amplified and telomere elongated neuroblastomas. Genes Chromosom. Cancer 2011, 50, 250–262. [Google Scholar] [CrossRef] [PubMed]
- Shay, J.W.; Wright, W.E. Hayflick, his limit, and cellular ageing. Nat. Rev. Mol. Cell Biol. 2000, 1, 72–76. [Google Scholar] [CrossRef]
- Dratwa, M.; Wysoczańska, B.; Łacina, P.; Kubik, T.; Bogunia-Kubik, K. TERT-Regulation and Roles in Cancer Formation. Front. Immunol. 2020, 11, 589929. [Google Scholar] [CrossRef] [PubMed]
- Nabetani, A.; Ishikawa, F. Alternative lengthening of telomeres pathway: Recombination-mediated telomere maintenance mechanism in human cells. J. Biochem. 2011, 149, 5–14. [Google Scholar] [CrossRef]
- Farooqi, A.S.; Dagg, R.A.; Choi, L.M.; Shay, J.W.; Reynolds, C.P.; Lau, L.M. Alternative lengthening of telomeres in neuroblastoma cell lines is associated with a lack of MYCN genomic amplification and with p53 pathway aberrations. J. Neurooncol. 2014, 119, 17–26. [Google Scholar] [CrossRef]
- Mantere, T.; Neveling, K.; Pebrel-Richard, C.; Benoist, M.; van der Zande, G.; Kater-Baats, E.; Baatout, I.; van Beek, R.; Yammine, T.; Oorsprong, M.; et al. Optical genome mapping enables constitutional chromosomal aberration detection. Am. J. Hum. Genet. 2021, 108, 1409–1422. [Google Scholar] [CrossRef]
- Biomnis. Constitutional Cyto- and Molecular Genetics: Karyotyping, FISH and CGH Array. Available online: https://www.eurofins-biomnis.com/wp-content/uploads/2016/04/56-INTGB-Focus_Karyotyping_SNP_array.pdf (accessed on 7 October 2023).
- BionanoGenomics. Revolutionising Cytogenomics. Available online: https://bionanogenomics.com/wp-content/uploads/2022/05/30368_Rev.C_Cytogenetics-Vignette_DIGITAL.pdf (accessed on 7 October 2023).
- Genomics, B. See Structural Variation Like Never before with Bionano Optical Genome Mapping. Available online: https://eira.ams3.cdn.digitaloceanspaces.com/files/referrals/bOHnz1U922QRjdNU4veKMJga4Jz4JZKV55HB6Gp9.pdf (accessed on 10 January 2022).
- BionanoGenomics. Hematological Malignancies and Solid Tumour Research. Available online: https://bionanogenomics.com/wp-content/uploads/2022/05/30367_-Rev.B-_Cancer-Vignettes-Effective_DIGITAL.pdf (accessed on 7 October 2023).
- Hoyt, S.J.; Storer, J.M.; Hartley, G.A.; Grady, P.G.S.; Gershman, A.; de Lima, L.G.; Limouse, C.; Halabian, R.; Wojenski, L.; Rodriguez, M.; et al. From telomere to telomere: The transcriptional and epigenetic state of human repeat elements. Science 2022, 376, eabk3112. [Google Scholar] [CrossRef]
- Tembrink, M.; Gerding, W.M.; Wieczorek, S.; Mika, T.; Schroers, R.; Nguyen, H.P.; Vangala, D.B.; Nilius-Eliliwi, V. Novel NUP98::ASH1L Gene Fusion in Acute Myeloid Leukemia Detected by Optical Genome Mapping. Cancers 2023, 15, 2942. [Google Scholar] [CrossRef]
- Peng, Y.; Yuan, C.; Tao, X.; Zhao, Y.; Yao, X.; Zhuge, L.; Huang, J.; Zheng, Q.; Zhang, Y.; Hong, H.; et al. Integrated analysis of optical mapping and whole-genome sequencing reveals intratumoral genetic heterogeneity in metastatic lung squamous cell carcinoma. Transl. Lung Cancer Res. 2020, 9, 670–681. [Google Scholar] [CrossRef]
- Wong, K.E.; Mora, M.C.; Sultana, N.; Moriarty, K.P.; Arenas, R.B.; Yadava, N.; Schneider, S.S.; Tirabassi, M.V. Evaluation of Rhodiola crenulata on growth and metabolism of NB-1691, an MYCN-amplified neuroblastoma cell line. Tumour Biol. 2018, 40, 1010428318779515. [Google Scholar] [CrossRef] [PubMed]
- Tucker, E.R.; Jiménez, I.; Chen, L.; Bellini, A.; Gorrini, C.; Calton, E.; Gao, Q.; Che, H.; Poon, E.; Jamin, Y.; et al. Combination Therapies Targeting ALK-aberrant Neuroblastoma in Preclinical Models. Clin. Cancer Res. 2023, 29, 1317–1331. [Google Scholar] [CrossRef] [PubMed]
- Lindner, S.; Bachmann, H.S.; Odersky, A.; Schaefers, S.; Klein-Hitpass, L.; Hero, B.; Fischer, M.; Eggert, A.; Schramm, A.; Schulte, J.H. Absence of telomerase reverse transcriptase promoter mutations in neuroblastoma. Biomed. Rep. 2015, 3, 443–446. [Google Scholar] [CrossRef] [PubMed]
- Biedler, J.L.; Roffler-Tarlov, S.; Schachner, M.; Freedman, L.S. Multiple neurotransmitter synthesis by human neuroblastoma cell lines and clones. Cancer Res. 1978, 38, 3751–3757. [Google Scholar] [PubMed]
- Cornaglia-Ferraris, P.; Ponzoni, M.; Montaldo, P.; Mariottini, G.L.; Donti, E.; Di Martino, D.; Tonini, G.P. A new human highly tumorigenic neuroblastoma cell line with undetectable expression of N-myc. Pediatr. Res. 1990, 27, 1–6. [Google Scholar] [CrossRef]
- Tweddle, D.A.; Malcolm, A.J.; Bown, N.; Pearson, A.D.; Lunec, J. Evidence for the development of p53 mutations after cytotoxic therapy in a neuroblastoma cell line. Cancer Res. 2001, 61, 8–13. [Google Scholar]
- Biedler, J.L.; Spengler, B.A.; Ross, R.A. Chromosomal and biochemical properties of human neuroblastoma cell lines and clones in cell culture. Gaslini 1979, 11, 128. [Google Scholar]
- Chen, L.; Humphreys, A.; Turnbull, L.; Bellini, A.; Schleiermacher, G.; Salwen, H.; Cohn, S.L.; Bown, N.; Tweddle, D.A. Identification of different ALK mutations in a pair of neuroblastoma cell lines established at diagnosis and relapse. Oncotarget 2016, 7, 87301–87311. [Google Scholar] [CrossRef]
- Foley, J.; Cohn, S.L.; Salwen, H.R.; Chagnovich, D.; Cowan, J.; Mason, K.L.; Parysek, L.M. Differential expression of N-myc in phenotypically distinct subclones of a human neuroblastoma cell line. Cancer Res. 1991, 51, 6338–6345. [Google Scholar]
- QIAGEN. AllPrep DNA/RNA Mini Handbook. Available online: www.qiagen.com/us/resources/resourcedetail?id=580866a6-56c6-4674-8566-2852164d8519&lang=en (accessed on 7 October 2023).
- Illumina Automatic Data Analysis. RNA Fusion Analysis Module. Available online: https://emea.illumina.com/products/by-type/informatics-products/local-run-manager.html (accessed on 7 October 2023).
- Depuydt, P.; Boeva, V.; Hocking, T.D.; Cannoodt, R.; Ambros, I.M.; Ambros, P.F.; Asgharzadeh, S.; Attiyeh, E.F.; Combaret, V.; Defferrari, R.; et al. Genomic Amplifications and Distal 6q Loss: Novel Markers for Poor Survival in High-risk Neuroblastoma Patients. J. Natl. Cancer Inst. 2018, 110, 1084–1093. [Google Scholar] [CrossRef]
- Onagoruwa, O.T.; Pal, G.; Ochu, C.; Ogunwobi, O.O. Oncogenic Role of PVT1 and Therapeutic Implications. Front. Oncol. 2020, 10, 17. [Google Scholar] [CrossRef] [PubMed]
- Zimmerman, M.W.; Liu, Y.; He, S.; Durbin, A.D.; Abraham, B.J.; Easton, J.; Shao, Y.; Xu, B.; Zhu, S.; Zhang, X.; et al. MYC Drives a Subset of High-Risk Pediatric Neuroblastomas and Is Activated through Mechanisms Including Enhancer Hijacking and Focal Enhancer Amplification. Cancer Discov. 2018, 8, 320–335. [Google Scholar] [CrossRef]
- Tolomeo, D.; Agostini, A.; Visci, G.; Traversa, D.; Storlazzi, C.T. PVT1: A long non-coding RNA recurrently involved in neoplasia-associated fusion transcripts. Gene 2021, 779, 145497. [Google Scholar] [CrossRef] [PubMed]
- TP73 Tumour Protein p73. Available online: https://www.ncbi.nlm.nih.gov/gtr/genes/7161/ (accessed on 5 October 2023).
- Zeineldin, M.; Federico, S.; Chen, X.; Fan, Y.; Xu, B.; Stewart, E.; Zhou, X.; Jeon, J.; Griffiths, L.; Nguyen, R.; et al. MYCN amplification and ATRX mutations are incompatible in neuroblastoma. Nat. Commun. 2020, 11, 913. [Google Scholar] [CrossRef] [PubMed]
- Hölzel, M.; Huang, S.; Koster, J.; Ora, I.; Lakeman, A.; Caron, H.; Nijkamp, W.; Xie, J.; Callens, T.; Asgharzadeh, S.; et al. NF1 is a tumor suppressor in neuroblastoma that determines retinoic acid response and disease outcome. Cell 2010, 142, 218–229. [Google Scholar] [CrossRef] [PubMed]
- Chen, X.; Schulz-Trieglaff, O.; Shaw, R.; Barnes, B.; Schlesinger, F.; Källberg, M.; Cox, A.J.; Kruglyak, S.; Saunders, C.T. Manta: Rapid detection of structural variants and indels for germline and cancer sequencing applications. Bioinformatics 2016, 32, 1220–1222. [Google Scholar] [CrossRef]
- Emanuel, B.S.; Balaban, G.; Boyd, J.P.; Grossman, A.; Negishi, M.; Parmiter, A.; Glick, M.C. N-myc amplification in multiple homogeneously staining regions in two human neuroblastomas. Proc. Natl. Acad. Sci. USA 1985, 82, 3736–3740. [Google Scholar] [CrossRef]
- Moreau, L.A.; McGrady, P.; London, W.B.; Shimada, H.; Cohn, S.L.; Maris, J.M.; Diller, L.; Look, A.T.; George, R.E. Does MYCN amplification manifested as homogeneously staining regions at diagnosis predict a worse outcome in children with neuroblastoma? A Children’s Oncology Group study. Clin. Cancer Res. 2006, 12, 5693–5697. [Google Scholar] [CrossRef]
- Shoshani, O.; Brunner, S.F.; Yaeger, R.; Ly, P.; Nechemia-Arbely, Y.; Kim, D.H.; Fang, R.; Castillon, G.A.; Yu, M.; Li, J.S.Z.; et al. Chromothripsis drives the evolution of gene amplification in cancer. Nature 2021, 591, 137–141. [Google Scholar] [CrossRef]
- GeneCards. BEST3 Gene—Bestrophin 3. Available online: https://www.genecards.org/cgi-bin/carddisp.pl?gene=BEST3#:~:text=GeneCards%20Summary%20for%20BEST3%20Gene,anions%20and%20amino%20acids%2Foligopeptides (accessed on 7 October 2023).
- Zhang, T.T.; Lei, Q.Q.; He, J.; Guan, X.; Zhang, X.; Huang, Y.; Zhou, Z.Y.; Fan, R.X.; Wang, T.; Li, C.X.; et al. Bestrophin3 Deficiency in Vascular Smooth Muscle Cells Activates MEKK2/3-MAPK Signaling to Trigger Spontaneous Aortic Dissection. Circulation 2023, 148, 589–606. [Google Scholar] [CrossRef]
- Matchkov, V.V.; Larsen, P.; Bouzinova, E.V.; Rojek, A.; Boedtkjer, D.M.; Golubinskaya, V.; Pedersen, F.S.; Aalkjaer, C.; Nilsson, H. Bestrophin-3 (vitelliform macular dystrophy 2-like 3 protein) is essential for the cGMP-dependent calcium-activated chloride conductance in vascular smooth muscle cells. Circ. Res. 2008, 103, 864–872. [Google Scholar] [CrossRef] [PubMed]
- GeneCards. PTPRR Gene—Protein Tyrosine Phosphatase Receptor Type R. Available online: https://maayanlab.cloud/Harmonizome/gene/PTPRR (accessed on 7 October 2023).
- Su, P.H.; Lin, Y.W.; Huang, R.L.; Liao, Y.P.; Lee, H.Y.; Wang, H.C.; Chao, T.K.; Chen, C.K.; Chan, M.W.; Chu, T.Y.; et al. Epigenetic silencing of PTPRR activates MAPK signaling, promotes metastasis and serves as a biomarker of invasive cervical cancer. Oncogene 2013, 32, 15–26. [Google Scholar] [CrossRef] [PubMed]


| Cell Line | Sex | Age | Origin | TMM Status | MYCN Amp | TP53 Status | ALK Status | MDM2 Amp | Reference |
|---|---|---|---|---|---|---|---|---|---|
| NB1691 | M | 1.9 y | Derived from a recurrent retroperitoneal NB tumour | MNA (TERT + ve) | Amp | WT | Amp | Amp | [35,36] |
| SH-SY5Y | F | 4 y | Clone of the SKNSH cell line derived from a bone marrow biopsy from a relapsed metastatic NB | C288T TERT promoter mutation (TERT + ve) | Non-amp | WT | Mutant F1174L | Non-amp | [37,38] |
| GI-ME-N | F | 2 y | Derived from bone marrow of a patient with stage 4 NB after six months of chemotherapy | TERT rearrangement (TERT + ve) | Non-amp | WT | WT | Non-amp | [10,39] |
| SK-N-BE(2)C | M | 22 mo | Subclone of the SK-N-BE(2) NB cell line taken from bone marrow after chemotherapy and radiotherapy | MNA (TERT + ve) | Amp | Mutant C135F | WT | Non-amp | [40,41] |
| NBLW | M | 6 mo | Derived from the primary adrenal tumour of a child with pre-treatment metastatic stage 4S NB with metastasis to the liver | MNA (TERT + ve) | amp | WT | Mutant R1275L | Non-amp | [42,43] |
| Patient ID | Sex | Age at Diagnosis | Sample | INRG Risk | INSS | INRG Stage | Histology | MYCN Status | Status | TCC% |
|---|---|---|---|---|---|---|---|---|---|---|
| 1 | M | 5 y, 2 mo | R | High | 4 | M | UH | Non-MNA | DOD | 90 |
| 2 | M | 2 y, 2 mo | PC | Int | 3 | L2 | UH | Non-MNA | ADF | 60 |
| Map Rate (%) | Label Density (/1000 kbp) | Effective Coverage | Molecules N50 (≥150 kbp and min Sites ≥ 9) (kbp) | Total DNA (≥150 kbp) (Gbp) | |
|---|---|---|---|---|---|
| SH-SY5Y | 56.0 | 12.33 | 276.20 | 215.27 | 1601.27 |
| NBLW | 78.3 | 13.87 | 391.47 | 329.92 | 1600.44 |
| NB1691 | 61.3 | 10.57 | 94.32 | 242.25 | 582.80 |
| GI-ME-N | 77.6 | 15.74 | 357.87 | 308.63 | 1470.66 |
| SK-N-BE(2)C | 92.4 | 15.50 | 469.56 | 310.88 | 1627.05 |
| Tumour 1 | 63.1 | 19.32 | 317.46 | 279.00 | 1610.73 |
| Tumour 2 | 82.4 | 15.40 | 410.41 | 253.13 | 1600.89 |
| Recommended Values | ≥70 | 14–17 | ~400x/~80x * | ≥230 | ~1600 |
| Definitions | Percentage of molecules that are 150 kbp or longer and mapped tothe hg19 genome reference | Average number of labels per 100 kbp for the molecules that are 150 kbp or longer | Total amount of aligned DNA divided by the size of the reference genome times the map rate | N50 of the molecules that are 150 kbp or longer, but molecules must have at least 9 labels | Total amount of DNA from molecules that are 150 kbp or longer |
| Ploidy | SNP Array | OGM | ||
|---|---|---|---|---|
| Cell Line | NB1691 | 2n | +7, +17, +22; +1p, +1q, +5p, +6p, +6q, +12p, +12q, +16q, +19p, +20q, +20q, +Xq Amplicons: 2p, 12q Complex: Chr5 | +7, +17, +22; +1p, +1q, +5p, +6p, +6q, +12p, +12q, +16q, +19p, +20q, +20q, +Xq Amplicons: 2p, 12q Complex: Chr5 |
| SH-SY5Y | 2n | +7; +1q, +17q; −14p, −22q | +7, −19; +1q, +17q; −1p, −4p, −9q, −14q, −22q Complex: Chr7 | |
| GI-ME-N | 4n | −7, −9, −13, −15, −20, −21, −22; +4q, +11q, +17q, +19q, +Xp, +Xq; −1p, −2p, −2q, −4q, −4q, −5p, −5q, −6p, −6q, −6q, −10pq, −11p, −11q, −18p, −18p, −18q | −7, −9, −13, −15, −20, −21, −22; +4q, +11q, +17q, +19q, +Xp, +Xq; −1p, −2p, −2q, −4q, −4q, −5p, −5q, −6p, −6q, −6q, −10pq, −11p, −11q, −18p, −18p, −18q | |
| SK-N-BE(2)C | 2n/4n | −4, −5, −10, −13, −18, −21; −1p, −2q, −3p, −6p, −9p, −9p, −11p, −16q, −17p, −20p, −Xq; Amplicon: 2p Complex: Chr4 | −18; −1p, −2q, −3p, −9p, −11p, −17p, −20p Amplicon: 2p Complex:— | |
| NBLW | 2n | +1q, +2p, +17q Amplicon: 2p | +1q, +2p, +17q Amplicon: 2p | |
| Tumour | T1 | 3n | +5, +13; −3, −15; +1p, +1q, +2p, +7p, +7q, +7q, +7q, +11p, +16p, +16q, +17q, +18p, +18q, +20q; −2q, −4q, −6q, −8q, −11q, −16q, −19q, −22q Amplicons: Chr12 Complex: Chr12, chr14 ATRX deletion | +5, +13; −3, −15; +1p, +1q, +2p, +7p, +7q, +7q, +7q, +11p, +16p, +16q, +17q, +18p, +18q, +20q; −2q, −4q, −6q, −8q, −11q, −16q, −19q, −22q Amplicons: Chr12 Complex: Chr12, chr14 ATRX deletion |
| T2 | 4n | −3, −4, −14, −15, −16 | +6, +7, +9, +11, +17; −3, −4, −14, −15, −16 | |
| Location | Overlap Gene(s) | Confidence | Self-Molecule Count | |
|---|---|---|---|---|
| Inter -chromosomal Translocations | t(17;22)(q21.31;q13.1) | MICALL1 | 0.91 | 17 |
| t(7;8)(q33;q24.21) | EXOC4;PVT1 | 0.61 | 36 | |
| t(7;8)(q33;q24.21) | EXOC4;PVT1 | 0.82 | 23 | |
| t(7;8)(q33;q24.21) | EXOC4;PVT1 | 0.70 | 26 | |
| t(15;22)(q24.2;q12.3) | NPTN;SLC5A1 | 0.07 | 16 | |
| t(15;22)(q24.2;q12.3) | NPTN;SLC5A1 | 0.24 | 16 | |
| t(15;22)(q24.2;q12.3) | 0.10 | 20 | ||
| t(15;22)(q24.2;q12.3) | 0.52 | 22 | ||
| Intra-chromosomal Fusions | inv(4)(p15.33p15.1) | 0.16 | 7 | |
| inv(4)(p15.33p15.1) | 0.38 | 7 | ||
| inv(1)(q21.1q32.1) | 0.06 | 65 | ||
| inv(14)(q13.3q21.3) | PAX9 | 0.15 | 30 |
| Location | Overlap Gene(s) | Confidence | Self-Molecule Count | |
|---|---|---|---|---|
| Translocations | t(4;5)(p15.1;p13.3) | 0.08 | 16 | |
| t(5;19)(p15.33;q13.43) | TERT * | 0.12 | 25 | |
| t(1;17)(p35.2;q11.2) | NF1 | 0.08 | 19 | |
| t(1;17)(p35.2;q11.2) | NF1 | 0.1 | 18 | |
| t(11;17)(q13.4;q12) | SHANK2;AP2B1 | 0.13 | 33 | |
| t(16;19)(q24.3;q13.33) | MYH14 | 0.07 | 24 | |
| t(16;19)(q24.3;q13.33) | MYH14 | 0.31 | 26 | |
| t(6;19)(p21.31;q132.2) | ZNF574 | 0.71 | 11 | |
| t(6;19)(p21.31;q132.2) | ZNF574 | 0.80 | 14 | |
| t(6;19)(p21.31;q132.2) | FKBP5 | 0.24 | 17 | |
| t(6;19)(p21.31;q132.2) | FKBP5 | 0.56 | 16 | |
| t(4;11)(q34.2;p11.2) | SPCS3 | 0.32 | 21 | |
| t(6;10)(q14.1;p14) | 0.66 | 26 | ||
| Intrachromosomal-Fusions | inv(18)(p11.32p11.31) | COLEC12 | 0.06 | 27 |
| inv(4)(q25q33) | 0.23 | 8 | ||
| inv(2)(p23.3p16.1) | RAB10;CCDC85A | 0.38 | 10 |
| Location | Overlap Gene(s) | Confidence | Self-Molecule Count | |
|---|---|---|---|---|
| Interchromosomal Translocations | t(1;2)(p21.3;p16.3) | 0.03 | 30 | |
| t(1;2)(p21.3;p16.3) | 0.02 | 30 | ||
| t(16;19)(p11.2;p13.3) | SRCAP;GNG7 | 0.47 | 24 | |
| t(16;19)(p11.2;p13.3) | SRCAP;GNG7 | 0.13 | 23 | |
| t(16;19)(p11.2;p13.3) | SRCAP;GNG7 | 0.32 | 11 | |
| t(16;19)(p11.2;p13.3) | SRCAP;GNG7 | 0.20 | 10 | |
| t(2;6)(p24.3;p21.1) | CDC5L | 0.63 | 24 | |
| t(2;6)(p24.3;p21.1) | CDC5L | 0.26 | 17 | |
| t(2;4)(p24.3;q22.3) | 0.56 | 13 | ||
| t(2;4)(p24.3;q22.3) | MYCN;SMARCAD1 | 0.71 | 18 | |
| t(11;20)(q13.1;p15) | 0.36 | 21 | ||
| t(11;20)(q13.1;p15) | 0.07 | 18 | ||
| t(3;17)(p14.2;q11.2) | 0.71 | 25 | ||
| Intrachromosomal Fusions | inv(2)(p24.3) | MYCN | 0.90 | 2277 |
| inv(2)(p24.3) | MYCN | 0.87 | 1691 | |
| inv(2)(p24.3) | MYCN | 0.83 | 90 | |
| inv(2)(p24.3) | MYCN | 0.71 | 1869 | |
| inv(2)(p24.3) | MYCN | 0.60 | 2064 | |
| inv(2)(p24.3) | MYCN | 0.44 | 1407 | |
| inv(2)(p24.3) | MYCN | 0.38 | 1940 | |
| inv(2)(p24.3) | MYCN | 0.34 | 1697 | |
| inv(2)(p24.3) | MYCN | 0.31 | 2131 | |
| inv(2)(p24.3) | MYCN | 0.28 | 1299 | |
| inv(2)(p24.3) | MYCN | 0.28 | 972 | |
| inv(2)(p24.3) | MYCN | 0.08 | 1174 |
| Chromosome | Overlap Genes |
|---|---|
| 10 | FBXW4, ZMIZ1, PFKP, STAM, NT5C2, A1CF, GBF1, PAX2 |
| 12 | SYNE2, AKAPB, C12orf, ESRRB, JDP2, VIPAS39, UNC79, TRAF3 |
| 14 | CLEC12A, CCDC64, NAV3, PTPRO, OS9, XRCC6BP1, SLC6A12, FGD6, NELL2, SRRM4, FAM19A2, APAF1, ZDHHC17, ANO4 |
| Translocation | OGM Coordinates (GRCh37) | WGS Coordinates (GRCh38) | Match |
|---|---|---|---|
| t(1;6)(q21.3;q16.3) | chr1:150,853,601; chr6:104,007,705 | 1:150871900; ]6:103570849]C | Yes |
| t(1;14)(p31.1;q12) | - | 1:71560430; T]14:27860966] | No |
| t(6;12)(p25.2;p13.33) | - | 6:3021510; T [12:1788929[ | No |
| t(7;20)(q21.12;q13.33) | chr7: 86,811,692; chr20:62,427,892 | 7:87177999; ]20:63799630]A | Yes |
| t(7;20)(q21.12;q13.33) | chr7: 87,695,509; chr20:62,388,312 | 7:88067384; T [20:63755363[ | Yes |
| t(11;17)(q14.1;q12) | chr11: 78,017,590; chr17:34,015,764 | 11:78308141; T [17:35687851[ | Yes |
| t(15;16)(q26.1;p13.3) | - | 15:90362018; [16:2115042[C | No |
| t(15;16)(q26.1;p13.3) | - | 15:90362040; [16:2103430[T | No |
| t(15;16)(q26.1;p13.3) | - | 15:90362495; G]16:2103629] | No |
| t(15;16)(q26.1;p13.3) | - | 15:90593439; T [16:2115136[ | No |
| Hyper-rearrangement | OGM present | WGS present | Match |
| Chr10 hyper-rearrangement | Present | Not detected | No |
| Chr12 hyper-rearrangement | Present | Present | Yes |
| Chr14 hyper-rearrangement | Present | Present | Yes |
Disclaimer/Publisher’s Note: The statements, opinions and data contained in all publications are solely those of the individual author(s) and contributor(s) and not of MDPI and/or the editor(s). MDPI and/or the editor(s) disclaim responsibility for any injury to people or property resulting from any ideas, methods, instructions or products referred to in the content. |
© 2023 by the authors. Licensee MDPI, Basel, Switzerland. This article is an open access article distributed under the terms and conditions of the Creative Commons Attribution (CC BY) license (https://creativecommons.org/licenses/by/4.0/).
Share and Cite
Barford, R.G.; Whittle, E.; Weir, L.; Fong, F.C.; Goodman, A.; Hartley, H.E.; Allinson, L.M.; Tweddle, D.A. Use of Optical Genome Mapping to Detect Structural Variants in Neuroblastoma. Cancers 2023, 15, 5233. https://doi.org/10.3390/cancers15215233
Barford RG, Whittle E, Weir L, Fong FC, Goodman A, Hartley HE, Allinson LM, Tweddle DA. Use of Optical Genome Mapping to Detect Structural Variants in Neuroblastoma. Cancers. 2023; 15(21):5233. https://doi.org/10.3390/cancers15215233
Chicago/Turabian StyleBarford, Ruby G., Emily Whittle, Laura Weir, Fang Chyi Fong, Angharad Goodman, Hannah E. Hartley, Lisa M. Allinson, and Deborah A. Tweddle. 2023. "Use of Optical Genome Mapping to Detect Structural Variants in Neuroblastoma" Cancers 15, no. 21: 5233. https://doi.org/10.3390/cancers15215233
APA StyleBarford, R. G., Whittle, E., Weir, L., Fong, F. C., Goodman, A., Hartley, H. E., Allinson, L. M., & Tweddle, D. A. (2023). Use of Optical Genome Mapping to Detect Structural Variants in Neuroblastoma. Cancers, 15(21), 5233. https://doi.org/10.3390/cancers15215233