
Unsupervised Analysis Reveals the Involvement of Key Immune Response Genes and the Matrisome in Resistance to BRAF and MEK Inhibitors in Melanoma


Abstract
:Simple Summary
Abstract
1. Introduction
2. Material and Methods
3. Results
3.1. The Clustering of Tumors and Patients Reveals No Clustering by Pre-Treatment or Post-Treatment, or by Any Other Criteria
3.2. Analysis Using the Melanoma-Specific Gene Set also Returned No Significant Clustering
3.3. Unsupervised Differential Gene Expression Analysis
3.4. Gene Set Enrichment Analysis
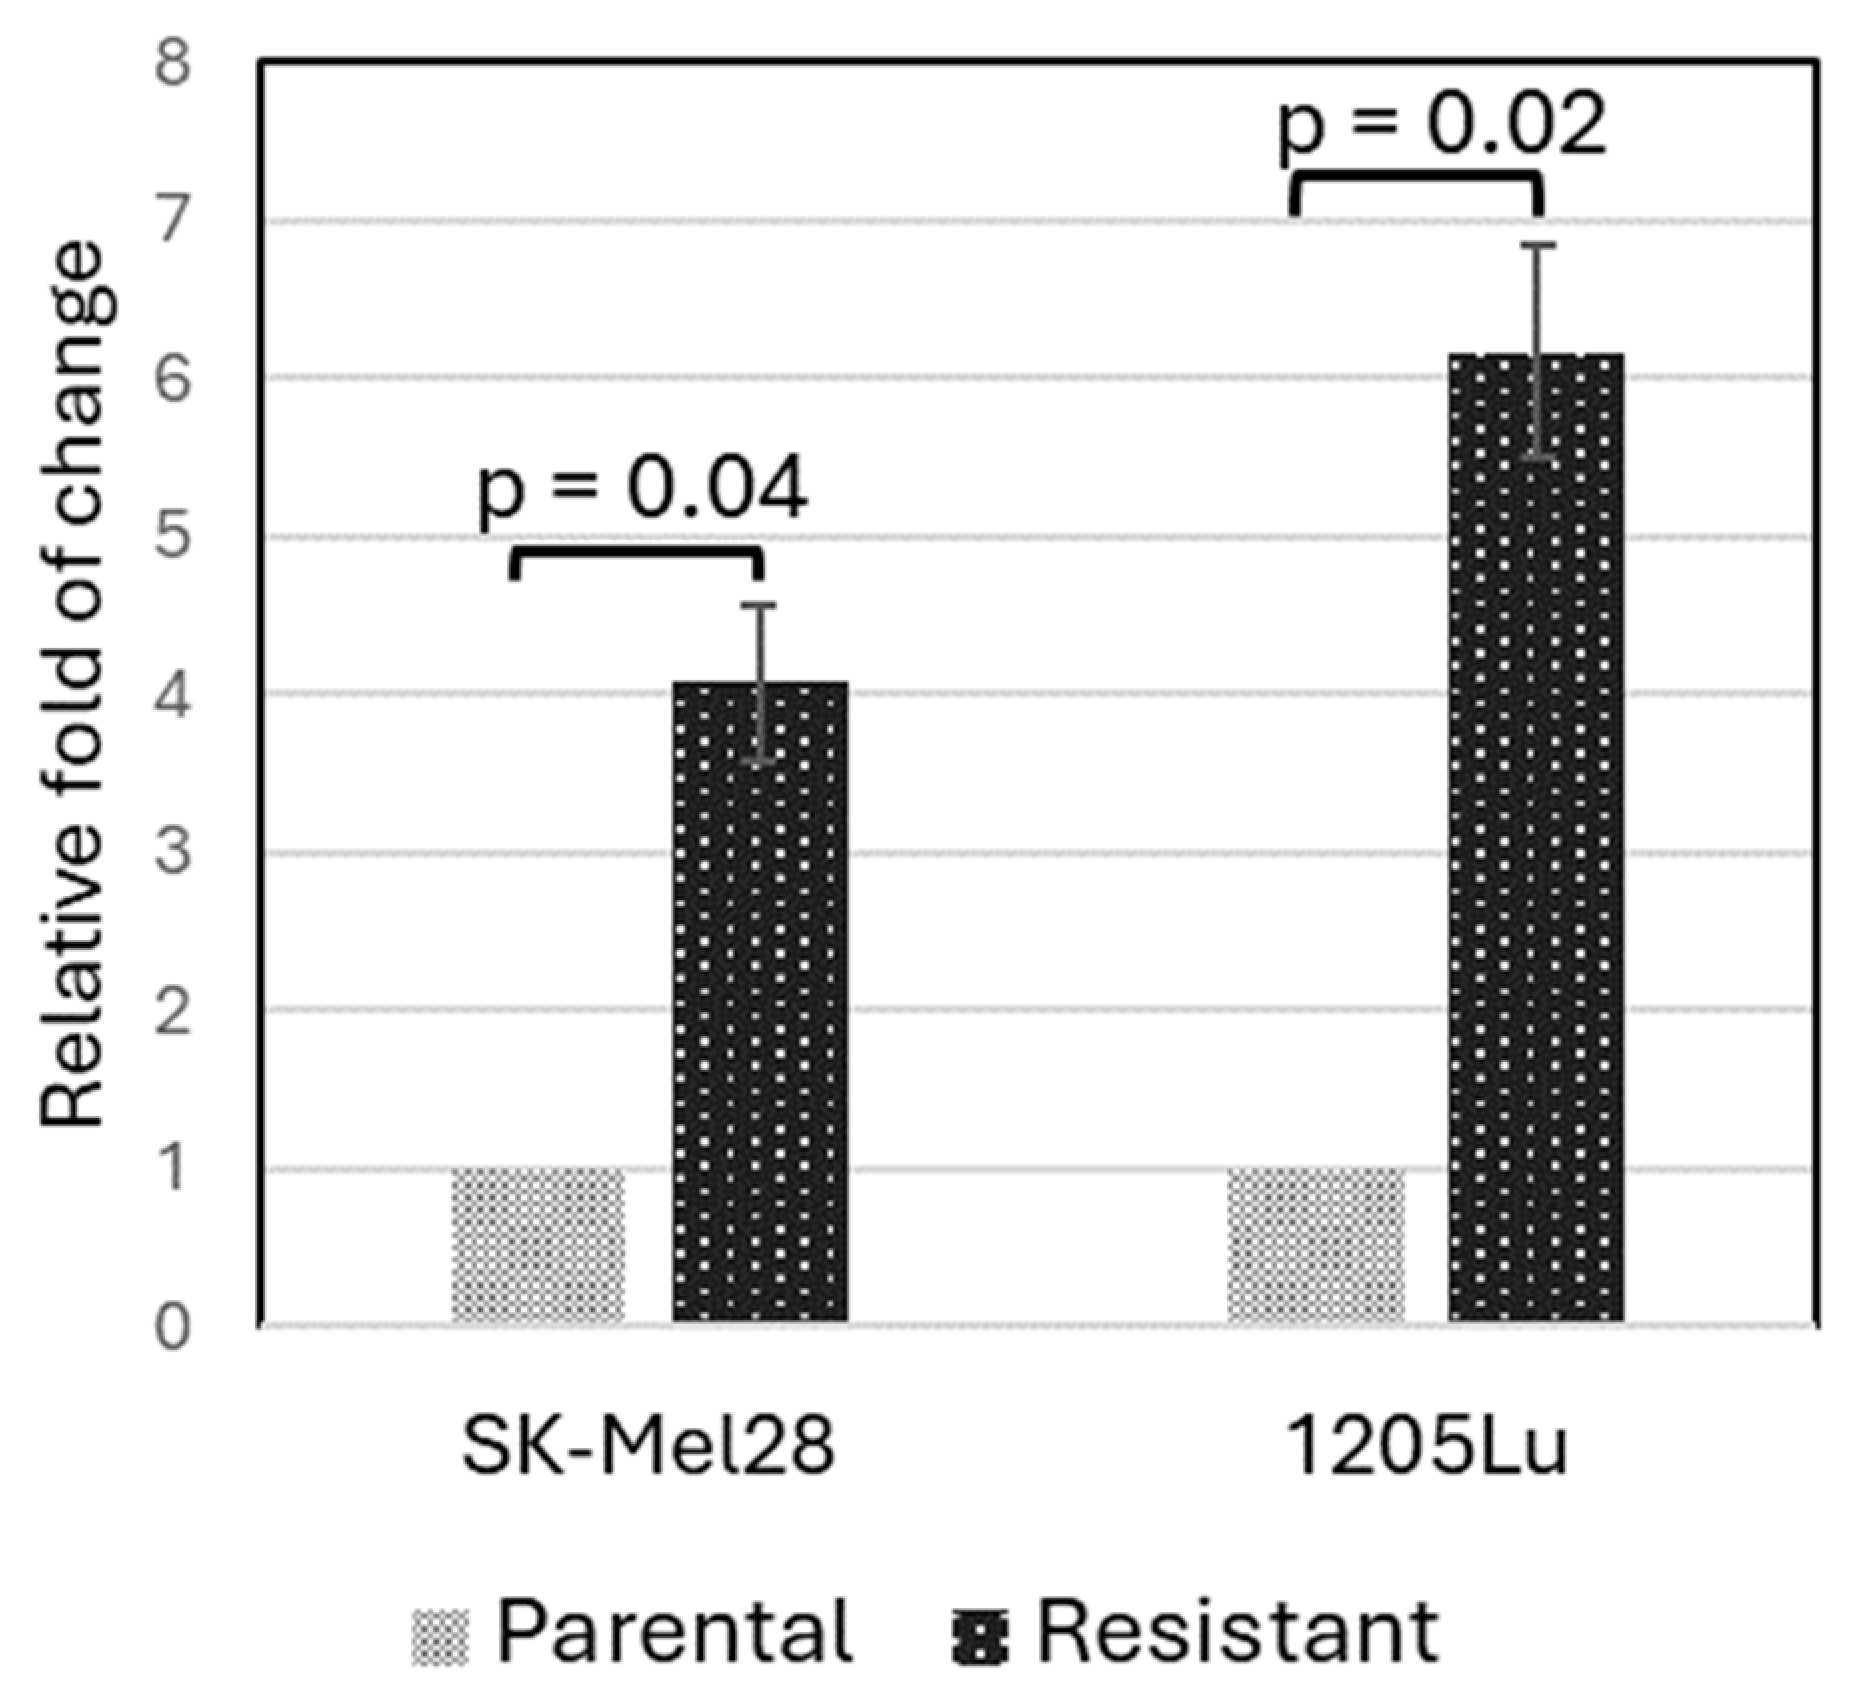
3.5. Validation of PLXNC1 Over-Expression in BRAFi-Resistant Cells
4. Discussion
5. Conclusions
Supplementary Materials
Author Contributions
Funding
Institutional Review Board Statement
Informed Consent Statement
Data Availability Statement
Conflicts of Interest
References
- Davies, H.; Bignell, G.R.; Cox, C.; Stephens, P.; Edkins, S.; Clegg, S.; Teague, J.; Woffendin, H.; Garnett, M.J.; Bottomley, W.; et al. Mutations of the BRAF gene in human cancer. Nature 2002, 417, 949–954. [Google Scholar] [CrossRef]
- Larkin, J.; Del Vecchio, M.; Ascierto, P.A.; Krajsova, I.; Schachter, J.; Neyns, B.; Espinosa, E.; Garbe, C.; Sileni, V.C.; Gogas, H.; et al. Vemurafenib in patients with BRAF(V600) mutated metastatic melanoma: An open-label, multicentre, safety study. Lancet Oncol. 2014, 15, 436–444. [Google Scholar] [CrossRef]
- McArthur, G.A.; Chapman, P.B.; Robert, C.; Larkin, J.; Haanen, J.B.; Dummer, R.; Ribas, A.; Hogg, D.; Hamid, O.; Ascierto, P.A.; et al. Safety and efficacy of vemurafenib in BRAF(V600E) and BRAF(V600K) mutation-positive melanoma (BRIM-3): Extended follow-up of a phase 3, randomised, open-label study. Lancet Oncol. 2014, 15, 323–332. [Google Scholar] [CrossRef] [PubMed]
- Falchook, G.S.; Long, G.V.; Kurzrock, R.; Kim, K.B.; Arkenau, T.H.; Brown, M.P.; Hamid, O.; Infante, J.R.; Millward, M.; Pavlick, A.C.; et al. Dabrafenib in patients with melanoma, untreated brain metastases, and other solid tumours: A phase 1 dose-escalation trial. Lancet 2012, 379, 1893–1901. [Google Scholar] [CrossRef]
- Yun, S.; Vincelette, N.D.; Green, M.R.; Wahner Hendrickson, A.E.; Abraham, I. Targeting immune checkpoints in unresectable metastatic cutaneous melanoma: A systematic review and meta-analysis of anti-CTLA-4 and anti-PD-1 agents trials. Cancer Med. 2016, 5, 1481–1491. [Google Scholar] [CrossRef]
- Dummer, R.; Flaherty, K.T.; Robert, C.; Arance, A.; de Groot, J.W.B.; Garbe, C.; Gogas, H.J.; Gutzmer, R.; Krajsova, I.; Liszkay, G.; et al. COLUMBUS 5-Year Update: A Randomized, Open-Label, Phase III Trial of Encorafenib Plus Binimetinib Versus Vemurafenib or Encorafenib in Patients with BRAF V600-Mutant Melanoma. J. Clin. Oncol. Off. J. Am. Soc. Clin. Oncol. 2022, 40, 4178–4188. [Google Scholar] [CrossRef]
- Choi, J.; Landrette, S.F.; Wang, T.; Evans, P.; Bacchiocchi, A.; Bjornson, R.; Cheng, E.; Stiegler, A.L.; Gathiaka, S.; Acevedo, O.; et al. Identification of PLX4032-resistance mechanisms and implications for novel RAF inhibitors. Pigment Cell Melanoma Res. 2014, 27, 253–262. [Google Scholar] [CrossRef] [PubMed]
- Subbiah, V.; Baik, C.; Kirkwood, J.M. Clinical Development of BRAF plus MEK Inhibitor Combinations. Trends Cancer 2020, 6, 797–810. [Google Scholar] [CrossRef]
- Long, G.V.; Fung, C.; Menzies, A.M.; Pupo, G.M.; Carlino, M.S.; Hyman, J.; Shahheydari, H.; Tembe, V.; Thompson, J.F.; Saw, R.P.; et al. Increased MAPK reactivation in early resistance to dabrafenib/trametinib combination therapy of BRAF-mutant metastatic melanoma. Nat. Commun. 2014, 5, 5694. [Google Scholar] [CrossRef] [PubMed]
- Rizos, H.; Menzies, A.M.; Pupo, G.M.; Carlino, M.S.; Fung, C.; Hyman, J.; Haydu, L.E.; Mijatov, B.; Becker, T.M.; Boyd, S.C.; et al. BRAF inhibitor resistance mechanisms in metastatic melanoma: Spectrum and clinical impact. Clin. Cancer Res. Off. J. Am. Assoc. Cancer Res. 2014, 20, 1965–1977. [Google Scholar] [CrossRef]
- Gopal, Y.N.; Rizos, H.; Chen, G.; Deng, W.; Frederick, D.T.; Cooper, Z.A.; Scolyer, R.A.; Pupo, G.; Komurov, K.; Sehgal, V.; et al. Inhibition of mTORC1/2 overcomes resistance to MAPK pathway inhibitors mediated by PGC1alpha and oxidative phosphorylation in melanoma. Cancer Res. 2014, 74, 7037–7047. [Google Scholar] [CrossRef] [PubMed]
- Rock, R.; Mayrhofer, J.E.; Torres-Quesada, O.; Enzler, F.; Raffeiner, A.; Raffeiner, P.; Feichtner, A.; Huber, R.G.; Koide, S.; Taylor, S.S.; et al. BRAF inhibitors promote intermediate BRAF(V600E) conformations and binary interactions with activated RAS. Sci. Adv. 2019, 5, eaav8463. [Google Scholar] [CrossRef] [PubMed]
- Hynes, R.O.; Naba, A. Overview of the matrisome--an inventory of extracellular matrix constituents and functions. Cold Spring Harb. Perspect. Biol. 2012, 4, a004903. [Google Scholar] [CrossRef] [PubMed]
- Bin Lim, S.; Chua, M.L.K.; Yeong, J.P.S.; Tan, S.J.; Lim, W.T.; Lim, C.T. Pan-cancer analysis connects tumor matrisome to immune response. NPJ Precis. Oncol. 2019, 3, 15. [Google Scholar] [CrossRef] [PubMed]
- Socovich, A.M.; Naba, A. The cancer matrisome: From comprehensive characterization to biomarker discovery. Semin. Cell Dev. Biol. 2019, 89, 157–166. [Google Scholar] [CrossRef] [PubMed]
- Belotti, Y.; Lim, S.B.; Iyer, N.G.; Lim, W.T.; Lim, C.T. Prognostic Matrisomal Gene Panel and Its Association with Immune Cell Infiltration in Head and Neck Carcinomas. Cancers 2021, 13, 5761. [Google Scholar] [CrossRef]
- Huang, J.; Zhang, L.; Wan, D.; Zhou, L.; Zheng, S.; Lin, S.; Qiao, Y. Extracellular matrix and its therapeutic potential for cancer treatment. Signal Transduct. Target. Ther. 2021, 6, 153. [Google Scholar] [CrossRef] [PubMed]
- Davis, S.; Meltzer, P.S. GEOquery: A bridge between the Gene Expression Omnibus (GEO) and BioConductor. Bioinformatics 2007, 23, 1846–1847. [Google Scholar] [CrossRef] [PubMed]
- Kolde, R. Pheatmap: Pretty Heatmaps. R Package Version 1(2), 726. Available online: https://cran.r-project.org/web/packages/pheatmap/pheatmap.pdf (accessed on 27 March 2024).
- Ritchie, M.E.; Phipson, B.; Wu, D.; Hu, Y.; Law, C.W.; Shi, W.; Smyth, G.K. limma powers differential expression analyses for RNA-sequencing and microarray studies. Nucleic Acids Res. 2015, 43, e47. [Google Scholar] [CrossRef]
- Korotkevich, G. Fast Gene Set Enrichment Analysis. bioRxiv 2021. [CrossRef]
- Zecena, H.; Tveit, D.; Wang, Z.; Farhat, A.; Panchal, P.; Liu, J.; Singh, S.J.; Sanghera, A.; Bainiwal, A.; Teo, S.Y.; et al. Systems biology analysis of mitogen activated protein kinase inhibitor resistance in malignant melanoma. BMC Syst. Biol. 2018, 12, 33. [Google Scholar] [CrossRef] [PubMed]
- Liu, F.; Singh, A.; Yang, Z.; Garcia, A.; Kong, Y.; Meyskens, F.L., Jr. MiTF links Erk1/2 kinase and p21 CIP1/WAF1 activation after UVC radiation in normal human melanocytes and melanoma cells. Mol. Cancer 2010, 9, 214. [Google Scholar] [CrossRef] [PubMed]
- Liberzon, A.; Birger, C.; Thorvaldsdottir, H.; Ghandi, M.; Mesirov, J.P.; Tamayo, P. The Molecular Signatures Database (MSigDB) hallmark gene set collection. Cell Syst. 2015, 1, 417–425. [Google Scholar] [CrossRef] [PubMed]
- Liberzon, A.; Subramanian, A.; Pinchback, R.; Thorvaldsdottir, H.; Tamayo, P.; Mesirov, J.P. Molecular signatures database (MSigDB) 3.0. Bioinformatics 2011, 27, 1739–1740. [Google Scholar] [CrossRef] [PubMed]
- Liberzon, A. A description of the Molecular Signatures Database (MSigDB) Web site. Methods Mol. Biol. 2014, 1150, 153–160. [Google Scholar] [CrossRef] [PubMed]
- Johnson, D.B.; Menzies, A.M.; Zimmer, L.; Eroglu, Z.; Ye, F.; Zhao, S.; Rizos, H.; Sucker, A.; Scolyer, R.A.; Gutzmer, R.; et al. Acquired BRAF inhibitor resistance: A multicenter meta-analysis of the spectrum and frequencies, clinical behaviour, and phenotypic associations of resistance mechanisms. Eur. J. Cancer 2015, 51, 2792–2799. [Google Scholar] [CrossRef] [PubMed]
- Corcoran, R.B.; Dias-Santagata, D.; Bergethon, K.; Iafrate, A.J.; Settleman, J.; Engelman, J.A. BRAF gene amplification can promote acquired resistance to MEK inhibitors in cancer cells harboring the BRAF V600E mutation. Sci. Signal. 2010, 3, ra84. [Google Scholar] [CrossRef] [PubMed]
- Zheng, Q.; Wang, D.; Lin, R.; Lv, Q.; Wang, W. IFI44 is an immune evasion biomarker for SARS-CoV-2 and Staphylococcus aureus infection in patients with RA. Front. Immunol. 2022, 13, 1013322. [Google Scholar] [CrossRef]
- DeDiego, M.L.; Nogales, A.; Martinez-Sobrido, L.; Topham, D.J. Interferon-Induced Protein 44 Interacts with Cellular FK506-Binding Protein 5, Negatively Regulates Host Antiviral Responses, and Supports Virus Replication. mBio 2019, 10, 10–1128. [Google Scholar] [CrossRef] [PubMed]
- Hooijkaas, A.; Gadiot, J.; Morrow, M.; Stewart, R.; Schumacher, T.; Blank, C.U. Selective BRAF inhibition decreases tumor-resident lymphocyte frequencies in a mouse model of human melanoma. Oncoimmunology 2012, 1, 609–617. [Google Scholar] [CrossRef]
- Samaniego, R.; Dominguez-Soto, A.; Ratnam, M.; Matsuyama, T.; Sanchez-Mateos, P.; Corbi, A.L.; Puig-Kroger, A. Folate Receptor beta (FRbeta) Expression in Tissue-Resident and Tumor-Associated Macrophages Associates with and Depends on the Expression of PU.1. Cells 2020, 9, 1445. [Google Scholar] [CrossRef]
- Zhang, P.; Zhao, Y.; Xia, X.; Mei, S.; Huang, Y.; Zhu, Y.; Yu, S.; Chen, X. Expression of OLR1 gene on tumor-associated macrophages of head and neck squamous cell carcinoma, and its correlation with clinical outcome. Oncoimmunology 2023, 12, 2203073. [Google Scholar] [CrossRef] [PubMed]
- Ni, Z.; Huang, C.; Zhao, H.; Zhou, J.; Hu, M.; Chen, Q.; Ge, B.; Huang, Q. PLXNC1: A Novel Potential Immune-Related Target for Stomach Adenocarcinoma. Front. Cell Dev. Biol. 2021, 9, 662707. [Google Scholar] [CrossRef] [PubMed]
- Ragaini, S.; Wagner, S.; Marconi, G.; Parisi, S.; Sartor, C.; Nanni, J.; Cristiano, G.; Talami, A.; Olivi, M.; Ocadlikova, D.; et al. An IDO1-related immune gene signature predicts overall survival in acute myeloid leukemia. Blood Adv. 2022, 6, 87–99. [Google Scholar] [CrossRef] [PubMed]
- Maeda, M.; Hasegawa, H.; Hyodo, T.; Ito, S.; Asano, E.; Yuang, H.; Funasaka, K.; Shimokata, K.; Hasegawa, Y.; Hamaguchi, M.; et al. ARHGAP18, a GTPase-activating protein for RhoA, controls cell shape, spreading, and motility. Mol. Biol. Cell 2011, 22, 3840–3852. [Google Scholar] [CrossRef] [PubMed]
- Pena-Oyarzun, D.; Rodriguez-Pena, M.; Burgos-Bravo, F.; Vergara, A.; Kretschmar, C.; Sotomayor-Flores, C.; Ramirez-Sarmiento, C.A.; De Smedt, H.; Reyes, M.; Perez, W.; et al. PKD2/polycystin-2 induces autophagy by forming a complex with BECN1. Autophagy 2021, 17, 1714–1728. [Google Scholar] [CrossRef] [PubMed]
- Ramsdale, R.; Jorissen, R.N.; Li, F.Z.; Al-Obaidi, S.; Ward, T.; Sheppard, K.E.; Bukczynska, P.E.; Young, R.J.; Boyle, S.E.; Shackleton, M.; et al. The transcription cofactor c-JUN mediates phenotype switching and BRAF inhibitor resistance in melanoma. Sci. Signal. 2015, 8, ra82. [Google Scholar] [CrossRef]
- Konig, K.; Marth, L.; Roissant, J.; Granja, T.; Jennewein, C.; Devanathan, V.; Schneider, M.; Kohler, D.; Zarbock, A.; Rosenberger, P. The plexin C1 receptor promotes acute inflammation. Eur. J. Immunol. 2014, 44, 2648–2658. [Google Scholar] [CrossRef] [PubMed]
- Granja, T.; Kohler, D.; Mirakaj, V.; Nelson, E.; Konig, K.; Rosenberger, P. Crucial role of Plexin C1 for pulmonary inflammation and survival during lung injury. Mucosal Immunol. 2014, 7, 879–891. [Google Scholar] [CrossRef] [PubMed]
- Lazova, R.; Gould Rothberg, B.E.; Rimm, D.; Scott, G. The semaphorin 7A receptor Plexin C1 is lost during melanoma metastasis. Am. J. Dermatopathol. 2009, 31, 177–181. [Google Scholar] [CrossRef]
- Kumasaka, M.Y.; Yajima, I.; Iida, M.; Takahashi, H.; Inoue, Y.; Fukushima, S.; Ihn, H.; Takeda, K.; Naito, Y.; Yoshikawa, T.; et al. Correlated expression levels of endothelin receptor B and Plexin C1 in melanoma. Am. J. Cancer Res. 2015, 5, 1117–1123. [Google Scholar] [PubMed]
- Chen, J.; Liu, H.; Chen, J.; Sun, B.; Wu, J.; Du, C. PLXNC1 Enhances Carcinogenesis Through Transcriptional Activation of IL6ST in Gastric Cancer. Front. Oncol. 2020, 10, 33. [Google Scholar] [CrossRef] [PubMed]
- NazimTurhal, S.; Dogan, M.; Esendagli, G.; Artac, M.; Korkmaz, L.; Coskun, H.S.; Goker, E.; PerranYumuk, F.; Bilgetekin, I.; Kose, F.; et al. The Relationship Between Plexin C1 Overexpression and Survival in Hepatocellular Carcinoma: A Turkish Oncology Group (TOG) Study. J. Gastrointest. Cancer 2022, 53, 356–362. [Google Scholar] [CrossRef] [PubMed]
- Adams, R.; Coumbe, J.E.M.; Coumbe, B.G.T.; Thomas, J.; Willsmore, Z.; Dimitrievska, M.; Yasuzawa-Parker, M.; Hoyle, M.; Ingar, S.; Geh, J.L.C.; et al. BRAF inhibitors and their immunological effects in malignant melanoma. Expert. Rev. Clin. Immunol. 2022, 18, 347–362. [Google Scholar] [CrossRef] [PubMed]


| Dataset | None or EDT * | Vemurafenib | Dabrafenib | All |
|---|---|---|---|---|
| GSE50509 | 28 | 8 | 25 | 61 |
| GSE61992 | 14 | 0 | 10 ** | 24 |
| Total | 42 | 8 | 35 | 85 |
| GSE50509 | GSE61992 | |||||||
|---|---|---|---|---|---|---|---|---|
| SYMBOL | logFC | AveExpr | p. Value | logFC | AveExpr | p. Value | Band | Gene Description |
| ARHGAP18 | 0.61 | 6.47 | 0.027 | 0.70 | 5.36 | 0.025 | 6q22.33e | Rho GTPase-activating protein 18 |
| FOLR2 | −0.69 | 7.32 | 0.012 | −0.64 | 5.71 | 0.017 | 11q13.4a | folate receptor beta |
| IFI44 | 0.77 | 8.22 | 0.039 | 1.36 | 5.98 | 0.020 | 1p31.1e | Interferon-induced protein 44 |
| LEF1 | 0.69 | 9.78 | 0.005 | 0.68 | 8.62 | 0.039 | 4q25b | lymphoid enhancer binding factor 1 |
| OLR1 | 0.79 | 6.56 | 0.011 | 0.81 | 6.34 | 0.013 | 12p13.2c | oxidized low-density lipoprotein receptor 1 |
| PKD2 | 0.80 | 7.96 | 0.004 | 0.75 | 4.95 | 0.029 | 4q22.1b | polycystin 2, transient receptor potential cation channel |
| PLXNC1 | 0.79 | 6.37 | 0.023 | 0.60 | 3.96 | 0.034 | 12q22c | Plexin C1 |
| SAMD9 | 0.84 | 6.91 | 0.017 | 1.16 | 4.95 | 0.031 | 7q21.2b | sterile alpha motif domain-containing 9 |
| SLAMF9 | −0.82 | 5.88 | 0.027 | 0.62 | 9.82 | 0.039 | 1q23.2c | SLAM family member 9 |
| TP53TG1 | −0.77 | 6.69 | 0.001 | 0.65 | 5.45 | 0.048 | 7q21.12 | TP53 target 1 |
| CEBPA | −0.72 | 7.63 | 0.026 | 0.93 | 8.39 | 0.011 | 19q13.11b | CCAAT enhancer-binding protein alpha |
| CKB | −0.87 | 7.06 | 0.020 | 0.93 | 4.39 | 0.003 | 14q32.33a | creatine kinase B |
| Dataset | Signature | Pathway | p val | padj | ES | NES | Size | Leading Edge Genes |
|---|---|---|---|---|---|---|---|---|
| GSE50509 | C1 | chr19q13 | 0.0000 | 0.0000 | −0.820 | −3.386 | 11 | TMEM145, PAFAH1B3, BLVRB, LIN7B, CNFN, LILRA2, LRFN3, CEBPA, ZNF296, NCCRP1 |
| C2:CP | NABA_MATRISOME | 0.0010 | 0.0021 | −0.714 | −2.380 | 15 | F12, CCL18, POSTN, SFRP4, SCUBE2, CXCL8, PDGFD, SULF1, PRG4, EMCN, PLXNC1, SPP1, SPARCL1, ANXA1 PLXNC1, SPP1, SPARCL1, ANXA1 | |
| C2:CP | NABA_MATRISOME_ASSOCIATED | 0.0142 | 0.0142 | −0.563 | −1.829 | 11 | F12, CCL18, SFRP4, SCUBE2, CXCL8, PDGFD, SULF1, EMCN, PLXNC1 | |
| C3:“MIR:MIRDB” | MIR106B_5P | 0.0002 | 0.0336 | 0.451 | 2.338 | 31 | KLF9, SOS1, BBX, IL1RAP, SSH1, KAT2B, PKD2, JAK1, NPAT, REV3L, ANO6, TMX3, PAFAH1B1, RBM12B, PDE3B, BMPR2, CALD1, SPTY2D1, ARID4B, PLEKHA3 | |
| C3:“MIR:MIRDB” | MIR20A_5P | 0.0002 | 0.0336 | 0.451 | 2.338 | 31 | KLF9, SOS1, BBX, IL1RAP, SSH1, KAT2B, PKD2, JAK1, NPAT, REV3L, ANO6, TMX3, PAFAH1B1, RBM12B, PDE3B, BMPR2, CALD1, SPTY2D1, ARID4B, PLEKHA3 | |
| C3:“MIR:MIRDB” | MIR106A_5P | 0.0003 | 0.0484 | 0.457 | 2.327 | 29 | KLF9, SOS1, BBX, IL1RAP, SSH1, KAT2B, PKD2, JAK1, NPAT, REV3L, ANO6, TMX3, RBM12B, PDE3B, BMPR2, CALD1, SPTY2D1, ARID4B, PLEKHA3 | |
| C3:“TFT:TFT_Legacy” | TAATTA_CHX10_01 | 0.0006 | 0.0493 | 0.423 | 2.144 | 31 | TSPAN7, SORBS2, TRIM24, CDH19, PRRX1, PPFIBP1, AMD1, MEF2C, OSBPL8, SECISBP2L, IFI16, BMPR2, CALD1, BAZ1A, CAB39, ZC3H7A, STXBP3, MYO1B, CPEB4, PELI2, EPB41L3 | |
| C5:“GO:BP” | GOBP_CIRCULATORY_SYSTEM_DEVELOPMENT | 0.0000 | 0.0145 | 0.470 | 2.484 | 35 | DUSP6, SOS1, SORBS2, PRRX1, MATR3, ARID2, EP300, KAT2B, PKD2, MEF2C, JAK1, SPRY2, LEF1, ROCK1, HTR2B, PDE3B, BMPR2, C1GALT1, ITGAV, CALD1 | |
| C5:“GO:BP” | GOBP_HEART_DEVELOPMENT | 0.0001 | 0.0145 | 0.573 | 2.445 | 18 | DUSP6, SOS1, SORBS2, MATR3, ARID2, EP300, KAT2B, PKD2, MEF2C, ROCK1, HTR2B, BMPR2 | |
| C5:“GO:BP” | GOBP_DEVELOPMENTAL_GROWTH | 0.0002 | 0.0145 | 0.567 | 2.418 | 18 | DUSP6, SOS1, SORBS2, IQGAP1, ARID5B, ARID2, EP300, MEF2C, SPRY2, MTM1, PAFAH1B1, BMPR2 | |
| C5:“GO:BP” | GOBP_ANIMAL_ORGAN_MORPHOGENESIS | 0.0001 | 0.0145 | 0.511 | 2.404 | 24 | CSGALNACT1, SOS1, SNX10, PRRX1, ARID5B, ARID2, EP300, PKD2, MEF2C, SPRY2, LEF1, HTR2B, PAFAH1B1, BMPR2 | |
| C5:“GO:BP” | GOBP_REGULATION_OF_PHOSPHORUS_METABOLIC_PROCESS | 0.0002 | 0.0145 | 0.448 | 2.324 | 33 | DUSP6, SOS1, IQGAP1, ACSL3, EP300, KAT2B, PKD2, MEF2C, SPRY2, TNIK, PTPN13, OSBPL8, GNAQ, ROCK1, HTR2B, BMPR2, BST1, CAB39, CD44, SASH1 | |
| C5:“GO:BP” | GOBP_VASCULATURE_DEVELOPMENT | 0.0004 | 0.0266 | 0.473 | 2.254 | 25 | SOS1, PRRX1, ARID2, PKD2, MEF2C, JAK1, SPRY2, LEF1, ROCK1, PDE3B, BMPR2, C1GALT1, ITGAV, CALD1, SASH1, HECTD1, ANXA1 | |
| C5:“GO:BP” | GOBP_TISSUE_DEVELOPMENT | 0.0005 | 0.0281 | 0.358 | 2.211 | 55 | MCOLN3, CSGALNACT1, SOS1, SORBS2, IQGAP1, SNX10, PRRX1, ARID5B, ARID2, EP300, PKD2, MEF2C, GSTM3, SPRY2, LEF1, UGCG, MTM1, ROCK1, ANO6, HTR2B, PAFAH1B1, BMPR2, C1GALT1, ITGAV | |
| C5:“GO:BP” | GOBP_DEPHOSPHORYLATION | 0.0008 | 0.0369 | 0.578 | 2.196 | 13 | NT5C3A, DUSP6, IQGAP1, SSH1, MEF2C, PTPN13, MTM1, ROCK1 | |
| C5:“GO:BP” | GOBP_POSITIVE_REGULATION_OF_PHOSPHORUS_METABOLIC_PROCESS | 0.0010 | 0.0404 | 0.496 | 2.126 | 19 | IQGAP1, ACSL3, PKD2, MEF2C, SPRY2, TNIK, OSBPL8, ROCK1, HTR2B, BMPR2, CAB39, CD44, SASH1 | |
| C5:“GO:BP” | GOBP_POSITIVE_REGULATION_OF_TRANSFERASE_ACTIVITY | 0.0011 | 0.0404 | 0.574 | 2.116 | 12 | IQGAP1, PKD2, SPRY2, OSBPL8, HTR2B, BMPR2, CAB39, SASH1, HNRNPA2B1, ARRDC4, TOM1L1 | |
| C5:“GO:BP” | GOBP_TUBE_MORPHOGENESIS | 0.0013 | 0.0456 | 0.451 | 2.183 | 26 | SOS1, PRRX1, ARID2, PKD2, MEF2C, JAK1, SPRY2, LEF1, ROCK1, PDE3B, BMPR2, C1GALT1, ITGAV, CALD1, SASH1, HECTD1, ANXA1 | |
| C5:“GO:BP” | GOBP_EMBRYO_DEVELOPMENT | 0.0016 | 0.0490 | 0.409 | 2.088 | 30 | SOS1, TBC1D23, PRRX1, ARID2, EP300, PKD2, MEF2C, SPRY2, LEF1, NPAT, ROCK1, HTR2B, PAFAH1B1, BMPR2, ITGAV | |
| C5:HPO | HP_DOWNSLANTED_PALPEBRAL_FISSURES | 0.0002 | 0.0343 | 0.706 | 2.192 | 10 | TSPAN7, CSGALNACT1, MPDZ, SOS1, PRRX1, ARID2, EP300 | |
| C8 | FAN_OVARY_CL1_GPRC5A_TNFRS12A_HIGH_SELECTABLE_FOLLICLE_STROMAL_CELL | 0.0003 | 0.0338 | 0.553 | 2.183 | 15 | ARID5B, AMD1, GSTM3, IFI16, UBL3, PLOD2, CALD1, SGCE, HNRNPA2B1, CTNNAL1, RHOBTB3, DDX21, EIF3J | |
| C8 | MANNO_MIDBRAIN_NEUROTYPES_HPERIC | 0.0013 | 0.0342 | 0.418 | 2.157 | 31 | DUSP6, SOS1, BBX, IQGAP1, MATR3, ARID2, SSH1, EP300, SPATA13, KAT2B, JAK1, SH3KBP1, ST3GAL5, NPAT, VPS26A, SNRK, OSBPL8, REV3L, BTBD1, ROCK1, TYW3, YTHDC2, IFI16, PAFAH1B1, ANKRD49, RAD21, SLC2A3, TBC1D4, BAZ1A, CAB39, TRAPPC8, CD44, ARID4B, HNRNPA2B1, ITPR1, ANXA1, TMEM123, BCLAF1, U2SURP, MYCBP2, SAMD9, PDS5A, FNBP4, ACAP2, ACTR2 | |
| C8 | BUSSLINGER_GASTRIC_IMMUNE_CELLS | 0.0009 | 0.0342 | 0.320 | 2.092 | 73 | DUSP6, SOS1, BBX, IQGAP1, MATR3, ARID2, SSH1, EP300, SPATA13, KAT2B, JAK1, SH3KBP1, ST3GAL5, NPAT, VPS26A, SNRK, OSBPL8, REV3L, BTBD1, ROCK1” | |
| C8 | FAN_EMBRYONIC_CTX_BRAIN_ENDOTHELIAL_2 | 0.0017 | 0.0342 | 0.531 | 2.045 | 14 | GNG12, JAK1, ST3GAL5, SNRK, CALD1, SASH1, SGCE, MYO1B, ITPR1, FRMD6, PHACTR2, SPARCL1 | |
| C8 | RUBENSTEIN_SKELETAL_MUSCLE_SMOOTH_MUSCLE_CELLS | 0.0016 | 0.0342 | 0.514 | 2.030 | 15 | BBX, SORBS2, ARID5B, MEF2C, TCEA1, TAX1BP1, SNRK, ROCK1, CALD1, SGCE, SPARCL1, NSA2, PCNP, PRSS23 | |
| C8 | MURARO_PANCREAS_MESENCHYMAL_STROMAL_CELL | 0.0021 | 0.0362 | 0.402 | 2.072 | 31 | DUSP6, KLF9, PRRX1, PPFIBP1, ARID5B, FAM114A1, SSH1, JAK1, SH3KBP1, ANO6, IFI16, PLOD2, ITGAV, SLC2A3, CALD1, BAZ1A, SASH1, ANXA1, FRMD6, DDX21 | |
| GSE61992 | C2:CGP | CHICAS_RB1_TARGETS_SENESCENT | 0.0000 | 0.0127 | 0.425 | 2.743 | 34 | PITPNC1, IFI6, HIPK2, TREM1, APCDD1L, VEGFA, TXNIP, IL6, CA12, GBP3, GK, FEZ1, CTSS, ODC1, CXCL5, PSMB8, EIF4EBP1, HLA-B, PRR11, CXCL10, IFITM1 |
| C2:CGP | PEREZ_TP53_AND_TP63_TARGETS | 0.0002 | 0.0406 | 0.569 | 2.459 | 14 | MYLIP, NEFL, CKB, GPT2, SEMA4D, RBP7, PPP1R16B, ADAP2, MAFB, RASGRP1 | |
| C2:CGP | YOSHIMURA_MAPK8_TARGETS_UP | 0.0002 | 0.0406 | 0.298 | 2.329 | 52 | NEFL, RGS22, ENPP6, CD247, ZNF226, LGALS9, FOXM1, PTPN3, KCNK1, CSNK1D, NELL2, FEZ1, ITGB3, CD74, CTSS, INPP5D, MAFB, PSMB8, TAP2, PLEK, DUSP4, HLA-DQA1, LYZ, KLRB1, CCL5, RGS18, GZMB, NMU, PFKFB3, CD52 | |
| C2:CGP | BLANCO_MELO_COVID19_SARS_COV_2_POS_PATIENT_LUNG_TISSUE_UP | 0.0003 | 0.0471 | 0.411 | 2.318 | 26 | OAS2, IFI6, TREM1, IFIT1, OLR1, TNF, OAS3, WAS, TYROBP, CD37, HSH2D, CXCL10, PLEK, IFITM1, SAMD9, PLAC8, RGS18, RTP4 | |
| C2:CP | NABA_MATRISOME_ASSOCIATED | 0.0003 | 0.0015 | 0.413 | 2.348 | 43 | SCUBE3, PLOD1, SEMA4D, VEGFA, IL6, LGALS9, ADAMTSL2, TNF, CTSS, CXCL5, PLXDC2, CTSO, CXCL10, CTSW, P4HA2, ADAMTS9, ANGPTL7, SERPINI1, PLXNA2, GPC3, FLT3LG, CCL5 | |
| C2:CP | NABA_MATRISOME | 0.0010 | 0.0025 | 0.374 | 2.120 | 50 | SCUBE3, PLOD1, SEMA4D, VEGFA, IL6, LGALS9, ADAMTSL2, NELL2, TNF, CTSS, CXCL5, PLXDC2, CTSO, CXCL10, CTSW, P4HA2, ADAMTS9, ANGPTL7, SERPINI1, PLXNA2, GPC3, FLT3LG, CCL5, PLXNC1, HAPLN1 | |
| C3:“MIR:MIRDB” | MIR548P | 0.0001 | 0.0142 | 0.611 | 2.678 | 14 | DSP, RRAS2, PITPNC1, VEGFA, CEBPA, CSNK1D, IPPK, CXCL5, PLXDC2, MAFB | |
| C3:“MIR:MIR_Legacy” | MIR548P | 0.0000 | 0.0103 | 0.611 | 2.677 | 14 | DSP, RRAS2, PITPNC1, VEGFA, CEBPA, CSNK1D, IPPK, CXCL5, PLXDC2, MAFB | |
| C3:“TFT:GTRD” | ZNF513_TARGET_GENES | 0.0002 | 0.0311 | 0.493 | 2.500 | 19 | SCUBE3, CKB, PLOD1, SEMA4D, JPH1, TXNIP, CD6, NPAS1, HKDC1, HLA-F, ERC2, BOC, ADAMTS9, PKD2 | |
| C5:“GO:BP” | GOBP_HOMEOSTATIC_PROCESS | 8.00 × 10⁻⁶ | 0.0056 | 0.301 | 2.545 | 73 | MYLIP, TRIM6, SLC24A3, CKB, CSF1R, RPE65, IFI6, HIPK2, VEGFA, JPH1, IFIT1, IL6, CEBPA, LGALS9, PTPN3, CA12, NELL2, HCLS1, TNF, ITGB3, GPR65, CD74, INPP5D, HKDC1, NOD2, MAFB, P2RY8, STAT1, NTSR1, HSH2D, CXCL10, CHRNA1, CD55, METRNL, PKD2, LYZ, SLC40A1, LDLR, PLAC8, CCL5, HK2, NMU | |
| C5:“GO:CC” | GOCC_INTRINSIC_COMPONENT_OF_PLASMA_MEMBRANE | 0.0006 | 0.0502 | 0.239 | 2.214 | 83 | SLC6A15, SLC24A3, KIR2DL3, TSPAN13, KCNF1, IL2RB, CSF1R, SEMA4D, IL6, ADORA2B, TSPAN32, KCNK1, IL18RAP, OLR1, CD4, TNF, TLR1, ITGB3, GPR65, MPZL1, CD6, ITGAL, NOD2, PCDHB13, P2RY8, HLA-B, NTSR1, TYROBP, CD37, KLRD1, CHRNA1, GPNMB, BOC, PKD2, HLA-DQA1, SLC7A7, PLXNA2, GPC3, SLC40A1, LDLR, LRRC8C, PLXNC1 | |
| C6 | STK33_NOMO_UP | 0.0008 | 0.0528 | 0.425 | 2.140 | 21 | SLC24A3, FCHO2, RNASEL, SEMA4D, TREM1, HAVCR2, PTPN3, OLR1, GBP3, TLR1, EOMES | |
| C7:VAX | NAKAYA_PBMC_FLUARIX_FLUVIRIN_AGE_18_50YO_7DY_DN | 0.0002 | 0.0149 | 0.573 | 2.473 | 14 | VEGFA, HAVCR2, SIK1, CD6, HLA-F, MAFB, NR4A2, CD55, METRNL, ITPRIP, SAMSN1, PFKFB3 | |
| C8 | TRAVAGLINI_LUNG_EREG_DENDRITIC_CELL | 7.99 × 10⁻⁵ | 0.0155 | 0.334 | 2.513 | 48 | HLA-DOA, CSF1R, HIPK2, SEMA4D, TREM1, VEGFA, HAVCR2, LST1, OLR1, GK, CD4, HCLS1, TLR1, CD74, PLXDC2, HLA-DMB, MAFB, TYROBP, RNASE6, NR4A2, ARHGAP18, PLEK, METRNL, DUSP4, HLA-DQA1, DNAJC15, LYZ | |
| C8 | TRAVAGLINI_LUNG_CILIATED_CELL | 0.0002 | 0.0155 | 0.393 | 2.460 | 31 | DSP, RGS22, CKB, OAS2, IFI6, HES2, GBP3, NELL2, CD4, PPME1, CTSS, KLHL6, ARHGAP18, DNER, P4HA2, RARRES1, DUSP4, ACAP1, GPC3, PLAC8, RTP4 | |
| C8 | TRAVAGLINI_LUNG_TREM2_DENDRITIC_CELL | 0.0002 | 0.0155 | 0.293 | 2.334 | 57 | HLA-DOA, FCHO2, CSF1R, IFI6, TREM1, HAVCR2, CEBPA, LGALS9, OLR1, GK, CD4, FBP1, CD74, CTSS, PLXDC2, HLA-DMB, MAFB, EIF4EBP1, STAT1, TYROBP, RNASE6, ARHGAP18, CXCL10, RARRES1, GPNMB, LY86, HLA-DQA1, SLC7A7, LYZ, SLC40A1 | |
| C8 | AIZARANI_LIVER_C25_KUPFFER_CELLS_4 | 0.0005 | 0.0265 | 0.375 | 2.350 | 31 | HLA-DOA, CSF1R, VEGFA, LGALS9, LST1, HCLS1, CTSS, HLA-DMB, MAFB, KLHL6, TYROBP, RNASE6, NR4A2, PLEK, CD55, METRNL, HLA-DQA1, LYZ, GZMB, SAMSN1, ITGB2 | |
| C8 | TRAVAGLINI_LUNG_NATURAL_KILLER_CELL | 0.0007 | 0.0276 | 0.448 | 2.357 | 22 | CD247, IL2RB, HAVCR2, AOAH, GPR65, PYHIN1, ITGAL, HSH2D, GNLY, CTSW, KLRD1, IFITM1, KLRB1, PLAC8, CCL5, GZMB, ITGB2 | |
| C8 | TRAVAGLINI_LUNG_MACROPHAGE_CELL | 0.0009 | 0.0315 | 0.440 | 2.264 | 21 | IFI6, TREM1, IL6, OLR1, GK, FBP1, CD74, CTSS, PLXDC2, TYROBP, GPNMB, HLA-DQA1, SLC7A7, LYZ | |
| C8 | TRAVAGLINI_LUNG_LIPOFIBROBLAST_CELL | 0.0013 | 0.0356 | 0.507 | 2.236 | 14 | PITPNC1, VEGFA, PVT1, CD74, NR4A2, RARRES1, GPNMB, IFITM1, LONRF2, LDLR, HK2 | |
| C8 | HAY_BONE_MARROW_NK_CELLS | 0.0015 | 0.0356 | 0.300 | 2.220 | 46 | KIR2DL3, PITPNC1, CD247, IL2RB, HAVCR2, HCST, AOAH, TBC1D10C, TSPAN32, IL18RAP, FEZ1, GPR65, PYHIN1, ITGAL, CERCAM, EOMES, HLA-F, HSH2D, GNLY, DOK2, CTSW, KLRD1, IFITM1 | |
| C8 | AIZARANI_LIVER_C2_KUPFFER_CELLS_1 | 0.0015 | 0.0356 | 0.361 | 2.148 | 28 | HLA-DOA, CSF1R, LGALS9, LST1, HCLS1, CTSS, PLXDC2, HLA-DMB, MAFB, KLHL6, TYROBP, RNASE6, CD37, PLEK, LY86, HLA-DQA1, LYZ |
Disclaimer/Publisher’s Note: The statements, opinions and data contained in all publications are solely those of the individual author(s) and contributor(s) and not of MDPI and/or the editor(s). MDPI and/or the editor(s) disclaim responsibility for any injury to people or property resulting from any ideas, methods, instructions or products referred to in the content. |
© 2024 by the authors. Licensee MDPI, Basel, Switzerland. This article is an open access article distributed under the terms and conditions of the Creative Commons Attribution (CC BY) license (https://creativecommons.org/licenses/by/4.0/).
Share and Cite
Liu-Smith, F.; Lin, J. Unsupervised Analysis Reveals the Involvement of Key Immune Response Genes and the Matrisome in Resistance to BRAF and MEK Inhibitors in Melanoma. Cancers 2024, 16, 2313. https://doi.org/10.3390/cancers16132313
Liu-Smith F, Lin J. Unsupervised Analysis Reveals the Involvement of Key Immune Response Genes and the Matrisome in Resistance to BRAF and MEK Inhibitors in Melanoma. Cancers. 2024; 16(13):2313. https://doi.org/10.3390/cancers16132313
Chicago/Turabian StyleLiu-Smith, Feng, and Jianjian Lin. 2024. "Unsupervised Analysis Reveals the Involvement of Key Immune Response Genes and the Matrisome in Resistance to BRAF and MEK Inhibitors in Melanoma" Cancers 16, no. 13: 2313. https://doi.org/10.3390/cancers16132313