Simple Summary
The journey of discovering melanoma—the most dangerous type of skin cancer—biomarkers is never-ending. Under that assumption, this study attempts to partially fill a gap in that journey by identifying melanoma-related biomarkers. This research paper studied the genetic and molecular profiling of melanoma. A transcriptome-wide association study (TWAS) was conducted to reveal the significant biomarkers associated with melanoma. A molecular network was constructed to represent the significant interactions between genes and microRNAs (miRNAs). The related biological processes, the enriched pathways, and the associated diseases were identified. The hotspot biomarkers were discovered to elucidate further the mechanism of these genes and miRNAs in melanoma pathogenesis. This work reveals the pathogenesis and biologically important molecular interactions of melanoma and provides new insights into the molecular mechanisms of melanoma.
Abstract
A transcriptome-wide association study (TWAS) was conducted on genome-wide association study (GWAS) summary statistics of malignant melanoma of skin (UK Biobank dataset) and The Cancer Genome Atlas-Skin Cutaneous Melanoma (TCGA-SKCM) gene expression weights to identify melanoma susceptibility genes. The GWAS included 2465 cases and 449,799 controls, while the gene expression testing was conducted on 103 cases. Afterward, a gene enrichment analysis was applied to identify significant TWAS associations. The melanoma’s gene–microRNA (miRNA) regulatory network was constructed from the TWAS genes and their corresponding miRNAs. At last, a disease enrichment analysis was conducted on the corresponding miRNAs. The TWAS detected 27 genes associated with melanoma with p-values less than 0.05 (the top three genes are LOC389458 (RBAK), C16orf73 (MEIOB), and EIF3CL). After the joint/conditional test, one gene (AMIGO1) was dropped, resulting in 26 significant genes. The Gene Ontology (GO) biological process associated the extended gene set (76 genes) with protein K11-linked ubiquitination and regulation of cell cycle phase transition. K11-linked ubiquitin chains regulate cell division. Interestingly, the extended gene set was related to different skin cancer subtypes. Moreover, the enriched pathways were nsp1 from SARS-CoV-2 that inhibit translation initiation in the host cell, cell cycle, translation factors, and DNA repair pathways full network. The gene-miRNA regulatory network identified 10 hotspot genes with the top three: TP53, BRCA1, and MDM2; and four hotspot miRNAs: mir-16, mir-15a, mir-125b, and mir-146a. Melanoma was among the top ten diseases associated with the corresponding (106) miRNAs. Our results shed light on melanoma pathogenesis and biologically significant molecular interactions.
1. Introduction
Genome-wide association studies (GWASs) aim to investigate the relationship between a genotype and a phenotype through a group of cases and controls [1]. Through the past two decades, GWAS has successfully identified many single nucleotide polymorphisms (SNPs) statistically associated with monogenic and complex diseases [2,3]. However, GWASs lack the causative biological meaning of their identified variants. Moreover, the linkage disequilibrium (LD) among SNPs overshadows the causative variants [4].
The statistically significant variants (biomarkers) identified from a well-conducted GWAS followed by an LD study could be as follows: (1) coding variants: affecting the sequence of specific genes by either stop/loss, stop/gain, frameshift, missense mutations, or large deletions; or (2) regulatory variants: affecting gene switches or participating in posttranscriptional gene regulation. For most complex diseases, most of the biomarkers (90%) appear to be regulatory variants; however, coding variants are the exception [5].
To shed light on the GWAS results, a fine mapping should be conducted to identify the causal genes leading to the biological mechanisms and the downstream pathways contributing to the disease. One of the most widespread fine-mapping techniques is the transcriptome-wide association study (TWAS). In the case of regulatory variants, it is hard to identify the causal gene as they change the expression levels of many target genes. TWAS aims to integrate the GWAS results with the gene expression datasets to prioritize the GWAS-associated variants—mostly regulatory variants—and detect the causal genes [6].
Melanoma is a typical form of cancer that mainly affects the skin, iris, and rectum. While melanoma represents 4% of skin cancers, it is responsible for 75% of deaths due to this type of cancer. Australian and New Zealand populations are affected by melanoma at a rate of approximately 0.06% per year. The disease is also spread in Europe and northern America, mainly among White populations. In Africans and Asians with dark skin, the spread of the disease is as low as one patient per 100,000 per year. It most often starts within 40–60 years of age. Women’s survival rate is better than men’s for no known reason.
It is believed that the tendency to develop melanoma may be genetically inherited. Moreover, environmental factors, such as dense ultraviolet (UV) exposure, may excite and develop the disease in genetically susceptible children—or adults—mainly through DNA damage. Melanoma could be diagnosed by the naked eye, dermoscopy, biopsy of benign skin lesions, sequential digital dermoscopic imaging, in vivo reflectance confocal laser microscopy, computer-aided multispectral digital analysis, or electrical impedance spectroscopy [7,8]. The brain, lungs, liver, and bones are target sites for melanoma metastasis [9].
Meta-analysis GWAS have marked 54 loci that may be associated with cutaneous melanoma susceptibility. This GWAS suggested nevus formation, pigmentation, and telomere maintenance as biological pathways contributing to cutaneous melanoma [10]. Five genes (ZFP90, HEBP1, MSC, CBWD1, and RP11-383H13.1) were detected as melanoma biomarkers by TWAS using melanocyte eQTLs (expression quantitative trait loci) [11]. Fidalgo et al. identified MYO7A, WRN, SERPINB4, HRNR, and NOP10 through whole exome sequencing (WGS) as rare variants for cutaneous melanoma in Brazilian families [12].
The top 10 genes, EGFR, IL8, ICAM1, STAT1, CDK2, OAS2, MITF, PBK, CDKN3, and CXCL10, were confirmed for association with melanoma through bioinformatic analysis in differentially expressed genes (DEGs) [13]. Logit regression and survival analysis were applied to detect the eleven feature DEGs, ZNF750, NLRP6, TGM3, KRTDAP, CAMSAP3, KRT6C, CALML5, SPRR2E, CD3G, RTP5, and FAM83C, related to the prognosis of metastatic cutaneous melanoma [14].
MDM2, MDM4, USP7, and PPM1D were confirmed in metastatic melanoma patients [15]. Spanish individuals bearing wildtype MC1R were predisposed to melanoma with a main role of the HERC2 gene. ESR1 was protective against naevus count in female melanoma patients [16]. Walbrecq et al. suggested six proteins (AKR7A2, DDX39B, EIF3C, FARSA, PRMT5, and VARS) and four microRNAs (miRNAs) (miR-210, miR-1290, miR-23a-5p, and miR-23b-5p) as biomarkers for melanoma [17].
This study aims to conduct a TWAS to identify the causal genes of cutaneous melanoma using online available GWAS summary statistics and a gene expression dataset. After extending the causal genes by protein–protein interaction network, they will be related to melanoma pathology and linked to other molecular interactions and gene–disease associations by applying a functional pathway analysis and disease enrichment analysis. Moreover, a gene–miRNA regulatory network will be constructed to elucidate further the mechanism of the extended genes in melanoma pathogenesis. Furthermore, the corresponding miRNAs’ disease enrichment analysis will be conducted to validate their association with melanoma. Figure 1 shows a block diagram of the entire association study.
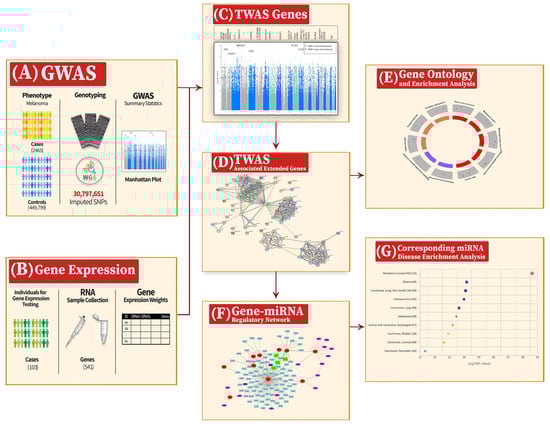
Figure 1.
Summary of the proposed system for the transcriptome-wide association study (TWAS) and the extended analysis. (A) 2465 melanoma patients and 449,799 healthy individuals were genotyped for 30,797,651 SNPs after imputation, resulting in the genome-wide association study (GWAS) summary statistics. (B) The expression weights for 541 genes were calculated for 103 melanoma patients. (C) The lower part represents the Manhattan plot for the GWAS; the upper part shows the associated genes—resulting from the TWAS—at their corresponding chromosomal positions. (D) The expanded network of 76 genes from the 26 TWAS-associated genes using protein–protein interactions to enhance the relevance of the functional analysis. (E) A gene ontology (GO) and enrichment analysis for the 76 genes. (F) The constructed gene–miRNA regulatory network resulting in 106 corresponding miRNAs to the extended gene set. (G) A disease enrichment analysis for the 106 miRNAs showing melanoma in the top ten diseases.
2. Materials and Methods
2.1. GWAS Summary Statistics Dataset for Melanoma
The UK Biobank is a nonprofit project considered an open resource for big medical datasets. It includes datasets of various categories, such as clinical data, demographic data, biomedical images, and genetic data. The genetic data were collected from about 500,000 participants, and 90 million SNPs, after imputation, were made available in July 2017 [18].
The Gene Atlas is a massive database for UK Biobank cohort associations, including 452,264 individuals, 778 traits, and over 30 million genetic variants [19]. The malignant melanoma of skin (C43) trait is selected from the Gene Atlas as the GWAS summary statistics dataset for the TWAS analysis (http://geneatlas.roslin.ed.ac.uk/trait/?traits=60, accessed on 16 July 2021). It consists of 2465 cases and 449,799 controls, with 30,797,651 imputed SNPs (after excluding the X chromosome). The participating individuals are from both sexes and have White British ancestry.
2.2. Gene Expression Dataset for Melanoma
The Cancer Genome Atlas (TCGA) data portal is a systematic cancer genomics project to identify new cancer biomarkers. The tumors included in the project are studied on different levels, such as DNA methylation, epigenetics, mRNA and miRNA expressions, copy number variation, the genome, and the whole exome [20]. The TCGA-SKCM (Skin Cutaneous Melanoma) is the gene expression dataset with 103 samples of White ancestor origin to match the ethnic group of the GWAS samples and 541 features whose expression profiles are significantly dysregulated compared to normal samples.
2.3. Transcriptome-Wide Association Study (TWAS)
The Functional Summary-based Imputation (FUSION) is a pipeline R package used to conduct a TWAS. It identifies genetic biomarkers by integrating SNPs, gene expressions, and trait status. The strength of FUSION is the ability to perform a TWAS with GWAS summary statistics only—that are likely to be found freely online—without the need to apply the gene expression study on the same individuals [21].
First, the melanoma GWAS summary statistics dataset was preprocessed to be appropriate for FUSION tool analysis by computing Z-scores equivalent to SNPs’ p-values using p.to.Z in R (https://www.R-project.org/, accessed on 15 August 2021). Second, the precomputed gene expression weights for TCGA-SKCM were downloaded from the FUSION website (http://gusevlab.org/projects/fusion/, accessed on 25 January 2022). Finally, the imputation methods for gene expression in genotyped samples were cis-eQTL, least absolute shrinkage and selection operator (LASSO), and elastic net [22].
For each gene, the GWAS SNPs within the range of 500 kbp from the gene locus in both directions were selected for testing. The statistically significant SNP detected by GWAS could be associated with more than one gene regulating their expressions.
The TWAS-associated gene set was searched for other diseases’ associations using ClinVar (https://www.ncbi.nlm.nih.gov/clinvar/, accessed on 22 March 2022) [23]. Only diseases confirmed by at least one PubMed publication by ClinVar were included. A Manhattan plot integrating the associated TWAS genes was implemented using LocusZoom.js (https://my.locuszoom.org/, accessed on 11 December 2021) [24].
2.4. Statistical Test
Statistical analysis of TWAS was performed using the moderated t-test followed by false discovery rate (FDR) correction, Bonferroni correction, or permutation testing. The TWAS p-values less than 0.05 were considered statistically significant.
2.5. Expansion of TWAS-Associated Genes with Partner Proteins
The STRING is a database for protein–protein physical and functional interactions. It covers all the publicly available resources and integrates them into one repository [25]. After applying the TWAS, the STRING (https://string-db.org/, accessed on 12 April 2022) database was used to extend the associated gene set by other interacting proteins. The maximum number of interactors in the first shell was set to fifty.
2.6. Gene Ontology (GO) and Enrichment Analysis
The Enrichr is a comprehensive gene set enrichment analysis tool [26,27,28]. The extended gene set, constructed by STRING, was operated by Enrichr (https://maayanlab.cloud/Enrichr/, accessed on 18 June 2022), and the results of GO Biological Process 2021, WikiPathway 2021 Human, and PheWeb 2019 databases were obtained.
The GOplot is an R package for visualizing and interpreting gene expression data with enrichment analysis [29]. The bubble plot was used to visualize the results of the GO Biological Process 2021 and WikiPathway 2021 Human databases. The circle plot was applied to display the relationship between the TWAS genes and the selected diseases resulting from PheWeb 2019.
The fold change (FC) for each gene was calculated using the GEPIA2 (Gene Expression Profiling Interactive Analysis version 2) tool (http://gepia2.cancer-pku.cn/#index, accessed on 12 November 2022), which is an essential preparation step for the GOplot package to produce the bubble and circle plots [30,31]. The GeneCards database (https://www.genecards.org, accessed on 30 October 2022) was used to find the aliases for the extended gene set for further analysis [32].
2.7. Corresponding MicroRNA and Disease Enrichment Analysis
TFmiR2 is a web server for analyzing and constructing transcription factor (TF) and miRNA coregulatory networks [33]. For further analysis, TFmiR2 was utilized to obtain the corresponding miRNA set for the extended gene set in response to melanoma disease. The gene–miRNA regulatory network was visualized using the Cytoscape 3.8.2 tool [34]. Hence, the miRNA set was exposed to TAM 2.0 for disease enrichment analysis [35].
3. Results
A TWAS was conducted on melanoma GWAS summary statistics and TCGA-SKCM gene expression weights. Table 1 includes the significant associations of the TWAS. Moreover, Table 1 included the previous studies for the identified genes linked to melanoma, if any, along with association with other diseases explored from the ClinVar archive, if any. The FC for each gene was calculated from the GEPIA 2 website for SKCM tumors and normal individuals. The results showed that the expressions of twenty-seven genes were significantly associated with melanoma GWAS SNPs with TWAS p-values less than 0.05. No associations were detected for the five chromosomes (5, 6, 10, 18, and 21).

Table 1.
The TWAS-significant melanoma genes are arranged by genomic positions. Statistical significance was defined as TWAS.p < 0.05. Genomic positions were based on GRCh37/hg19 build. Previous studies linking the identified gene and melanoma were included. Other studies linking the gene with other diseases were presented.
Subsequently, joint/conditional tests were applied to detect any conditionally dependent genes in the same chromosomic region. The chromosomes that had more than one significant gene were tested—the tested chromosomes were 1, 7, 12, 16, and 19. The gene (AMIGO1) in chromosome 1 was detected to be dependent on another gene (GSTM3) with a joint p-value of 0.0059, as shown in Figure 2. Then, AMIGO1 (conditionally nonsignificant gene) was dropped from the list of the associated genes. Consequently, the upcoming analysis was applied to 26 significant genes only. Figure 3 represents the significantly expressed 26 genes resulting from FUSION TWAS, combined with the LocusZoom plot for GWAS summary statistics.
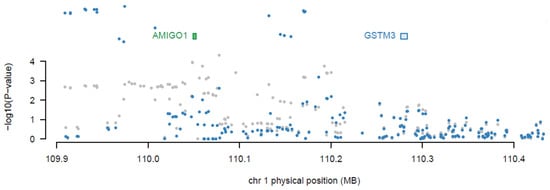
Figure 2.
Joint/conditional test result for melanoma TWAS chromosome 1 significant genes. The TWAS-associated genes are highlighted in blue, and those jointly significant are highlighted in green. The bottom panel shows a Manhattan plot of the GWAS data before (gray) and after (blue) conditioning on the green genes, and the AMIGO1 gene was dropped out.
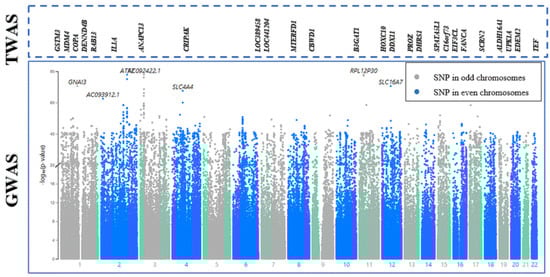
Figure 3.
Melanoma TWAS-significant genes integrated with a Manhattan plot using melanoma GWAS summary statistics from the Gene Atlas database. The X-axis plots chromosome number. The gray and blue colors in the Manhattan plot represent SNPs in alternating chromosomes. The Y-axis shows −log10(p-values), representing the strength of association between the SNP and melanoma. The higher the SNP (point) on the scale, the more significant the association with melanoma susceptibility. For the TWAS section, the significantly expressed genes are ordered according to their physical positions and designated above their corresponding chromosome number in the GWAS section.
4. Discussion
To reveal the associated genes with melanoma, a TWAS was performed using malignant melanoma of skin (C43) GWAS summary statistics (30,797,651 imputed SNPs with 2465 cases and 449,799 controls) and TCGA-SKCM precomputed gene expression weights (103 samples and 541 features). In total, 27 genes were considered promising candidates for melanoma, and a dependent gene was recognized through joint/conditional tests. To apply the enrichment analysis on a proper number of genes, the corresponding 26 proteins were networked to their physically and functionally partner proteins, resulting in 76 proteins using STRING, as shown in Figure 4. Table 2 lists the extended gene set with their corresponding Ensembl IDs (from GEPIA 2 website) including aliases (from GeneCards database), if any.
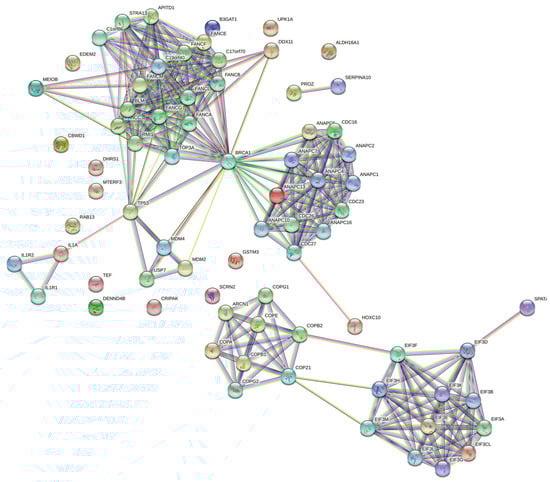
Figure 4.
The TWAS-expressed genes were extended from 26 to 76 using STRING protein–protein interaction networks.
Table 2.
A list of the TWAS-significant genes extended to 76 genes using STRING. GeneCards was used to identify any alias of the gene name. The corresponding Ensembl IDs were included from GEPIA 2.
The 76 genes, detected by FUSION TWAS and extended by STRING, were further functionally analyzed by conducting GO and enrichment analysis using Enrichr. GO and enrichment analyses were carried out on the expressed genes based on GO Biological Process 2021, WikiPathway 2021 Human, and PheWeb 2019 databases. For the GO Biological Process 2021 database, the extended differentially expressed genes were involved in protein K11-linked ubiquitination, regulation of exit from mitosis, regulation of cell cycle phase transition, anaphase-promoting complex-dependent catabolic process, and more (visualized by GOplot package in Figure 5).
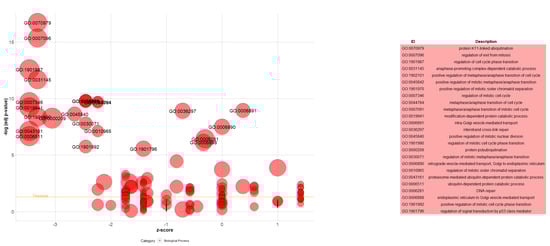
Figure 5.
Bubble plot of the enriched GO terms in combination with the extended genes set. Each bubble represents a GO term. The Y-axis shows −log10 (adjusted p-value) representing the strength of association between the GO term and the extended genes set. The X-axis demonstrates the Z score (the number of assigned genes downregulated (logFC < 0) subtracted from the number of assigned genes upregulated (logFC > 0) to the GO term divided by the square root of the number of genes assigned to the GO term). The bubble’s position on the plot corresponds to the GO term’s significance (the higher, the more significant). The size of each bubble represents the number of genes associated with the GO term. The bubbles are labeled with the GO term identifiers (IDs). A table displays the IDs, and the corresponding term description can be found on the right side.
For the PheWeb 2019 database, the extended TWAS-identified genes were associated with basal cell carcinoma, melanomas of skin, melanomas of skin, dx or hx, other non-epithelial cancer of skin, skin cancer, subarachnoid hemorrhage, neoplasm of uncertain behavior of breast, cysts of the jaws, periapical abscess, and symbolic dysfunction (Figure 6).
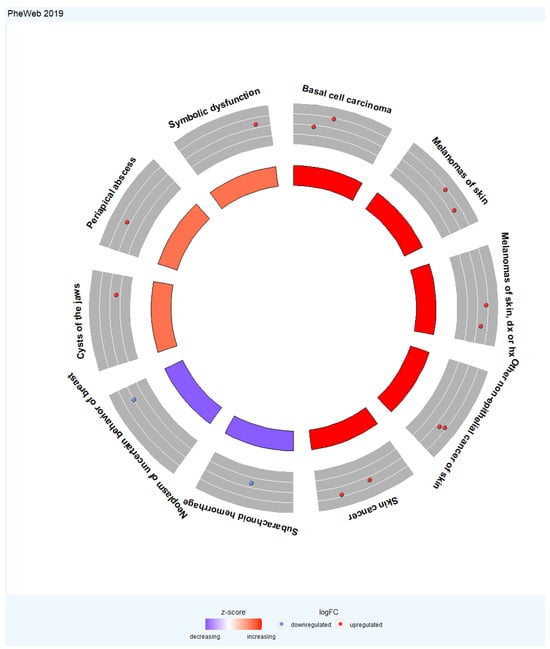
Figure 6.
Circular visualization of the enriched phenotypes with the extended TWAS genes set. The outer circle represents the top ten enriched phenotypes. The middle circle shows a scatter plot for each phenotype of the logFC of the assigned genes. The red circles display upregulation, and the blue ones display downregulation concerning logFC. The inner circle represents the Z score for the genes associated with these phenotypes. The Z score heatmap is used to describe the expression levels of genes. The denser red color represents a higher Z score value, and the denser blue color represents a lower Z score value. In some cases, highly significant phenotypes have a Z score value close to zero with white color.
For the WikiPathway 2021 Human database, Figure 7 shows that the enriched pathways with the expressed genes, which are nsp1 from SARS-CoV-2, inhibit translation initiation in the host cell, cell cycle, translation factors, and DNA repair pathways full network.
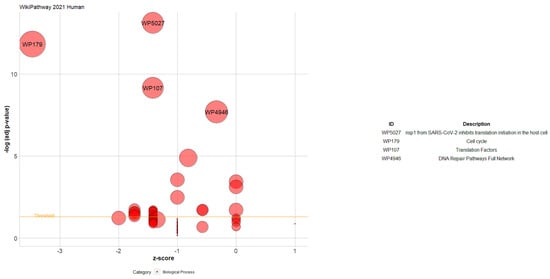
Figure 7.
Bubble plot of the enriched pathways related to the extended TWAS genes. Each bubble represents a pathway. The Y-axis shows −log10 (adjusted p-value), representing the strength of association between the pathway and the extended TWAS genes. The X-axis demonstrates the Z score (the number of assigned genes downregulated (logFC < 0) subtracted from the number of assigned genes upregulated (logFC > 0) to the pathway divided by the square root of the number of genes assigned to the pathway). The bubble’s position on the plot corresponds to the pathway’s significance (the higher, the more significant). The size of each bubble represents the number of genes associated with the pathway. The bubbles are labeled with the pathway identifiers (IDs). A table displays the IDs, and the corresponding pathway description can be found on the right side.
For further analysis, the corresponding miRNA to the 76 associated genes were identified using Tfmir2, resulting in 106 miRNAs. From these genes and miRNAs, 26 genes and 96 miRNAs were involved in melanoma pathogenesis with 162 connections, as shown in Figure 8. In this gene–miRNA regulatory network, there are ten hotspot genes (TP53 [10], BRCA1, FANCA, BLM [105], USP7, MDM2, MDM4 [15], IL1A [16], EIF3F [122], and ANAPC16), whereas there are four hotspot miRNAs (mir-16 [123], mir-15a [124], mir-125b, and mir-146a [125]).
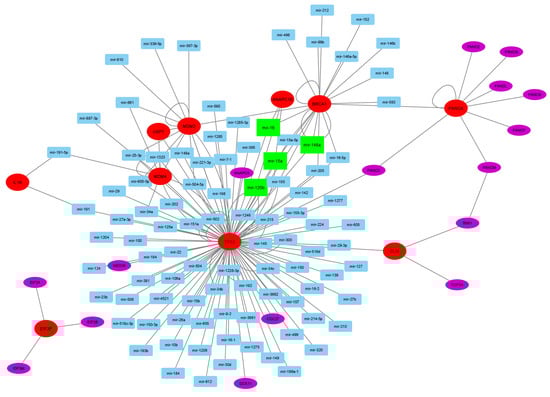
Figure 8.
The melanoma’s gene–miRNA regulatory network is constructed from the TWAS-extended genes and the corresponding miRNAs. The large red ellipses represent the essential driver genes, and the large green rectangles denote the key driver miRNAs. The purple ellipses denote the genes, whereas the light blue rectangles represent the miRNAs.
Consequently, a disease enrichment analysis was conducted using TAM 2.0 on the set of miRNAs identified by Tfmir2. Of the 106 miRNAs, 87 were provided in the disease enrichment analysis with 767 tested diseases. Figure 9 represents the top 10 associated diseases, with melanoma being the sixth disease (p-value = 3.44 × 10⁻²⁴), confirming the proposed hypothesis.
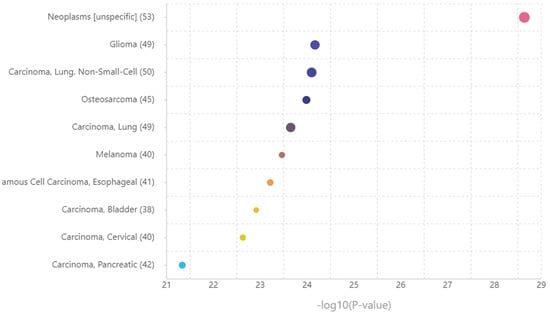
Figure 9.
Top 10 diseases associated with the set of miRNAs related to the extended genes set. The X-axis shows −log10 (p-value), representing the strength of association between the disease and the miRNAs set. The Y-axis tabulates the top 10 associated diseases and the count of the miRNAs that play a role in the included disease. The size of the point correlates to the count of the miRNAs.
The top three hotspot genes are TP53, BRCA1, and MDM2. The TP53 gene, a key player in regulating the cell cycle, DNA repair, and apoptosis, is important in melanoma pathogenesis. While TP53 mutations are rare, its function can be inactivated by overexpressed negative regulators like MDM2 and MDM4. This inactivation reduces TP53’s ability to prevent DNA damage caused by UV radiation, allowing melanoma to develop. Targeting the TP53 pathway, for example with MDM2 inhibitors, shows promise as a therapeutic strategy for melanoma treatment. Understanding TP53’s role in melanoma pathogenesis is crucial for developing effective treatments [126].
BRCA1, a gene linked to breast and ovarian cancers, also impacts melanoma. Germline and somatic mutations in BRCA1 elevate melanoma risk and contribute to its progression. BRCA1 is crucial for DNA repair and interacts with the p53 pathway, influencing tumor development. Mutations also affect the tumor microenvironment and immune response, impacting melanoma progression and treatment response [127]. MDM2 negatively regulates the p53 tumor suppressor pathway and influences melanoma development. It binds to p53, reducing its activity and promoting cell growth. Targeting MDM2 with inhibitors like Nutlin-3 can restore p53 function and induce tumor cell death, offering potential benefits in melanoma treatment [15,128,129].
The top four hotspot miRNAs are mir-15a, mir-16, mir-125b, and mir-146a. mir-15a is a crucial tumor suppressor in melanoma. It targets and reduces the expression of key genes involved in cell cycle progression and apoptosis, such as CCNE1 and BCL2. Its reduced expression in melanoma leads to uncontrolled cell growth, enhanced cell survival, and tumor progression. Additionally, mir-15a suppresses multiple oncogenes and weakens the tumor-suppressive environment when its levels decrease [124].
mir-16 is a crucial miRNA in melanoma, regulating the cell cycle and apoptosis. Its reduced expression leads to uncontrolled cell proliferation and decreased apoptosis, promoting cell survival and resistance to apoptosis. Additionally, mir-16 directly targets oncogenes like BMI1 and EZH2, promoting melanoma development and metastasis. Reduced mir-16 levels disrupt the balanced tumor-suppressive environment in melanoma cells, contributing to melanoma progression [123,130]. mir-125b has a critical role in melanoma by suppressing tumor growth and promoting cell death. It targets cancer-causing genes such as BCL2, MCL1, and CDK6, and its reduction leads to increased cell growth and resistance to cell death. Restoring mir-125b levels in melanoma cells shows promise as a treatment and combining it with other therapies could improve effectiveness [125,131].
The role of mir-146a in melanoma is complex, with both tumor-suppressing and tumor-promoting functions. It regulates inflammation and the immune response by targeting pro-inflammatory cytokines and molecules like IRAK1 and TRAF6, reducing inflammation and potentially affecting the tumor microenvironment. Additionally, mir-146a aids in immune evasion, enabling melanoma cells to evade immune surveillance. As a tumor suppressor, mir-146a targets genes involved in cell proliferation and survival, inhibiting oncogenes and promoting apoptosis. It also regulates the cell cycle; when downregulated, it can lead to uncontrolled cell proliferation and resistance to apoptosis. Furthermore, mir-146a inhibits metastasis by targeting genes involved in cell migration and invasion, such as MMPs, and influences the process of epithelial–mesenchymal transition (EMT), thereby impacting the metastatic behavior of melanoma cells [132,133].
5. Conclusions
Crucial associations with melanoma were discovered by applying TWAS on malignant melanoma of skin (C43) GWAS summary statistics (UK Biobank dataset) and TCGA-SKCM gene expression weights. In total, 26 genes showed a TWAS p-value lower than 0.05. Among them, five genes were not detected before for melanoma susceptibility, namely, ANAPC13, RBAK, RPL36AP26, PROZ, and SPATA5L1. To perform a functional pathway analysis and a disease enrichment analysis, the 26 genes were expanded by their physical and functional interacting proteins to end up with 76 genes.
The expanded gene set was responsible for regulating cell cycle phase transition and was associated with skin melanomas. In addition, the molecular interactions of the extended genes set were tested, identifying 106 miRNAs. The gene–miRNA regulatory network resulted in ten hotspot genes (ANAPC16 was not detected before) and four hotspot miRNAs. Applying a disease enrichment analysis on the 106 miRNAs revealed that melanoma was included in the top associated diseases.
Author Contributions
Conceptualization: M.N.S. and M.H. Data curation: M.N.S. Formal analysis: M.N.S. Funding acquisition: M.N.S. and M.H. Investigation: M.N.S. and M.H. Methodology: M.N.S. and M.H. Resources: M.N.S. and M.H. Software: M.N.S. Supervision: M.H. Validation: M.N.S. Visualization: M.N.S. Writing—original draft: M.N.S. Writing—review and editing: M.N.S. and M.H. All authors reviewed the manuscript. All authors have read and agreed to the published version of the manuscript.
Funding
This research was funded by the DAAD Ta’ziz project (GARN-CLS), German Arab Research Network for Computational Life Science (Grant # 57682181). Associate Professor Mohamed Nagy Saad received a scholarship from the German Academic Exchange Service (DAAD) and the Ministry of Higher Education and Scientific Research (MOHESR), Egypt, through the German Egyptian Research Short-Term Scholarship Programme (GERSS), 2020 (Grant # 57522433).
Institutional Review Board Statement
Not applicable.
Informed Consent Statement
Not applicable.
Data Availability Statement
The datasets supporting this article’s conclusions are available in the Gene Atlas database, http://geneatlas.roslin.ed.ac.uk/trait/?traits=60 (accessed on 16 July 2021), and on the FUSION website, http://gusevlab.org/projects/fusion/weights/TCGA-SKCM.TUMOR.tar.bz2 (accessed on 25 January 2022).
Acknowledgments
The authors thank Georg Fuellen (Rostock University) for hosting Mohamed Nagy Saad as a visiting postdoctoral researcher at the Institute for Biostatistics and Informatics in Medicine and Ageing Research, Rostock University Medical Center, under the direct supervision of Mohamed Hamed Fahmy, Head of the Research Group: Integrative OMICS Analyses. Finally, we appreciate the scientific efforts of Sarah Fischer, Nicolas Luca Spath, Abdelrahman Soliman, Omar Mostafa, Hamza Ibrahim, and Tamer Saleh (Rostock University) for their critical comments and their technical help in the manuscript.
Conflicts of Interest
The authors declare that they have no affiliations with or involvement in any organization or entity with any financial interest in the subject matter or materials discussed in this manuscript.
References
- Bush, W.S.; Moore, J.H. Chapter 11: Genome-Wide Association Studies. PLoS Comput. Biol. 2012, 8, e1002822. [Google Scholar] [CrossRef] [PubMed]
- Cao, X.; Xing, L.; He, H.; Zhang, X. A short review on Genome-Wide Association Studies. Bioinformation 2020, 16, 393–397. [Google Scholar]
- Wang, M.H.; Cordell, H.J.; Van Steen, K. Statistical methods for genome-wide association studies. Semin. Cancer Biol. 2019, 55, 53–60. [Google Scholar] [CrossRef] [PubMed]
- Sun, N.; Zhao, H. Statistical Methods in Genome-Wide Association Studies. Annu. Rev. Biomed. Data Sci. 2020, 3, 265–288. [Google Scholar] [CrossRef]
- Schaid, D.J.; Chen, W.; Larson, N.B. From genome-wide associations to candidate causal variants by statistical fine-mapping. Nat. Rev. Genet. 2018, 19, 491–504. [Google Scholar] [CrossRef] [PubMed]
- Wainberg, M.; Sinnott-Armstrong, N.; Mancuso, N.; Barbeira, A.N.; Knowles, D.A.; Golan, D.; Ermel, R.; Ruusalepp, A.; Quertermous, T.; Hao, K.; et al. Opportunities and challenges for transcriptome-wide association studies. Nat. Genet. 2019, 51, 592–599. [Google Scholar] [CrossRef] [PubMed]
- Miller, A.J.; Mihm, M.C. Melanoma. N. Engl. J. Med. 2006, 355, 51–65. [Google Scholar] [CrossRef] [PubMed]
- Schadendorf, D.; Fisher, D.E.; Garbe, C.; Gershenwald, J.E.; Grob, J.-J.; Halpern, A.; Herlyn, M.; Marchetti, M.A.; McArthur, G.; Ribas, A.; et al. Melanoma. Nat. Rev. Dis. Primers 2015, 1, 15003. [Google Scholar] [CrossRef]
- Xia, Y.; Xu, F.; Xiong, M.; Yang, H.; Lin, W.; Xie, Y.; Xi, H.; Xue, Q.; Ye, T.; Yu, L. Repurposing of antipsychotic trifluoperazine for treating brain metastasis, lung metastasis and bone metastasis of melanoma by disrupting autophagy flux. Pharmacol. Res. 2020, 163, 105295. [Google Scholar] [CrossRef]
- Landi, M.T.; Bishop, D.T.; MacGregor, S.; Machiela, M.J.; Stratigos, A.J.; Ghiorzo, P.; Brossard, M.; Calista, D.; Choi, J.; Fargnoli, M.C.; et al. Genome-wide association meta-analyses combining multiple risk phenotypes provide insights into the genetic architecture of cutaneous melanoma susceptibility. Nat. Genet. 2020, 52, 494–504. [Google Scholar] [CrossRef]
- Zhang, T.; Choi, J.; Kovacs, M.A.; Shi, J.; Xu, M.; Goldstein, A.M.; Trower, A.J.; Bishop, D.T.; Iles, M.M.; Duffy, D.L.; et al. Cell-type–specific eQTL of primary melanocytes facilitates identification of melanoma susceptibility genes. Genome Res. 2018, 28, 1621–1635. [Google Scholar] [CrossRef]
- Fidalgo, F.; Torrezan, G.T.; de Sá, B.C.S.; Barros, B.D.d.F.; Moredo, L.F.; Valieris, R.; de Souza, S.J.; Duprat, J.P.; Krepischi, A.C.V.; Carraro, D.M. Family-based whole-exome sequencing identifies rare variants potentially related to cutaneous melanoma predisposition in Brazilian melanoma-prone families. PLoS ONE 2022, 17, e0262419. [Google Scholar] [CrossRef] [PubMed]
- Huang, L.; Chen, J.; Zhao, Y.; Gu, L.; Shao, X.; Li, J.; Xu, Y.; Liu, Z.; Xu, Q. Key candidate genes of STAT1 and CXCL10 in melanoma identified by integrated bioinformatical analysis. IUBMB Life 2019, 71, 1634–1644. [Google Scholar] [CrossRef] [PubMed]
- Jia, G.; Song, Z.; Xu, Z.; Tao, Y.; Wu, Y.; Wan, X. Screening of gene markers related to the prognosis of metastatic skin cutaneous melanoma based on Logit regression and survival analysis. BMC Med. Genom. 2021, 14, 96. [Google Scholar] [CrossRef] [PubMed]
- Arnoff, T.E.; El-Deiry, W.S. MDM2/MDM4 amplification and CDKN2A deletion in metastatic melanoma and glioblastoma multiforme may have implications for targeted therapeutics and immunotherapy. Am. J. Cancer Res. 2022, 12, 2102–2117. [Google Scholar] [PubMed]
- Calbet-Llopart, N.; Combalia, M.; Kiroglu, A.; Potrony, M.; Tell-Martí, G.; Combalia, A.; Brugues, A.; Podlipnik, S.; Carrera, C.; Puig, S.; et al. Common genetic variants associated with melanoma risk or naevus count in patients with wildtype MC1R melanoma. Br. J. Dermatol. 2022, 187, 753–764. [Google Scholar] [CrossRef] [PubMed]
- Walbrecq, G.; Lecha, O.; Gaigneaux, A.; Fougeras, M.R.; Philippidou, D.; Margue, C.; Nomigni, M.T.; Bernardin, F.; Dittmar, G.; Behrmann, I.; et al. Hypoxia-Induced Adaptations of miRNomes and Proteomes in Melanoma Cells and Their Secreted Extracellular Vesicles. Cancers 2020, 12, 692. [Google Scholar] [CrossRef] [PubMed]
- Bycroft, C.; Freeman, C.; Petkova, D.; Band, G.; Elliott, L.T.; Sharp, K.; Motyer, A.; Vukcevic, D.; Delaneau, O.; O’connell, J.; et al. The UK Biobank resource with deep phenotyping and genomic data. Nature 2018, 562, 203–209. [Google Scholar] [CrossRef]
- Canela-Xandri, O.; Rawlik, K.; Tenesa, A. An atlas of genetic associations in UK Biobank. Nat. Genet. 2018, 50, 1593–1599. [Google Scholar] [CrossRef] [PubMed]
- Weinstein, J.N.; Collisson, E.A.; Mills, G.B.; Shaw, K.R.M.; Ozenberger, B.A.; Ellrott, K.; Shmulevich, I.; Sander, C.; Stuart, J.M.; The Cancer Genome Atlas Research Network. The Cancer Genome Atlas Pan-Cancer analysis project. Nat. Genet. 2013, 45, 1113–1120. [Google Scholar] [CrossRef]
- Gusev, A.; Ko, A.; Shi, H.; Bhatia, G.; Chung, W.; Penninx, B.W.J.H.; Jansen, R.; de Geus, E.J.C.; I Boomsma, D.; Wright, F.A.; et al. Integrative approaches for large-scale transcriptome-wide association studies. Nat. Genet. 2016, 48, 245–252. [Google Scholar] [CrossRef] [PubMed]
- Gamazon, E.R.; Wheeler, H.E.; Shah, K.P.; Mozaffari, S.V.; Aquino-Michaels, K.; Carroll, R.J.; Eyler, A.E.; Denny, J.C.; Nicolae, D.L.; et al.; GTEx Consortium A gene-based association method for mapping traits using reference transcriptome data. Nat. Genet. 2015, 47, 1091–1098. [Google Scholar] [CrossRef] [PubMed]
- Landrum, M.J.; Chitipiralla, S.; Brown, G.R.; Chen, C.; Gu, B.; Hart, J.; Hoffman, D.; Jang, W.; Kaur, K.; Liu, C.; et al. ClinVar: Improvements to accessing data. Nucleic Acids Res. 2020, 48, D835–D844. [Google Scholar] [CrossRef] [PubMed]
- Boughton, A.P.; Welch, R.P.; Flickinger, M.; VandeHaar, P.; Taliun, D.; Abecasis, G.R.; Boehnke, M. LocusZoom.js: Interactive and embeddable visualization of genetic association study results. Bioinformatics 2021, 37, 3017–3018. [Google Scholar] [CrossRef] [PubMed]
- Szklarczyk, D.; Gable, A.L.; Lyon, D.; Junge, A.; Wyder, S.; Huerta-Cepas, J.; Simonovic, M.; Doncheva, N.T.; Morris, J.H.; Bork, P.; et al. STRING v11: Protein–protein association networks with increased coverage, supporting functional discovery in genome-wide experimental datasets. Nucleic Acids Res. 2019, 47, D607–D613. [Google Scholar] [CrossRef] [PubMed]
- Chen, E.Y.; Tan, C.M.; Kou, Y.; Duan, Q.; Wang, Z.; Meirelles, G.V.; Clark, N.R.; Ma’Ayan, A. Enrichr: Interactive and collaborative HTML5 gene list enrichment analysis tool. BMC Bioinform. 2013, 14, 128. [Google Scholar] [CrossRef] [PubMed]
- Kuleshov, M.V.; Jones, M.R.; Rouillard, A.D.; Fernandez, N.F.; Duan, Q.; Wang, Z.; Koplev, S.; Jenkins, S.L.; Jagodnik, K.M.; Lachmann, A.; et al. Enrichr: A comprehensive gene set enrichment analysis web server 2016 update. Nucleic Acids Res. 2016, 44, W90–W97. [Google Scholar] [CrossRef] [PubMed]
- Xie, Z.; Bailey, A.; Kuleshov, M.V.; Clarke, D.J.B.; Evangelista, J.E.; Jenkins, S.L.; Lachmann, A.; Wojciechowicz, M.L.; Kropiwnicki, E.; Jagodnik, K.M.; et al. Gene Set Knowledge Discovery with Enrichr. Curr. Protoc. 2021, 1, e90. [Google Scholar] [CrossRef] [PubMed]
- Walter, W.; Sánchez-Cabo, F.; Ricote, M. GOplot: An R package for visually combining expression data with functional analysis. Bioinformatics 2015, 31, 2912–2914. [Google Scholar] [CrossRef]
- Li, C.; Tang, Z.; Zhang, W.; Ye, Z.; Liu, F. GEPIA2021: Integrating multiple deconvolution-based analysis into GEPIA. Nucleic Acids Res. 2021, 49, W242–W246. [Google Scholar] [CrossRef]
- Tang, Z.; Kang, B.; Li, C.; Chen, T.; Zhang, Z. GEPIA2: An enhanced web server for large-scale expression profiling and interactive analysis. Nucleic Acids Res. 2019, 47, W556–W560. [Google Scholar] [CrossRef] [PubMed]
- Safran, M.; Rosen, N.; Twik, M.; BarShir, R.; Stein, T.I.; Dahary, D.; Fishilevich, S.; Lancet, D. The GeneCards Suite. In Practical Guide to Life Science Databases; Abugessaisa, I., Kasukawa, T., Eds.; Springer Nature: Singapore, 2022; pp. 27–56. [Google Scholar]
- Nazarieh, M.; Hamed, M.; Spaniol, C.; Will, T.; Helms, V. TFmiR2: Constructing and analyzing disease-, tissue- and process-specific transcription factor and microRNA co-regulatory networks. Bioinformatics 2019, 36, 2300–2302. [Google Scholar] [CrossRef] [PubMed]
- Shannon, P.; Markiel, A.; Ozier, O.; Baliga, N.S.; Wang, J.T.; Ramage, D.; Amin, N.; Schwikowski, B.; Ideker, T. Cytoscape: A software environment for integrated models of Biomolecular Interaction Networks. Genome Res. 2003, 13, 2498–2504. [Google Scholar] [CrossRef] [PubMed]
- Li, J.; Han, X.; Wan, Y.; Zhang, S.; Zhao, Y.; Fan, R.; Cui, Q.; Zhou, Y. TAM 2.0: Tool for MicroRNA set analysis. Nucleic Acids Res. 2018, 46, W180–W185. [Google Scholar] [CrossRef] [PubMed]
- Urtatiz, O.; Haage, A.; Tanentzapf, G.; Van Raamsdonk, C.D. Crosstalk with keratinocytes causes GNAQ oncogene specificity in melanoma. eLife 2021, 10, 71825. [Google Scholar] [CrossRef] [PubMed]
- Kushima, I.; Aleksic, B.; Nakatochi, M.; Shimamura, T.; Okada, T.; Uno, Y.; Morikawa, M.; Ishizuka, K.; Shiino, T.; Kimura, H.; et al. Comparative Analyses of Copy-Number Variation in Autism Spectrum Disorder and Schizophrenia Reveal Etiological Overlap and Biological Insights. Cell Rep. 2018, 24, 2838–2856. [Google Scholar] [CrossRef] [PubMed]
- Bracalente, C.; Ibañez, I.L.; Berenstein, A.; Notcovich, C.; Cerda, M.B.; Klamt, F.; Chernomoretz, A.; Durán, H. Reprogramming human A375 amelanotic melanoma cells by catalase overexpression: Upregulation of antioxidant genes correlates with regression of melanoma malignancy and with malignant progression when downregulated. Oncotarget 2016, 7, 41154–41171. [Google Scholar] [CrossRef] [PubMed]
- Gembarska, A.; Luciani, F.; Fedele, C.; Russell, E.A.; Dewaele, M.; Villar, S.; Zwolinska, A.; Haupt, S.; de Lange, J.; Yip, D.; et al. MDM4 is a key therapeutic target in cutaneous melanoma. Nat. Med. 2012, 18, 1239–1247. [Google Scholar] [CrossRef] [PubMed]
- AbuHammad, S.; Cullinane, C.; Martin, C.; Bacolas, Z.; Ward, T.; Chen, H.; Slater, A.; Ardley, K.; Kirby, L.; Chan, K.T.; et al. Regulation of PRMT5–MDM4 axis is critical in the response to CDK4/6 inhibitors in melanoma. Proc. Natl. Acad. Sci. USA 2019, 116, 17990–18000. [Google Scholar] [CrossRef]
- Alatawi, A.; Kho, S.; Markey, M.P. MDM4 Isoform Expression in Melanoma Supports an Oncogenic Role for MDM4-A. J. Ski. Cancer 2021, 2021, 3087579. [Google Scholar] [CrossRef]
- Tusup, M.; Cheng, P.F.; Picardi, E.; Raziunaite, A.; Dummer, R.; Levesque, M.P.; French, L.E.; Guenova, E.; Kundig, T.M.; Pascolo, S. Evaluation of the Interplay between the ADAR Editome and Immunotherapy in Melanoma. Non-Coding RNA 2021, 7, 5. [Google Scholar] [CrossRef] [PubMed]
- Nykamp, K.; Anderson, M.; Powers, M.; Garcia, J.; Herrera, B.; Ho, Y.-Y.; Kobayashi, Y.; Patil, N.; Thusberg, J.; Westbrook, M.; et al. Sherloc: A comprehensive refinement of the ACMG–AMP variant classification criteria. Anesth. Analg. 2017, 19, 1105–1117. [Google Scholar] [CrossRef] [PubMed]
- Watkin, L.B.; Jessen, B.; Wiszniewski, W.; Vece, T.J.; Jan, M.; Sha, Y.; Thamsen, M.; Santos-Cortez, R.L.P.; Lee, K.; Gambin, T.; et al. COPA mutations impair ER-Golgi transport and cause hereditary autoimmune-mediated lung disease and arthritis. Nat. Genet. 2015, 47, 654–660. [Google Scholar] [CrossRef] [PubMed]
- Ohbayashi, N.; Fukuda, M. Recent advances in understanding the molecular basis of melanogenesis in melanocytes. F1000Research 2020, 9, 608. [Google Scholar] [CrossRef] [PubMed]
- McDonald, S.L.; Edington, H.D.; Kirkwood, J.M.; Becker, D. Expression Analysis of Genes identified by Molecular Profiling of VGP Melanomas and MGP Melanoma-Positive Lymph Nodes. Cancer Biol. Ther. 2004, 3, 110–120. [Google Scholar] [CrossRef]
- Lazar, I.; Fabre, B.; Feng, Y.; Khateb, A.; Turko, P.; Gomez, J.M.M.; Frederick, D.T.; Levesque, M.P.; Feld, L.; Zhang, G.; et al. SPANX Control of Lamin A/C Modulates Nuclear Architecture and Promotes Melanoma Growth. Mol. Cancer Res. 2020, 18, 1560–1573. [Google Scholar] [CrossRef] [PubMed]
- Lim, S.Y.; Lee, J.H.; Gide, T.N.; Menzies, A.M.; Guminski, A.; Carlino, M.S.; Breen, E.J.; Yang, J.Y.H.; Ghazanfar, S.; Kefford, R.F.; et al. Circulating Cytokines Predict Immune-Related Toxicity in Melanoma Patients Receiving Anti-PD-1–Based Immunotherapy. Clin. Cancer Res. 2019, 25, 1557–1563. [Google Scholar] [CrossRef] [PubMed]
- Jandova, J.; Wondrak, G.T. Genomic GLO1 deletion modulates TXNIP expression, glucose metabolism, and redox homeostasis while accelerating human A375 malignant melanoma tumor growth. Redox Biol. 2020, 39, 101838. [Google Scholar] [CrossRef] [PubMed]
- Kholmanskikh, O.; van Baren, N.; Brasseur, F.; Ottaviani, S.; Vanacker, J.; Arts, N.; van der Bruggen, P.; Coulie, P.; De Plaen, E. Interleukins 1α and 1β secreted by some melanoma cell lines strongly reduce expression of MITF-M and melanocyte differentiation antigens. Int. J. Cancer 2010, 127, 1625–1636. [Google Scholar] [CrossRef]
- Young, H.L.; Rowling, E.J.; Bugatti, M.; Giurisato, E.; Luheshi, N.; Arozarena, I.; Acosta, J.-C.; Kamarashev, J.; Frederick, D.T.; Cooper, Z.A.; et al. An adaptive signaling network in melanoma inflammatory niches confers tolerance to MAPK signaling inhibition. J. Exp. Med. 2017, 214, 1691–1710. [Google Scholar] [CrossRef]
- Rovera, C.; Berestjuk, I.; Lecacheur, M.; Tavernier, C.; Diazzi, S.; Pisano, S.; Irondelle, M.; Mallavialle, A.; Albrengues, J.; Gaggioli, C.; et al. Secretion of IL1 by Dedifferentiated Melanoma Cells Inhibits JAK1-STAT3–Driven Actomyosin Contractility of Lymph Node Fibroblastic Reticular Cells. Cancer Res. 2022, 82, 1774–1788. [Google Scholar] [CrossRef] [PubMed]
- Pich, C.; Meylan, P.; Mastelic-Gavillet, B.; Nguyen, T.N.; Loyon, R.; Trang, B.K.; Moser, H.; Moret, C.; Goepfert, C.; Hafner, J.; et al. Induction of Paracrine Signaling in Metastatic Melanoma Cells by PPARγ Agonist Rosiglitazone Activates Stromal Cells and Enhances Tumor Growth. Cancer Res. 2018, 78, 6447–6461. [Google Scholar] [CrossRef] [PubMed]
- Õunap, K.; Ilus, T.; Laidre, P.; Uibo, O.; Tammur, P.; Bartsch, O. A new case of 2q duplication supports either a locus for orofacial clefting between markers D2S1897 and D2S2023 or a locus for cleft palate only on chromosome 2q13-q21. Am. J. Med. Genet. Part A 2005, 137, 323–327. [Google Scholar] [CrossRef] [PubMed]
- Wenger, S.L.; Bleigh, O.C.; Hummel, M. Cleft Palate in a Newborn with Duplication 2(q13q23). Cleft Palate-Craniofacial J. 2004, 41, 568–570. [Google Scholar] [CrossRef]
- Kazenwadel, J.; Secker, G.A.; Liu, Y.J.; Rosenfeld, J.A.; Wildin, R.S.; Cuellar-Rodriguez, J.; Hsu, A.P.; Dyack, S.; Fernandez, C.V.; Chong, C.-E.; et al. Loss-of-function germline GATA2 mutations in patients with MDS/AML or MonoMAC syndrome and primary lymphedema reveal a key role for GATA2 in the lymphatic vasculature. Blood 2012, 119, 1283–1291. [Google Scholar] [CrossRef] [PubMed]
- Yuan, B.; Neira, J.; Pehlivan, D.; Santiago-Sim, T.; Song, X.; Rosenfeld, J.; Posey, J.E.; Patel, V.; Jin, W.; Adam, M.P.; et al. Clinical exome sequencing reveals locus heterogeneity and phenotypic variability of cohesinopathies. Anesth. Analg. 2019, 21, 663–675. [Google Scholar] [CrossRef] [PubMed]
- McCannel, T.A.; Burgess, B.L.; Nelson, S.F.; Eskin, A.; Straatsma, B.R. Genomic Identification of Significant Targets in Ciliochoroidal Melanoma. Investig. Opthalmol. Vis. Sci. 2011, 52, 3018–3022. [Google Scholar] [CrossRef]
- Beesley, C.E.; Meaney, C.A.; Greenland, G.; Adams, V.; Vellodi, A.; Young, E.P.; Winchester, B.G. Mutational analysis of 85 mucopolysaccharidosis type I families: Frequency of known mutations, identification of 17 novel mutations and in vitro expression of missense mutations. Hum. Genet. 2001, 109, 503–511. [Google Scholar]
- Wang, X.; Zhang, W.; Shi, H.; Qiu, Z.; Meng, Y.; Yao, F.; Wei, M. Mucopolysaccharidosis I mutations in Chinese patients: Identification of 27 novel mutations and 6 cases involving prenatal diagnosis. Clin. Genet. 2011, 81, 443–452. [Google Scholar] [CrossRef]
- Breen, C.; Mercer, J.; Jones, S.A.; Jahic, A.; Heptinstall, L.; Tylee, K.; Newman, W.G.; Beetz, C. Maternal mosaicism for IDUA deletion clarifies recurrence risk in MPS I. Hum. Genome Var. 2016, 3, 16031. [Google Scholar] [CrossRef]
- Lindberg, J.; Mills, I.G.; Klevebring, D.; Liu, W.; Neiman, M.; Xu, J.; Wikström, P.; Wiklund, P.; Wiklund, F.; Egevad, L.; et al. The Mitochondrial and Autosomal Mutation Landscapes of Prostate Cancer. Eur. Urol. 2013, 63, 702–708. [Google Scholar] [CrossRef] [PubMed]
- Preiksaitiene, E.; Kasnauskiene, J.; Ciuladaite, Z.; Tumiene, B.; Patsalis, P.C.; Kučinskas, V. Clinical and molecular characterization of a second case of 7p22.1 microduplication. Am. J. Med. Genet. Part A 2012, 158, 1200–1203. [Google Scholar] [CrossRef] [PubMed]
- Caselli, R.; Ballarati, L.; Vignoli, A.; Peron, A.; Recalcati, M.P.; Catusi, I.; Larizza, L.; Giardino, D. 7p22.1 microduplication syndrome: Clinical and molecular characterization of an adult case and review of the literature. Eur. J. Med. Genet. 2015, 58, 578–583. [Google Scholar] [CrossRef] [PubMed]
- Ronzoni, L.; Grassi, F.S.; Pezzani, L.; Tucci, A.; Baccarin, M.; Esposito, S.; Milani, D. 7p22.1 microduplication syndrome: Refinement of the critical region. Eur. J. Med. Genet. 2017, 60, 114–117. [Google Scholar] [CrossRef] [PubMed]
- Zhou, M.; Zhao, H.; Wang, X.; Sun, J.; Su, J. Analysis of long noncoding RNAs highlights region-specific altered expression patterns and diagnostic roles in Alzheimer’s disease. Brief. Bioinform. 2018, 20, 598–608. [Google Scholar] [CrossRef]
- Lancaster, J.M.; Zgheib, N.B.; Xiong, Y.; Marchion, D.C.; Bicaku, E.; Chon, H.S.; Stickles, X.B.; Al Sawah, E.; Judson, P.L.; Hakam, A.; et al. The O-glycan pathway is associated with in vitro sensitivity to gemcitabine and overall survival from ovarian cancer. Int. J. Oncol. 2012, 41, 179–188. [Google Scholar] [CrossRef] [PubMed]
- Zhang, C.; Wu, N.; Gao, F.; Han, J.; Yang, Y.; Zhou, C.; Sun, W.; Xian, L.; Cheng, Y.; Li, B.; et al. MTERFD1 functions as an oncogene. Oncotarget 2016, 5, 11140. [Google Scholar] [CrossRef][Green Version]
- Garrisi, V.M.; Strippoli, S.; De Summa, S.; Pinto, R.; Perrone, A.; Guida, G.; Azzariti, A.; Guida, M.; Stefania, T. Proteomic Profile and In Silico Analysis in Metastatic Melanoma with and without BRAF Mutation. PLoS ONE 2014, 9, e112025. [Google Scholar] [CrossRef]
- Zhao, X.; Lei, Y.; Li, G.; Cheng, Y.; Yang, H.; Xie, L.; Long, H.; Jiang, R. Integrative analysis of cancer driver genes in prostate adenocarcinoma. Mol. Med. Rep. 2019, 19, 2707–2715. [Google Scholar] [CrossRef]
- Larsson, M.; Duffy, D.L.; Zhu, G.; Liu, J.Z.; Macgregor, S.; McRae, A.F.; Wright, M.J.; Sturm, R.A.; Mackey, D.A.; Montgomery, G.W.; et al. GWAS Findings for Human Iris Patterns: Associations with Variants in Genes that Influence Normal Neuronal Pattern Development. Am. J. Hum. Genet. 2011, 89, 334–343. [Google Scholar] [CrossRef]
- Kasak, L.; Rull, K.; Vaas, P.; Teesalu, P.; Laan, M. Extensive load of somatic CNVs in the human placenta. Sci. Rep. 2015, 5, 8342. [Google Scholar] [CrossRef]
- Haymaker, C.L.; Wu, R.C.; Ritthipichai, K.; Bernatchez, C.; Forget, M.-A.; Chen, J.Q.; Liu, H.; Wang, E.; Marincola, F.; Hwu, P.; et al. BTLA marks a less-differentiated tumor-infiltrating lymphocyte subset in melanoma with enhanced survival properties. OncoImmunology 2015, 4, e1014246. [Google Scholar] [CrossRef]
- Orgaz, J.L.; Benguria, A.; Sanchez-Martinez, C.; Ladhani, O.; Volpert, O.V.; Jimenez, B. Changes in the gene expression profile of A375 human melanoma cells induced by overexpression of multifunctional pigment epithelium-derived factor. Melanoma Res. 2011, 21, 285–297. [Google Scholar] [CrossRef] [PubMed]
- Turro, E.; Astle, W.J.; Megy, K.; Gräf, S.; Greene, D.; Shamardina, O.; Allen, H.L.; Sanchis-Juan, A.; Frontini, M.; Thys, C.; et al. Whole-genome sequencing of patients with rare diseases in a national health system. Nature 2020, 583, 96–102. [Google Scholar] [CrossRef]
- Miao, Y.; Zhang, W.; Liu, S.; Leng, X.; Hu, C.; Sun, H. HOXC10 promotes growth and migration of melanoma by regulating Slug to activate the YAP/TAZ signaling pathway. Discov. Oncol. 2021, 12, 12. [Google Scholar] [CrossRef]
- Cillo, C.; Cantile, M.; Mortarini, R.; Barba, P.; Parmiani, G.; Anichini, A. Differential patterns of HOX gene expression are associated with specific integrin and ICAM profiles in clonal populations isolated from a single human melanoma metastasis. Int. J. Cancer 1996, 66, 692–697. [Google Scholar] [CrossRef]
- Bhattacharya, C.; Wang, X.; Becker, D. The DEAD/DEAH box helicase, DDX11, is essential for the survival of advanced melanomas. Mol. Cancer 2012, 11, 82. [Google Scholar] [CrossRef] [PubMed]
- Capo-Chichi, J.-M.; Bharti, S.K.; Sommers, J.A.; Yammine, T.; Chouery, E.; Patry, L.; Rouleau, G.A.; Samuels, M.E.; Hamdan, F.F.; Michaud, J.L.; et al. Identification and Biochemical Characterization of a Novel Mutation in DDX11 Causing Warsaw Breakage Syndrome. Hum. Mutat. 2012, 34, 103–107. [Google Scholar] [CrossRef]
- Sun, X.; Chen, H.; Deng, Z.; Hu, B.; Luo, H.; Zeng, X.; Han, L.; Cai, G.; Ma, L. The Warsaw breakage syndrome-related protein DDX11 is required for ribosomal RNA synthesis and embryonic development. Hum. Mol. Genet. 2015, 24, 4901–4915. [Google Scholar] [CrossRef] [PubMed]
- Kim, T.; Pazhoor, S.; Bao, M.; Zhang, Z.; Hanabuchi, S.; Facchinetti, V.; Bover, L.; Plumas, J.; Chaperot, L.; Qin, J.; et al. Aspartate-glutamate-alanine-histidine box motif (DEAH)/RNA helicase A helicases sense microbial DNA in human plasmacytoid dendritic cells. Proc. Natl. Acad. Sci. USA 2010, 107, 15181–15186. [Google Scholar] [CrossRef]
- Rabin, R.; Hirsch, Y.; Johansson, M.M.; Ekstein, J.; Zeevi, D.A.; Keena, B.; Zackai, E.H.; Pappas, J. Study of carrier frequency of Warsaw breakage syndrome in the Ashkenazi Jewish population and presentation of two cases. Am. J. Med. Genet. Part A 2019, 179, 2144–2151. [Google Scholar] [CrossRef] [PubMed]
- Van Schie, J.J.M.; Faramarz, A.; Balk, J.A.; Stewart, G.S.; Cantelli, E.; Oostra, A.B.; Rooimans, M.A.; Parish, J.L.; de Almeida Estéves, C.; Dumic, K.; et al. Warsaw breakage syndrome associated DDX11 helicase resolves G-quadruplex structures to support sister chromatid cohesion. Nat. Commun. 2020, 11, 4287. [Google Scholar] [CrossRef] [PubMed]
- van der Lelij, P.; Chrzanowska, K.H.; Godthelp, B.C.; Rooimans, M.A.; Oostra, A.B.; Stumm, M.; Zdzienicka, M.Z.; Joenje, H.; de Winter, J.P. Warsaw Breakage Syndrome, a Cohesinopathy Associated with Mutations in the XPD Helicase Family Member DDX11/ChlR1. Am. J. Hum. Genet. 2010, 86, 262–266. [Google Scholar] [CrossRef] [PubMed]
- Alkhunaizi, E.; Shaheen, R.; Bharti, S.K.; Joseph-George, A.M.; Chong, K.; Abdel-Salam, G.M.H.; Alowain, M.; Blaser, S.I.; Papsin, B.C.; Butt, M.; et al. Warsaw breakage syndrome: Further clinical and genetic delineation. Am. J. Med. Genet. Part A 2018, 176, 2404–2418. [Google Scholar] [CrossRef] [PubMed]
- Megy, K.; Downes, K.; Morel-Kopp, M.; Bastida, J.M.; Brooks, S.; Bury, L.; Leinoe, E.; Gomez, K.; Morgan, N.V.; Othman, M.; et al. GoldVariants, a resource for sharing rare genetic variants detected in bleeding, thrombotic, and platelet disorders: Communication from the ISTH SSC Subcommittee on Genomics in Thrombosis and Hemostasis. J. Thromb. Haemost. 2021, 19, 2612–2617. [Google Scholar] [CrossRef] [PubMed]
- Souri, M.; Koseki-Kuno, S.; Iwata, H.; Kemkes-Matthes, B.; Ichinose, A. A naturally occurring E30Q mutation in the Gla domain of protein Z causes its impaired secretion and subsequent deficiency. Blood 2005, 105, 3149–3154. [Google Scholar] [CrossRef] [PubMed]
- Shibata, T.; Kokubu, A.; Miyamoto, M.; Sasajima, Y.; Yamazaki, N. Mutant IDH1 Confers an in Vivo Growth in a Melanoma Cell Line with BRAF Mutation. Am. J. Pathol. 2011, 178, 1395–1402. [Google Scholar] [CrossRef] [PubMed]
- Richard, E.M.; Bakhtiari, S.; Marsh, A.P.L.; Kaiyrzhanov, R.; Wagner, M.; Shetty, S.; Pagnozzi, A.; Nordlie, S.M.; Guida, B.S.; Cornejo, P.; et al. Bi-allelic variants in SPATA5L1 lead to intellectual disability, spastic-dystonic cerebral palsy, epilepsy, and hearing loss. Am. J. Hum. Genet. 2021, 108, 2006–2016. [Google Scholar] [CrossRef] [PubMed]
- Feichtinger, J.; Larcombe, L.; McFarlane, R.J. Meta-analysis of expression of l(3)mbt tumor-associated germline genes supports the model that a soma-to-germline transition is a hallmark of human cancers. Int. J. Cancer 2013, 134, 2359–2365. [Google Scholar] [CrossRef]
- Shiohama, Y.; Ohtake, J.; Ohkuri, T.; Noguchi, D.; Togashi, Y.; Kitamura, H.; Nishimura, T. Identification of a meiosis-specific protein, MEIOB, as a novel cancer/testis antigen and its augmented expression in demethylated cancer cells. Immunol. Lett. 2014, 158, 175–182. [Google Scholar] [CrossRef]
- Jay, A.; Reitz, D.; Namekawa, S.H.; Heyer, W.-D. Cancer testis antigens and genomic instability: More than immunology. DNA Repair 2021, 108, 103214. [Google Scholar] [CrossRef] [PubMed]
- Gershoni, M.; Hauser, R.; Yogev, L.; Lehavi, O.; Azem, F.; Yavetz, H.; Pietrokovski, S.; Kleiman, S.E. A familial study of azoospermic men identifies three novel causative mutations in three new human azoospermia genes. Anesth. Analg. 2017, 19, 998–1006. [Google Scholar] [CrossRef] [PubMed]
- Rendtorff, N.D.; Bjerregaard, B.; Frödin, M.; Kjaergaard, S.; Hove, H.; Skovby, F.; Brøndum-Nielsen, K.; Schwartz, M.; Danish Tuberous Sclerosis Group. Analysis of 65 tuberous sclerosis complex (TSC) patients by TSC2 DGGE, TSC1/TSC2 MLPA, and TSC1 long-range PCR sequencing, and report of 28 novel mutations. Hum. Mutat. 2005, 26, 374–383. [Google Scholar] [CrossRef] [PubMed]
- Kozlowski, P.; Roberts, P.; Dabora, S.; Franz, D.; Bissler, J.; Northrup, H.; Au, K.S.; Lazarus, R.; Domanska-Pakiela, D.; Kotulska, K.; et al. Identification of 54 large deletions/duplications in TSC1 and TSC2 using MLPA, and genotype-phenotype correlations. Hum. Genet. 2007, 121, 389–400. [Google Scholar] [CrossRef] [PubMed]
- Crino, P.B.; Aronica, E.; Baltuch, G.; Nathanson, K.L. Biallelic TSC gene inactivation in tuberous sclerosis complex. Neurology 2010, 74, 1716–1723. [Google Scholar] [CrossRef] [PubMed]
- Glushkova, M.; Bojinova, V.; Koleva, M.; Dimova, P.; Bojidarova, M.; Litvinenko, I.; Todorov, T.; Iluca, E.; Calusaru, C.; Neagu, E.; et al. Molecular genetic diagnostics of tuberous sclerosis complex in Bulgaria: Six novel mutations in the TSC1 and TSC2 genes. J. Genet. 2018, 97, 419–427. [Google Scholar] [CrossRef] [PubMed]
- Griffin, N.G.; Cronin, K.D.; Walley, N.M.; Hulette, C.M.; Grant, G.A.; Mikati, M.A.; LaBreche, H.G.; Rehder, C.W.; Allen, A.S.; Crino, P.B.; et al. Somatic uniparental disomy of Chromosome 16p in hemimegalencephaly. Mol. Case Stud. 2017, 3, a001735. [Google Scholar] [CrossRef] [PubMed][Green Version]
- Wan, Q.; Tang, J.; Lu, J.; Jin, L.; Su, Y.; Wang, S.; Cheng, Y.; Liu, Y.; Li, C.; Wang, Z. Six-gene-based prognostic model predicts overall survival in patients with uveal melanoma. Cancer Biomark. 2020, 27, 343–356. [Google Scholar] [CrossRef]
- Yin, J.; Liu, H.; Liu, Z.; Wang, L.-E.; Chen, W.V.; Zhu, D.; Amos, C.I.; Fang, S.; Lee, J.E.; Wei, Q. Genetic Variants in Fanconi Anemia Pathway Genes BRCA2 and FANCA Predict Melanoma Survival. J. Investig. Dermatol. 2015, 135, 542–550. [Google Scholar] [CrossRef]
- Bourseguin, J.; Bonet, C.; Renaud, E.; Pandiani, C.; Boncompagni, M.; Giuliano, S.; Pawlikowska, P.; Karmous-Benailly, H.; Ballotti, R.; Rosselli, F.; et al. FANCD2 functions as a critical factor downstream of MiTF to maintain the proliferation and survival of melanoma cells. Sci. Rep. 2016, 6, 36539. [Google Scholar] [CrossRef]
- Yu, Y.; Hu, H.; Chen, J.-S.; Hu, F.; Fowler, J.; Scheet, P.; Zhao, H.; Huff, C.D. Integrated case-control and somatic-germline interaction analyses of melanoma susceptibility genes. Biochim. Biophys. Acta (BBA) Mol. Basis Dis. 2018, 1864, 2247–2254. [Google Scholar] [CrossRef] [PubMed]
- Zhang, M.; Qureshi, A.A.; Guo, Q.; Han, J. Genetic variation in DNA repair pathway genes and melanoma risk. DNA Repair 2011, 10, 111–116. [Google Scholar] [CrossRef] [PubMed]
- Kim, K.; Leong, S.P.L.; Singer, M.I.; Parrett, B.M.; Moretto, J.; Minor, D.R.; Vosoughi, E.; Millis, S.Z.; Ross, J.S.; Kashani-Sabet, M. Frequency of genetic homologous recombination (HR) alterations in metastatic cutaneous melanoma. J. Clin. Oncol. 2017, 35, e21033. [Google Scholar] [CrossRef]
- Kim, K.B.; Soroceanu, L.; de Semir, D.; Millis, S.Z.; Ross, J.; Vosoughi, E.; Dar, A.A.; Nosrati, M.; Desprez, P.-Y.; Ice, R.; et al. Prevalence of Homologous Recombination Pathway Gene Mutations in Melanoma: Rationale for a New Targeted Therapeutic Approach. J. Investig. Dermatol. 2021, 141, 2028–2036.e2. [Google Scholar] [CrossRef] [PubMed]
- Kimble, D.C.; Lach, F.P.; Gregg, S.Q.; Donovan, F.X.; Flynn, E.K.; Kamat, A.; Young, A.; Vemulapalli, M.; Thomas, J.W.; Mullikin, J.C.; et al. A comprehensive approach to identification of pathogenic FANCA variants in Fanconi anemia patients and their families. Hum. Mutat. 2017, 39, 237–254. [Google Scholar] [CrossRef] [PubMed]
- Moghrabi, N.N.; Johnson, M.A.; Yoshitomi, M.J.; Zhu, X.; Al-Dhalimy, M.J.; Olson, S.B.; Grompe, M.; Richards, C.S. Validation of Fanconi anemia complementation Group A assignment using molecular analysis. Anesth. Analg. 2009, 11, 183–192. [Google Scholar] [CrossRef] [PubMed]
- Guan, J.; Fransson, S.; Siaw, J.T.; Treis, D.; Van den Eynden, J.; Chand, D.; Umapathy, G.; Ruuth, K.; Svenberg, P.; Wessman, S.; et al. Clinical response of the novel activating ALK-I1171T mutation in neuroblastoma to the ALK inhibitor ceritinib. Mol. Case Stud. 2018, 4, a002550. [Google Scholar] [CrossRef] [PubMed]
- Xi, Y.; Riker, A.; Shevde-Samant, L.; Samant, R.; Morris, C.; Gavin, E.; Fodstad, O.; Ju, J. Global Comparative Gene Expression Analysis of Melanoma Patient Samples, Derived Cell Lines and Corresponding Tumor Xenografts. Cancer Genom. Proteom. 2008, 5, 1–35. [Google Scholar]
- Kang, J.; Lee, J.; Lee, A.; Lee, Y.S. Prediction of BRAF V600E variant from cancer gene expression data. Transl. Cancer Res. 2022, 11, 4051–4056. [Google Scholar] [CrossRef]
- Zhang, L.; Li, X.; Zhang, J.; Xu, G. Prognostic Implication and Oncogenic Role of PNPO in Pan-Cancer. Front. Cell Dev. Biol. 2022, 9, 763674. [Google Scholar] [CrossRef]
- Chen, X.; Yang, M.; Hao, W.; Han, J.; Ma, J.; Wang, C.; Sun, S.; Zheng, Q. Differentiation-inducing and anti-proliferative activities of isoliquiritigenin and all-trans-retinoic acid on B16F0 melanoma cells: Mechanisms profiling by RNA-seq. Gene 2016, 592, 86–98. [Google Scholar] [CrossRef] [PubMed]
- Um, H.N.; Han, J.M.; Hwang, J.; Hong, S.I.; Vaudry, H.; Seong, J.Y. Molecular coevolution of kisspeptins and their receptors from fish to mammals. Ann. N. Y. Acad. Sci. 2010, 1200, 67–74. [Google Scholar] [CrossRef] [PubMed]
- De Francesco, E.M.; Bonuccelli, G.; Maggiolini, M.; Sotgia, F.; Lisanti, M.P. Vitamin C and Doxycycline: A synthetic lethal combination therapy targeting metabolic flexibility in cancer stem cells (CSCs). Oncotarget 2017, 8, 67269–67286. [Google Scholar] [CrossRef]
- Ghosh, S.; Spagnoli, G.C.; Martin, I.; Ploegert, S.; Demougin, P.; Heberer, M.; Reschner, A. Three-dimensional culture of melanoma cells profoundly affects gene expression profile: A high density oligonucleotide array study. J. Cell. Physiol. 2005, 204, 522–531. [Google Scholar] [CrossRef]
- Munteanu, C.V.; Chirițoiu, G.N.; Chirițoiu, M.; Ghenea, S.; Petrescu, A.-J.; Petrescu, Ș.M. Affinity Proteomics and Deglycoproteomics Uncover Novel EDEM2 Endogenous Substrates and an Integrative ERAD Network. Mol. Cell. Proteom. 2021, 20, 100125. [Google Scholar] [CrossRef]
- Munteanu, C.V.A.; Chiriţoiu, G.N.; Petrescu, A.-J.; Petrescu, Ș.M. Profiling Optimal Conditions for Capturing EDEM Proteins Complexes in Melanoma Using Mass Spectrometry. In Advancements of Mass Spectrometry in Biomedical Research; Woods, A.G., Darie, C.C., Eds.; Springer International Publishing: Cham, Switzerland, 2019; pp. 155–167. [Google Scholar]
- Jangi, S.-M.; Ruiz-Larrea, M.B.; Nicolau-Galmés, F.; Andollo, N.; Arroyo-Berdugo, Y.; Ortega-Martínez, I.; Díaz-Pérez, J.L.; Boyano, M.D. Terfenadine-induced apoptosis in human melanoma cells is mediated through Ca2+ homeostasis modulation and tyrosine kinase activity, independently of H1 histamine receptors. Carcinogenesis 2008, 29, 500–509. [Google Scholar] [CrossRef] [PubMed]
- Jangi, S.-M.; Díaz-Pérez, J.L.; Ochoa-Lizarralde, B.; Martín-Ruiz, I.; Asumendi, A.; Pérez-Yarza, G.; Gardeazabal, J.; Díaz-Ramón, J.L.; Boyano, M.D. H1 histamine receptor antagonists induce genotoxic and caspase-2-dependent apoptosis in human melanoma cells. Carcinog. 2006, 27, 1787–1796. [Google Scholar] [CrossRef]
- Pradhan, D.; Jour, G.; Milton, D.; Vasudevaraja, V.; Tetzlaff, M.T.; Nagarajan, P.; Curry, J.L.; Ivan, D.; Long, L.; Ding, Y.; et al. Aberrant DNA Methylation Predicts Melanoma-Specific Survival in Patients with Acral Melanoma. Cancers 2019, 11, 2031. [Google Scholar] [CrossRef] [PubMed]
- Warnatz, K.; Salzer, U.; Rizzi, M.; Fischer, B.; Gutenberger, S.; Böhm, J.; Kienzler, A.-K.; Pan-Hammarström, Q.; Hammarström, L.; Rakhmanov, M.; et al. B-cell activating factor receptor deficiency is associated with an adult-onset antibody deficiency syndrome in humans. Proc. Natl. Acad. Sci. USA 2009, 106, 13945–13950. [Google Scholar] [CrossRef]
- Marchione, R.; Laurin, D.; Liguori, L.; Leibovitch, M.P.; Leibovitch, S.A.; Lenormand, J.-L. MD11-mediated delivery of recombinant eIF3f induces melanoma and colorectal carcinoma cell death. Mol. Ther. Methods Clin. Dev. 2015, 2, 14056. [Google Scholar] [CrossRef]
- Guo, S.; Guo, W.; Li, S.; Dai, W.; Zhang, N.; Zhao, T.; Wang, H.; Ma, J.; Yi, X.; Ge, R.; et al. Serum miR-16: A Potential Biomarker for Predicting Melanoma Prognosis. J. Investig. Dermatol. 2016, 136, 985–993. [Google Scholar] [CrossRef] [PubMed]
- Alderman, C.; Sehlaoui, A.; Xiao, Z.; Yang, Y. MicroRNA-15a inhibits the growth and invasiveness of malignant melanoma and directly targets on CDCA4 gene. Tumor Biol. 2016, 37, 13941–13950. [Google Scholar] [CrossRef] [PubMed]
- Gajos-Michniewicz, A.; Czyz, M. Role of miRNAs in Melanoma Metastasis. Cancers 2019, 11, 326. [Google Scholar] [CrossRef] [PubMed]
- Khan, S.U.; Ullah, Z.; Shaukat, H.; Unab, S.; Jannat, S.; Ali, W.; Ali, A.; Irfan, M.; Khan, M.F.; Cervantes-Villagrana, R.D. TP53 and its Regulatory Genes as Prognosis of Cutaneous Melanoma. Cancer Inform. 2023, 22, 11769351231177267. [Google Scholar] [CrossRef] [PubMed]
- Potrony, M.; Badenas, C.; Aguilera, P.; Puig-Butille, J.A.; Carrera, C.; Malvehy, J.; Puig, S. Update in genetic susceptibility in melanoma. Ann. Transl. Med. 2015, 3, 210. [Google Scholar] [CrossRef] [PubMed]
- Güllülü, Ö.; Hehlgans, S.; Rödel, C.; Fokas, E.; Rödel, F. Tumor Suppressor Protein p53 and Inhibitor of Apoptosis Proteins in Colorectal Cancer—A Promising Signaling Network for Therapeutic Interventions. Cancers 2021, 13, 624. [Google Scholar] [CrossRef] [PubMed]
- Wang, H.; Guo, M.; Wei, H.; Chen, Y. Targeting p53 pathways: Mechanisms, structures, and advances in therapy. Signal Transduct. Target. Ther. 2023, 8, 92. [Google Scholar] [CrossRef]
- Patel, N.; Garikapati, K.R.; Pandita, R.K.; Singh, D.K.; Pandita, T.K.; Bhadra, U.; Bhadra, M.P. miR-15a/miR-16 down-regulates BMI1, impacting Ub-H2A mediated DNA repair and breast cancer cell sensitivity to doxorubicin. Sci. Rep. 2017, 7, 4263. [Google Scholar] [CrossRef] [PubMed]
- Varrone, F.; Caputo, E. The miRNAs Role in Melanoma and in Its Resistance to Therapy. Int. J. Mol. Sci. 2020, 21, 878. [Google Scholar] [CrossRef]
- Dong, L.; Tian, X.; Zhao, Y.; Tu, H.; Wong, A.; Yang, Y. The Roles of MiRNAs (MicroRNAs) in Melanoma Immunotherapy. Int. J. Mol. Sci. 2022, 23, 14775. [Google Scholar] [CrossRef]
- Poniewierska-Baran, A.; Słuczanowska-Głąbowska, S.; Małkowska, P.; Sierawska, O.; Zadroga, Ł.; Pawlik, A.; Niedźwiedzka-Rystwej, P. Role of miRNA in Melanoma Development and Progression. Int. J. Mol. Sci. 2022, 24, 201. [Google Scholar] [CrossRef] [PubMed]


Disclaimer/Publisher’s Note: The statements, opinions and data contained in all publications are solely those of the individual author(s) and contributor(s) and not of MDPI and/or the editor(s). MDPI and/or the editor(s) disclaim responsibility for any injury to people or property resulting from any ideas, methods, instructions or products referred to in the content. |
© 2024 by the authors. Licensee MDPI, Basel, Switzerland. This article is an open access article distributed under the terms and conditions of the Creative Commons Attribution (CC BY) license (https://creativecommons.org/licenses/by/4.0/).