Simple Summary
In this study, we investigate the availability and access to orphan drugs for rare cancers in Bulgaria, aiming to address the urgent need for improved treatment access for this vulnerable population. By comparing data from European and national sources, we aimed to assess the availability, delays, and budgetary impact of these drugs. Our findings reveal significant disparities in their access and highlight the pressing need for targeted policies to address these inequalities. This research contributes valuable insights into the challenges faced by rare cancer patients and we call for focused efforts at both the European and national levels to ensure equitable access to treatment.
Abstract
Rare cancers are defined by an annual incidence of fewer than 6 per 100,000. Bearing similarities to rare diseases, they are associated with substantial health inequalities due to diagnostic complexity and delayed access to innovative therapies. This situation is further aggravated in Southeastern European countries like Bulgaria, where limited public resources and expertise underscore the need for additional policy and translational research on rare cancers. This study aimed to explore the availability and access to orphan drugs for rare cancers in Bulgaria for the period of 2020–2023. We cross-compared data from both the European Union and national public sources to evaluate the number of available and accessible orphan drugs for rare cancers, the delay from market authorization to reimbursement, the dynamics of public expenditures, and regional disparities in access across the country. We juxtaposed the main characteristics of oncological and non-oncological orphan drugs as well. Only 15 out of 50 oncological orphan drugs that were authorized by the European Medicine Agency were accessible for rare cancer patients in Bulgaria. The median delay between market authorization and inclusion in the Bulgarian Positive Drug List was 760 days. The total expenditures for all orphan drugs for rare cancers amounted to EUR 74,353,493 from 2020 to 2023. The budgetary impact of this group rose from 0.24% to 3.77% of total public medicinal product expenditures for the study period. Rare cancer patients represent a vulnerable population that often faces limited to no access to treatment. We call for targeted European and national policies to address this major inequality.
1. Introduction
1.1. Background
Rare cancers are typically defined by an annual incidence of fewer than 6 per 100,000 [1]. While this threshold is widely accepted within the scientific community [2,3] and the regulatory frameworks in certain countries [4], a common EU legal definition has yet to be adopted [5]. Rare cancers encompass a diverse group of diseases, accounting for 24% of all cancer cases in Europe [6]. However, the affected patients share common health inequities, leading to a significantly lower 5-year survival rate compared to common cancer types [7]. Similar to rare diseases [8], rare cancers are characterized by health discrimination [9], scarce information [10,11], limited research opportunities [12], lack of targeted preventive policies [13], difficulties in accurate diagnosis [14], and fragmented clinical management [15,16,17,18,19]. While these public health problems are evident at the member state level, it is also observed that Eastern European countries exhibit significantly lower 5-year survival rates for rare cancers compared to their Western European counterparts [6]. Such findings underline the crucial impact of healthcare system organization and accessibility to innovative therapies.
1.2. Rare Cancer Policies
Two significant groups of EU policies have focused on the challenges of rare cancers. First, Europe’s Beating Cancer Plan (EBCP) [20] included rare cancers as one of its key priorities. Aiming to meet the increasing demands for cancer prevention, effective screening, and treatment, several of the proposed EBCP initiatives offer investments in rare cancer research and innovation, tackle the lack of therapeutic protocols, and address the limited access to innovative therapies. However, the EBCP does not explicitly provide a standardized healthcare organizational model for the management of rare cancers. Thus, the two main approaches—centralized “peer to peer” [21] and decentralized “hub and spoke” [22]—remain equally valid alternatives considering the member states’ healthcare system characteristics. Still, no sufficient evidence exists to support the preferred model among member states [13,22,23].
The second main group of policies considers rare cancers as rare diseases with an oncological manifestation. Therefore, rare cancer stakeholders could also benefit from the already-developed rare initiatives such as the Orphan Drug Legislation [24] and the European Reference Networks (ERNs) [25,26]. The orphan drug designation tackles small-market barriers by providing economic incentives and facilitating the regulatory approval process. However, drug policy should also promote equity and fairness, which are crucial in the case of rare cancers, for which classical randomized clinical trials can rarely reach significant results [27,28,29]. The lack of real-world post-authorization data and RCT outcome generalizability further increases therapeutic uncertainty [30]. Despite the number of authorized innovative medicinal products [31], several studies indicate potential orphan drug market failures. The substantial increase in oncological indications outweighs all other rare diseases, leading to market substitution [19,32,33,34]. This expansion is partly attributed to the “salami slicing” phenomenon, where the patient population is intentionally divided into smaller subgroups based on cancer stage and positive genetic or immunological markers [19,35,36,37]. While this approach narrowly focuses on patient eligibility, certain orphan cancer drugs may also be used in non-rare or multiple rare conditions, shifting the market dynamics to resemble conventional medical therapies [38,39,40,41,42]. Yet, numerous rare cancers, especially in children, continue to face significant unmet health needs [43].
1.3. Access to Orphan Cancer Therapies in the EU and Bulgaria
Access to orphan cancer drugs in the EU faces challenges in two main stages. While the Orphan Drug Regulation promotes research and development and sets up conditions for market authorization by the European Medicines Agency (EMA), pricing and reimbursement decisions remain at the discretion of member states [44,45]. The latter usually involves health technology assessment (HTA) and price negotiations. However, the economic discrepancies across the EU result in significant heterogeneity in reimbursement decisions. Thus, while some countries base the reimbursement decision on specific HTA criteria for oncological or rare therapies, others rely on budgetary impact, multicriteria analysis, or higher cost-effectiveness thresholds [46,47].
The Bulgarian case is no exception. Patient access to innovative cancer drugs includes a complex procedure in several stages [48]. The process is initiated by market authorization holders who apply to the National Council on Prices and Reimbursement of Medicinal Products (NCPRMP) for inclusion in the Positive Drug List (PDL) and public fund reimbursement. To be included in the PDL, an innovative cancer drug must already have been funded in five out of the seventeen reference countries. In the case of orphan drugs, this reference list extends to all EU member states [49]. The pricing of the product is based on an external reference list. The maximum product price is set to be no higher than the lowest price among a list of 10 reference countries [49]. In addition, market holders submitting applications for public reimbursement are required to contract a discount agreement with the single public payer, the National Health Insurance Fund (NHIF). The minimum discount is set at 10% of the official selling list price. However, the exact discount is confidential. When the maximum price and discount agreement are set, the NCPRMP conducts an HTA assessment based on cost-effectiveness analysis (CEA) and budget impact analysis (BIA). Legally, this stage is supported by evidence from HTA reports from the UK, France, Germany, and Sweden or a joint clinical assessment report in relation to Regulation (EU) 2021/2282 [50]. Finally, the NHIF is responsible for establishing coverage and distribution methods. Hospital pharmacies handle the distribution of all drugs listed and eligible for reimbursement. Hospitals procure these drugs either through direct contracts or public procurement, with decentralized purchasing processes. The NFIF reimburses hospitals monthly for cancer drug payments, with a maximum price deviation enforced nationally. Costs exceeding this deviation are reimbursed by market authorization holders, as are expenses exceeding the allocated NHIF budget [51].
1.4. Rare Cancer Policies in Bulgaria
The Bulgarian Cancer Control Plan (BCCP) [52], similar to the EBCP, also includes rare cancers as one of its priorities. The plan identifies the lack of specific HTA criteria in the reimbursement framework as one of the main barriers to access to innovative therapies. However, the BCCP does not set goals based on Bulgarian orphan drug market practices, real-world data on budgetary impact, or existing regional differences in access. This is particularly important in the context of emerging needs for policy research and evidence-based decision-making for rare cancers [5,53].
The primary objective of this research is to conduct a thorough analysis of the orphan cancer drug market in Bulgaria, juxtaposing it against innovative non-orphan cancer drugs. Moreover, this study provides a comprehensive analysis of the regional differences in access to orphan cancer drugs and assesses their budgetary impact from a healthcare perspective. The study results provide insights that can inform evidence-based policy decisions concerning rare cancers at both the national and EU levels.
2. Materials and Methods
2.1. Study Design
This study is a retrospective analysis of orphan drugs (ODs) in the oncology market in Bulgaria between July 2020 and September 2023. The start of the study period was selected as the first month for which open data on cancer OD expenditures at the hospital level were available.
Eligible drugs were identified using the EMA’s European Public Assessment Reports (EPARs) database. This study focused on cancer drugs used in human medicine, as defined by the Anatomical Therapeutic Chemical (ATC) classification system and the International Classification of Diseases (ICD) therapeutic indication. The market (trade) name of the drug was used as a unique identifier to match the EMA database with all relevant data sources. Only drugs with active marketing authorization were included in the analysis. The cost data were extracted only for medications listed in the Bulgarian Positive Drug List (PDL) and eligible for reimbursement.
Four main aspects of the cancer OD market were analyzed: (1) the number of reimbursed cancer ODs and their access delay, (2) the public expenditures of reimbursed cancer ODs and their budgetary impact, (3) the regional differences in access and expenditures for cancer ODs, and (4) the comparative profile of market authorization holders. The estimated expenditures, delays, and budgetary impact were compared to the corresponding data for innovative non-orphan cancer drugs. The cancer medicines without OD were selected based on the match between the EMA database and the Bulgarian PDL. The study data as well as the performed analysis are publicly available on the project’s GitHub repository https://github.com/kostadinoff/Availability-and-access-to-orphan-drugs-for-rare-cancers-in-Bulgaria, created on 13 March 2024.
2.2. Definitions
In this study, the term “access” is defined as the ability to receive timely and fully funded medical treatment. Within this framework, drugs approved and registered by the EU as ODs are considered “available”, but they are only deemed “accessible” when they are integrated into the public health system through an effective reimbursement scheme [54]. Thus, the term “access delay” is used to describe the time interval between the EMA market authorization and the first NHIF expenditure for a given cancer OD. The overall delay was divided into two main components: “external delay” and “internal delay”. The term “external delay” is used to describe the time interval between the EMA market authorization and the inclusion of a specific cancer OD in the PDL. The term “internal delay” is used to describe the time interval between the inclusion of a specific cancer OD in the PDL and the first NHIF expenditure.
2.3. Data Collection
Data were collected on 3 January 2024. Four main data sources were used for this study (Table 1): (1) NHIF data, (2) EMA’s EPARs database, (3) NCPRMP’s PDL database, and (4) NHIF annual budget reports.

Table 1.
Data sources and extracted variables.
The EPARs database was downloaded from the EMA website. The dataset was filtered by the ATC as well as the ICD of the therapeutic indication to include only cancer drugs used in human medicine. The variables of interest included the product name, ATC code, therapeutic indication, orphan designation status, and the date of market authorization. Only products with active marketing authorization were included.
Cost data were extracted from the NHIF website. The scraping resulted in 43 Excel data files spanning from July 2020 to September 2023. Each file underwent a comprehensive review to ensure data integrity and consistency. The variables of interest included product name, number of treated patients, ATC, INN, region, hospital, and ICD code. The data processing was conducted using R [55] and the tidyverse package [56]. This process involved consolidating the data files into a unified time series database with one row per product. Additional steps included standardizing the data format and metadata checks. Subsequently, the database was converted into a CSV file for further analysis.
PDL data were downloaded from the Open Data Portal of the Republic of Bulgaria. The database was filtered by the market name matched in the EPARs database. The variables of interest included the reimbursement status and the date of inclusion in the PDL.
Finally, the NHIF annual budget reports were obtained from the NHIF website. The expenses related to all medicinal treatments were extracted from the reports covering the years 2020–2023.
2.4. Data Analysis
The data analysis was conducted utilizing R version 4.3.2 [55]. Categorical variables were summarized with counts and percentages, while for continuous variables, median, minimum, and maximum values were used. Bootstrap simulation with replacement was employed to estimate the ratio or difference between two medians, along with generating bootstrapped 95% confidence intervals. Additionally, the Mann–Whitney U test was utilized to assess differences between the two groups. Monthly and yearly growth rates were calculated using the following formula: . All cost data were converted from Bulgarian currency (BGN) to the Euro (EUR) using the official fixed exchange rate of 1 EUR = 1.95583 BGN. Statistical significance was set at p < 0.05. Data visualization was performed using the ggplot2 package [57]. Trend lines were fitted using the LOESS method. The budgetary impact of cancer ODs was estimated as a proportion of the total cancer treatment expenditures (CTE) and the National Health Insurance Fund Medicines Expenditure (NHIF ME). In the cases where the data did not cover a full 12 months, the NHIF ME was estimated by dividing the annual budget by 12 and multiplying it by the number of months covered in missing data periods. The median monthly expenditure (MME) per drug was calculated by dividing the total expenditures by the number of months in the study period.
3. Results
3.1. Number of Available Cancer ODs and Their Access Delay
On 30 September 2023, the analysis of the EPARs list revealed 50 ODs with an active centralized EU marketing authorization. Subsequently, each of these therapies underwent evaluation within the Bulgarian PDL database, resulting in 15 registered and priced products (30%) eligible for reimbursement (Table 2). The median increase rate for the number of cancer ODs in the PDL was 7% (Figure 1A), which was 3.4 times slower compared to the increase rate of EMA authorization (24%).
Table 2.
List of all 15 cancer ODs accessible in Bulgaria and their therapeutic indications.
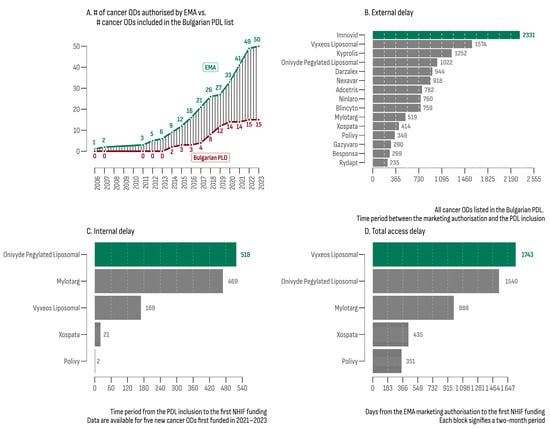
Figure 1.
(A) Number of OD cancer drugs authorized by the EMA and their accessibility in Bulgarian PDL; (B) external delay between EMA authorization and inclusion in the PDL; (C) internal delay between PDL inclusion and first NHIF expenditure; (D) total delay between EMA authorization and first NHIF expenditure.
The median external delay (MED) for cancer ODs, defined as the time interval between EMA authorization and PDL inclusion, was 760 days. The leaders in this category were Imnovid® (2331 days) and Vyxeos Liposomal® (1574 days). Rydapt® exhibited the shortest MED (235 days). The MED for all 157 non-orphan cancer drugs matched with the EPARs database was 793 days. The product with the longest external delay was Targretin® (6812 days), while the shortest was observed for Kanjinti® and Inflectra® (both 78 days). The difference in MEDs between orphan and non-orphan cancer drugs was not statistically significant (bootstrap estimated median difference = −33 days; 95% BCa [−222.12; 508.88]).
At the beginning of the study period (July 2020), funding had already been provided for 10 of the 15 cancer ODs. Subsequently, between 2021 and 2023, five new cancer ODs were initially funded. For this later group (Figure 1C,D), the estimated median time to reimbursement was 988 days (min—351 days; max—1743 days). The median internal delay (from PDL inclusion to the initial NHIF expenditure) was 469 days (min: 2 days; max: 518 days).
3.2. Expenditures of Accessible OD Cancer Drugs and Their Budgetary Impact
The total estimated expenditures for all cancer ODs during the study period (July 2020–September 2023) reached EUR 74,353,493 (Figure 2A). Over time, a consistent upward trend was observed, with a median growth rate of 4.86% per month. The lowest monthly expenditures were recorded in September 2020 at EUR 1,157,494, while the highest peak occurred in August 2023 (EUR 3,655,748). Two significant outliers were observed in the trend line: one in January 2023 with a growth rate of −50.5% and another in February 2021 with a growth rate of +88.8%.
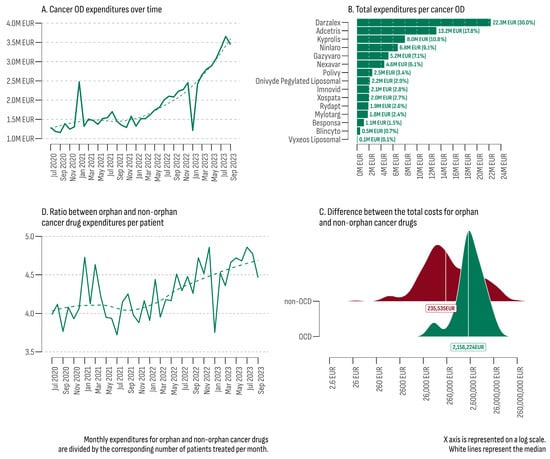
Figure 2.
(A) Total cancer OD expenditures (July 2020–September 2023); (B) total expenditures per cancer OD; (C) difference between the total costs for orphan and non-orphan cancer drugs; (D) ratio between orphan and non-orphan cancer drug expenditures per patient (July 2020–September 2023).
The upward trend in February 2021 was predominantly attributed to increased costs of Nexavar®, indicated for three types of malignancies (hepatocellular carcinoma, renal cell carcinoma, and differentiated thyroid carcinoma). In February 2021, the number of patients treated with Nexavar® increased 7.9 times compared to the previous month (102 vs. 13), resulting in additional expenditures of EUR 256,788. Another contributing factor was the expansion of the regions where cancer ODs were provided (eight in January 2021 vs. fourteen in February 2021).
On the other hand, in January 2023, there was a sharp decrease in the number of patients and the corresponding expenditures for 13 out of the 14 accessible cancer ODs at that moment. The most significant drop was observed for Darzalex® (from EUR 840,812 for 93 patients in December 2022 to EUR 184,763 for 20 patients in January 2023). The only cancer OD that did not experience a decrease was Nexavar® (from EUR 25,666 for nine patients in December 2022 to EUR 308,634 for one hundred and six patients in January 2023). In January 2023, no public costs were recorded for five cancer ODs (Blincyto®, Mylotarg®, Onivyde Pegylated Liposomal®, Polivy®, and Xospata®).
The primary contributor to the overall cancer OD expenditures was Darzalex® (Figure 2B). This product was approved for previously treated or newly diagnosed multiple myeloma. Darzalex® was registered in the PDL on 20 December 2018 and reimbursed every month throughout the study period, comprising 30% of all cancer OD expenditures (EUR 22,299,119). In contrast, Vyxeos Liposomal®, included in the PLD on 14 December 2022, only accounted for 0.1% (EUR 73,100). Moreover, due to a combined internal and external delay, public costs for Vyxeos Liposomal® were identified in only three months (June, August, and September 2023) and were provided in only three out of the forty-six cancer treatment hospitals (two in the city of Sofia and one in the city of Varna).
The collective expenses for all cancer medicines reached EUR 1,313,676,147. Among the 248 cancer drugs covered, 27 (two ODs and twenty-five non-ODs) constituted 80% of the total expenditure. In the non-OD category, Keytruda® emerged as the leader, contributing to 21% of all non-OD expenditures (EUR 259,827,300), followed by Xtandi® (6.7%–EUR 82,695,905) and Opdivo® (EUR 5.3%–65,499,689). The median total cost for the 15 cancer ODs was EUR 2,156,224, while for the remaining 233 non-orphan cancer drugs, it was EUR 235,535 (Figure 2D). The results of the Mann–Whitney U test indicated a significant difference between the two groups (U = 845, p = 0.0008, rank-biserial correlation = −0.52 [−0.70, −0.26]). The Bootstrap simulation revealed that the median total expenditure for the OD group was 9.15 times higher than the non-OD group (4000-fold, 95% BCa 4.871–20.836).
The yearly budgetary impact of cancer ODs (July 2020–September 2023) is outlined in Table 3. A rising trend of 3.53 percentage points was observed in the proportion of cancer ODs within NHIF medical expenditures, escalating from 0.24% in 2020 to 3.77% in 2023. Similarly, the percentage of all cancer drugs rose by 1.96 percentage points, progressing from 4.75% in 2020 to 6.71% in 2023. Notably, between 2021 and 2023, the increase in the proportion of cancer ODs within all cancer medicines expenditures surpassed the increase in NHIF medical expenditures.
Table 3.
Total annual and median monthly cancer OD expenditures (July 2020–September 2023).
The median monthly expenditure (MME) for cancer ODs in the study period was EUR 1,580,744 (min: EUR 1,157,494; max: EUR 3,655,748). In contrast, the estimate for non-orphan cancer drugs was EUR 29,803,136 (min: EUR 24,068,096; max: EUR 47,242,005). A comparison between the two groups incorporating the median monthly number of patients and the median monthly expenditure per patient is presented in Table 3. Overall, the median monthly expenditure per patient in the OD cancer group was EUR 5427 EUR (minimum: EUR 4435; maximum: EUR 7326). In contrast, for non-orphan cancer drugs, the estimate was EUR 1300 (minimum: EUR 1142; maximum: EUR 1534). The ratio between the two indicators was 4.17 (Figure 2D).
3.3. Regional Differences in Access and Expenditures for Cancer ODs
Reimbursement for cancer medicinal treatment was allocated in 16 out of the 28 regions in Bulgaria (57.14%), with cancer ODs being administered in 15 of them (93%), with Sofia Province being the sole exception (Table 4). The capital city, Sofia, recorded the highest overall cancer OD expenditures, amounting to EUR 43,675,774 (58.74% of all cancer OD expenditures), aligning with the highest overall MMPT (176). Additionally, the capital had the highest number of cancer OD hospital providers (n = 16)—2.6 times more than the second-place region (Plovdiv, n = 6). The lowest total cancer OD expenditures were recorded in the regions of Gabrovo (EUR 7164) and Veliko Tarnovo (EUR 35,168). The lowest median monthly expenditures and the median monthly expenditure per patient were observed in Veliko Tarnovo (EUR 1610, min: EUR 1354, max: EUR 3198) where only one hospital provided two cancer ODs (Figure 3A).
Table 4.
Median monthly number of patients treated and median monthly cancer OD expenditures in EUR (July 2020–September 2023).
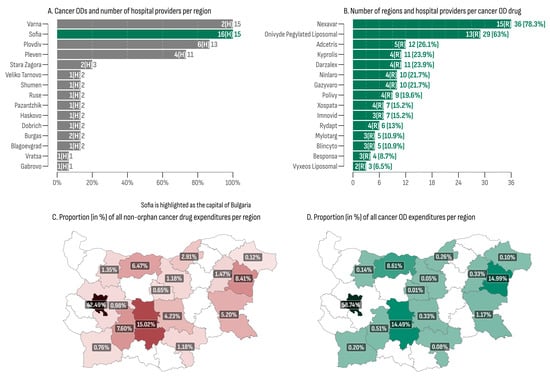
Figure 3.
(A) Cancer ODs and number of hospital providers per region; (B) number of regions and hospital providers per cancer OD drug; (C) proportion (in %) of all non-orphan cancer drug expenditures per region; (D) proportion (in %) of all cancer OD expenditures per region.
At least one cancer OD was administrated in 41 out of the total 46 hospitals included in the database (Figure 3B). Nexavar® emerged as the most widely utilized medicine, being administered in 36 hospitals (78.3%) across 15 regions. This was followed by Onivyde®, which was dispensed in 29 hospitals (63%) spanning 13 regions. Vyxeos Liposomal® and Besponsa® were the least regionally accessible cancer ODs, each one being administered in only three and four hospitals, respectively.
The regional distribution of cancer medicine costs, encompassing both orphan and non-orphan-designated products, is presented in Figure 3C,D. The city of Sofia recorded the highest proportions for cancer medicines expenditures, accounting for 59% in the OD group and 42% in the non-OD group. At the bottom of the list were the regions of Gabrovo, exhibiting a share of 0.01% of all cancer OD expenditures, and Dobrich, with the lowest proportion of non-orphan cancer drug expenditures, at 0.12%. The median ratio between orphan- and non-orphan-designated cancer drug shares was 0.226 (min: 0.015; max: 1.78). Three regions (Pleven, Varna, and the city of Sofia) exhibited a ratio greater than 1, indicating that the OD market shares surpassed the non-orphan ones in these regions.
3.4. Comparative Profile of Market Authorization Holders
The 15 accessible cancer ODs in the Bulgarian market were provided by 12 market authorization holders (MAHs). The leading company in terms of market size was Janssen-Cilag International N.V. (Darzalex®). This is followed by Takeda, whose two cancer ODs, Adcetris® and Ninlaro®, collectively accounted for 26.94% of all cancer OD expenditures. On the contrary, Novartis Pharma AG ranked lowest, with Rydapt® sharing only 0.01% of all cancer OD expenditures. However, other Novartis products (Afinitor®, Kisqali®, Mekinist®, Tafinlar®, Tasigna®, Tyverb®, Piqray®, and Votrient®) contributed notably to the non-orphan cancer drug market (8.54%).
The market share of each MAH for both orphan and non-orphan cancer drug products in Bulgaria is presented in Figure 4. To assess the oncology market profile, the differences between the OD and non-orphan cancer drug expenditure shares were calculated for each company and then standardized using the z-score transformation. Companies with a z-score above 1 were Janssen-Cilag International N.V. (1.75) and Takeda (2.11), indicating a prominent OD profile. Conversely, the company with the lowest z-score was Roche (−1.07), suggesting a preference for a non-orphan market profile.
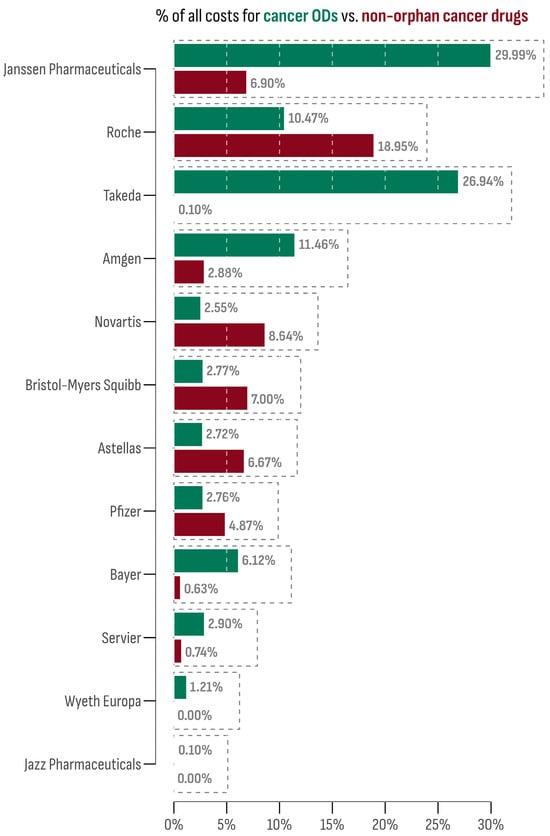
Figure 4.
Market share of each company among orphan and non-orphan cancer drug products.
4. Discussion
One of the main findings of this study emphasizes the restricted access to cancer ODs in Bulgaria. Several obstacles hinder this process. Initially, many drugs fail to provide evidence of a clinical benefit sufficient to meet market authorization criteria. While this can be attributed to the complexity of the cancer disease, it may also be influenced by the clinical trial design [27]. Still, similar clinical outcomes lead to different authorization decisions. The EMA approval probability of anticancer drugs stays lower than the average for all other medicinal products and lags behind the FDA in the USA [58]. Still, the approved cancer ODs in the EU often rely on surrogate endpoint data, such as progression-free survival (PFS) or objective response rates from single-arm or observational studies [59]. This hope-driven approach [60], as found in our study, speeds up the authorization process (24% of median increase rate in the number of cancer ODs) but also transfers the patient delay to the post-authorization phase due to the unaddressed clinical uncertainty [61].
While this first barrier affects all EU member states, the post-authorization delay disproportionately discriminates against economically disadvantaged countries in Eastern and Southeastern Europe [62]. This is evident in the Bulgarian case, where the median time to PDL inclusion for all 15 out of 50 authorized cancer ODs was 760 days. However, it should also be underlined that cancer ODs experience a comparable median delay to innovative but non-orphan-designated cancer medicines (793 days). Similar results regarding the Bulgarian market were revealed in previous periods [63,64]. In contrast, Post et al. demonstrated a significantly shorter median time for the reimbursement of innovative cancer drugs in Germany, France, the UK, the Netherlands, Belgium, Norway, and Switzerland (407 days) [65]. Parallel to our findings, the authors observed that orphan status was not statistically associated with accelerated access.
Many factors contribute to post-authorization delay, including clinical uncertainty, pharmaceutical company strategy, HTA methodology, and economic disparities [66]. In their nature, these factors align rare cancers more closely with other oncological conditions than with rare genetic disorders. Moreover, for many rare cancers, treatment alternatives often overlap with those available for common cancer types [67,68]. However, the OD price tags, often higher than innovative non-orphan products, distinguish significantly rare cancers [44,69]. This is evident in our study, where the median per-product cost for all 15 cancer ODs was EUR 2,156,224, while for the remaining 233 non-orphan cancer drugs, it was EUR 235,535. The high price tag is often considered a hurdle for patient access [62,66,70]. While some decision-makers may be prompted to overlook this issue, the budgetary impact of cancer ODs should also be considered [71,72]. In our study, the budgetary impact estimated as a proportion of all medicinal expenditures of the NHIF remained under 4% for all years in the study period. Regarding the share of cancer OD expenditures in the total cancer treatment expenditures, our results revealed a 41% increase (from 4.75% in 2020 to 6.71% in 2023). This trend is aligned with the findings of a previous study [73], which reported an increase in the share of cancer treatment expenditures in the NHIF budget. The reason for this was explained by the increased trend in oncological morbidity and the inclusion of new expensive drugs in the PDL, paid for with public funds. Still, this share remains lower than expected considering that almost one-quarter of all cancers are rare [6]. This discrepancy, we believe, is attributed to the limited treatment options accessible on the Bulgarian market.
The budgetary impact of rare cancers may be an unreliable indicator. Reimbursement of a new OD cancer treatment is often associated with collateral expenditures, as many cancer ODs are used in combination with other therapies, require previous treatment with other drugs, or require additional diagnostic procedures [74,75]. Thus, while the incremental cost-effectiveness ratio of rare cancer therapies does not differ significantly from that of non-rare cancer therapies, the budgetary impact of cancer ODs should be considered in the context of the entire treatment pathway [76].
The regional differences in access and expenditure for cancer ODs are another important finding of this study. The capital city, Sofia, recorded the highest overall cancer OD expenditures, aligning with the highest overall median monthly per-patient expenditures. This was not a surprising result considering that Sofia is also the most populated region in Bulgaria. However, the difference in the regional distribution of cancer OD vs. non-orphan cancer drug expenditures provides insights regarding the healthcare model for rare cancers. In three regions (Pleven, Varna, and Sofia), expenditures for cancer ODs surpassed those for non-orphan cancer drugs. This finding is indicative of a centralized approach resembling the “peer-to-peer” model, where only a few specialized hospitals handle the treatment of the vast majority of rare cancer patients [21]. Furthermore, the ODs provided in those regions outnumber the remaining regions. This is in line with the results of a recent study by Vancoppenolle et al. [77], in which patient access to specialized hospitals was significantly accelerated. However, several studies contradict the centralized approach, arguing that the “hub and spoke” model is more appropriate. This model assumes that the treatment of rare cancers should be provided in proximity under the supervision of a specialized center. Such an approach may not only reduce the travel burden for patients and their families but also combat the differences in regional survival rates [22,78,79]. However, further research is needed to assess the preferred model in Bulgaria among patients, healthcare professionals, and decision-makers.
An additional challenge faced by already approved and reimbursed cancer ODs involves market shortages and out-of-pocket payments. While this study does not delve into the latter aspect, it is worth noting that market shortages, though more common for generic non-orphan cancer drugs, can also affect rare cancer patients. In January 2023, our study found no public costs associated with five cancer ODs. A reduction in expenses was also observed for several non-orphan cancer drugs. While the precise reasons for this occurrence are unclear, two potential factors should be highlighted. First, supply shortages have been identified as a significant barrier, particularly in certain Eastern European countries [80,81]. However, political factors, leading to delays in NHIF budget approval, may also play a role.
Market competition is regarded as the primary driver for price reduction and innovation in oncology [82]. Our study also provides data on the competitive landscape in the oncology market in Bulgaria. For all 15 cancer ODs, 12 MAHs were identified, with Janssen-Cilag International N.V. leading in terms of market size. However, only two companies have been identified as the primary contributors to the cancer OD market: Janssen-Cilag International N.V. (Darzalex®) and Takeda (Adcetris® and Ninlaro®). The market profile of the other five preferred the non-orphan cancer drug market. Two companies (Wyeth Europa and Jazz Pharmaceuticals) were MAHs for cancer ODs only.
Our research indicates that the Bulgarian market for cancer ODs shares similarities with other innovative but non-orphan cancer medications. Access to all cancer drugs follows a similar regulatory pattern and challenges [83], resulting in comparable post-authorization delays. However, cancer ODs carry a significantly higher price, mostly attributed to the non-targeted oncological therapies and conventional chemotherapy included in the non-orphan category [84,85].
Similar to Bulgaria, innovative cancer drugs in neighboring Balkan countries are associated with a substantial increase in public expenditures [86,87,88]. Recent research also suggests that orphan status alone does not significantly predict the time to access. Factors such as health expenditure per capita, GDP, Mackenbach score of health policy performance, ESMO magnitude of clinical benefit scale scores, and market prices of medicines have a significantly higher impact on reimbursement delays [88,89].
Both orphan and non-orphan cancer drugs are associated with a high level of clinical uncertainty, which is often a problem in reimbursement decision-making [90]. The effectiveness of EU regulatory policies, such as conditional marketing authorization or adaptive pathways, often remains uncertain. Prolonged regulatory review processes could largely counteract the modest and non-significant positive impact of these incentives on clinical development timelines [90]. On the other hand, however, evidence also suggests that oncology drugs may unduly expand the early access tools designed for rare diseases, leading to a call for more stringent regulation of drugs with multiple indications [91]. All these factors cluster the cancer ODs more closely to the non-rare innovative cancer market than to the general OD market.
Our research also highlights a significant disparity between market authorization trends in the EU and access trends in Bulgaria, which has widened significantly over the study period. The current regulatory framework in Bulgaria lacks two critical legal mechanisms that could potentially help mitigate this gap.
First, the absence of a specific regulatory framework for patient engagement in the HTA process may result in suboptimal decisions regarding the coverage and reimbursement of orphan cancer medicines [92]. Patient engagement in HTA is vital for ensuring that the perspective of affected individuals and their caregivers is considered in the decision-making process. This factor has long been acknowledged as a powerful tool for the successful implementation of HTA policies [93].
Second, Bulgarian HTA legislation does not offer specific guidance for the assessment, appraisal, and reimbursement of testing practices, prognostic markers, and other components of personalized oncology medicine. Public funding often does not cover the companion diagnostic tests required for the administration of many orphan cancer drugs [94,95]. This barrier could impede the price negotiation process and contribute to access delays for both orphan and non-orphan cancer medicines [95].
5. Limitations
There are several important limitations that need to be considered when discussing the results of this study. First, the data collection process was organized by focusing on medicinal costs covered by the public funder, NHIF. Consequently, the study does not offer insights into out-of-pocket payments or the private insurance market in Bulgaria. Additionally, other treatment-related expenses, such as diagnostic procedures, surgery, or radiotherapy, were not considered. It is important to acknowledge that, while the study distinguishes between orphan and non-orphan cancer drugs, rare cancer patients may often receive off-label targeted treatment overlapping with non-orphan cancer drugs, standard chemotherapy, or palliative care. Indirect expenditures, such as travel costs and formal and non-formal care, were also not included. Thus, the estimated expenditures for cancer ODs should not be interpreted as the total costs of rare cancer treatment.
Second, this study’s timeframe was limited, potentially not allowing for a comprehensive understanding of the complete market dynamics. Furthermore, external political and market factors during the study period may also have influenced the results. Additionally, concerns about data quality arise as the NHIF database was designed for administrative purposes. Thus, applying it for research purposes required several data-processing steps. While the data were reviewed for consistency and integrity, data entry validation was not under the control of the authors.
Third, the dataset provided as an addition to this study includes the number of patients treated monthly at the hospital level. However, the data do not include information on the patient’s dynamics or patient identifiers. As a result, the incidence of rare cancers and clinical outcomes cannot be extrapolated.
Fourth, the estimated external delay was calculated based on the date of EMA market authorization and the date of inclusion in the PDL. However, two main factors that contribute to the external delay were not analyzed in this study. The first factor is the time interval between the EMA market authorization and the submission of the reimbursement dossier to the NCPRMP. This period is often prolonged due to the need for additional evidence or product funding approval in other EU countries. The second factor is the time interval between the submission of the reimbursement dossier to the NCPRMP and the inclusion of the product in the PDL. That period can be prolonged due to the administrative burden, the need for additional evidence, or the need for price negotiations.
Lastly, the study did not account for potential variations or administrative barriers in clinical practices across different healthcare providers and regions, which might impact the generalizability of the findings.
6. Conclusions
The findings of this study highlight the Bulgarian cancer OD market’s distinctive features, encompassing a limited number of accessible products and significant delays in access. Moreover, the research identifies substantial regional variations in both access and expenditures. The implications of these study outcomes extend beyond academic insights, offering valuable insights that can guide rare cancer policy development.
Author Contributions
Conceptualization, G.I. and R.S.; methodology, K.K.; software, K.K.; validation, G.I., N.M. and Y.M.; formal analysis, N.M.; investigation, K.K.; resources, K.K. and I.P.-S.; data curation, Y.M.; writing—original draft preparation, K.K.; writing—review and editing, G.I. and N.M.; visualization, K.K.; supervision, R.S. and N.M.; project administration, Y.M., N.M. and G.I.; funding acquisition, I.P.-S. All authors have read and agreed to the published version of the manuscript.
Funding
This research received no external funding.
Institutional Review Board Statement
Not applicable.
Informed Consent Statement
Not applicable.
Data Availability Statement
The complete data repository for this study is available on GitHub https://github.com/kostadinoff/Availability-and-access-to-orphan-drugs-for-rare-cancers-in-Bulgaria (created on 13 March 2024).
Conflicts of Interest
The authors declare no conflicts of interest.
References
- JARC—Joint Action on Rare Cancers Rare Cancer Agenda—2030. Rare Cancers Europe 2022. Available online: https://www.esmo.org/policy/rare-cancers-working-group/rare-cancers-in-europe/rare-cancer-agenda-2030 (accessed on 3 January 2024).
- European Society for Medical Oncology—ESMO. Available online: https://www.esmo.org/ (accessed on 3 January 2024).
- de la Paz, M.P.; Taruscio, D.; Groft, S.C. (Eds.) Rare Diseases Epidemiology: Update and Overview|SpringerLink; Advances in Experimental Medicine and Biology 686; Springer: Dordrecht, The Netherlands, 2010; ISBN 978-3-319-67144-4. Available online: https://link.springer.com/book/10.1007/978-3-319-67144-4 (accessed on 3 January 2024).
- Law of 10 November 2021/No. 175. Provisions for the Treatment of Rare Diseases and the Support of Research and Production of Orphan Drugs. (21G00189) [LEGGE 10 November 2021/n. 175. Disposizioni Per la Cura Delle Malattie Rare e Per il Sostegno Della Ricerca e Della Produzione Dei Farmaci Orfani. (21G00189)] 2021. Available online: https://www.gazzettaufficiale.it/eli/gu/2021/11/27/283/sg/pdf (accessed on 3 January 2024).
- Commission Staff Working Document EU Missions Two Years on: An Assessment of Progress in Shaping the Future We Want and Reporting on the Review of Mission Areas and Areas for Institutionalised Partnerships Based on Articles 185 and 187 TFEU Accompanying the Document Communication From the Commission to the European Parliament, the Council, the European Economic and Social Committee and the Committee of the Regions EU Missions Two Years on: Assessment of Progress and Way Forward 2023. Available online: https://eur-lex.europa.eu/legal-content/EN/ALL/?uri=CELEX:52023SC0260 (accessed on 3 January 2024).
- Gatta, G.; Capocaccia, R.; Botta, L.; Mallone, S.; De Angelis, R.; Ardanaz, E.; Comber, H.; Dimitrova, N.; Leinonen, M.K.; Siesling, S.; et al. Burden and centralised treatment in Europe of rare tumours: Results of RARECAREnet—A population-based study. Lancet Oncol. 2017, 18, 1022–1039. [Google Scholar] [CrossRef] [PubMed]
- Gatta, G.; van der Zwan, J.M.; Casali, P.G.; Siesling, S.; Dei Tos, A.P.; Kunkler, I.; Otter, R.; Licitra, L.; Mallone, S.; Tavilla, A.; et al. Rare cancers are not so rare: The rare cancer burden in europe. Eur. J. Cancer 2011, 47, 2493–2511. [Google Scholar] [CrossRef] [PubMed]
- Iskrov, G.; Stefanov, R. Rare tumors—Epidemiological and public health aspects. Rare Dis. Orphan Drugs J. 2018, 9, 9–13. (In Bulgarian) [Google Scholar] [CrossRef]
- Van Dongen, J.; de Heus, E.; Eickholt, L.; Schrieks, M.; Zantingh, I.; Brouwer, O.R.; Oonk, M.H.M.; Grotenhuis, B.A.; Ezendam, N.P.M.; Duijts, S.F.A. Challenges and controversies patients and (health care) professionals experience in managing vaginal, vulvar, penile or anal cancer: The SILENCE study. Eur. J. Cancer Care 2022, 31, e13676. [Google Scholar] [CrossRef] [PubMed]
- Gonzato, O. Could information improve patient access to new emerging drugs in rare cancer trials? J. Cancer Policy 2016, 8, 38–41. [Google Scholar] [CrossRef]
- Heus, E.; Zwan, J.M.; Husson, O.; Frissen, A.; Herpen, C.M.L.; Merkx, M.A.W.; Duijts, S.F.A. Unmet supportive care needs of patients with rare cancer: A systematic review. Eur. J. Cancer Care 2021, 30, e13502. [Google Scholar] [CrossRef]
- Miller, R.C. Problems in rare tumor study: A call for papers. Rare Tumors 2010, 2, 46–47. [Google Scholar] [CrossRef]
- Prades, J.; Weinman, A.; Le Cam, Y.; Trama, A.; Frezza, A.M.; Borras, J.M. Priorities on rare cancers? Policy in national cancer control plans (NCCPs): A review conducted within the framework of EU-JARC joint-action. J. Cancer Policy 2020, 24, 100222. [Google Scholar] [CrossRef]
- Drabbe, C.; Grünhagen, D.J.; Van Houdt, W.J.; Braam, P.M.; Soomers, V.L.M.N.; Van der Hage, J.A.; De Haan, J.J.; Keymeulen, K.B.M.I.; Husson, O.; Van der Graaf, W.T.A. Diagnosed with a rare cancer: Experiences of adult sarcoma survivors with the healthcare system—Results from the SURVSARC study. Cancers 2021, 13, 679. [Google Scholar] [CrossRef]
- Pierotti, M.A.; Negri, T.; Tamborini, E.; Perrone, F.; Pricl, S.; Pilotti, S. Targeted therapies: The rare cancer paradigm. Mol. Oncol. 2009, 4, 19–37. [Google Scholar] [CrossRef]
- Pillai, R.; Jayasree, K. Rare cancers: Challenges and issues. Indian J. Med. Res. 2017, 145, 17. [Google Scholar] [CrossRef] [PubMed]
- Ray-Coquard, I.; Lauraine, E.P.; Cesne, A.L.; Pautier, P.; Lavenue, M.C.V.; Trama, A.; Casali, P.; Coindre, J.M.; Blay, J.Y. Improving treatment results with reference centres for rare cancers: Where do we stand? Eur. J. Cancer 2017, 77, 90–98. [Google Scholar] [CrossRef] [PubMed]
- De Heus, E.; Engelen, V.; Dingemans, I.; Richel, C.; Schrieks, M.; van der Zwan, J.M.; Besselink, M.G.; van Berge Henegouwen, M.I.; van Herpen, C.M.L.; Duijts, S.F.A. Differences in health care experiences between rare cancer and common cancer patients: Results from a national cross-sectional survey. Orphanet J. Rare Dis. 2021, 16, 249. [Google Scholar] [CrossRef] [PubMed]
- Rodrigues, R.; Trigg, L.; Schmidt, A.E.; Leichsenring, K. The public gets what the public wants: Experiences of public reporting in long-term care in europe. Health Policy 2014, 116, 84–94. [Google Scholar] [CrossRef]
- EU Health Union: Europe’s Beating Cancer Plan 2021. Available online: https://ec.europa.eu/commission/presscorner/detail/en/fs_20_341 (accessed on 3 January 2024).
- Blay, J.-Y.; Casali, P.; Bouvier, C.; Dehais, C.; Galloway, I.; Gietema, J.; Halámková, J.; Hindi, N.; Idbaih, A.; Kinloch, E.; et al. European reference network for rare adult solid cancers, statement, and integration to health care systems of member states: A position paper of the ERN EURACAN. ESMO Open 2021, 6, 100174. [Google Scholar] [CrossRef] [PubMed]
- Frezza, A.M.; Trama, A.; Blay, J.-Y.; Casali, P.G. Networking in rare cancers: What was done, what is next? Eur. J. Surg. Oncol. 2019, 45, 16–18. [Google Scholar] [CrossRef]
- Prades, J.; Trama, A.; Casali, P.G.; Emile, J.-F.; Gaspar, N.; Janavicius, R.; Jančiauskienė, R.; Karjalainen, S.; Kopeckova, K.; Pylkkänen, L.; et al. Is rare cancer care organized at national health system level? Multiple case study in six EU countries. Eur. J. Public Health 2022, 32, 852–857. [Google Scholar] [CrossRef]
- Regulation (EC) No 141/2000 of the European Parliament and of the Council of 16 December 1999 on Orphan Medicinal Products. Off. J. Eur. Communities 2000, 18, 15. Available online: https://eur-lex.europa.eu/legal-content/EN/TXT/PDF/?uri=CELEX:32000R0141 (accessed on 3 January 2024).
- Commission delegated decision of 10 March 2014 setting out criteria and conditions that European Reference Networks and healthcare providers wishing to join a European Reference Network must fulfil. Off. J. Eur. Union 2014, 17, 71–78. Available online: https://eur-lex.europa.eu/legal-content/EN/TXT/PDF/?uri=CELEX:32014D0286 (accessed on 3 January 2024).
- Blay, J.-Y.; Fenaux, P.; Ladenstein, R.; Hoogerbrugge, N. Continue rare cancers collaboration with european reference networks after brexit. Lancet 2021, 397, 793. [Google Scholar] [CrossRef]
- Tan, S.-B.; Dear, K.B.G.; Bruzzi, P.; Machin, D. Strategy for randomised clinical trials in rare cancers. BMJ Br. Med. J. 2003, 327, 47–49. [Google Scholar] [CrossRef] [PubMed][Green Version]
- Baker, L.H.; Crowley, J.J.; Maki, R.G. Randomization and statistical power: Paramount in trial reproducibility (even for rare cancers). Oncologist 2012, 17, 1129–1132. [Google Scholar] [CrossRef] [PubMed]
- Gronchi, A.; Haas, R.L.; Bonvalot, S. Cancer registries and randomised clinical trials in rare tumours: At the two extremes of daily clinical practice. Eur. J. Cancer 2016, 64, 113–115. [Google Scholar] [CrossRef] [PubMed]
- Schuller, Y.; Biegstraaten, M.; Hollak, C.E.M.; Klümpen, H.-J.; Gispen-de Wied, C.C.; Stoyanova-Beninska, V. Oncologic orphan drugs approved in the EU—Do clinical trial data correspond with real-world effectiveness? Orphanet J. Rare Dis. 2018, 13, 214. [Google Scholar] [CrossRef]
- Korchagina, D.; Jaroslawski, S.; Jadot, G.; Toumi, M. Orphan drugs in oncology. In Regulatory and Economic Aspects in Oncology; Recent Results in Cancer Research; Springer: Cham, Switzerland, 2018; pp. 109–142. [Google Scholar] [CrossRef]
- Schey, C.; Milanova, T.; Hutchings, A. Estimating the budget impact of orphan medicines in europe: 2010–2020. Orphanet J. Rare Dis. 2011, 6, 62. [Google Scholar] [CrossRef] [PubMed]
- Kirk, R. Genetics: New classification for endometrial cancer puts genes in POLE position. Nat. Rev. Clin. Oncol. 2013, 10, 304. [Google Scholar] [CrossRef] [PubMed]
- Eliyatkın, N.; Yalçın, E.; Zengel, B.; Aktaş, S.; Vardar, E. Molecular classification of breast carcinoma: From traditional, old-fashioned way to a new age, and a new way. J. Breast Health 2015, 11, 59–66. [Google Scholar] [CrossRef]
- Loughnot, D. Potential interactions of the orphan drug act and pharmacogenomics: A flood of orphan drugs and abuses? Am. J. Law Med. 2005, 31, 365–380. [Google Scholar] [CrossRef][Green Version]
- Côté, A.; Keating, B. What is wrong with orphan drug policies? Value Health 2012, 15, 1185–1191. [Google Scholar] [CrossRef]
- Simoens, S. Pricing and reimbursement of orphan drugs: The need for more transparency. Orphanet J. Rare Dis. 2011, 6, 42. [Google Scholar] [CrossRef]
- Vokinger, K.N.; Daniore, P.; Kesselheim, A.S. 1586MO pivotal trial endpoints of drugs for rare and non-rare cancers in the US and europe. Ann. Oncol. 2020, 31, S1197. [Google Scholar] [CrossRef]
- Nagase, F.N.I.; Stafinski, T.; Sun, J.; Jhangri, G.; Menon, D. Factors associated with positive and negative recommendations for cancer and non-cancer drugs for rare diseases in canada. Orphanet J. Rare Dis. 2019, 14, 127. [Google Scholar] [CrossRef] [PubMed]
- Pauwels, K.; Huys, I.; Casteels, M.; Larsson, K.; Voltz, C.; Penttila, K.; Morel, T.; Simoens, S. Are products with an orphan designation for oncology indications different from products for other rare indications? A retrospective analysis of european orphan designations granted between 2002–2012. Orphanet J. Rare Dis. 2017, 12, 36. [Google Scholar] [CrossRef] [PubMed]
- Fermaglich, L.J.; Miller, K.L. A comprehensive study of the rare diseases and conditions targeted by orphan drug designations and approvals over the forty years of the orphan drug act. Orphanet J. Rare Dis. 2023, 18, 163. [Google Scholar] [CrossRef] [PubMed]
- Martin, N.; Doulet, N.; Hivert, V.; Aymé, S. Rare diseases research in europe: An overview based on data from the orphanet database. Orphanet J. Rare Dis. 2010, 5, P5. [Google Scholar] [CrossRef][Green Version]
- Barrenho, E.; Halmai, R.; Miraldo, M.; Tzintzun, I.; Raïs Ali, S.; Toulemon, L.; Dupont, J.-C.K.; Rochaix, L. Inequities in cancer drug development in terms of unmet medical need. Soc. Sci. Med. 2022, 302, 114953. [Google Scholar] [CrossRef] [PubMed]
- Korchagina, D.; Millier, A.; Vataire, A.-L.; Aballea, S.; Falissard, B.; Toumi, M. Determinants of orphan drugs prices in France: A regression analysis. Orphanet J. Rare Dis. 2017, 12, 75. [Google Scholar] [CrossRef] [PubMed]
- Bouslouk, M. G-BA benefit assessment of new orphan drugs in Germany: The first five years. Expert Opin. Orphan Drugs 2016, 4, 453–455. [Google Scholar] [CrossRef]
- Adkins, E.; Nicholson, L.; Floyd, D.; Ratcliffe, M.; Chevrou-Severac, H. Oncology drugs for orphan indications: How are HTA processes evolving for this specific drug category? Clin. Outcomes Res. 2017, 9, 327–342. [Google Scholar] [CrossRef]
- Nicod, E.; Kanavos, P. Commonalities and differences in HTA outcomes: A comparative analysis of five countries and implications for coverage decisions. Health Policy 2012, 108, 167–177. [Google Scholar] [CrossRef]
- Medicinal Products in Human Medicine Act. State Gazette 2007. Available online: https://www.bda.bg/images/stories/documents/legal_acts/20210208_ZLPHM_English.pdf (accessed on 3 January 2024).
- Ministry of Health. Ordinance on the Terms, Rules and Procedure for Regulation and Registration of Prices for Medicinal Products 2013. Available online: https://www.ncpr.bg/images/REGULATIONS/2017/20.02.2017/Naredba_tseni_NCPR_24.01.2017-eng.pdf (accessed on 3 January 2024).
- Regulation (EU) 2021/2282 of the European Parliament and of the Council of 15 December 2021 on health technology assessment and amending Directive 2011/24/EU. Off. J. Eur. Union 2021, 458, 1–32. Available online: https://eur-lex.europa.eu/legal-content/EN/TXT/?uri=CELEX:32021R2282 (accessed on 3 January 2024).
- Health Insurance Act. State Gazette, No. 16/23.02.2024. 1998. Available online: https://www.minfin.bg/upload/36670/Health_Insurance_Act.pdf (accessed on 3 January 2024).
- Council of Ministers. Decision No. 3/04.01.2023 on the Adoption of the National Cancer Control Plan in the Republic of Bulgaria 2027. State Gazette; 2022. Available online: https://www.mh.government.bg/media/filer_public/2022/07/08/bg_national_cancer_plan_2030_-_site.pdf (accessed on 3 January 2024).
- Wepner, B.; Giesecke, S. Drivers, trends and scenarios for the future of health in Europe. Impressions from the FRESHER project. Eur. J. Futures Res. 2018, 6, 2. [Google Scholar] [CrossRef]
- Iskrov, G.; Miteva-Katrandzhieva, T.; Stefanov, R. Challenges to orphan drugs access in eastern europe: The case of Bulgaria. Health Policy 2012, 108, 10–18. [Google Scholar] [CrossRef]
- R Core Team. R: A Language and Environment for Statistical Computing; R Foundation for Statistical Computing: Vienna, Austria, 2021; Available online: https://www.r-project.org/ (accessed on 3 January 2024).
- Wickham, H.; Averick, M.; Bryan, J.; Chang, W.; McGowan, L.D.; François, R.; Grolemund, G.; Hayes, A.; Henry, L.; Hester, J.; et al. Welcome to the tidyverse. J. Open Source Softw. 2019, 4, 1686. [Google Scholar] [CrossRef]
- Wickham, H. ggplot2: Elegant Graphics for Data Analysis; Springer: New York, NY, USA, 2016; ISBN 978-3-319-24277-4. [Google Scholar]
- Hartmann, M.; Mayer-Nicolai, C.; Pfaff, O. Approval probabilities and regulatory review patterns for anticancer drugs in the european union. Crit. Rev. Oncol./Hematol. 2013, 87, 112–121. [Google Scholar] [CrossRef] [PubMed]
- Salcher-Konrad, M.; Naci, H.; Davis, C. Approval of cancer drugs with uncertain therapeutic value: A comparison of regulatory decisions in europe and the United States. Milbank Q. 2020, 98, 1219–1256. [Google Scholar] [CrossRef] [PubMed]
- Sandman, L.; Liliemark, J. From evidence-based to hope-based medicine? Ethical aspects on conditional market authorization of and early access to new cancer drugs. Semin. Cancer Biol. 2017, 45, 58–63. [Google Scholar] [CrossRef]
- Grössmann, N.; Robausch, M.; Rosian, K.; Wild, C.; Simon, J. Monitoring evidence on overall survival benefits of anticancer drugs approved by the european medicines agency between 2009 and 2015. Eur. J. Cancer 2019, 110, 1–7. [Google Scholar] [CrossRef]
- Wilking, N.; Bucsics, A.; Kandolf Sekulovic, L.; Kobelt, G.; Laslop, A.; Makaroff, L.; Roediger, A.; Zielinski, C. Achieving equal and timely access to innovative anticancer drugs in the european union (EU): Summary of a multidisciplinary CECOG-driven roundtable discussion with a focus on eastern and south-eastern EU countries. ESMO Open 2019, 4, e000550. [Google Scholar] [CrossRef]
- Raycheva, R.; Kostadinov, K. HTA69 delay of innovative oncology treatments—Case from Bulgaria. Value Health 2022, 25, S309–S310. [Google Scholar] [CrossRef]
- Raycheva, R.; Kostadinov, K. HTA7 the price of innovation—Oncology treatments expenditures: Case from Bulgaria. Value Health 2023, 26, S260. [Google Scholar] [CrossRef]
- Post, H.C.; Schutte, T.; van Oijen, M.G.H.; van Laarhoven, H.W.M.; Hollak, C.E.M. Time to reimbursement of novel anticancer drugs in europe: A case study of seven european countries. ESMO Open 2023, 8, 101208. [Google Scholar] [CrossRef] [PubMed]
- Schoot, R.A.; Otth, M.A.; Frederix, G.W.J.; Leufkens, H.G.M.; Vassal, G. Market access to new anticancer medicines for children and adolescents with cancer in europe. Eur. J. Cancer 2022, 165, 146–153. [Google Scholar] [CrossRef] [PubMed]
- Kim, S.T.; Klempner, S.J.; Park, S.H.; Park, J.O.; Park, Y.S.; Lim, H.Y.; Kang, W.K.; Kim, K.-M.; Lee, J. Correlating programmed death ligand 1 (PD-L1) expression, mismatch repair deficiency, and outcomes across tumor types: Implications for immunotherapy. Oncotarget 2017, 8, 77415–77423. [Google Scholar] [CrossRef] [PubMed]
- Skorupan, N.; Ghabra, S.; Maldonado, J.A.; Zhang, Y.; Alewine, C. Two rare cancers of the exocrine pancreas: To treat or not to treat like ductal adenocarcinoma? J. Cancer Metastasis Treat. 2023, 9, 5. [Google Scholar] [CrossRef] [PubMed]
- Mincarone, P.; Leo, C.G.; Sabina, S.; Sarriá-Santamera, A.; Taruscio, D.; Serrano-Aguilar, P.G.; Kanavos, P. Reimbursed price of orphan drugs: Current strategies and potential improvements. Public Health Genom. 2017, 20, 1–8. [Google Scholar] [CrossRef] [PubMed]
- Czech, M.; Baran-Kooiker, A.; Atikeler, K.; Demirtshyan, M.; Gaitova, K.; Holownia-Voloskova, M.; Turcu-Stiolica, A.; Kooiker, C.; Piniazhko, O.; Konstandyan, N.; et al. A review of rare disease policies and orphan drug reimbursement systems in 12 Eurasian countries. Front. Public Health 2020, 7, 416. [Google Scholar] [CrossRef] [PubMed]
- Rachev, B.; Uyei, J.; Singh, R.; Kowal, S.; Johnson, C.E. Stakeholder point of view on prescription drug affordability—A systematic literature review and content analysis. Health Policy 2021, 125, 1158–1165. [Google Scholar] [CrossRef]
- Graf von der Schulenburg, J.-M.; Pauer, F. Rare cancers—Rarity as a cost and value argument. J. Cancer Policy 2017, 11, 54–59. [Google Scholar] [CrossRef]
- Zlatareva, A.; Petrova, G. National health insurance fund cost analysis for rare cancer diseases and orphan drugs. Gen. Med. 2015, 17, 13–18. [Google Scholar]
- Barron, A.; Wilsdon, T. Challenging perceptions about oncology product pricing in breast and colorectal cancer. Pharm. Med. 2016, 30, 321–326. [Google Scholar] [CrossRef] [PubMed]
- Latimer, N.R.; Pollard, D.; Towse, A.; Henshall, C.; Sansom, L.; Ward, R.L.; Bruce, A.; Deakin, C. Challenges in valuing and paying for combination regimens in oncology: Reporting the perspectives of a multi-stakeholder, international workshop. BMC Health Serv. Res. 2021, 21, 412. [Google Scholar] [CrossRef] [PubMed]
- Jayasundara, K.; Krahn, M.; Mamdani, M.; Hoch, J.S.; Grootendorst, P. Differences in incremental cost-effectiveness ratios for common versus rare conditions: A case from oncology. PharmacoEconomics-Open 2017, 1, 167–173. [Google Scholar] [CrossRef] [PubMed]
- Vancoppenolle, J.M.; Franzen, N.; Koole, S.N.; Retèl, V.P.; van Harten, W.H. Differences in time to patient access to innovative cancer medicines in six european countries. Int. J. Cancer 2023, 154, 886–894. [Google Scholar] [CrossRef] [PubMed]
- Jain, R.; Menzin, J.; Lachance, K.; McBee, P.; Phatak, H.; Nghiem, P.T. Travel burden associated with rare cancers: The example of merkel cell carcinoma. Cancer Med. 2019, 8, 2580–2586. [Google Scholar] [CrossRef] [PubMed]
- Onega, T.; Alford-Teaster, J.; Leggett, C.; Loehrer, A.; Weiss, J.E.; Moen, E.L.; Pollack, C.C.; Wang, F. The interaction of rurality and rare cancers for travel time to cancer care. J. Rural Health 2022, 39, 426–433. [Google Scholar] [CrossRef]
- Mixich, V.; Voinea, S.A.; Mardale, S. PDG61 Cancer drugs shortages in Romania: Magnitude, causes and solutions. Value Health 2019, 22, S607. [Google Scholar] [CrossRef]
- Cherny, N.; Sullivan, R.; Torode, J.; Saar, M.; Eniu, A. ESMO european consortium study on the availability, out-of-pocket costs and accessibility of antineoplastic medicines in europe. Ann. Oncol. 2016, 27, 1423–1443. [Google Scholar] [CrossRef] [PubMed]
- Gavel, S.J. The oncology pipeline: Maturing, competitive, and growing. Oncol. Bus. Rev. 2008, 14–16. [Google Scholar]
- Karanyotova, S.; Topova, B.; Petrova, E.; Doychev, P.; Kapitanska, E.; Petrova, G.; Mitkova, Z.; Dimitrova, M. Treatment patterns, adherence to international guidelines, and financial mechanisms of the market access of advanced breast cancer therapy in Bulgaria. Front. Public Health 2023, 11, 1073733. [Google Scholar] [CrossRef]
- Mitkova, Z.; Doneva, M.; Gerasimov, N.; Tachkov, K.; Dimitrova, M.; Kamusheva, M.; Petrova, G. Analysis of Healthcare Expenditures in Bulgaria. Healthcare 2022, 10, 274. [Google Scholar] [CrossRef] [PubMed]
- Lebanova, H.; Stoev, S.; Naseva, E.; Getova, V.; Wang, W.; Sabale, U.; Petrova, E. Economic burden of cervical cancer in bulgaria. Int. J. Environ. Res. Public Health 2023, 20, 2746. [Google Scholar] [CrossRef] [PubMed]
- Vekic, B.; Dragojevic-Simic, V.; Jakovljevic, M.; Pilipovic, F.; Simic, R.; Zivic, R.; Radovanovic, D.; Rancic, N. Medical cost of colorectal cancer services in serbia between 2014 and 2017: National data report. Front. Pharmacol. 2019, 10, 526. [Google Scholar] [CrossRef] [PubMed]
- Tomić, Z.; Tomas, A.; Benšova, Z.; Tomić, L.; Horvat, O.; Varga, I.; Paut Kusturica, M.; Sabo, A. Challenges of providing access to cutting-edge cancer medicines in the countries of Eastern Europe. Front. Public Health 2018, 6, 193. [Google Scholar] [CrossRef] [PubMed]
- Pejcic, A.V.; Iskrov, G.; Jakovljevic, M.M.; Stefanov, R. Access to orphan drugs—Comparison across Balkan countries. Health Policy 2018, 122, 583–589. [Google Scholar] [CrossRef]
- Kandolf Sekulovic, L.; Guo, J.; Agarwala, S.; Hauschild, A.; McArthur, G.; Cinat, G.; Wainstein, A.; Caglevic, C.; Lorigan, P.; Gogas, H.; et al. Access to innovative medicines for metastatic melanoma worldwide: Melanoma World Society and European Association of Dermato-oncology survey in 34 countries. Eur. J. Cancer 2018, 104, 201–209. [Google Scholar] [CrossRef]
- Martinalbo, J.; Bowen, D.; Camarero, J.; Chapelin, M.; Démolis, P.; Foggi, P.; Jonsson, B.; Llinares, J.; Moreau, A.; O’Connor, D.; et al. Early market access of cancer drugs in the EU. Ann. Oncol. 2016, 27, 96–105. [Google Scholar] [CrossRef]
- Horgan, D.; Koeva-Balabanova, J.; Capoluongo, E.; Jagielska, B.; Cattaneo, I.; Kozaric, M.; Tumiene, B.; El Ahl, J.-P.; Lal, J.A.; Kalra, D.; et al. Making sure that orphan incentives tip the right way in Europe. Healthcare 2022, 10, 1600. [Google Scholar] [CrossRef] [PubMed]
- Dimitrova, M.; Jakab, I.; Mitkova, Z.; Kamusheva, M.; Tachkov, K.; Nemeth, B.; Zemplenyi, A.; Dawoud, D.; Delnoij, D.M.J.; Houýez, F.; et al. Potential barriers of patient involvement in health technology assessment in central and eastern european countries. Front. Public Health 2022, 10, 922708. [Google Scholar] [CrossRef]
- Jakab, I.; Dimitrova, M.; Houÿez, F.; Bereczky, T.; Fövényes, M.; Maravic, Z.; Belina, I.; Andriciuc, C.; Tóth, K.; Piniazhko, O.; et al. Recommendations for patient involvement in health technology assessment in central and Eastern European countries. Front. Public Health 2023, 11, 1176200. [Google Scholar] [CrossRef]
- Husereau, D.; Bombard, Y.; Stockley, T.; Carter, M.; Davey, S.; Lemaire, D.; Nohr, E.; Park, P.; Spatz, A.; Williams, C.; et al. Future role of health technology assessment for genomic medicine in oncology: A Canadian laboratory perspective. Curr. Oncol. 2023, 30, 9660–9669. [Google Scholar] [CrossRef] [PubMed]
- Normanno, N.; Apostolidis, K.; Wolf, A.; Al Dieri, R.; Deans, Z.; Fairley, J.; Maas, J.; Martinez, A.; Moch, H.; Nielsen, S.; et al. Access and quality of biomarker testing for precision oncology in europe. Eur. J. Cancer 2022, 176, 70–77. [Google Scholar] [CrossRef] [PubMed]


Disclaimer/Publisher’s Note: The statements, opinions and data contained in all publications are solely those of the individual author(s) and contributor(s) and not of MDPI and/or the editor(s). MDPI and/or the editor(s) disclaim responsibility for any injury to people or property resulting from any ideas, methods, instructions or products referred to in the content. |
© 2024 by the authors. Licensee MDPI, Basel, Switzerland. This article is an open access article distributed under the terms and conditions of the Creative Commons Attribution (CC BY) license (https://creativecommons.org/licenses/by/4.0/).