Simple Summary
This study explored how body weight (measured by BMI) affects survival, quality of life, and daily activities in older adults with bladder cancer. We analyzed data from over 8000 patients aged 65 and older and found that people with higher BMI (overweight or obese) tended to live longer after bladder cancer diagnosis than those with a normal or underweight BMI. Overweight patients also reported the best overall physical and mental well-being. However, severe obesity came with downsides—these individuals had the most difficulty performing daily tasks like bathing and dressing. Meanwhile, underweight patients also struggled with daily activities. The findings suggest that while extra weight may improve survival and, to some extent, quality of life, extreme obesity can reduce a person’s ability to stay independent. This study highlights the complex relationship between body weight, survival, and well-being in older adults with bladder cancer.
Abstract
Background: The relationship between body composition and bladder cancer outcomes is complex. While a higher body mass index (BMI) has been associated with an increased risk of bladder cancer development, its impact on survival outcomes is less clear. This study aimed to explore the association between BMI, survival, health-related quality of life, and the performance of ADLs in a cohort of older patients with bladder cancer. Methods: Data were obtained from the Surveillance, Epidemiology, and End Results-Medicare Health Outcomes Survey, including patients diagnosed with bladder cancer who had recorded BMI values. Analysis of variance was used to assess the association between BMI categories and patient demographics as well as cancer/treatment characteristics. Generalized linear models examined the impact of BMI on health-related quality of life, as measured by the physical and mental component summary scores when controlling for confounding variables. Kaplan–Meier survival curves across BMI categories were compared using log-rank tests. Results: The final cohort consisted of 8013 patients (age ≥ 65) with a mean age of 77.7 ± 7.1 years, the majority of whom were White (85.6%) and male (74.8%). We observed no significant association between BMI and cancer/treatment characteristics. The severely obese subgroup had the highest rate of disability in performing ADLs (18.3%) followed by the underweight subgroup (10.3%). Overweight patients exhibited the highest physical and mental component summary scores, indicating better health-related quality of life. BMI was a significant predictor of overall survival, with overweight, obese, and severely obese patients demonstrating improved survival compared to those with healthy or underweight BMI. These findings remained statistically significant in multivariable analysis. Conclusions: Our findings suggest a dual role of BMI in older patients with bladder cancer: higher BMI provides a survival advantage and, to an extent, a QoL advantage. At the same time, severe obesity did lead to the lowest QoL despite improved survival outcomes. These results underscore the complex interplay between BMI, survival, and QoL in this bladder cancer population.
1. Background
Bladder cancer (BC) is a disease found mostly in the population aged 55 and above with an average age at diagnosis of 73 [1]. In 2024 alone, it was estimated to have affected 83,190 individuals in the United States and led to 16,840 deaths [2]. Following a BC diagnosis, patients often experience a significant decline in functional status and overall health compared to their pre-diagnosis state [3]. Poor general health and impaired ability to perform activities of daily living (ADLs) are among the strongest risk factors for depression in older BC patients [4]. The association between BC outcomes and body mass index (BMI) is widely researched. A 2023 umbrella review showed that being overweight and underweight were positively and negatively associated with increased incidences of BC, respectively [5,6].
Various studies have reported the effect of BC on activities of daily living (ADLs). A 2017 systematic review showed that almost half of those who are treated with radical cystectomy are frail or prefrail [7]. These individuals more frequently develop postoperative adverse events such as major complications and early mortality. Another study by Monfardini et al. found that more than 55% of patients with bladder and renal cancer had at least one Cumulative Illness Rating Scale grade three (severe) or four (extremely severe) comorbidity [8]. Persons affected by BC often have smoking exposure, high BMI, and are insufficiently active [9]. Our previous study demonstrated that patient clusters based on mental and physical functioning exhibit significantly different survival outcomes, independent of BC disease severity or treatment type [10]. Additionally, within two years of diagnosis, a quarter of BC patients experience substantial changes in quality of life [11]. The association between body mass index (BMI) and BC survival is not clear, with some studies showing better outcomes and others showing worse outcomes [12]. Some studies have found that patients with higher BMI had better survival within the first five years after radical cystectomy. Other studies have found that patients with higher BMI had better outcomes [13,14,15].
There is also considerable interest in the relationship between BMI and Health-Related Quality of Life (HRQoL) in BC survivors across settings [16,17,18,19]. Generally, a higher BMI is consistently linked to lower HRQoL, highlighting the negative impact of obesity on survivors’ well-being [20]. However, the studies also reveal variability in the magnitude of these effects, pointing to the influence of demographic, clinical, and treatment-related variables.
This study aims to clarify the relationship between BMI, HRQoL, and survival in BC patients aged 65 and older. Herein, we will (1) evaluate the impact of BMI on health-related quality of life (HRQoL) in patients with BC and (2) assess the association between BMI and survival in these patients.
2. Methods
Study Design: This is a population-based retrospective cross-sectional cohort study conducted using the Surveillance, Epidemiology, and End Results-Medicare Health Outcomes Survey (SEER-MHOS).
Study Population: This study utilized data from the SEER-MHOS database spanning 1999 to 2021 [21,22]. SEER-MHOS offers a unique opportunity for cancer research by integrating cancer-specific data with health-related quality of life (HRQOL) information for Medicare Advantage enrollees. This large, longitudinal dataset enables the investigation of long-term cancer impacts on HRQOL, encompassing physical, emotional, and social well-being, as well as the reverse relationship.
Our study focused on older patients with bladder cancer (BC). We included individuals aged ≥ 65 years who had a documented BC diagnosis and a recorded body mass index (BMI), our primary variable of interest. To ensure a more homogeneous study population, we excluded patients with a survival duration of less than six months, minimizing potential confounding from individuals experiencing rapid mortality.
For patients with multiple records, we selected the most recent survey as the baseline to ensure consistency in follow-up calculations for survival analysis. Given that some patients had recurrent BC diagnoses, older survey records—some dating back as far as a decade—might not accurately represent their current health status. Therefore, we prioritized the most recent survey to capture the latest clinical information, enhancing the relevance and reliability of our analysis.
Data Quality: The SEER-MHOS dataset maintains high data quality through rigorous auditing and validation processes. These measures ensure that the resource remains a reliable and valuable tool for cancer research. SEER-MHOS spans over two decades (1999–2021), providing a large sample for analyzing long-term trends. Additionally, SEER captures approximately 28% of the U.S. population, offering comprehensive cancer surveillance data with demographic diversity [23]. SEER-MHOS maintains high data quality through rigorous data collection protocols, periodic audits, and standardized validation processes. SEER follows strict case ascertainment procedures, while MHOS ensures self-reported HRQOL measures are collected consistently across survey cycles [22]. The linkage between SEER and MHOS allows researchers to study cancer patients’ health outcomes with high reliability.
Outcome Measures: Outcome variables of interest included (1) HRQoL measured by the physical component summary (PCS), and mental component summary (MCS), (2) overall ability to perform ADLs (ADLs), and (3) survival.
The physical component summary (PCS) is a comprehensive measure of physical health, derived from responses across multiple domains, including physical functioning, role limitations due to physical health, bodily pain, and general health perceptions. It is a summary score ranging from 0 to 100, with a higher score indicating better physical health. The mental component summary (MCS) is a comprehensive measure of mental health, derived from responses across multiple domains, including general mental health, role limitations due to emotional problems, social functioning, and vitality. Like the PCS, it is a summary score ranging from 0 to 100, with a higher score indicating better mental health [24]. ADLs consist of bathing, dressing, eating, sitting on/standing up from a chair, walking, and using the toilet. The overall ADL ability was classified into three categories: “No difficulty in any ADL”, “Difficulty in at least one ADL”, and “Disability in at least one ADL”.
Independent Variable: The primary independent variable was BMI (kg/m2), with the following classifications: BMI < 18.5 as “Underweight”; 18.5 ≤ BMI < 25 as “Normal weight”; 25 ≤ BMI < 30 as “Overweight”; 30 ≤ BMI < 40 as “Obesity”; and 40 ≤ BMI as “Severe obesity”.
Covariates: Additional baseline characteristics (including age, gender, race, marital status, home ownership, education level, income, and smoking status); cancer characteristics (including surgery, chemotherapy, and stage of cancer); comorbidities (including muscular disease, depressive symptoms for more than two weeks of the last year, pre-existing comorbid health conditions [computed as a summed disease burden of self-reported physician diagnosed hypertension, cardio-vascular disease, chronic pulmonary obstruction disease, diabetes mellitus, gastrointestinal disease, stroke, and other cancer]); and time from the first cancer diagnosis to the survey.
Statistical Analysis: Patient characteristics at the baseline were summarized with descriptive statistics and presented as frequencies (percentages) for categorical variables and means (standard deviations) for continuous variables in the text and table. Bivariate analyses were stratified by the level of BMI categories. The chi-square test of independence was used to assess the association of the categorical outcome (e.g., ADL) and BMI categories. Analysis of variance (ANOVA) was used to assess the association of numeric outcomes (e.g., HR-QoL, PCS, and MCS) and BMI categories. All assumptions were inspected, and a non-parametric test such as Kruskal–Wallis was used when the normality assumption was violated [25].
To further evaluate the effect of BMI categories on HR-QoL (e.g., PCS and MCS), a generalized linear model (GLM) was used, adjusting for covariates [26]. Covariates in the GLM model included age, gender, race, income, home ownership, education, smoking status, surgery type, chemotherapy, cancer stage, pre-existing depression symptoms, muscular disease, pre-existing comorbid health conditions, and time from the first cancer diagnosis to the survey. Residual analysis was applied to check assumptions in linear regression. To account for the skewness in the MCS, the Box–Cox transformation (MCScox = [MCSλ−1]/λ) was used with optimal lambda (λ) = 2.25 [27]. The effect of BMI categories was evaluated on the transformed the MCS in a multivariable GLM. Additionally, a log-rank test corresponding to Kaplan–Meier survival analysis was used to assess whether there was any significant difference in survival probability across BMI categories [28,29]. All tests of statistical significance were two-sided with a significance level of 0.05. Analyses were performed with SAS version 9.4 (SAS Institute, Inc., Cary, NC, USA) [30].
3. Results
We included 33,145 SEER-MHOS records of 18,827 patients with BC (Figure 1). We excluded 14,259 records prior to BC diagnosis, 565 records prior to age 65, and 539 records with less than 6 months of post-survey survival. We excluded 5001 records without BMI data. This left us with 12,781 surveys related to 8013 patients. We only included the last survey from each patient, leaving us with 8013 surveys from an equal number of patients.
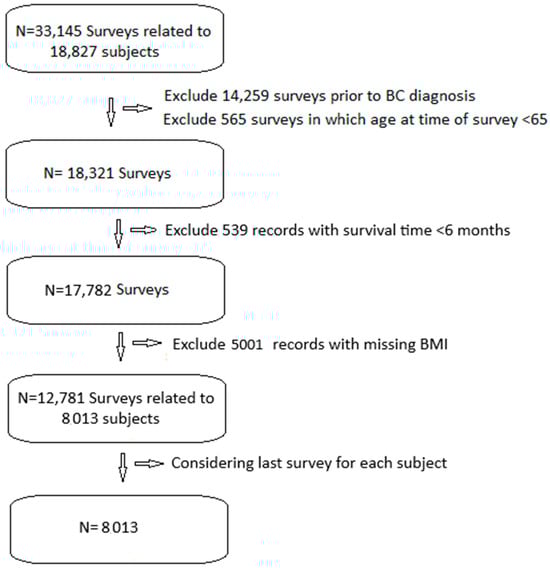
Figure 1.
Study flow diagram.
The mean age at the time of survey of the sample set was 77.68 years with a standard deviation of 7.08 years. Most of the participants were male (74.8%) and White (85.6%). The majority were married (58.7%), homeowners (74.5%), high school graduates or less educated (54.7%), earning an annual income of USD 20,000 to 49,000 (37.9%), non-smokers (85.7%), and in the overweight BMI category (40.7%) (Table 1).

Table 1.
Summary statistics of demographic and socioeconomic variables.
3.1. Cancer Charateristics and BMI Association
The time from diagnosis to survey completion was correlated with time since cancer diagnosis, with the shortest interval for those with severe obesity and the longest for underweight individuals (p < 0.001, Table 2). Survival was also correlated with BMI (p < 0.001), with shortest survival for severe obese and underweight patients and longest survival for overweight patients.
Table 2.
Mean and standard deviation of time in months since first cancer diagnosis to survey and survival time in months since time of survey.
Months since first cancer diagnosis to survey reports the time elapsed from the initial diagnosis to study inclusion, regardless of potential disease-free intervals.
The cancer stage at diagnosis was not correlated with BMI at survey completion (p = 0.17, Table 3). Similarly, there was no statistically significant correlation between BMI and the type of surgical treatment (p = 0.24) or receipt of chemotherapy (p = 0.57).
Table 3.
Distribution of cancer characteristics overall and by BMI categories.
3.2. Physical and Mental Component Summary Scores and BMI Association
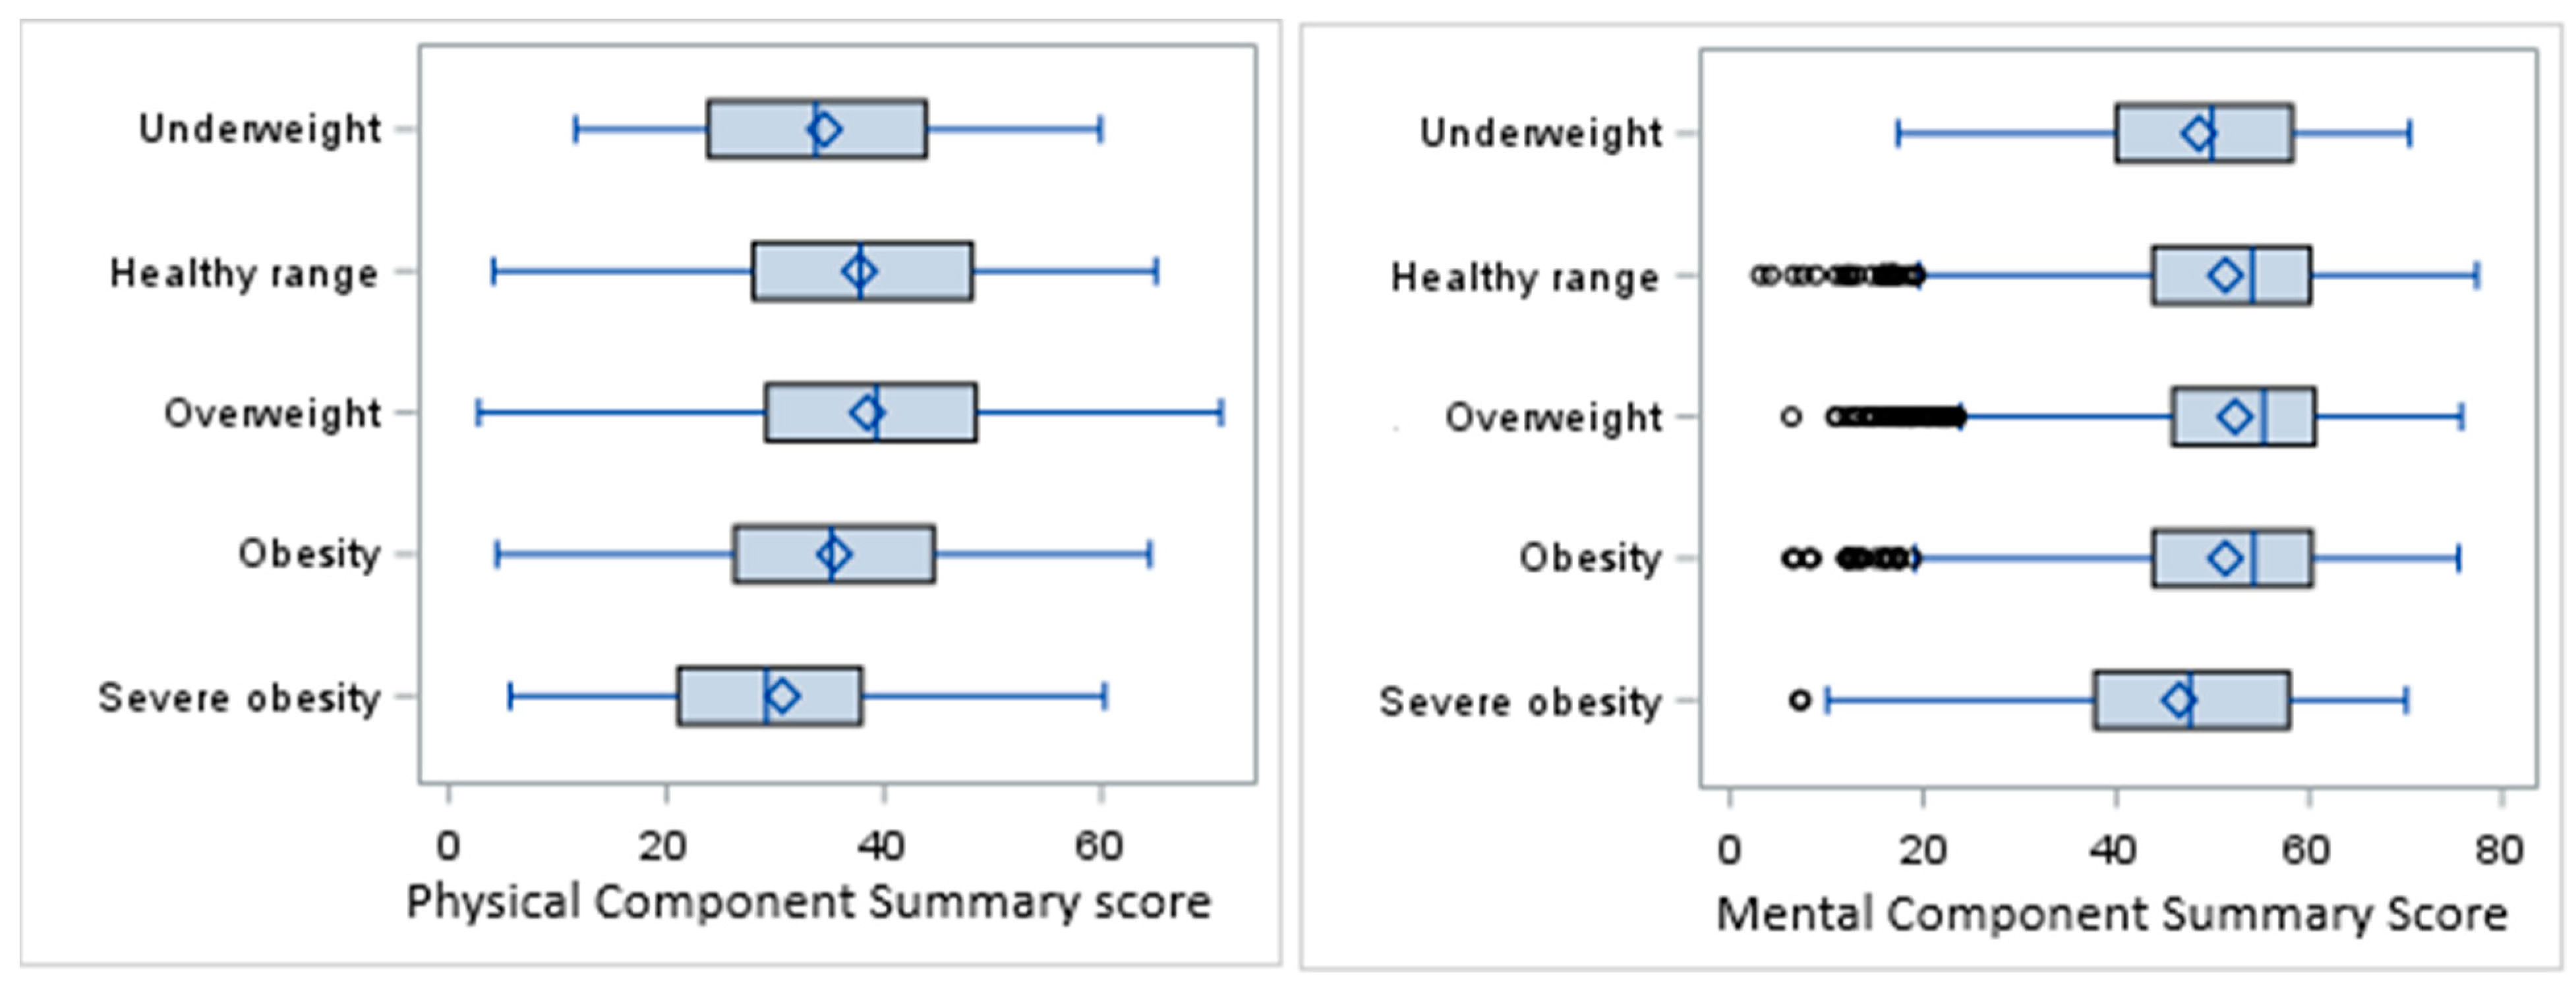
The overall mean PCS score in the sample population was 37.3 ± 12.1, with the highest score in the overweight category (38.5) and the lowest in the severe obesity category (30.7). The overall mean MCS score was 51.6 ± 11.4, with the highest mean observed in the overweight category (52.3) and the lowest in the severe obesity category (46.5) (Figure 2).
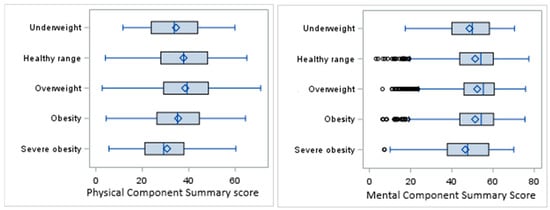
Figure 2.
Box plots for PCS and MCS scores by BMI categories.
The results of ANOVA showed a significant difference in PCS scores among the BMI categories (F(4,7495) = 32.66, p < 0.0001). The distribution of the MCS scores was right-skewed, and so the nonparametric Kruskal–Wallis (KW) test was performed for univariate analysis of the MCS scores, indicating a significant difference in distribution of the MCS among the BMI categories (KW p-value < 0.0001).
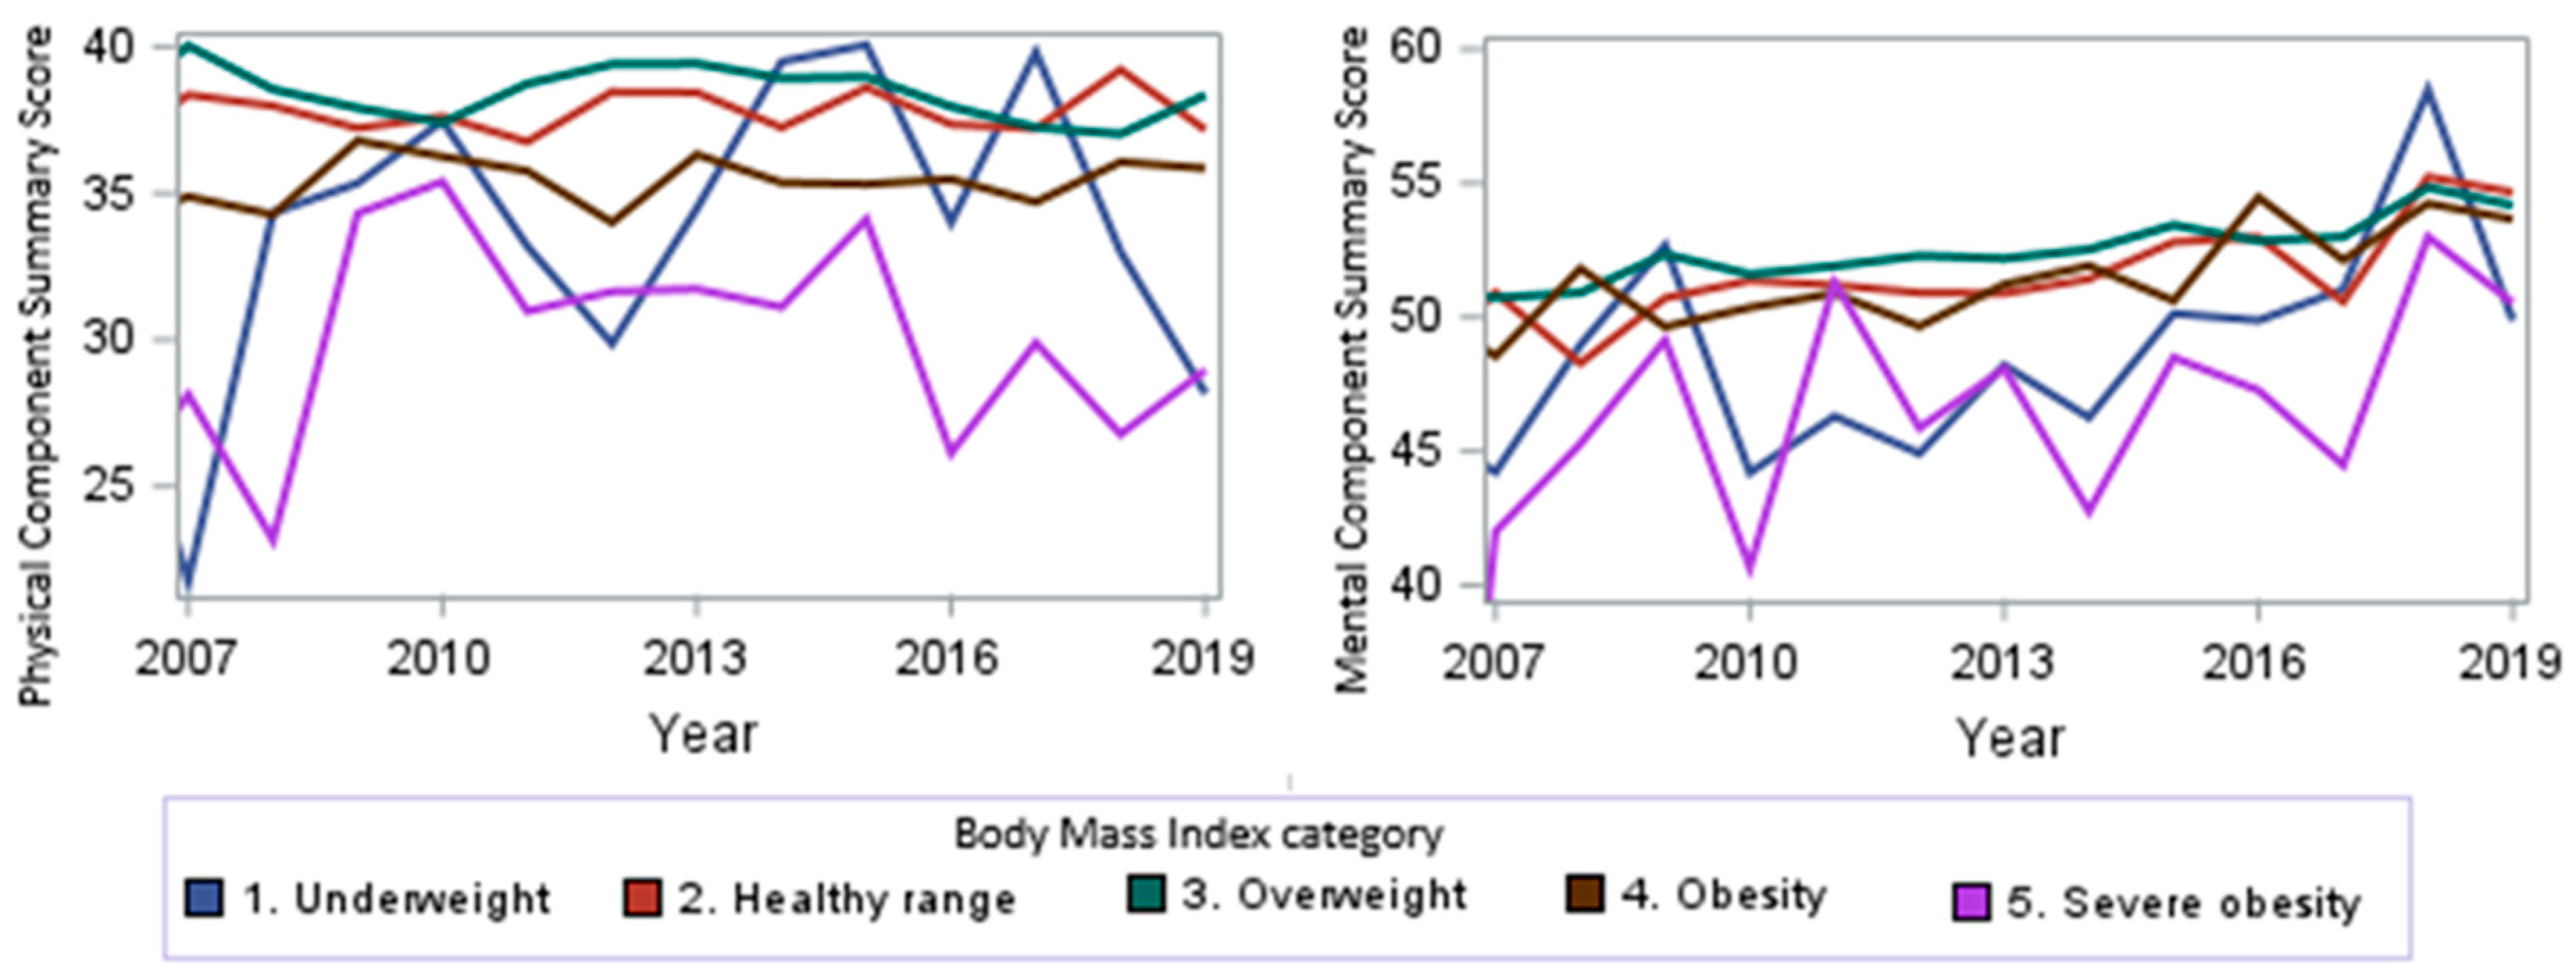
When looking at the PCS and MCS scores over time from 2007 to 2019, we observed a trend towards higher scores (p < 0.0001, Figure 3) for the MCS, signifying improved mental health over time. No significant overall change in the PCS scores was observed (p = 0.9). From 2007 to 2019, we observed a stable PCS score for the healthy-range, overweight, and obesity subgroups over time, a trend towards higher scores for the underweight subgroup, and a trend towards lower scores for sever obese subjects over time.
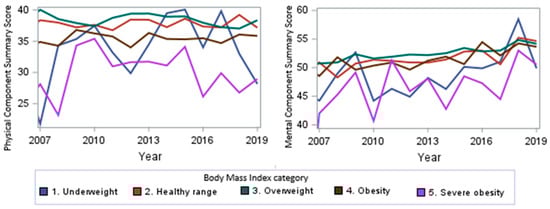
Figure 3.
PCS and MCS score trends by year.
ADLs and BMI Association: There was a significant difference in ADL ability correlated with BMI (p < 0.0001, Table 4). Severely obese individuals had the highest percentage of individuals with at least one ADL difficulty (57.8%) and the highest for disabilities (18.5%), while underweight and obese patients had similar levels of overall disability (45.4% having difficulty with one ADL and no disability for both). Healthy-range and overweight individuals had fewer ADL difficulties and disabilities, with a majority having no difficulties.
Table 4.
Frequency and column percentages of overall ADL ability by BMI categories.
3.3. Survival Analysis by BMI
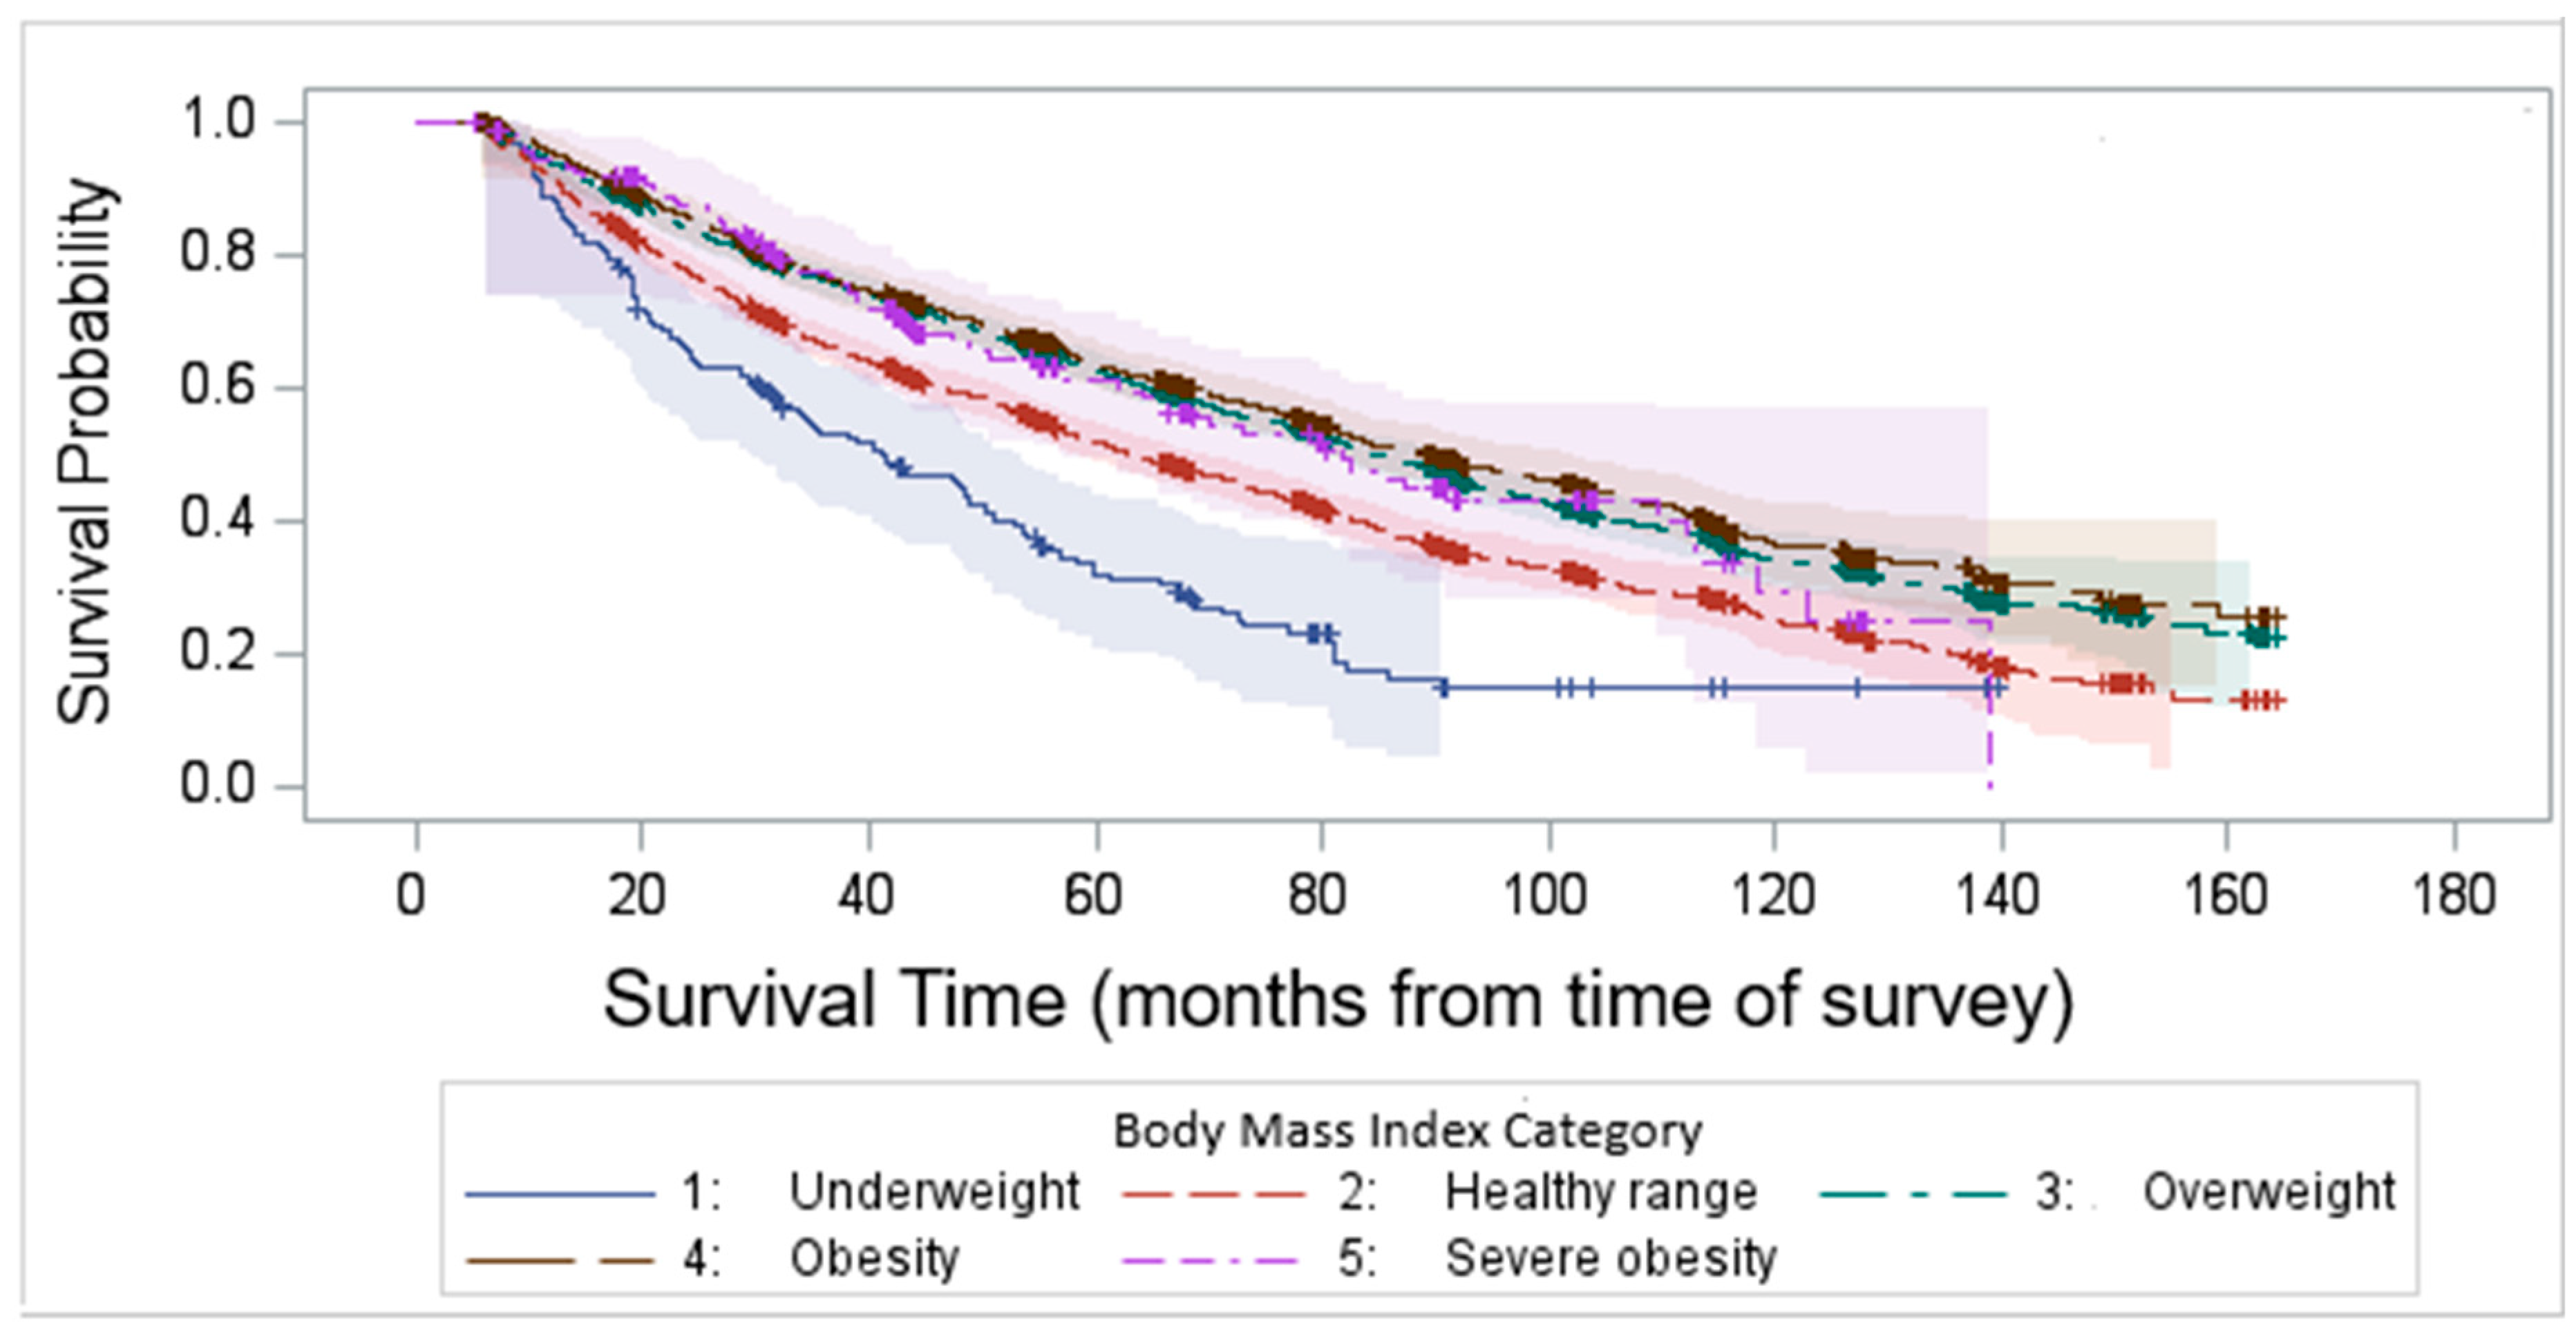
Kaplan–Meier survival analysis demonstrated that the median survival time after survey completion was 81.8 months. Our findings highlight a significant variability in survival outcomes among different BMI categories, with underweight and normal-weight individuals experiencing the worst survival (log-rank test p < 0.0001, Figure 4).

Figure 4.
Kaplan–Meier survival time after survey completion by BMI categories.
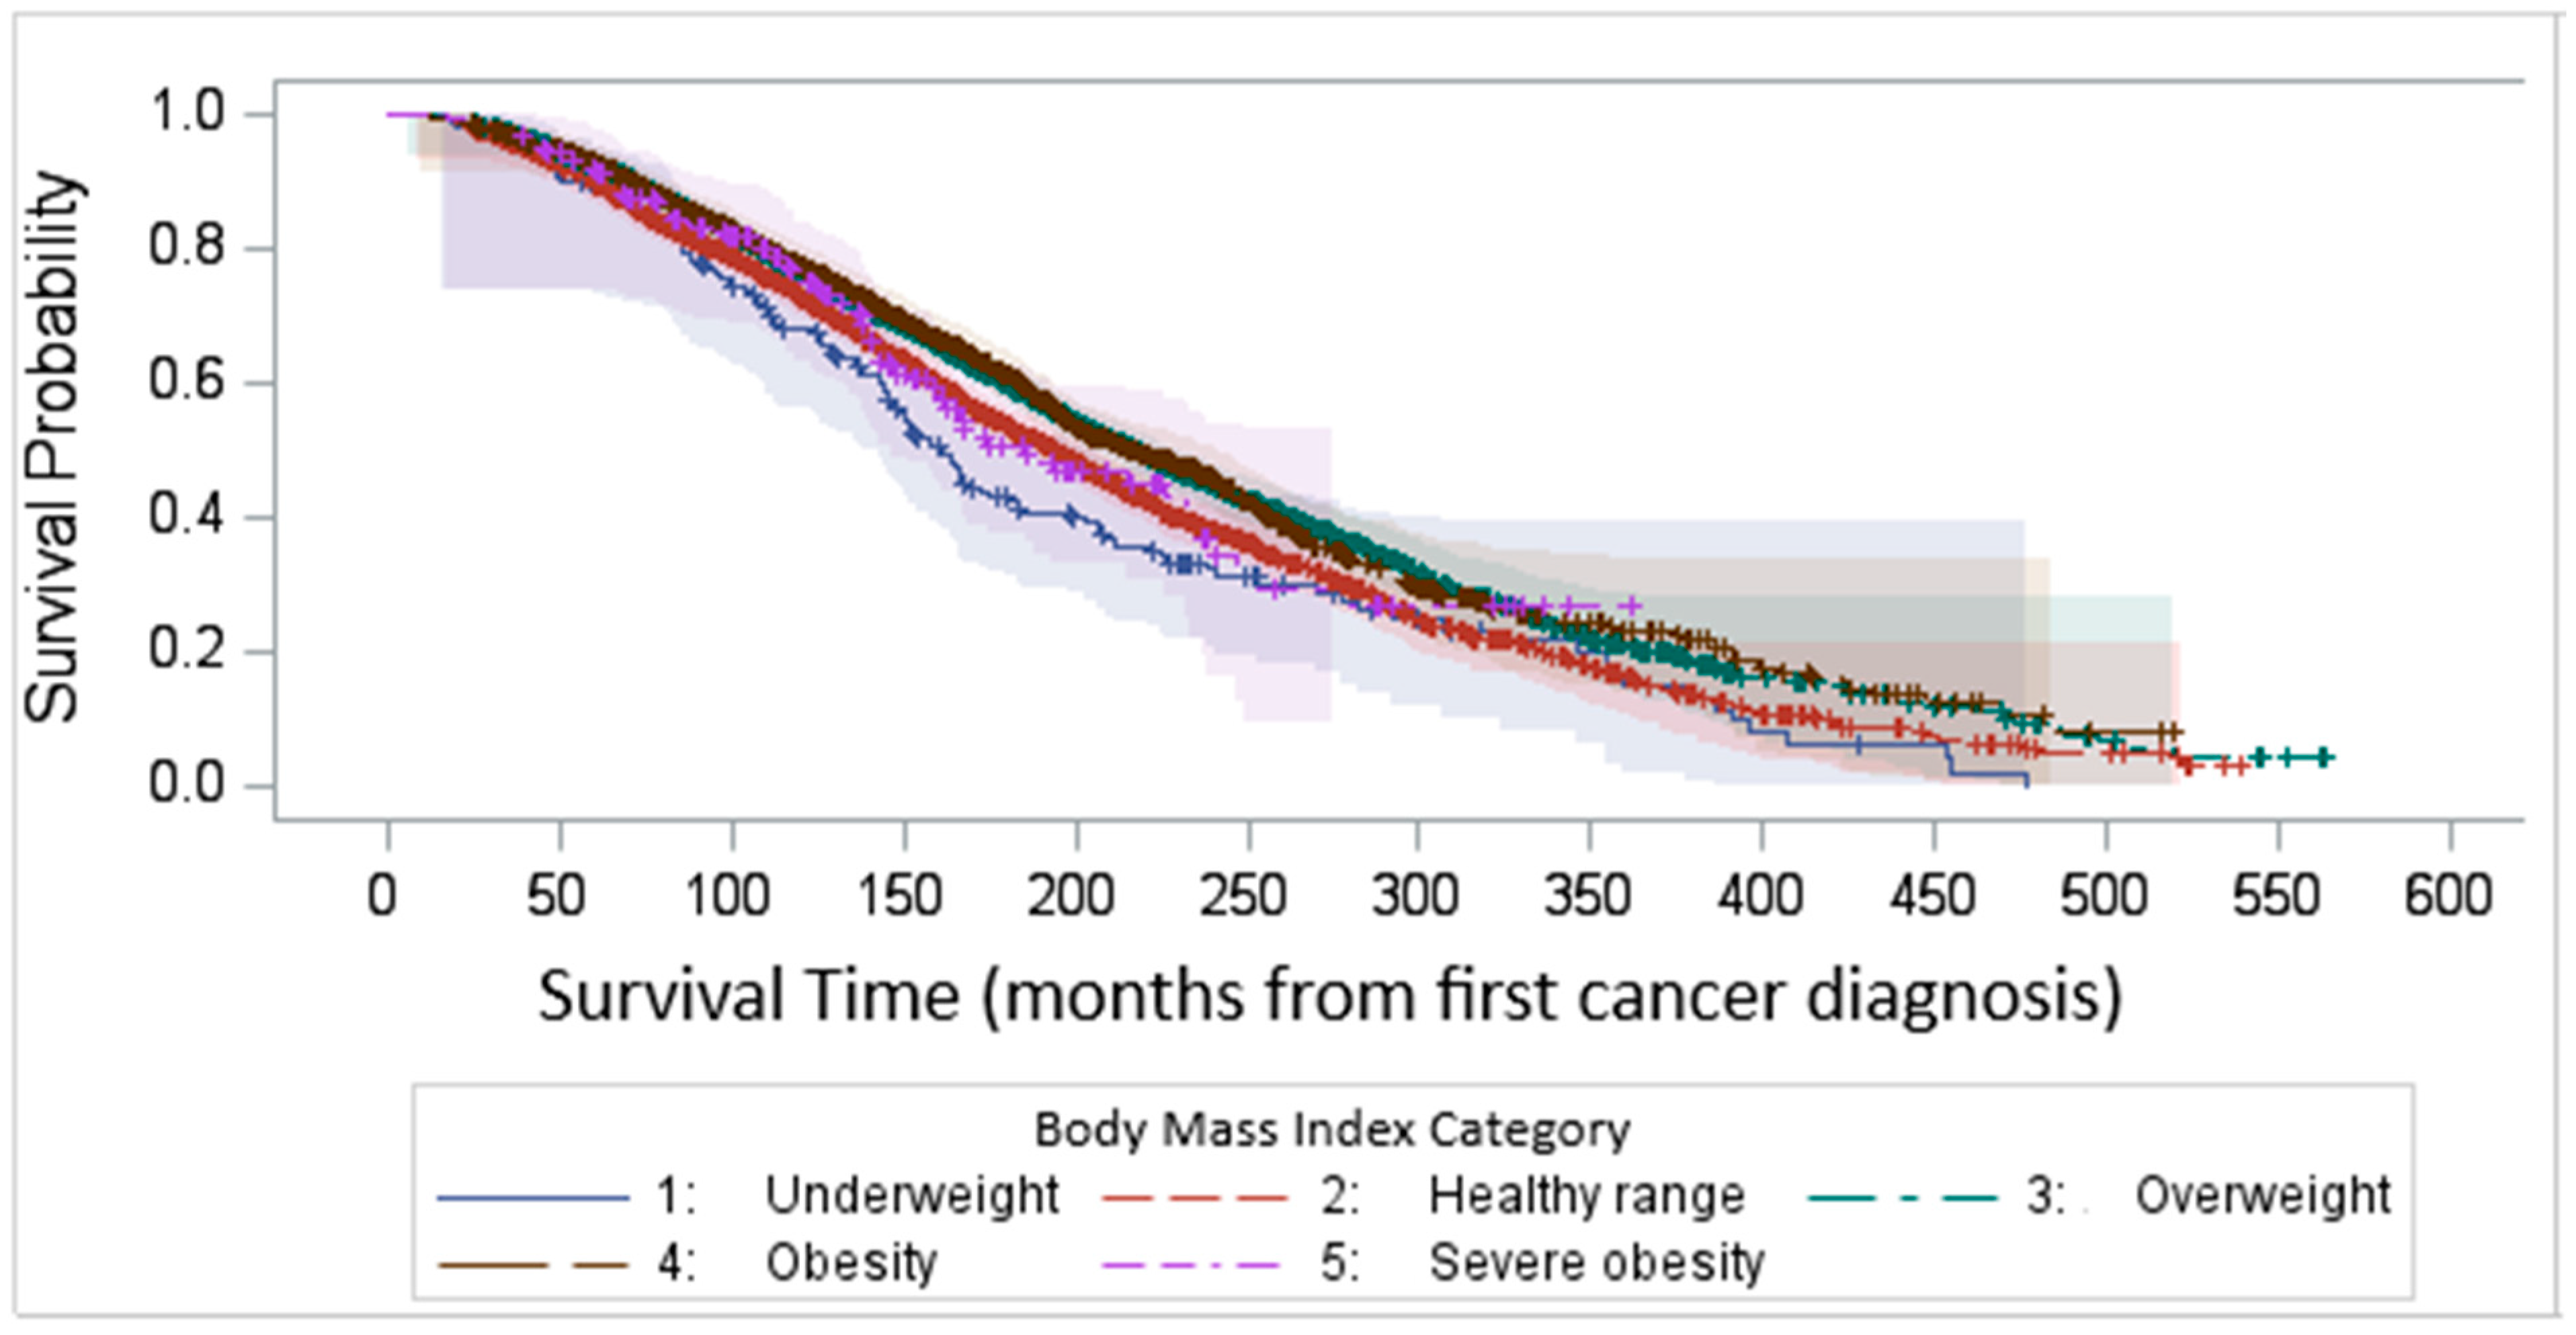
We compared the KM survival curves among BMI groups with first BC diagnosis as the baseline, and we observed a similar result which shows the consistency of the result. Figure 5, rather than capturing uninterrupted disease duration, reports the time elapsed from the initial diagnosis to study inclusion, regardless of potential disease-free intervals.

Figure 5.
Kaplan–Meier survival time after first cancer diagnosis by BMI categories.
3.4. Multivariable Regression Analysis of PCS and MCS Outcomes
In multivariate analysis, with the normal range BMI as the reference, underweight, and severe obesity had significantly lower PCS and MCS scores (Table 5). Obese patients had significantly lower PCS scores, and overweight patients had significantly better mental health than the normal range BMI. Modeling results also revealed that age is negatively associated with both the PCS and MCS results, indicating that older age results in lower scores. Race and gender were not associated with the PCS, but females and White participants had a significantly better MCS outcome. Variables such as depression symptoms, non-house ownership, low income, and the number of comorbidities were linked to significantly lower PCS and MCS scores. Smoking, muscular diseases, and undergoing cystectomy are also linked to significantly lower PCS scores. The bladder cancer stage, surgical intervention, receipt of intravenous chemotherapy, and time from the first cancer diagnosis to the survey were not significantly associated with the MCS outcome. The time from the first cancer diagnosis to the survey has no significant effect on either the PCS (p = 0.4066) or MCS scores (p = 0.9082).
Table 5.
Estimates of effect of patient characteristics on PCS and transformed MCS outcomes in multivariable GLMs.
4. Discussion
Our final cohort data are in line with prior studies both in terms of age [1]. sex [31], and race [32]. Our study highlights the complex interplay between BMI, demographic factors, and patient-reported HRQoL outcomes in older patients with BC. The significant association between obesity and lower physical component summary (PCS) scores aligns with the previous literature, suggesting that excess body weight may contribute to physical limitations and reduced mobility, ultimately impacting overall physical well-being [20]. Our study indicates low PCS scores for underweight individuals as well. Interestingly, overweight individuals demonstrated significantly better mental component summary (MCS) scores compared to those with normal-range BMI, which may indicate potential psychological resilience or benefits associated with a slightly higher body weight [33].
Age was a determinant of both physical and mental health, with increasing age negatively associated with PCS and MCS scores. This finding is expected, as aging is often accompanied by a decline in physical function, increased comorbidities, and potential psychosocial challenges, such as reduced social engagement and loss of independence.
While race and gender did not significantly impact PCS scores, females and White individuals had significantly higher MCS scores. This may reflect differences in social support, healthcare access, coping mechanisms, or cultural perceptions of mental health, warranting further exploration into underlying psychosocial or systemic factors.
Socioeconomic and health-related variables played a significant role in both PCS and MCS outcomes. Depression symptoms, lower income, lack of home ownership, and a higher number of comorbidities were strongly linked to poorer HRQoL across both dimensions. These results underscore the importance of addressing social determinants of health in improving patient well-being. Additionally, smoking, muscular diseases, and undergoing cystectomy were associated with lower PCS scores, suggesting that these conditions contribute to significant physical health burdens.
The time from the first cancer diagnosis to the survey has no significant effect on either the PCS or MCS scores.
Notably, cancer-related variables such as cancer stage, surgery type, chemotherapy, and time from the first cancer diagnosis to the survey did not significantly impact MCS outcomes. This finding suggests that while cancer treatment can impose physical stress, mental health outcomes may be more influenced by pre-existing conditions, coping mechanisms, and social support rather than the specific cancer treatment characteristics.
Our findings also highlight a significant variability in survival outcomes among different BMI categories, with underweight and normal-weight individuals experiencing the worst survival. This aligns with prior research suggesting that low BMI may be associated with higher frailty, reduced physiological reserves, and increased vulnerability to disease-related complications [34]. The poor survival in the underweight group may reflect underlying malnutrition, muscle wasting (sarcopenia), or more advanced disease states at original diagnosis.
Interestingly, overweight and obese individuals demonstrated better survival outcomes [15]. Several other studies also reported that higher BMI is associated with better survival in bladder cancer patients [35,36]. While obesity is typically associated with higher risks of chronic diseases, higher BMI in bladder cancer patients may provide protective benefits. These may include greater metabolic reserves during periods of severe illness, better tolerance to treatment-related stress, and differences in inflammatory responses. However, it remains unclear whether these benefits are directly due to excess body weight or other underlying factors such as muscle mass, nutritional status, or differences in treatment received.
We compared Kaplan–Meier (KM) survival curves among BMI groups using two different baseline time points: the time of the survey (Figure 4) and the first cancer diagnosis (Figure 5). This analysis aimed to identify any inconsistencies between the approaches. Our findings demonstrated a consistent pattern across both methods. In this dataset, the average time from the first bladder cancer (BC) diagnosis to the most recent survey (i.e., inclusion in the study) was 8.5 years (102 months). However, it is important to acknowledge that BC can recur following initial treatment. For patients with recurrent BC, there may have been periods of disease-free survival between episodes of recurrence.
4.1. Limitations
This study has several limitations that should be considered when interpreting the findings. In terms of sample selection, our analysis was based on data obtained from the SEER–MHOS database, which comprises survey information on bladder cancer patients enrolled in the Medicare Advantage Program from participating registries. As a result, the study population may not fully represent the diverse demographics of the broader U.S. population, nor can the findings be generalized to other countries. Nonetheless, our data are in line with prior studies both in terms of age [1], sex [31], and race [32].
As BMI was the main variable of interest, we excluded individuals with missing BMI, which may introduce the potential for selection bias if the missingness is not random, as these individuals may differ systematically from those included in the analysis. This study occurred over a long timeframe over which the management of bladder cancer significantly changed, and it continues to do so.
Regarding study design, the cross-sectional nature of this study limits its ability to establish causality and exploration of temporal relationships between BMI, physical and mental component summary (PCS and MCS) scores, and activities of daily living (ADLs) disabilities. Consequently, causal inferences or longitudinal insights into these associations cannot be drawn from the current findings.
4.2. Strengths of the Study
The SEER-MHOS data resource is one of the most comprehensive resources available for analyzing cancer patients. It provides a unique opportunity for cancer research by combining cancer-specific data with health-related quality of life (HRQOL) information for Medicare Advantage enrollees. This is a unique and large dataset that gives researchers the opportunity to study the long-term impact of cancer on health-related quality of life, including physical, emotional, and social well-being. Additionally, it can be used to compare cancer survival among different populations.
5. Conclusions
Our study underscores the multifaceted relationship between BMI, demographic and socioeconomic factors, and HRQoL outcomes, as well as survival disparities among BMI categories for older patients with bladder cancer. Future research should aim to further explore the mechanisms driving these associations and investigate targeted interventions to improve HRQoL and survival outcomes, particularly for high-risk groups such as underweight individuals and those with socioeconomic disadvantages. Integrating personalized treatment strategies that consider both physical and mental health factors could lead to better overall patient outcomes and quality of life.
Author Contributions
K.S.M. and M.G. purchased the bladder cancer data from SEER-MHOS for the WU ICTS grant. G.R. and M.G. conceptualized the initial idea. M.G. and M.R. analyzed the data, interpreted the results, and drafted the manuscript. N.-W.C. contributed to substantially revising the manuscript. All authors reviewed the manuscript. All authors have read and agreed to the published version of the manuscript.
Funding
This research received no external funding.
Institutional Review Board Statement
Approved by University of Missouri IRB via waiver as no patient identifiers included.
Informed Consent Statement
For SEER-MHOS data, investigators are not required to obtain individual patient consent because the data are considered a limited dataset, exempt from additional HIPAA requirements. However, the investigators have agreed to the SEER-MHOS Data Use Agreement (DUA) and adhered to specific data handling and security protocols.
Data Availability Statement
Data for this study were obtained from the SEER-MHOS link data resource. The SEER-MHOS database is available to outside investigators for research purposes (please see https://healthcaredelivery.cancer.gov/seer-mhos/obtain/overview.html) (accessed on 31 March 2025).
Conflicts of Interest
The authors declare that they have no competing interests.
List of Abbreviations
| BC | Bladder cancer |
| BMI | Body mass index. |
| SEER-MHOS | Surveillance: Epidemiology, and End Results-Medicare Health Outcomes Survey |
| PCS | Physical component summary |
| MCS | Mental component summary |
| ADL | ADL |
| HR-QoL | Health-related quality of life |
| ANOVA | Analysis of variance. |
| GLM | Generalized linear model |
| KW | Kruskal–Wallis |
References
- Siegel, R.L.; Giaquinto, A.N.; Jemal, A. Cancer statistics, 2024. CA Cancer J. Clin. 2024, 74, 12–49. [Google Scholar] [CrossRef]
- American Cancer Society. Key Statistics for Bladder Cancer. Available online: https://www.cancer.org/cancer/types/bladder-cancer/about/key-statistics.html (accessed on 16 April 2024).
- Ungerer, G.; Anwar, T.; Golzy, M.; Murray, K.S. Living with Bladder Cancer: Self-reported Changes in Patients’ Functional and Overall Health Status Following Diagnosis. Eur. Urol. Open Sci. 2020, 20, 14–19. [Google Scholar] [CrossRef] [PubMed] [PubMed Central]
- Oserowsky, A.; Anwar, T.; Lough, C.; Golzy, M.; Murray, K.S. The Significant Role of Depression in Elderly Patients with Bladder Cancer. Eur. Urol. Open Sci. 2021, 33, 11–18. [Google Scholar] [CrossRef] [PubMed] [PubMed Central]
- Zhao, L.; Tian, X.; Duan, X.; Ye, Y.; Sun, M.; Huang, J. Association of body mass index with bladder cancer risk: A dose-response meta-analysis of prospective cohort studies. Oncotarget 2017, 8, 33990–34000. [Google Scholar] [CrossRef] [PubMed] [PubMed Central]
- Chen, J.; Ke, K.; Liu, Z.; Yang, L.; Wang, L.; Zhou, J.; Dong, Q. Body Mass Index and Cancer Risk: An Umbrella Review of Meta-Analyses of Observational Studies. Nutr. Cancer 2023, 75, 1051–1064. [Google Scholar] [CrossRef] [PubMed]
- Ethun, C.G.; Bilen, M.A.; Jani, A.B.; Maithel, S.K.; Ogan, K.; Master, V.A. Frailty and cancer: Implications for oncology surgery, medical oncology, and radiation oncology. CA Cancer J. Clin. 2017, 67, 362–377. [Google Scholar] [CrossRef] [PubMed]
- Monfardini, S.; Morlino, S.; Valdagni, R.; Catanzaro, M.; Tafa, A.; Bortolato, B.; Petralia, G.; Bonetto, E.; Villa, E.; Picozzi, S.; et al. Follow-up of elderly patients with urogenital cancers: Evaluation of geriatric care needs and related actions. J. Geriatr. Oncol. 2017, 8, 289–295. [Google Scholar] [CrossRef]
- Catto, J.W.F.; Rogers, Z.; Downing, A.; Mason, S.J.; Jubber, I.; Bottomley, S.; Conner, M.; Absolom, K.; Glaser, A. Lifestyle Variables in Patients with Bladder Cancer: A Contemporary Picture of Tobacco Smoking, Electronic Cigarette Use, BMI, and Levels of Physical Activity. Eur. Urol. Focus 2023, 9, 974–982. [Google Scholar] [CrossRef] [PubMed]
- Golzy, M.; Beheshti, M.; Henslee, B.; Rosen, G.H.; Murray, K.S. Transition in Quality Of Life Among Older Patients With Bladder Cancer and Its Association With Treatment: A Clustering Approach. JU Open Plus 2024, 2, e00090. [Google Scholar] [CrossRef]
- Golzy, M.; Rosen, G.H.; Kruse, R.L.; Hooshmand, K.; Mehr, D.R.; Murray, K.S. Holistic Assessment of Quality of Life Predicts Survival in Older Patients with Bladder Cancer. Urology 2023, 174, 141–149. [Google Scholar] [CrossRef] [PubMed]
- Arthuso, F.Z.; Fairey, A.S.; Boulé, N.G.; Courneya, K.S. Associations between body mass index and bladder cancer survival: Is the obesity paradox short-lived? Can. Urol. Assoc. J. 2022, 16, E261–E267. [Google Scholar] [CrossRef] [PubMed] [PubMed Central]
- Chromecki, T.F.; Cha, E.K.; Fajkovic, H.; Rink, M.; Ehdaie, B.; Svatek, R.S.; Karakiewicz, P.I.; Lotan, Y.; Tilki, D.; Bastian, P.J.; et al. Obesity is associated with worse oncological outcomes in patients treated with radical cystectomy. BJU Int. 2013, 111, 249–255. [Google Scholar] [CrossRef] [PubMed]
- Dabi, Y.; Rouscoff, Y.; Anract, J.; Delongchamps, N.B.; Sibony, M.; Saighi, D.; Zerbib, M.; Peyraumore, M.; Xylinas, E. Impact of body mass index on the oncological outcomes of patients treated with radical cystectomy for muscle-invasive bladder cancer. World J. Urol. 2017, 35, 229–235. [Google Scholar] [CrossRef]
- Giert, M.; Zeman, F.; Denzinger, S.; Vetterlein, M.W.; Fisch, M.; Bastian, P.J.; Syring, I.; Ellinger, J.; Müller, S.C.; Herrmann, E.; et al. Influence of body mass index on clinical outcome parameters, complication rate and survival after radical cystectomy: Evidence from a prospective, European, multicenter study. Urol. Int. 2018, 101, 16–24. [Google Scholar] [CrossRef]
- Revicki, D.A.; Kleinman, L.; Cella, D. A history of health-related quality of life outcomes in psychiatry. Dialogues Clin. Neurosci. 2014, 16, 127–135. [Google Scholar] [CrossRef]
- Yin, S.; Njai, R.; Barker, L.; Siegel, P.Z.; Liao, Y. Summarizing health-related quality of life (HRQOL): Development and testing of a one-factor model. Popul. Health Metr. 2016, 14, 22. [Google Scholar] [CrossRef] [PubMed]
- Carmona-Torres, J.M.; Rodriguez-Borrego, M.A.; Laredo-Aguilera, J.A.; Lopez-Soto, P.J.; Santacruz-Salas, E.; Cobo-Cuenca, A.I. Disability for basic and instrumental ADL in older individuals. PLoS ONE 2019, 14, e0220157. [Google Scholar] [CrossRef]
- Katz, S. Assessing self-maintenance: ADL, mobility, and instrumental ADL. J. Am. Geriatr. Soc. 1983, 31, 721–727. [Google Scholar] [CrossRef]
- Chung, J.; Kulkarni, G.S.; Bender, J.; Breau, R.H.; Guttman, D.; Maganti, M.; Matthew, A.; Morash, R.; Papadakos, J.; Jones, J.M. Modifiable lifestyle behaviours impact the health-related quality of life of bladder cancer survivors. BJU Int. 2020, 125, 836–842. [Google Scholar] [CrossRef] [PubMed] [PubMed Central]
- SEER-Medicare Health Outcomes Survey (SEER-MHOS) Linked Data Resource-National Cancer Institute. Available online: https://healthcaredelivery.cancer.gov/seer-mhos/ (accessed on 26 March 2025).
- Ambs, A.; Warren, J.L.; Bellizzi, K.M.; Topor, M.; Haffer, S.C.; Clauser, S.B. Overview of the SEER--Medicare Health Outcomes Survey linked dataset. Health Care Financ. Rev. 2008, 29, 5–21. [Google Scholar] [PubMed] [PubMed Central]
- SEER-MHOS: Data Documentation and Methods. National Cancer Institute (NCI). USA. 2023. Available online: https://healthcaredelivery.cancer.gov/seer-mhos/aboutdata/documentation.html (accessed on 26 March 2025).
- Ware, J.E.; Sherbourne, C.D. The MOS 36-Item Short-Form Health Survey (SF-36): I. Conceptual Framework and Item Selection. Med. Care 1992, 30, 473–483. Available online: https://www.jstor.org/stable/3765916 (accessed on 25 March 2025).
- Kruskal, W.H.; Wallis, W.A. Use of ranks in one-criterion variance analysis. J. Am. Stat. Assoc. 1952, 47, 583–621. [Google Scholar] [CrossRef]
- Nelder, J.A.; Wedderburn, R.W. Generalized Linear Models. J. R. Stat. Soc. Ser. A (Gen.) 1972, 135, 370–384. [Google Scholar] [CrossRef]
- Box, G.E.P.; Cox, D.R. An analysis of transformations. J. Roy. Statist. Soc. B 1964, 26, 211–252. [Google Scholar]
- Kaplan, E.L.; Meier, P. Nonparametric estimation from incomplete observations. J. Amer. Statist. Assoc. 1958, 53, 457–481. [Google Scholar] [CrossRef]
- Mantel, N. Evaluation of survival data and two new rank order statistics arising in its consideration. Cancer Chemother. Rep. 1966, 50, 163–170. [Google Scholar] [PubMed]
- SAS 9.4 Help Documentation; SAS Institute Inc: Cary, NC, USA, 2023.
- Bladder Cancer Statistics from MOFFIT Cancer Center. Available online: https://www.moffitt.org/cancers/bladder-cancer/faqs/bladder-cancer-statistics/ (accessed on 19 March 2025).
- Fang, W.; Yang, Z.; Chen, T.; Shen, X.; Zhang, C. Ethnicity and survival in bladder cancer: A population-based study based on the SEER database. J. Transl. Med. 2020, 18, 145. [Google Scholar] [CrossRef] [PubMed]
- Zheng, N.; Zhuang, M.; Zhu, Y.; Wang, Y.; Ye, M.; Zhang, Y.; Zhan, Y. Association between psychological resilience and body mass index in a community-based population: A cross-sectional study. Obes. Sci. Pract. 2024, 10, e761. [Google Scholar] [CrossRef] [PubMed] [PubMed Central]
- Clegg, A.; Young, J.; Iliffe, S.; Rikkert, M.O.; Rockwood, K. Frailty in elderly people. Lancet 2013, 381, 752–762. [Google Scholar] [CrossRef] [PubMed] [PubMed Central]
- Bi, H.; Huang, Y.; Wang, G.; Ma, L.; Lu, M. Impact of body mass index and pretreatment hemoglobin level on prognosis following radical cystectomy for bladder cancer in males and females. Urol. Int. 2020, 104, 28–35. [Google Scholar] [CrossRef]
- Psutka, S.P.; Boorjian, S.A.; Moynagh, M.R.; Schmit, G.D.; Frank, I.; Carrasco, A.; Stewart, S.B.; Tarrell, R.; Thapa, P.; Tollefson, M.K. Mortality after radical cystectomy: Impact of obesity vs. adiposity after adjusting for skeletal muscle wasting. J. Urol. 2015, 193, 1507–1513. [Google Scholar] [CrossRef]
Disclaimer/Publisher’s Note: The statements, opinions and data contained in all publications are solely those of the individual author(s) and contributor(s) and not of MDPI and/or the editor(s). MDPI and/or the editor(s) disclaim responsibility for any injury to people or property resulting from any ideas, methods, instructions or products referred to in the content. |
© 2025 by the authors. Licensee MDPI, Basel, Switzerland. This article is an open access article distributed under the terms and conditions of the Creative Commons Attribution (CC BY) license (https://creativecommons.org/licenses/by/4.0/).