
Evaluating the Potential of PSMA Targeting in CNS Tumors: Insights from Large-Scale Transcriptome Profiling

 , ,
, ,
Simple Summary
Abstract

1. Introduction
2. Materials and Methods
3. Results
4. Discussion
5. Conclusions
Supplementary Materials
Author Contributions
Funding
Institutional Review Board Statement
Informed Consent Statement
Data Availability Statement
Acknowledgments
Conflicts of Interest
Abbreviations
References
- Sacha, P.; Zamecnik, J.; Barinka, C.; Hlouchová, K.; Vícha, A.; Mlčochová, P.; Hilgert, I.; Eckschlager, T.; Konvalinka, J. Expression of glutamate carboxypeptidase II in human brain. Neuroscience 2007, 144, 1361–1372. [Google Scholar]
- Horoszewicz, J.S.; Kawinski, E.; Murphy, G.P. Monoclonal antibodies to a new antigenic marker in epithelial prostatic cells and serum of prostatic cancer patients. Anticancer Res. 1987, 7, 927–935. [Google Scholar] [PubMed]
- FDA Approves Pluvicto/Locametz for Metastatic Castration-Resistant Prostate Cancer. J. Nucl. Med. 2022, 63, 13N.
- Muselaers, S.; Erdem, S.; Bertolo, R.; Ingels, A.; Kara, Ö.; Pavan, N.; Roussel, E.; Pecoraro, A.; Marchioni, M.; Carbonara, U.; et al. PSMA PET/CT in Renal Cell Carcinoma: An Overview of Current Literature. J. Clin. Med. 2022, 11, 1829. [Google Scholar] [CrossRef] [PubMed]
- Sawicki, L.M.; Buchbender, C.; Boos, J.; Giessing, M.; Ermert, J.; Antke, C.; Antoch, G.; Hautzel, H. Diagnostic potential of PET/CT using a 68Ga-labelled prostate-specific membrane antigen ligand in whole-body staging of renal cell carcinoma: Initial experience. Eur. J. Nucl. Med. Mol. Imaging 2017, 44, 102–107. [Google Scholar]
- Bouchelouche, K.; Turkbey, B.; Choyke, P.L. PSMA PET and Radionuclide Therapy in Prostate Cancer. Semin. Nucl. Med. 2016, 46, 522–535. [Google Scholar] [CrossRef]
- Haffner, M.C.; Kronberger, I.E.; Ross, J.S.; Sheehan, C.E.; Zitt, M.; Mühlmann, G.; Öfner, D.; Zelger, B.; Ensinger, C.; Yang, X.J.; et al. Prostate-specific membrane antigen expression in the neovasculature of gastric and colorectal cancers. Hum. Pathol. 2009, 40, 1754–1761. [Google Scholar]
- Vaz, S.; Oliveira, C.; Castanheira, J.C.; Silva, A.F.; Costa, D.C. Gastric GIST Incidentally Detected on 68Ga-PSMA-PET/CT: Correlation Between Functional Imaging and Histology. Clin. Nucl. Med. 2018, 43, e488–e491. [Google Scholar] [CrossRef]
- Hofstetter, G.; Grech, C.; Pils, D.; Pammer, J.; Neudert, B.; Pötsch, N.; Baltzer, P.; Traub-Weidinger, T.; Seebacher, V.; Aust, S. Prostate-Specific Membrane Antigen (PSMA) Expression in Tumor-Associated Neovasculature Is an Independent Prognostic Marker in Patients with Ovarian Cancer. J. Pers. Med. 2022, 12, 551. [Google Scholar] [CrossRef]
- Sadowski, E.A.; Lees, B.; McMillian, A.B.; Kusmirek, J.E.; Cho, S.Y.; Barroilhet, L.M. Distribution of prostate specific membrane antigen (PSMA) on PET-MRI in patients with and without ovarian cancer. Abdom. Radiol. 2023, 48, 3643–3652. [Google Scholar] [CrossRef]
- Wernicke, A.G.; Kim, S.; Liu, H.; Bander, N.H.; Pirog, E.C. Prostate-specific Membrane Antigen (PSMA) Expression in the Neovasculature of Gynecologic Malignancies: Implications for PSMA-targeted Therapy. Appl. Immunohistochem. Mol. Morphol. 2017, 25, 271–276. [Google Scholar] [CrossRef]
- Tumedei, M.M.; Ravaioli, S.; Matteucci, F.; Celli, M.; De Giorgi, U.; Gunelli, R.; Puccetti, M.; Paganelli, G.; Bravaccini, S. Spotlight on PSMA as a new theranostic biomarker for bladder cancer. Sci. Rep. 2021, 11, 9777. [Google Scholar] [CrossRef] [PubMed]
- Bychkov, A.; Vutrapongwatana, U.; Tepmongkol, S.; Keelawat, S. PSMA expression by microvasculature of thyroid tumors—Potential implications for PSMA theranostics. Sci. Rep. 2017, 7, 5202. [Google Scholar] [CrossRef]
- de Vries, L.H.; Lodewijk, L.; Braat, A.J.; Krijger, G.C.; Valk, G.D.; Lam, M.G.; Borel Rinkes, I.H.; Vriens, M.R.; de Keizer, B. 68Ga-PSMA PET/CT in radioactive iodine-refractory differentiated thyroid cancer and first treatment results with 177Lu-PSMA-617. EJNMMI Res. 2020, 10, 18. [Google Scholar] [CrossRef] [PubMed]
- Uijen, M.J.M.; Derks, Y.H.W.; Merkx, R.I.J.; Schilham, M.G.M.; Roosen, J.; Privé, B.M.; van Lith, S.A.M.; van Herpen, C.M.L.; Gotthardt, M.; Heskamp, S.; et al. PSMA radioligand therapy for solid tumors other than prostate cancer: Background, opportunities, challenges, and first clinical reports. Eur. J. Nucl. Med. Mol. Imaging 2021, 48, 4350–4368. [Google Scholar] [CrossRef] [PubMed]
- Cuda, T.J.; Riddell, A.D.; Liu, C.; Whitehall, V.L.; Borowsky, J.; Wyld, D.K.; Burge, M.E.; Ahern, E.; Griffin, A.; Lyons, N.J.; et al. PET Imaging Quantifying 68Ga-PSMA-11 Uptake in Metastatic Colorectal Cancer. J. Nucl. Med. 2020, 61, 1576–1579. [Google Scholar] [CrossRef]
- Nomura, N.; Pastorino, S.; Jiang, P.; Lambert, G.; Crawford, J.R.; Gymnopoulos, M.; Piccioni, D.; Juarez, T.; Pingle, S.C.; Makale, M.; et al. Prostate specific membrane antigen (PSMA) expression in primary gliomas and breast cancer brain metastases. Cancer Cell Int. 2014, 14, 26. [Google Scholar] [CrossRef]
- Holzgreve, A.; Biczok, A.; Ruf, V.C.; Liesche-Starnecker, F.; Steiger, K.; Kirchner, M.A.; Unterrainer, M.; Mittlmeier, L.; Herms, J.; Schlegel, J.; et al. PSMA Expression in Glioblastoma as a Basis for Theranostic Approaches: A Retrospective, Correlational Panel Study Including Immunohistochemistry, Clinical Parameters and PET Imaging. Front. Oncol. 2021, 11, 646387. [Google Scholar] [CrossRef]
- Pruis, I.J.; van Doormaal, P.J.; Balvers, R.K.; Bent, M.J.v.D.; Harteveld, A.A.; de Jong, L.C.; Konijnenberg, M.W.; Segbers, M.; Valkema, R.; Verburg, F.A.; et al. Potential of PSMA-targeting radioligand therapy for malignant primary and secondary brain tumours using super-selective intra-arterial administration: A single centre, open label, non-randomised prospective imaging study. EBioMedicine 2024, 102, 105068. [Google Scholar] [CrossRef]
- Kunikowska, J.; Charzynska, I.; Kulinski, R.; Pawlak, D.; Maurin, M.; Krolicki, L. Tumor uptake in glioblastoma multiforme after IV injection of [177Lu]Lu-PSMA-617. Eur. J. Nucl. Med. Mol. Imaging 2020, 47, 1605–1606. [Google Scholar] [CrossRef]
- Salas Fragomeni, R.A.; Menke, J.R.; Holdhoff, M.; Ferrigno, C.C.; Laterra, J.J.; Solnes, L.B.M.; Javadi, M.S.; Szabo, Z.; Pomper, M.G.; Rowe, S.P. Prostate-Specific Membrane Antigen-Targeted Imaging With [18F]DCFPyL in High-Grade Gliomas. Clin. Nucl. Med. 2017, 42, e433–e435. [Google Scholar] [CrossRef]
- Verma, P.; Malhotra, G.; Goel, A.; Rakshit, S.; Chandak, A.; Chedda, R.; Banerjee, S.; Asopa, R.V. Differential Uptake of 68Ga-PSMA-HBED-CC (PSMA-11) in Low-Grade Versus High-Grade Gliomas in Treatment-Naive Patients. Clin. Nucl. Med. 2019, 44, e318–e322. [Google Scholar] [PubMed]
- Graef, J.; Bluemel, S.; Brenner, W.; Amthauer, H.; Truckenmueller, P.; Kaul, D.; Vajkoczy, P.; Onken, J.S.; Furth, C. [177Lu]Lu-PSMA Therapy as an Individual Treatment Approach for Patients with High-Grade Glioma: Dosimetry Results and Critical Statement. J. Nucl. Med. 2023, 64, 892–895. [Google Scholar] [PubMed]
- Truckenmueller, P.; Graef, J.; Scheel, M.; Vajkoczy, P.; Capper, D.; Kaul, D.; Furth, C.; Amthauer, H.; Brenner, W.; Onken, J.S. [68Ga]Ga-PSMA PET/MRI, histological PSMA expression and preliminary experience with [177Lu]Lu-PSMA therapy in relapsing high-grade glioma. Front. Oncol. 2022, 12, 980058. [Google Scholar]
- Kranzbuhler, B.; Salemi, S.; Umbricht, C.A.; Müller, C.; Burger, I.A.; Sulser, T.; Eberli, D. Pharmacological upregulation of prostate-specific membrane antigen (PSMA) expression in prostate cancer cells. Prostate 2018, 78, 758–765. [Google Scholar] [PubMed]
- Emmett, L.; Crumbaker, M.; Ho, B.; Willowson, K.; Eu, P.; Ratnayake, L.; Epstein, R.; Blanksby, A.; Horvath, L.; Guminski, A.; et al. Results of a Prospective Phase 2 Pilot Trial of 177Lu-PSMA-617 Therapy for Metastatic Castration-Resistant Prostate Cancer Including Imaging Predictors of Treatment Response and Patterns of Progression. Clin. Genitourin. Cancer 2019, 17, 15–22. [Google Scholar] [CrossRef]
- Hope, T.A.; Truillet, C.C.; Ehman, E.C.; Afshar-Oromieh, A.; Aggarwal, R.; Ryan, C.J.; Carroll, P.R.; Small, E.J.; Evans, M.J. 68Ga-PSMA-11 PET Imaging of Response to Androgen Receptor Inhibition: First Human Experience. J. Nuc.l Med. 2017, 58, 81–84. [Google Scholar]
- Shapiro, J.A.; Gaonkar, K.S.; Spielman, S.J.; Savonen, C.L.; Bethell, C.J.; Jin, R.; Rathi, K.S.; Zhu, Y.; Egolf, L.E.; Farrow, B.K.; et al. OpenPBTA: The Open Pediatric Brain Tumor Atlas. Cell Genom. 2023, 3, 100340. [Google Scholar]
- Cancer Genome Atlas Research Network; Weinstein, J.N.; Collisson, E.A.; Mills, G.B.; Shaw, K.R.; Ozenberger, B.A.; Ellrott, K.; Shmulevich, I.; Sander, C.; Stuart, J.M. The Cancer Genome Atlas Pan-Cancer analysis project. Nat. Genet. 2013, 45, 1113–1120. [Google Scholar]
- Lonsdale, J.; Thomas, J.; Salvatore, M.; Phillips, R.; Lo, E.; Shad, S.; Hasz, R.; Walters, G.; Garcia, F.; Young, N.; et al. The Genotype-Tissue Expression (GTEx) project. Nat. Genet. 2013, 45, 580–585. [Google Scholar] [CrossRef]
- Lilly, J.V.; Rokita, J.L.; Mason, J.L.; Patton, T.; Stefankiewiz, S.; Higgins, D.; Trooskin, G.; Larouci, C.A.; Arya, K.; Appert, E.; et al. The children’s brain tumor network (CBTN)—Accelerating research in pediatric central nervous system tumors through collaboration and open science. Neoplasia 2023, 35, 100846. [Google Scholar] [CrossRef]
- Love, M.I.; Huber, W.; Anders, S. Moderated estimation of fold change and dispersion for RNA-seq data with DESeq2. Genome Biol. 2014, 15, 550. [Google Scholar]
- Sandgren, K.; Johansson, L.; Axelsson, J.; Jonsson, J.; Ögren, M.; Ögren, M.; Andersson, M.; Strandberg, S.; Nyholm, T.; Riklund, K.; et al. Radiation dosimetry of [68Ga]PSMA-11 in low-risk prostate cancer patients. EJNMMI Phys. 2019, 6, 2. [Google Scholar] [PubMed]
- Piron, S.; De Man, K.; Van Laeken, N.; D’Asseler, Y.; Bacher, K.; Kersemans, K.; Ost, P.; Decaestecker, K.; Deseyne, P.; Fonteyne, V.; et al. Radiation Dosimetry and Biodistribution of 18F-PSMA-11 for PET Imaging of Prostate Cancer. J. Nucl. Med. 2019, 60, 1736–1742. [Google Scholar] [PubMed]
- Arvanitis, C.D.; Ferraro, G.B.; Jain, R.K. The blood-brain barrier and blood-tumour barrier in brain tumours and metastases. Nat. Rev. Cancer 2020, 20, 26–41. [Google Scholar] [PubMed]
- Lindemann, M.; Oteiza, A.; Martin-Armas, M.; Guttormsen, Y.; Moldes-Anaya, A.; Berzaghi, R.; Bogsrud, T.V.; Bach-Gansmo, T.; Sundset, R.; Kranz, M. Glioblastoma PET/MRI: Kinetic investigation of [18F]rhPSMA-7.3, [18F]FET and [18F]fluciclovine in an orthotopic mouse model of cancer. Eur. J. Nucl. Med. Mol. Imaging 2023, 50, 1183–1194. [Google Scholar]
- Belykh, E.; Shaffer, K.V.; Lin, C.; Byvaltsev, V.A.; Preul, M.C.; Chen, L. Blood-Brain Barrier, Blood-Brain Tumor Barrier, and Fluorescence-Guided Neurosurgical Oncology: Delivering Optical Labels to Brain Tumors. Front. Oncol. 2020, 10, 739. [Google Scholar] [CrossRef]
- Treps, L.; Perret, R.; Edmond, S.; Ricard, D.; Gavard, J. Glioblastoma stem-like cells secrete the pro-angiogenic VEGF-A factor in extracellular vesicles. J. Extracell. Vesicles 2017, 6, 1359479. [Google Scholar] [CrossRef]
- Heesch, A.; Ortmanns, L.; Maurer, J.; Stickeler, E.; Sahnoun, S.E.M.; Mottaghy, F.M.; Morgenroth, A. The Potential of PSMA as a Vascular Target in TNBC. Cells 2023, 12, 551. [Google Scholar] [CrossRef]
- Alves, A.L.V.; Gomes, I.N.F.; Carloni, A.C.; Rosa, M.N.; da Silva, L.S.; Evangelista, A.F.; Reis, R.M.; Silva, V.A.O. Role of glioblastoma stem cells in cancer therapeutic resistance: A perspective on antineoplastic agents from natural sources and chemical derivatives. Stem Cell Res. Ther. 2021, 12, 206. [Google Scholar]

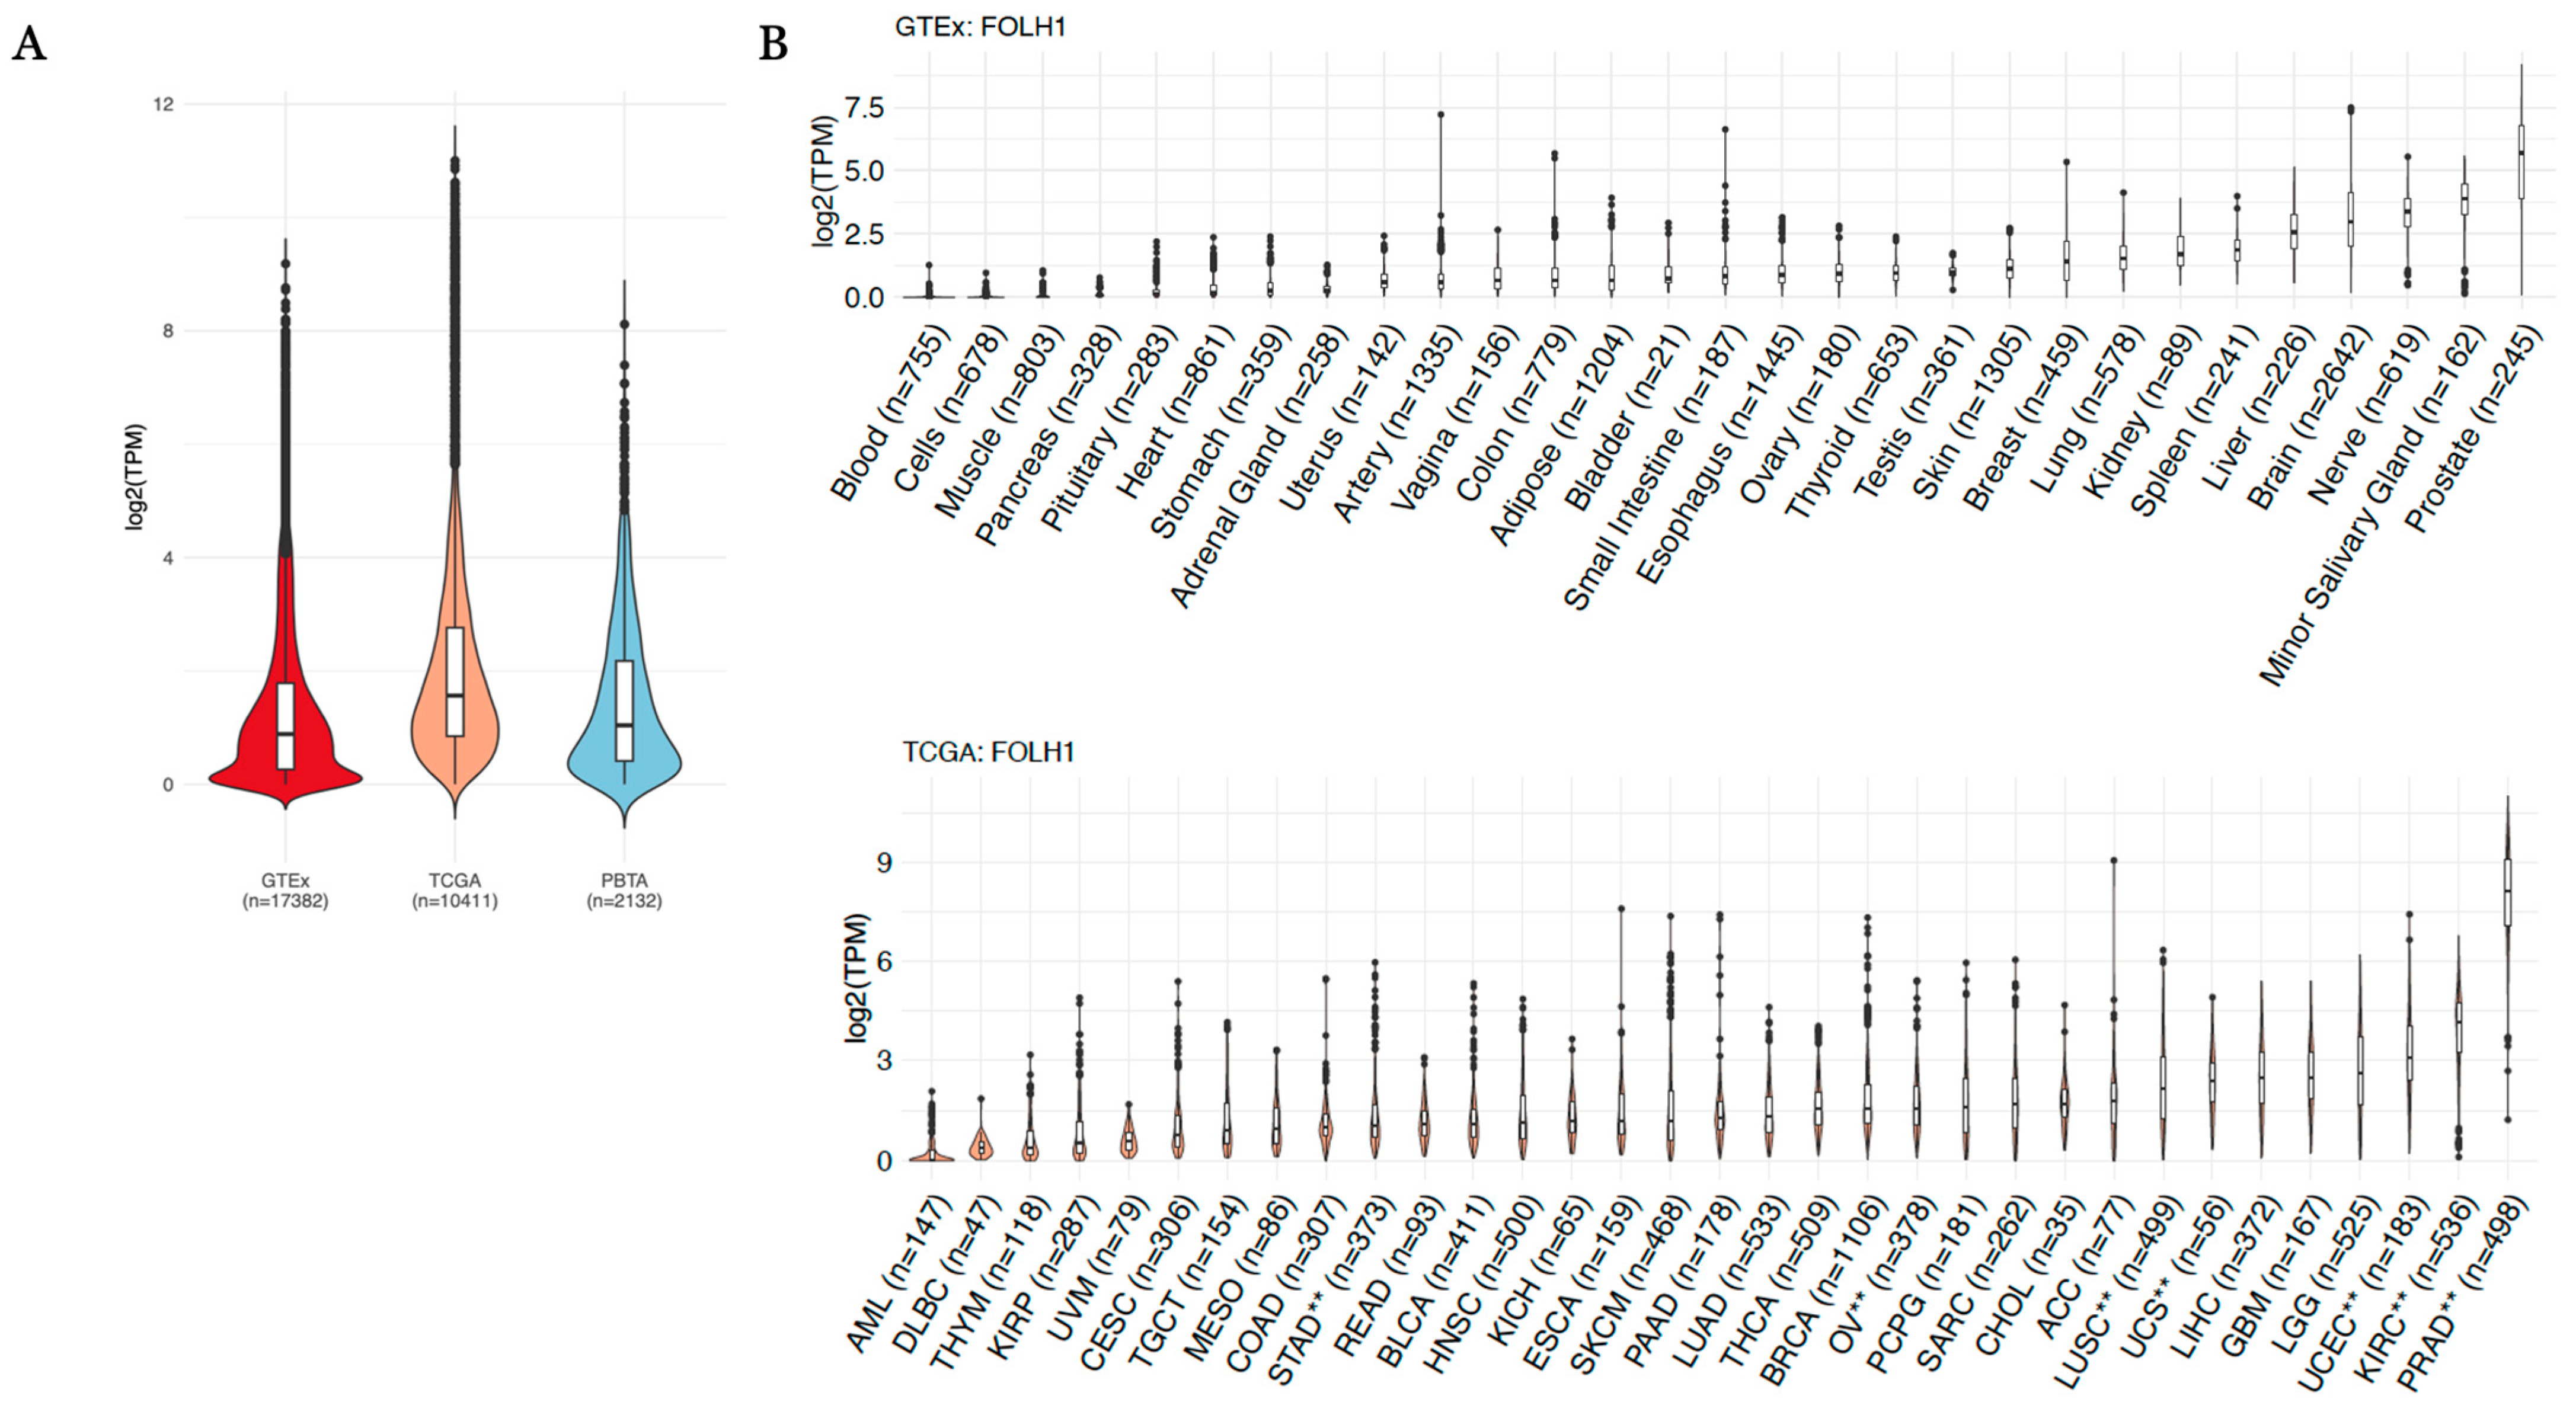
| FOLH1 Comparison | Log2(Fold Change) | Direction vs. Normal Tissue | Adjusted p-Value |
|---|---|---|---|
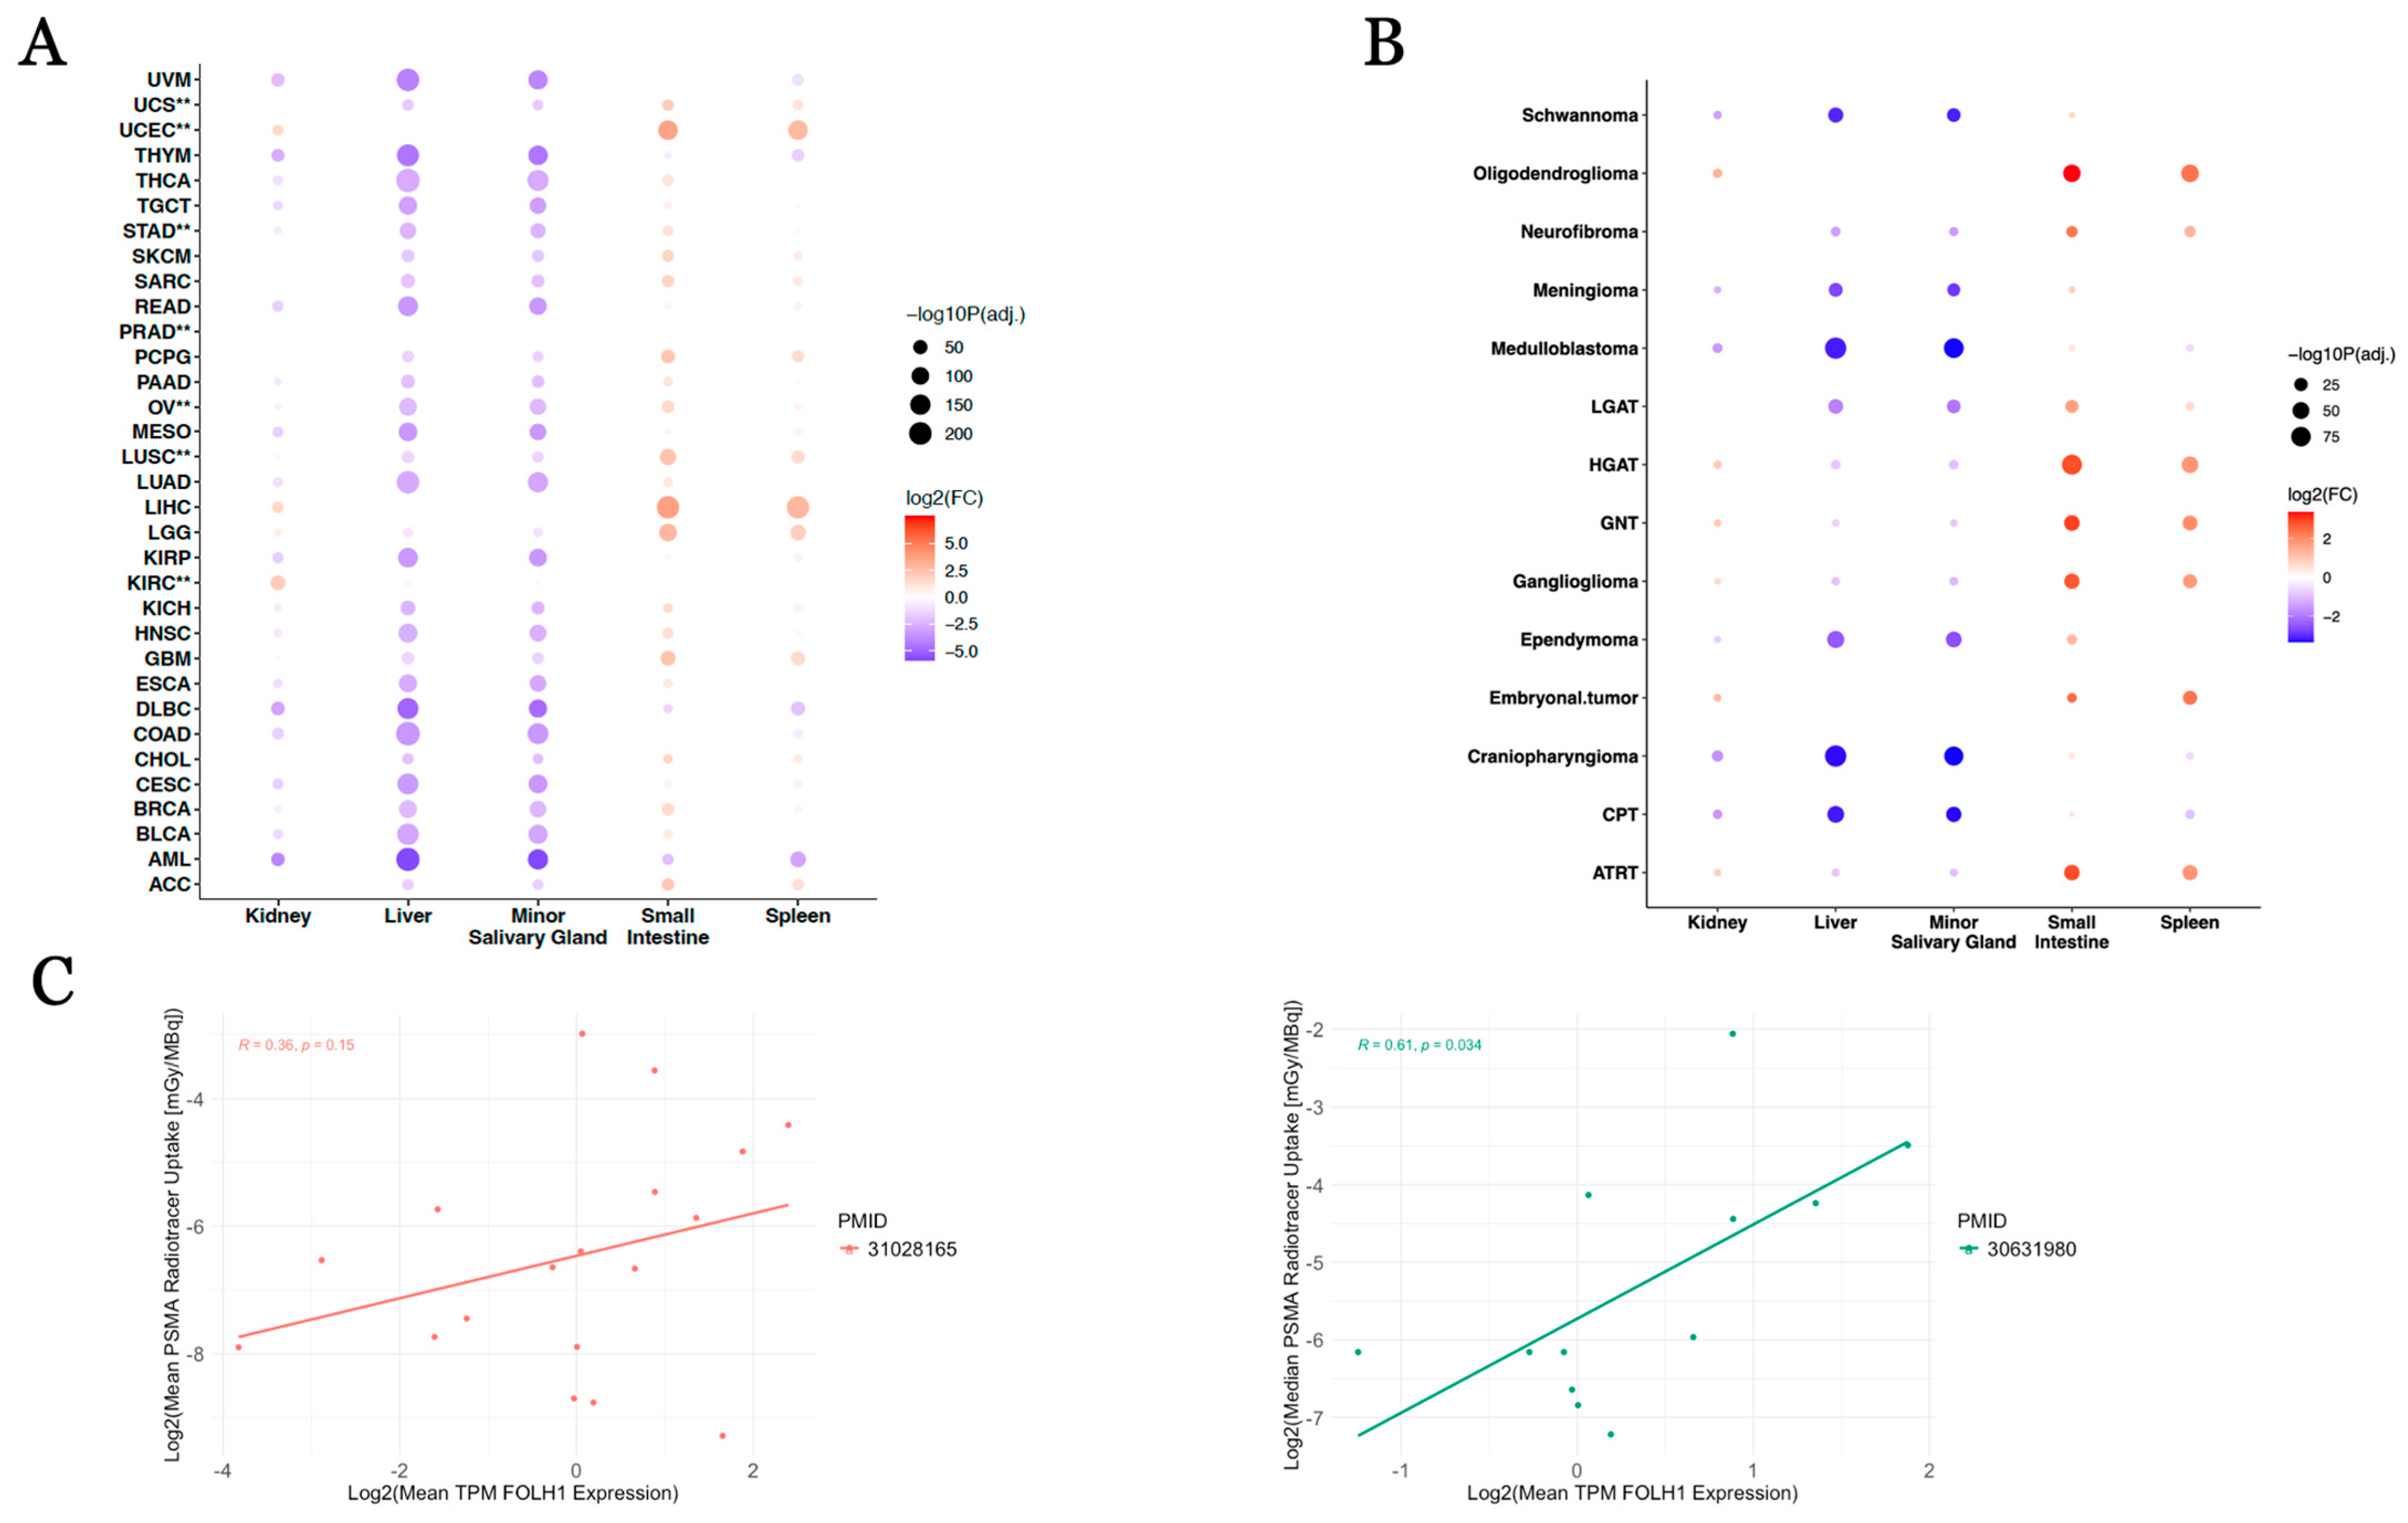
| GBM_vs._Brain | −1.734 | Down | 5.84 × 10−43 |
| KIRP_vs._Kidney | −1.699 | Down | 2.25 × 10⁻¹⁷ |
| ACC_vs._Minor.Salivary.Gland | −1.551 | Down | 8.74 × 10⁻¹⁷ |
| LGG_vs._Brain | −1.290 | Down | 1.26 × 10−64 |
| KICH_vs._Kidney | −0.645 | Down | 3.57 × 10⁻⁴ |
| LUAD_vs._Lung | 0.534 | Up | 9.12 × 10⁻¹⁷ |
| BRCA_vs._Breast | 0.742 | Up | 3.80 × 10⁻²⁰ |
| READ_vs._Colon | 0.853 | Up | 5.16 × 10⁻⁹ |
| COAD_vs._Colon | 0.958 | Up | 1.42 × 10⁻²⁹ |
| BLCA_vs._Bladder | 1.052 | Up | 6.99 × 10⁻⁴ |
| ESCA_vs._Esophagus | 1.240 | Up | 7.33 × 10−47 |
| CESC_vs._Vagina | 1.507 | Up | 1.24 × 10⁻²⁵ |
| SKCM_vs._Skin | 1.885 | Up | 2.44 × 10−165 |
| THCA_vs._Thyroid | 1.896 | Up | 4.10 × 10−260 |
| LUSC **_vs._Lung | 2.009 | Up | 6.41 × 10−153 |
| KIRC **_vs._Kidney | 2.033 | Up | 2.69 × 10−56 |
| OV **_vs._Ovary | 2.119 | Up | 5.11 × 10−82 |
| PRAD **_vs._Prostate | 2.743 | Up | 5.65 × 10−134 |
| STAD **_vs._Stomach | 2.829 | Up | 1.66 × 10−130 |
| UCS **_vs._Uterus | 3.530 | Up | 9.72 × 10−92 |
| UCEC **_vs._Uterus | 5.103 | Up | 7.75 × 10−269 |
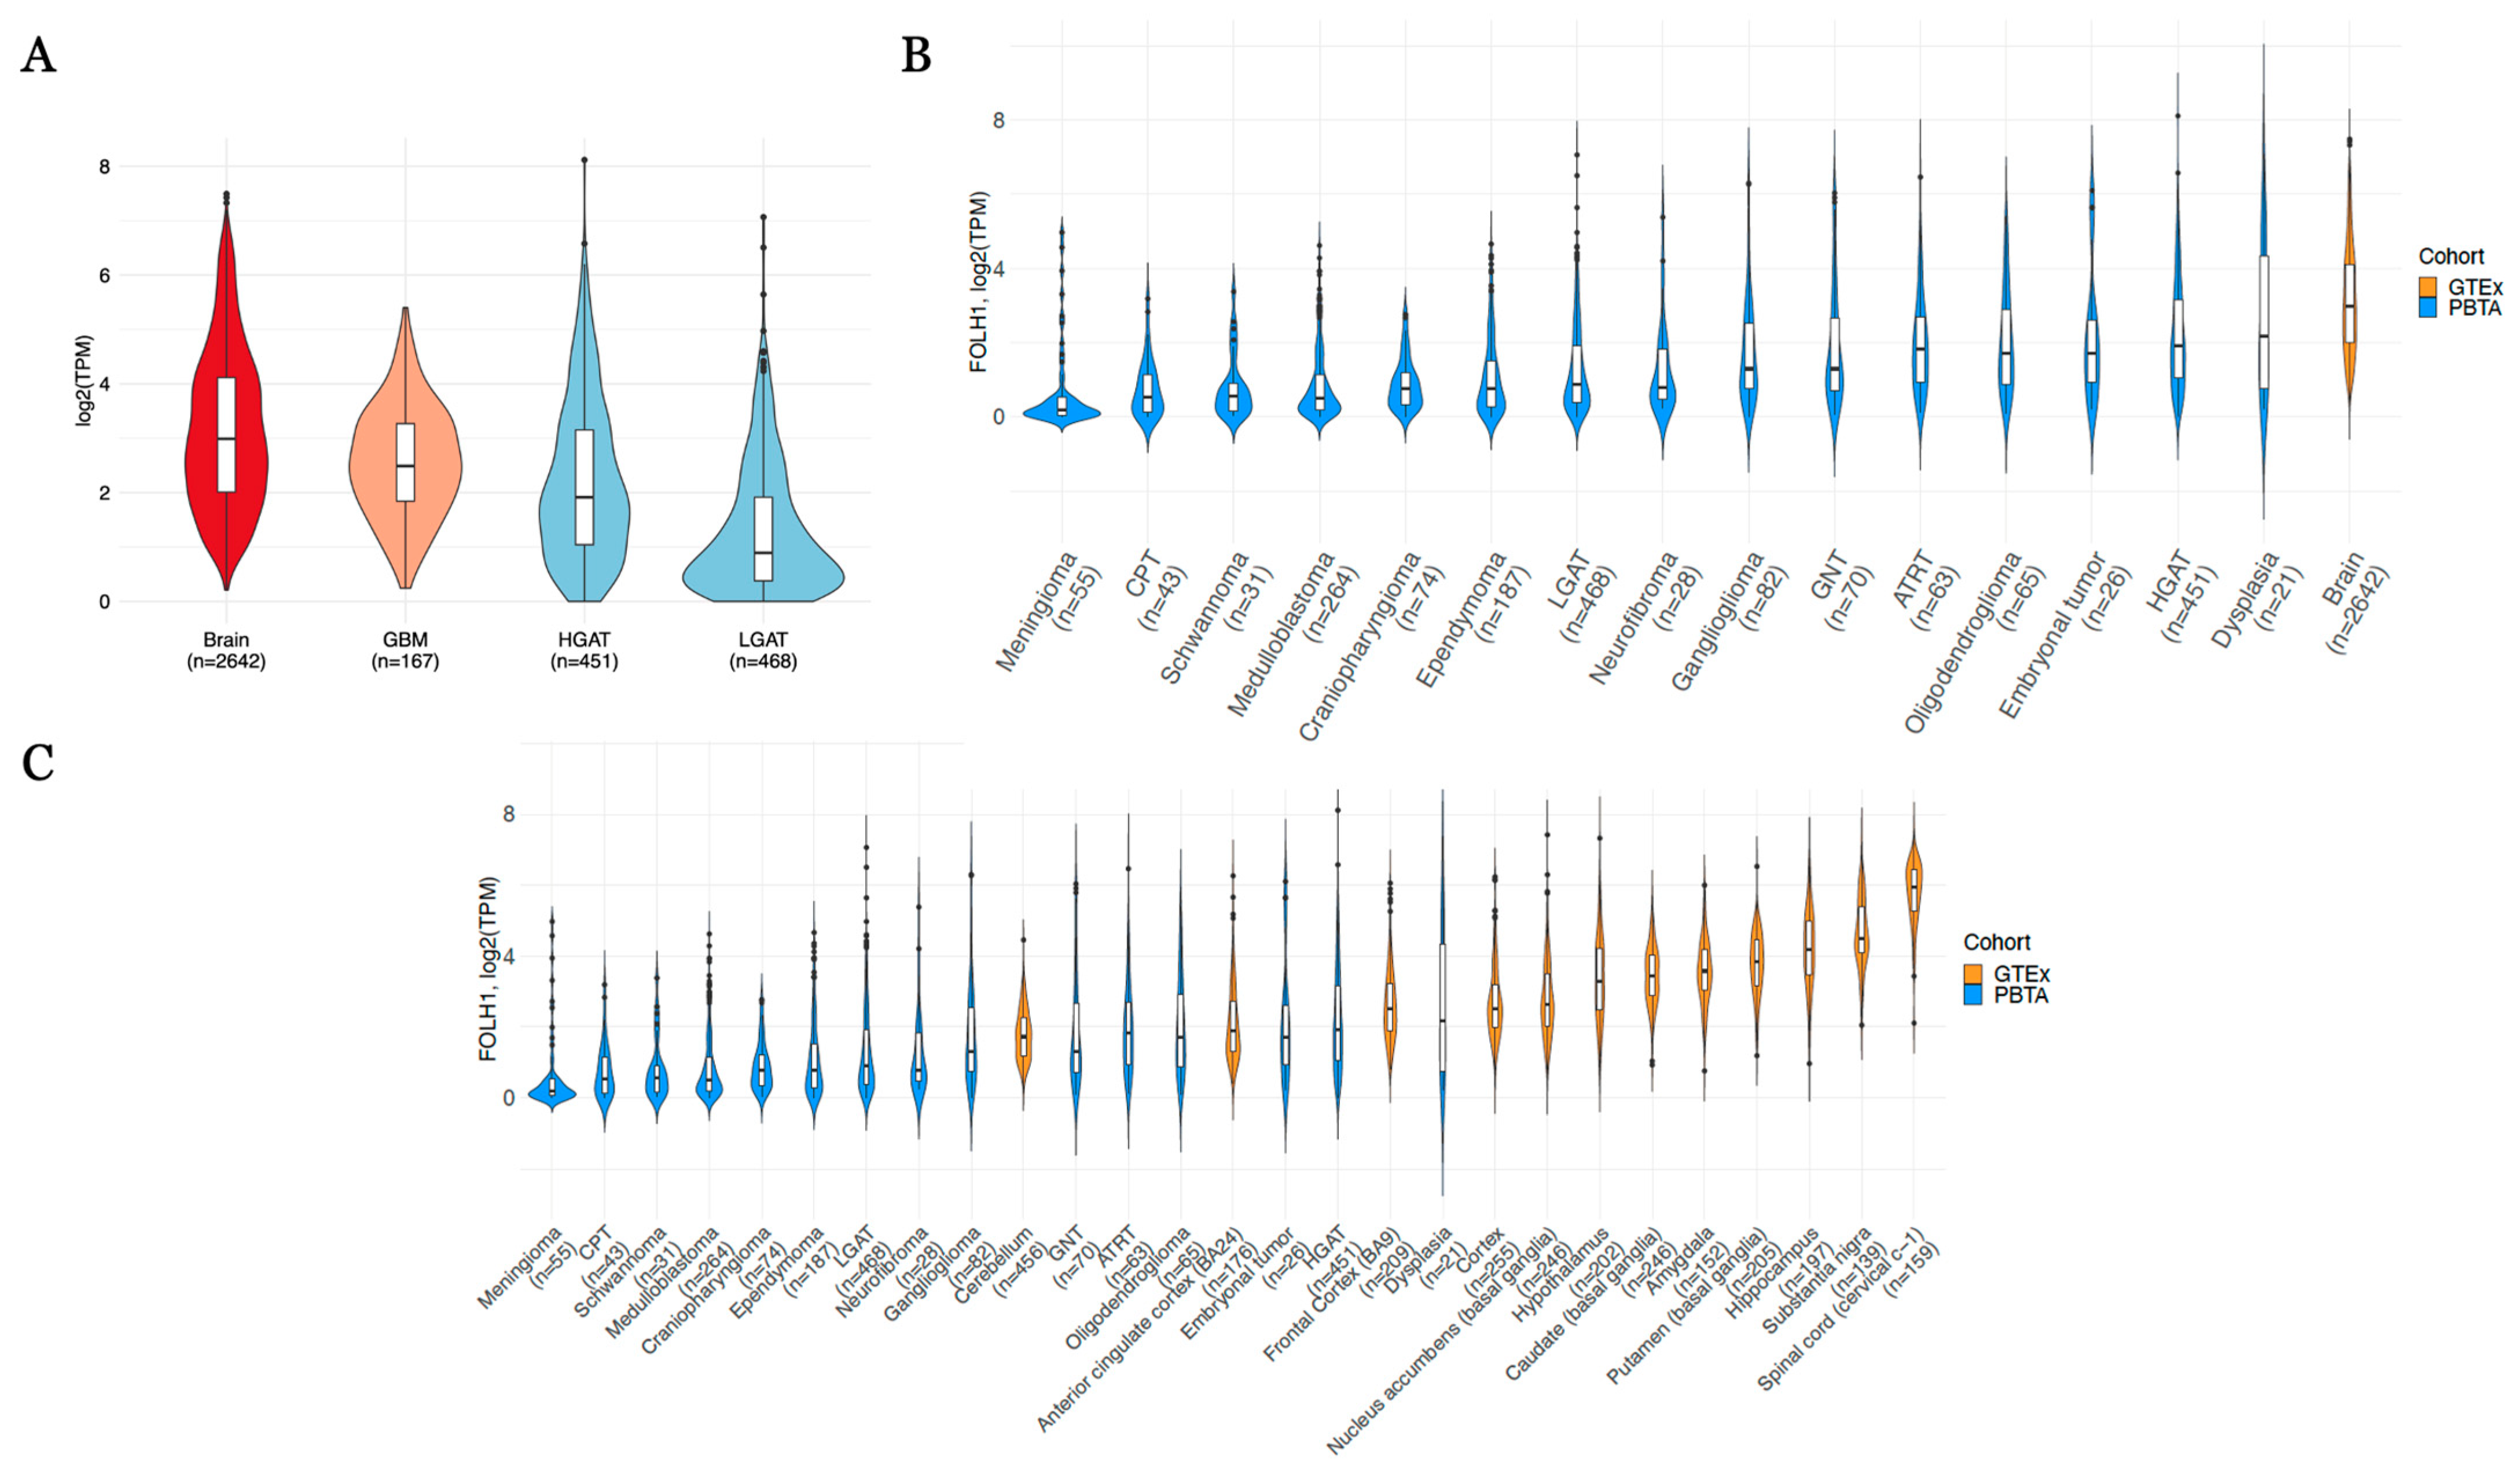
| FOLH1 Comparison | Log2(Fold Change) | Direction vs. Normal Tissue | Adjusted p-Value |
|---|---|---|---|
| Craniopharyngioma_vs._Brain | −3.570 | Down | 2.47 × 10−79 |
| CPT_vs._Brain | −3.549 | Down | 1.17 × 10−46 |
| Schwannoma_vs._Brain | −3.527 | Down | 9.30 × 10⁻²⁸ |
| Medulloblastoma_vs._Brain | −3.504 | Down | 9.08 × 10−239 |
| Meningioma_vs._Brain | −2.823 | Down | 7.94 × 10⁻³³ |
| Ependymoma_vs._Brain | −2.715 | Down | 1.03 × 10−103 |
| LGAT_vs._Brain | −2.143 | Down | 1.01 × 10−143 |
| Neurofibroma_vs._Brain | −1.761 | Down | 5.61 × 10⁻⁸ |
| Embryonal tumor_vs._Brain | −1.751 | Down | 3.93 × 10⁻⁶ |
| Ganglioglioma_vs._Brain | −1.398 | Down | 4.43 × 10⁻¹⁴ |
| HGAT_vs._Brain | −1.340 | Down | 1.40 × 10−47 |
| ATRT_vs._Brain | −1.096 | Down | 1.05 × 10⁻⁷ |
| GNT_vs._Brain | −1.080 | Down | 2.18 × 10⁻⁷ |
| Oligodendroglioma_vs._Brain | −0.551 | Down | 7.94 × 10⁻³ |
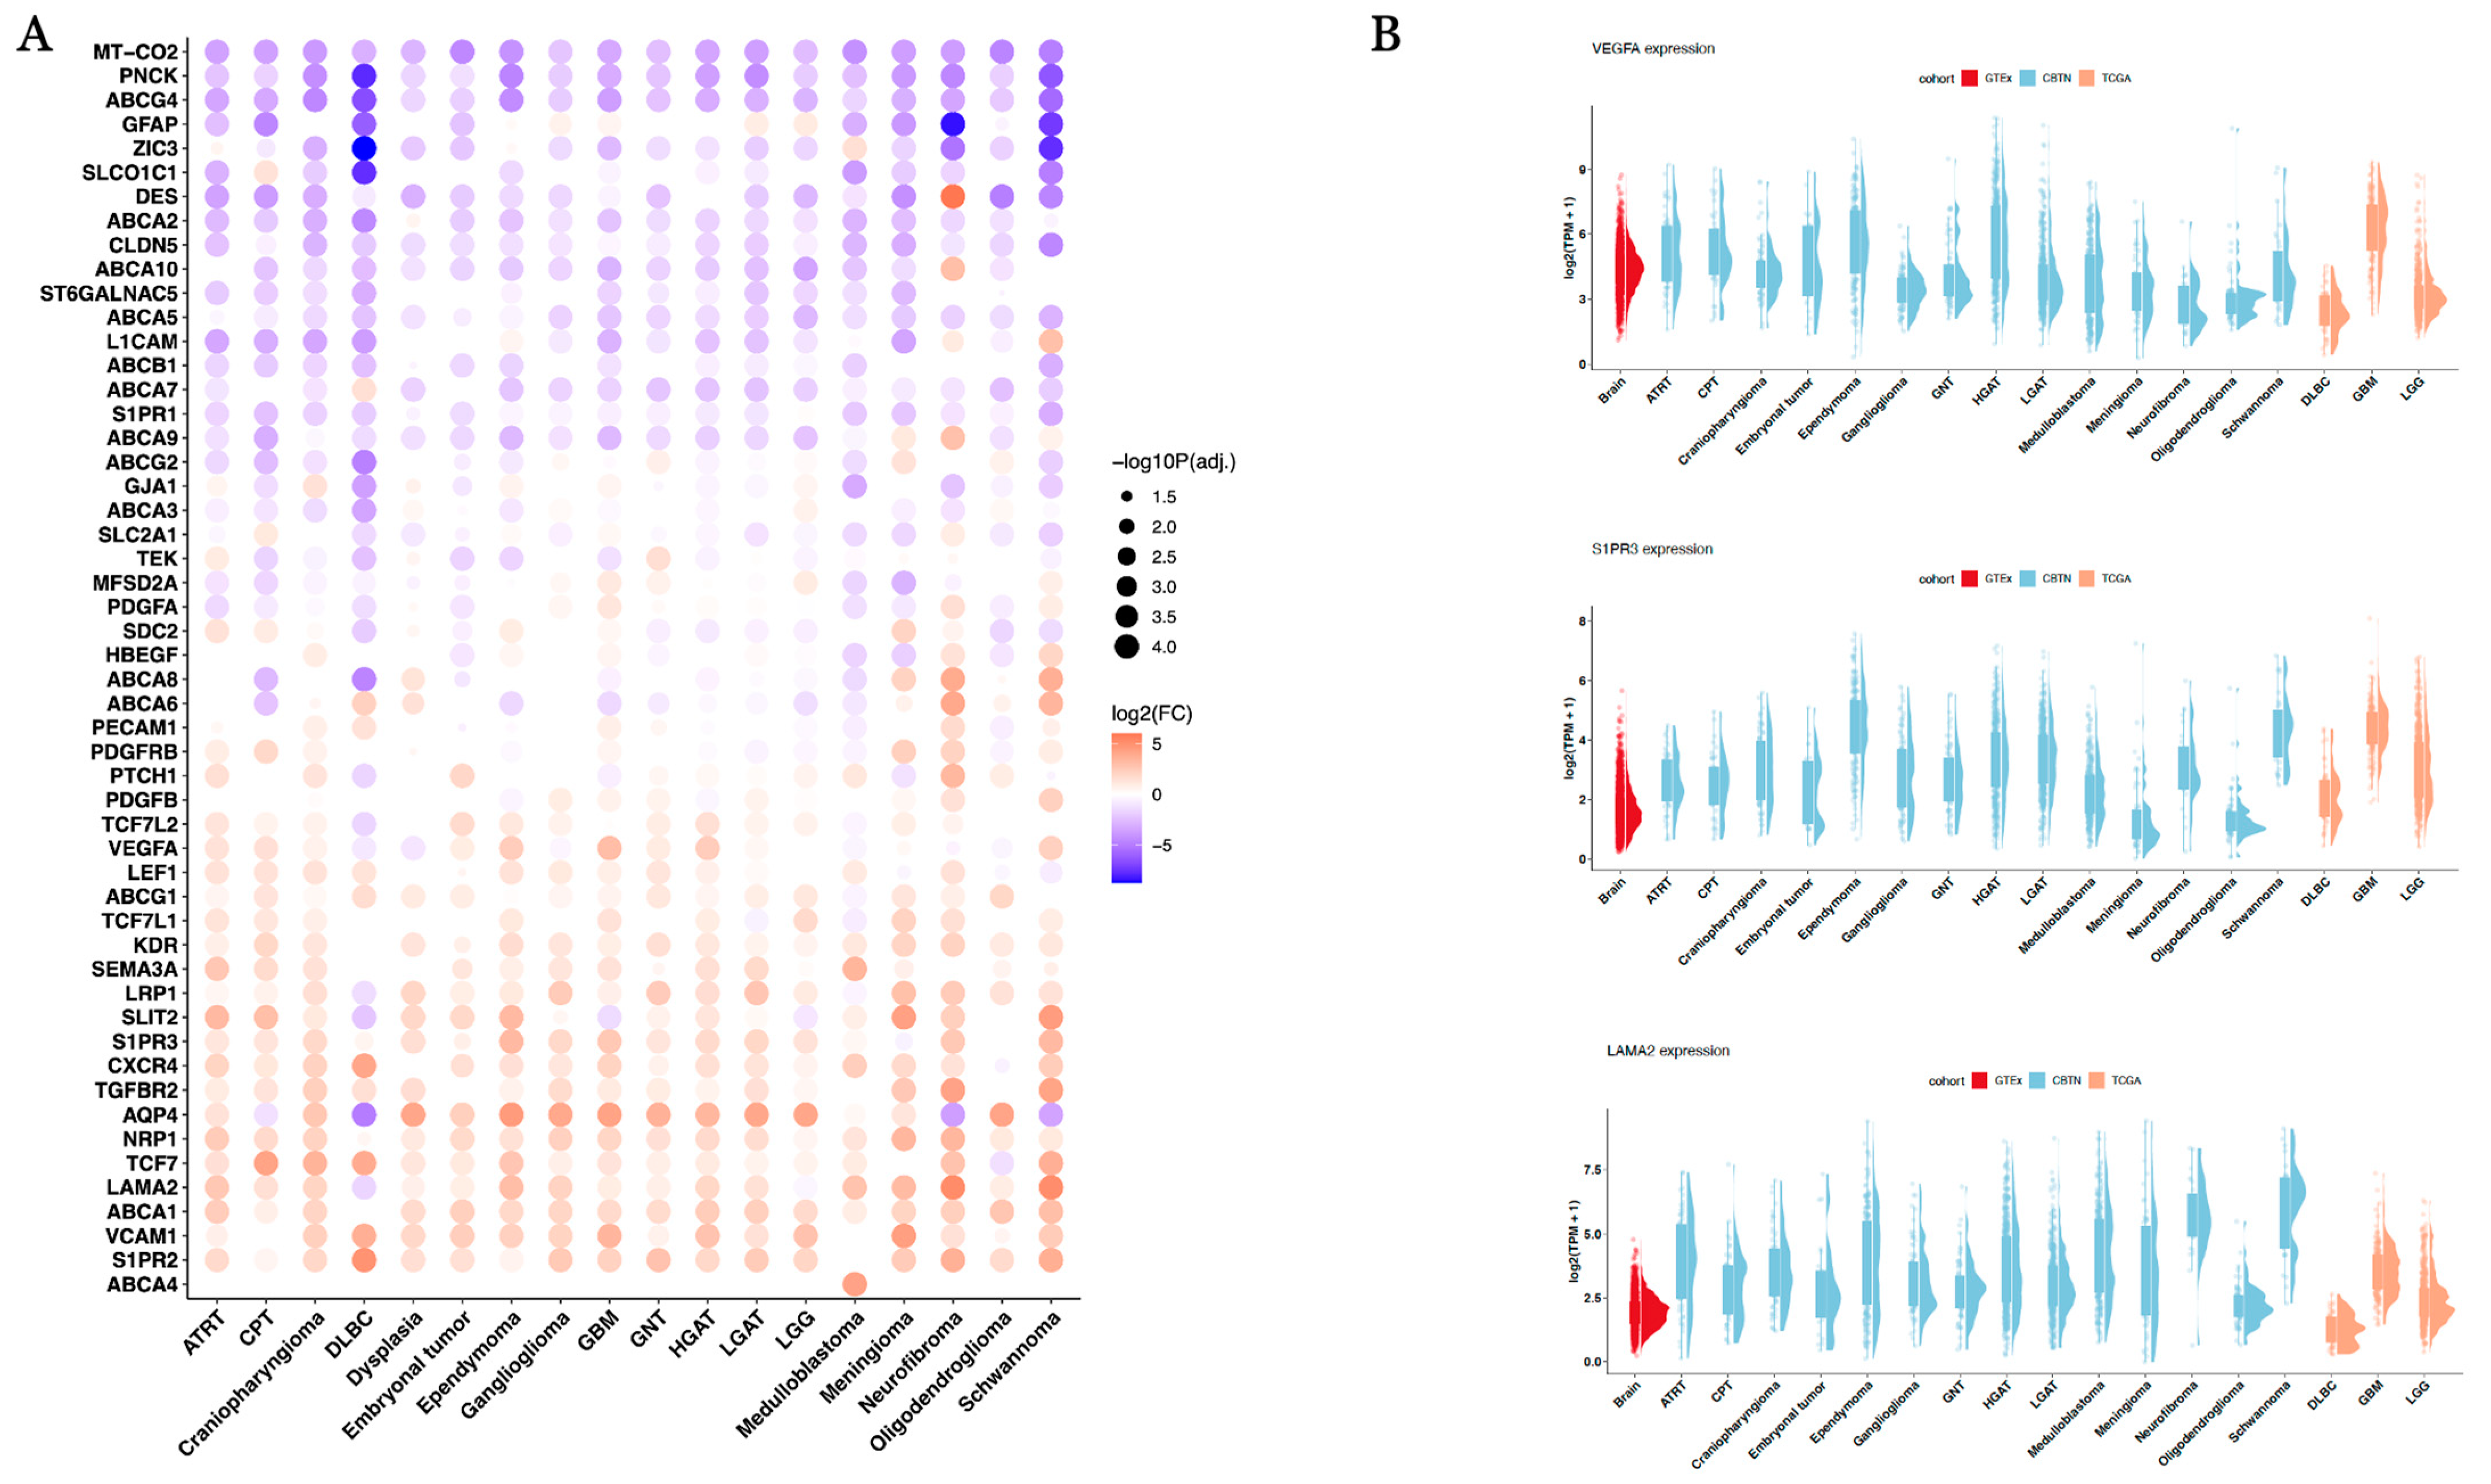
| Comparison | Gene | Log2(Fold Change) | Direction Versus Normal Brain Tissue | Adjusted p-Value |
|---|---|---|---|---|
| GBM_vs._Brain | LAMA2 | 0.93 | Up | 1.52 × 10−47 |
| GBM_vs._Brain | S1PR3 | 2.51 | Up | 2.64 × 10−171 |
| GBM_vs._Brain | VEGFA | 3.06 | Up | <1 × 10−300 |
| HGAT_vs._Brain | LAMA2 | 2.06 | Up | <1 × 10−300 |
| HGAT_vs._Brain | S1PR3 | 1.68 | Up | 8.94 × 10−184 |
| HGAT_vs._Brain | VEGFA | 2.17 | Up | <1 × 10−300 |
| LGAT_vs._Brain | LAMA2 | 1.45 | Up | 2.45 × 10−216 |
| LGAT_vs._Brain | S1PR3 | 1.88 | Up | 5.32 × 10−251 |
| LGAT_vs._Brain | VEGFA | 0.42 | Up | 9.75 × 10⁻¹⁷ |
| LGG_vs._Brain | LAMA2 | −0.32 | Down | 2.79 × 10⁻¹⁵ |
| LGG_vs._Brain | S1PR3 | 1.38 | Up | 1.05 × 10−136 |
| LGG_vs._Brain | VEGFA | −0.06 | Down | 0.19 |
Disclaimer/Publisher’s Note: The statements, opinions and data contained in all publications are solely those of the individual author(s) and contributor(s) and not of MDPI and/or the editor(s). MDPI and/or the editor(s) disclaim responsibility for any injury to people or property resulting from any ideas, methods, instructions or products referred to in the content. |
© 2025 by the authors. Licensee MDPI, Basel, Switzerland. This article is an open access article distributed under the terms and conditions of the Creative Commons Attribution (CC BY) license (https://creativecommons.org/licenses/by/4.0/).
Share and Cite
Kraya, A.; Rathi, K.; Jin, R.; Kesherwani, V.; Resnick, A.C.; Storm, P.B.; Nabavizadeh, A. Evaluating the Potential of PSMA Targeting in CNS Tumors: Insights from Large-Scale Transcriptome Profiling. Cancers 2025, 17, 1239. https://doi.org/10.3390/cancers17071239
Kraya A, Rathi K, Jin R, Kesherwani V, Resnick AC, Storm PB, Nabavizadeh A. Evaluating the Potential of PSMA Targeting in CNS Tumors: Insights from Large-Scale Transcriptome Profiling. Cancers. 2025; 17(7):1239. https://doi.org/10.3390/cancers17071239
Chicago/Turabian StyleKraya, Adam, Komal Rathi, Run Jin, Varun Kesherwani, Adam C. Resnick, Phillip B. Storm, and Ali Nabavizadeh. 2025. "Evaluating the Potential of PSMA Targeting in CNS Tumors: Insights from Large-Scale Transcriptome Profiling" Cancers 17, no. 7: 1239. https://doi.org/10.3390/cancers17071239
APA StyleKraya, A., Rathi, K., Jin, R., Kesherwani, V., Resnick, A. C., Storm, P. B., & Nabavizadeh, A. (2025). Evaluating the Potential of PSMA Targeting in CNS Tumors: Insights from Large-Scale Transcriptome Profiling. Cancers, 17(7), 1239. https://doi.org/10.3390/cancers17071239