Article

Stromal Versican Accumulation and Proteolysis Regulate the Infiltration of CD8+ T Cells in Breast Cancer

by
Philip B. Emmerich
1,2,
Tonela Qyli
1,
Katherine A. Johnson
1,
Somak Chaudhuri
1,
Kristen M. Clark
1,
Nathaniel B. Verhagen
1,
Mitchell G. Depke
1,
Linda Clipson
3,
Cheri A. Pasch
4,
Athanasios Papadas
2,5,
Mark E. Burkard
1,3,4,
Kari B. Wisinski
1,4,
Stephanie M. McGregor
6,
Fotis Asimakopoulos
5 and
Dustin A. Deming
1,3,4,*
1
Division of Hematology and Oncology, Department of Medicine, University of Wisconsin-Madison, Madison, WI 53705, USA
2
Cellular and Molecular Pathology Graduate Program, Department of Pathology and Laboratory Medicine, University of Wisconsin-Madison, Madison, WI 53705, USA
3
McArdle Laboratory for Cancer Research, Department of Oncology, University of Wisconsin-Madison, Madison, WI 53705, USA
4
University of Wisconsin Carbone Cancer Center, University of Wisconsin-Madison, Madison, WI 53705, USA
5
Division of Blood and Marrow Transplantation and Moores Cancer Center, University of California-San Diego, La Jolla, CA 92093, USA
6
Department of Pathology and Laboratory Medicine, University of Wisconsin-Madison, Madison, WI 53705, USA
*
Author to whom correspondence should be addressed.
Cancers 2025, 17(9), 1435; https://doi.org/10.3390/cancers17091435
Submission received: 14 February 2025 / Revised: 28 March 2025 / Accepted: 18 April 2025 / Published: 25 April 2025
(This article belongs to the Section Molecular Cancer Biology)

Simple Summary

While clinical trials for immunotherapy in breast cancer have been promising, better markers that predict which patients may respond are needed. Versican is a protein abundant in many cancers that has been associated with the infiltration of CD8+ tumor-infiltrating lymphocytes. In this study, we aim to investigate the potential for the accumulation and proteolysis of versican to act as a biomarker for immunotherapy response in breast cancer by evaluating the relationship between versican, its proteolysis, and the infiltration of CD8+ tumor-infiltrating lymphocytes. We find a strong inverse correlation between versican accumulation and lymphocyte infiltration, warranting further investigation into versican as a potential biomarker of immunotherapy response in breast cancer.

Abstract

Background/Objectives: Recent clinical trials in breast cancer have demonstrated that some patients benefit from immune checkpoint blockade, though better predictive markers are needed. The accumulation of the immunomodulatory matrix proteoglycan versican (VCAN) can predict the exclusion of CD8+ tumor-infiltrating lymphocytes (TILs) in some settings and, thus, is evaluated in breast cancer here. Methods: A total of 230 breast cancers were analyzed for VCAN accumulation, VCAN proteolysis, and CD8+ TILs. CD8+ TILs were categorized based on their localization in the tumor epithelial or stromal compartments. Results: VCAN accumulation was detected in 90% of breast cancers, more commonly in ER+ tumors (93% vs. 77%; p < 0.001). MCF7 cells treated with estrogen upregulate VCAN without an enhanced expression of ADAMTS-proteases. VCAN-undetectable tumors demonstrate greater CD8+ TILs compared to VCAN-detectable tumors (p = 0.012). CD8+ T cells within TNBC tumors with high VCAN proteolysis infiltrated the epithelial compartment more often than in tumors with low VCAN proteolysis (91% vs. 42% respectively; p = 0.008). In the TCGA cohort, a strong inverse correlation between CD8A and VCAN expression was observed across subtypes. Conclusions: VCAN accumulation correlates with the exclusion of CD8+ TILs across subtypes of breast cancer, warranting further validation of VCAN accumulation and proteolysis as predictive biomarkers for breast cancer immunotherapy.

1. Introduction

Despite advances in targeted therapies, breast cancer remains a leading cause of cancer-related death in women [1]. While breast cancer was initially thought to be resistant to immunotherapeutic agents, recent studies have shown some patients with triple-negative breast cancers (TNBC) are responsive to immunotherapy. The KEYNOTE-355 phase III clinical trial evaluated pembrolizumab plus chemotherapy versus (vs.) chemotherapy alone for previously untreated locally recurrent inoperable or metastatic triple-negative breast cancer [2]. In the intention-to-treat population, the median overall survival (mOS) was 17.2 months in the pembrolizumab-containing arm and 15.5 months with standard of care. In those patients with a combined positive score (CPS) of 10 or more, the pembrolizumab-containing arm had a mOS of 23 months compared to 16.1 months with control (HR 0.73, p = 0.0185) [3]. In the KEYNOTE-522 phase III study, patients with previously untreated stage II or III TNBC were randomized to neoadjuvant pembrolizumab and chemotherapy vs. placebo and chemotherapy [4]. A significant improvement in the pathologic complete response rate was observed with pembrolizumab treatment. Beyond TNBC, improved pathologic outcomes with neoadjuvant immunotherapy and chemotherapy have been observed in patients with estrogen receptor-positive and HER2-negative BC as part of the CheckMate-7FL and KEYNOTE-756 clinical trials [5,6].
The breast cancer tumor microenvironment (TME), as with many solid tumors, is a dynamic factor of the disease consisting of both protumor and antitumor components. Lymphocytes, tumor-associated macrophages and dendritic cells are well-characterized components of tumor-immune infiltrates [7]. In fact, CD8+ T cell infiltration has been shown to predict clinical benefit for breast cancer patients independent of many clinical factors, such as tumor grade and lymph node status [8]. Cancer-associated fibroblasts are derived from several cell types, including normal breast fibroblasts and recruited bone marrow cells [9,10] and contribute to the acellular component of the TME known as the extracellular matrix (ECM).
Major components of the breast cancer ECM include collagen, fibronectin, laminin, hyaluronic acid, and proteoglycans, such as versican (VCAN) [11]. The ECM in breast cancer promotes cancer cell invasion and proliferation while also creating a microenvironment that nurtures cancer progression [7] and establishes the metastatic niche by driving the process of the mesenchymal-to-epithelial transition [12]. The ECM has also been shown to partially regulate the immune microenvironment seen in breast cancer [13], such as the deposition of SPARC leading to an infiltration of regulatory T lymphocytes and myeloid-derived suppressor cells [14]. Additionally, more recent studies characterizing the stromal response in breast cancers have demonstrated a distinct correlation between fibroblast signature genes and cytotoxic T-cell dysfunction and exclusion [15].
We recently discovered that an ECM immunomodulatory proteoglycan versican (VCAN) and its ADAMTS-protease proteolytic cleavage product versikine (Vkine) differentially accumulate in the TME of multiple myeloma [16] and colorectal cancers (CRC) [17]. In CRC, increased VCAN accumulation was associated with decreased CD8+ TILs, likely through dendritic cell dysfunction [17]. Conversely, CRC tumors with high VCAN proteolysis (low total VCAN and high cleaved VCAN staining) had a 10-fold increase of CD8+ tumor-infiltrating lymphocytes (TILs) over tumors with lower VCAN proteolysis. In breast cancer, VCAN production is partially driven by cancer-associated fibroblasts under the influence of cancer cells [18], potentially through TGF-β signaling [19]. It has also been recently demonstrated that the accumulation of VCAN is strongly associated with an influx of tumor-associated macrophages, an immunosuppressive immune cell population [20]. VCAN has been shown to have prognostic value in breast cancer, as patients with elevated VCAN expression demonstrated a higher relapse rate and reduced overall survival rates [18,21]. However, the correlation between VCAN accumulation and tumor-infiltrating CD8+ T cells in breast cancer has been understudied and is the primary focus of this investigation. We hypothesize that the presence of VCAN in the stromal compartment will limit CD8+ T cell infiltration, and its proteolysis will be associated with enhanced infiltration.

2. Materials and Methods

2.1. Breast Cancer Patient Specimens

All study procedures were completed per a University of Wisconsin–Madison Health Sciences IRB-approved protocol (IRB# 2016-0934). The research herein conforms to the principles outlined in the Declaration of Helsinki. Waiver of consent was granted by the University of Wisconsin–Madison. A total of 371 cases of invasive breast cancer were identified and used to generate a tissue microarray (TMA) that was obtained through the UW–Madison Translational Science Biocore [22]. Cases without invasive carcinoma, as well as cases with poor quality or exclusively stromal content on the IHC-stained slides, were excluded from our studies, leaving a total of 230 cases in our final cohort. Clinical data were collected for this patient cohort, including age, histologic subtype, stage, receptor status, date of diagnosis, race, and menopausal status. Estrogen receptor (ER) and progesterone receptor (PR) statuses were reported as positive or negative and also provided in the form of the Immunoreactive Remmele Score (IRS) [23].

2.2. Immunohistochemistry (IHC)

Unstained TMA tissue sections were deparaffinized and rehydrated according to standard procedures. Antigen retrieval was conducted using citrate buffer (pH 6.0) for αDPEAAE (VCAN proteolysis) staining, EDTA buffer (pH 8.0) for CD8 staining, and chondroitinase ABC for VCAN staining as previously described [24]. The following primary antibodies were used: VCAN (1:100; 12C5; Developmental Studies Hybridoma Bank; University of Iowa, Iowa City, IA, USA), αDPEAAE (1:2000; PA1-1748; Fisher Scientific; Hampton, NH, USA), CD8a (1:200; c4-0085-80, eBioscience; San Diego, CA, USA). Betazoid DAB buffer and chromogen (SKU DS900, BioCare Medical, Pacheco, CA, USA) were used to visualize staining, and hematoxylin was used for nucleic acid counterstain.

2.3. IHC Quantification

An Olympus BX40 microscope (Olympus; Waltham, MA, USA) was used to visualize all stained slides. To quantify VCAN and αDPEAAE staining, a binning system was utilized based on the intensity of stromal staining only. Each core was assigned a score between 0 and 3 (0 = no staining; 1 = light and minimal staining; 2 = moderate intensity, may be patchy areas of strong intensity; 3 = intense staining throughout the majority of stroma). Three different systems were used to quantify CD8+ T cells throughout this study to reflect different approaches within the field of breast cancer: total, epithelial, and stromal lymphocytes. For each of these systems, CD8+ lymphocytes were counted within a 400× high-powered field of view (HPF). Total CD8+ T cell values were compiled by manually counting lymphocytes, which demonstrated positive CD8 staining, regardless of localization within tumor tissue. Epithelial counts were compiled by counting CD8+ lymphocytes in direct contact with breast cancer cells based on histology. Stromal CD8+ T cell counts were compiled by counting CD8+ lymphocytes, which were within the stromal compartment of the tissue and not in contact with breast cancer cells. For both epithelial and stromal quantification, HPFs within each core were selected for the greatest proportion of epithelial and stromal content, respectively; therefore, it would not be expected that the epithelial and stromal CD8+ TILs would equal that of the total number of reported CD8+ TILs. To verify the consistency of the immune infiltration on cores represented on the TMA, 32 full tissue slides were obtained from patients, and epithelial CD8 T cell counts averaged across five HPFs were compared to the TMA cores.

2.4. Estrogen Stimulation

The ER+ MCF7 cells were acquired as a gift from the lab of Elaine Alarid, PhD (McArdle Laboratory, Madison, WI, USA). One hundred thousand cells were plated in stripping media [Phenol-red free DMEM (Gibco, Grand Island, NY, USA) supplemented with 10% charcoal-stripped FBS (Gibco, REF# A33821-10, Grand Island, NY, USA), 2% Glutamax (Grand Island, NY, USA), 1% Pen Strep (Gibco, Grand Island, NY, USA), 1% sodium pyruvate (Grand Island, NY, USA)] in each well across two six-well tissue-culture treated plates. Ninety-six hours later, the media was replaced with either stripping media with 10 nM β-Estradiol (1:1000 10 µM in media + 1% ethanol) (Sigma-Aldrich, St. Louis, MO, USA) or vehicle control. Controls were collected 10 h following administration of vehicle control. Cells were collected at the indicated time points by rinsing in DEPC-treated 1× PBS. Results represent four biological replicates conducted across two independent experiments.

2.5. qPCR

RNA was isolated using the RNeasy Plus Mini Kit (Qiagen, Hilden, Germany) and 40 ng of RNA was converted to cDNA using GoScript™ Reverse Transcriptase (Promega, Madison, WI, USA). qPCR was conducted in a 96-well format using the SensiFAST™ SYBR® No-ROX Kit (Thomas Scientific, Swedesboro, NJ, USA) and read on a BioRad© CX96 Touch Real-Time PCR Detection System (BioRad, Hercules, CA, USA). Primers were ordered through IDT™ (Coralville, IA, USA) and are as follows: PGR (Forward, 5′-GCTGTCATTATGGTGTCCTTAC-3′: Reverse, 5′-GTAGTTGTGCTGCCCTTCC-3′), TFF1 (Forward, 5′-GTCCCCTGGTGCTTCTATCCT-3′: Reverse, 5′-AGCCGAGCTCTGGGACTAATC-3′)) VCAN (Forward, 5′-GAGGTGGTCTACTTGGGGTGA-3′: Reverse, 5′-ACAAGTGGCTCCATTACGAC-3′) ADAMTS1 (Forward, 5′-GCACTGCAAGGCGTAGGAC-3′: Reverse, 5′-AACGATGGTTTCCACATAGCG-3′), ADAMTS4 (Forward, 5′-GGGATAGTGACCACATTGTT-3′: Reverse, 5′-AGGCACTGGGCTACTACTAT-3′) ADAMTS5 (Forward, 5′-CACTGTGGCTCACGAAATCG-3′: Reverse, 5′-CGCTTATCTTCTGTGGAACCAAA-3′), GAPDH (Forward 5′-AATCCCATCACCATCTTCCA-3′: Reverse, 5′-TGGACTCCACGACGTACTCA-3′). The relative expression values were normalized to the housekeeping gene GAPDH, followed by normalizing to the control timepoint.

2.6. Gene Expression Profiling

The cBioPortal was utilized as previously described to acquire full gene expression analyses [25,26]. Briefly, the publicly available dataset for breast invasive carcinoma (TCGA, PanCancer Atlas) was analyzed according to subtype (Luminal A, Luminal B, basal [TNBC], and HER2-enriched). Subsequently, a gene query was conducted using the genes indicated in each figure. Heat maps are visual representations for mRNA expression z-scores relative to diploid samples (RNA Seq V2 RSEM) and demonstrate the data upon clustering for visual effect. Heatmaps were made using ComplexHeatmap (version 2.16.0 [27,28]) in R (version 4.3.0 [29]).

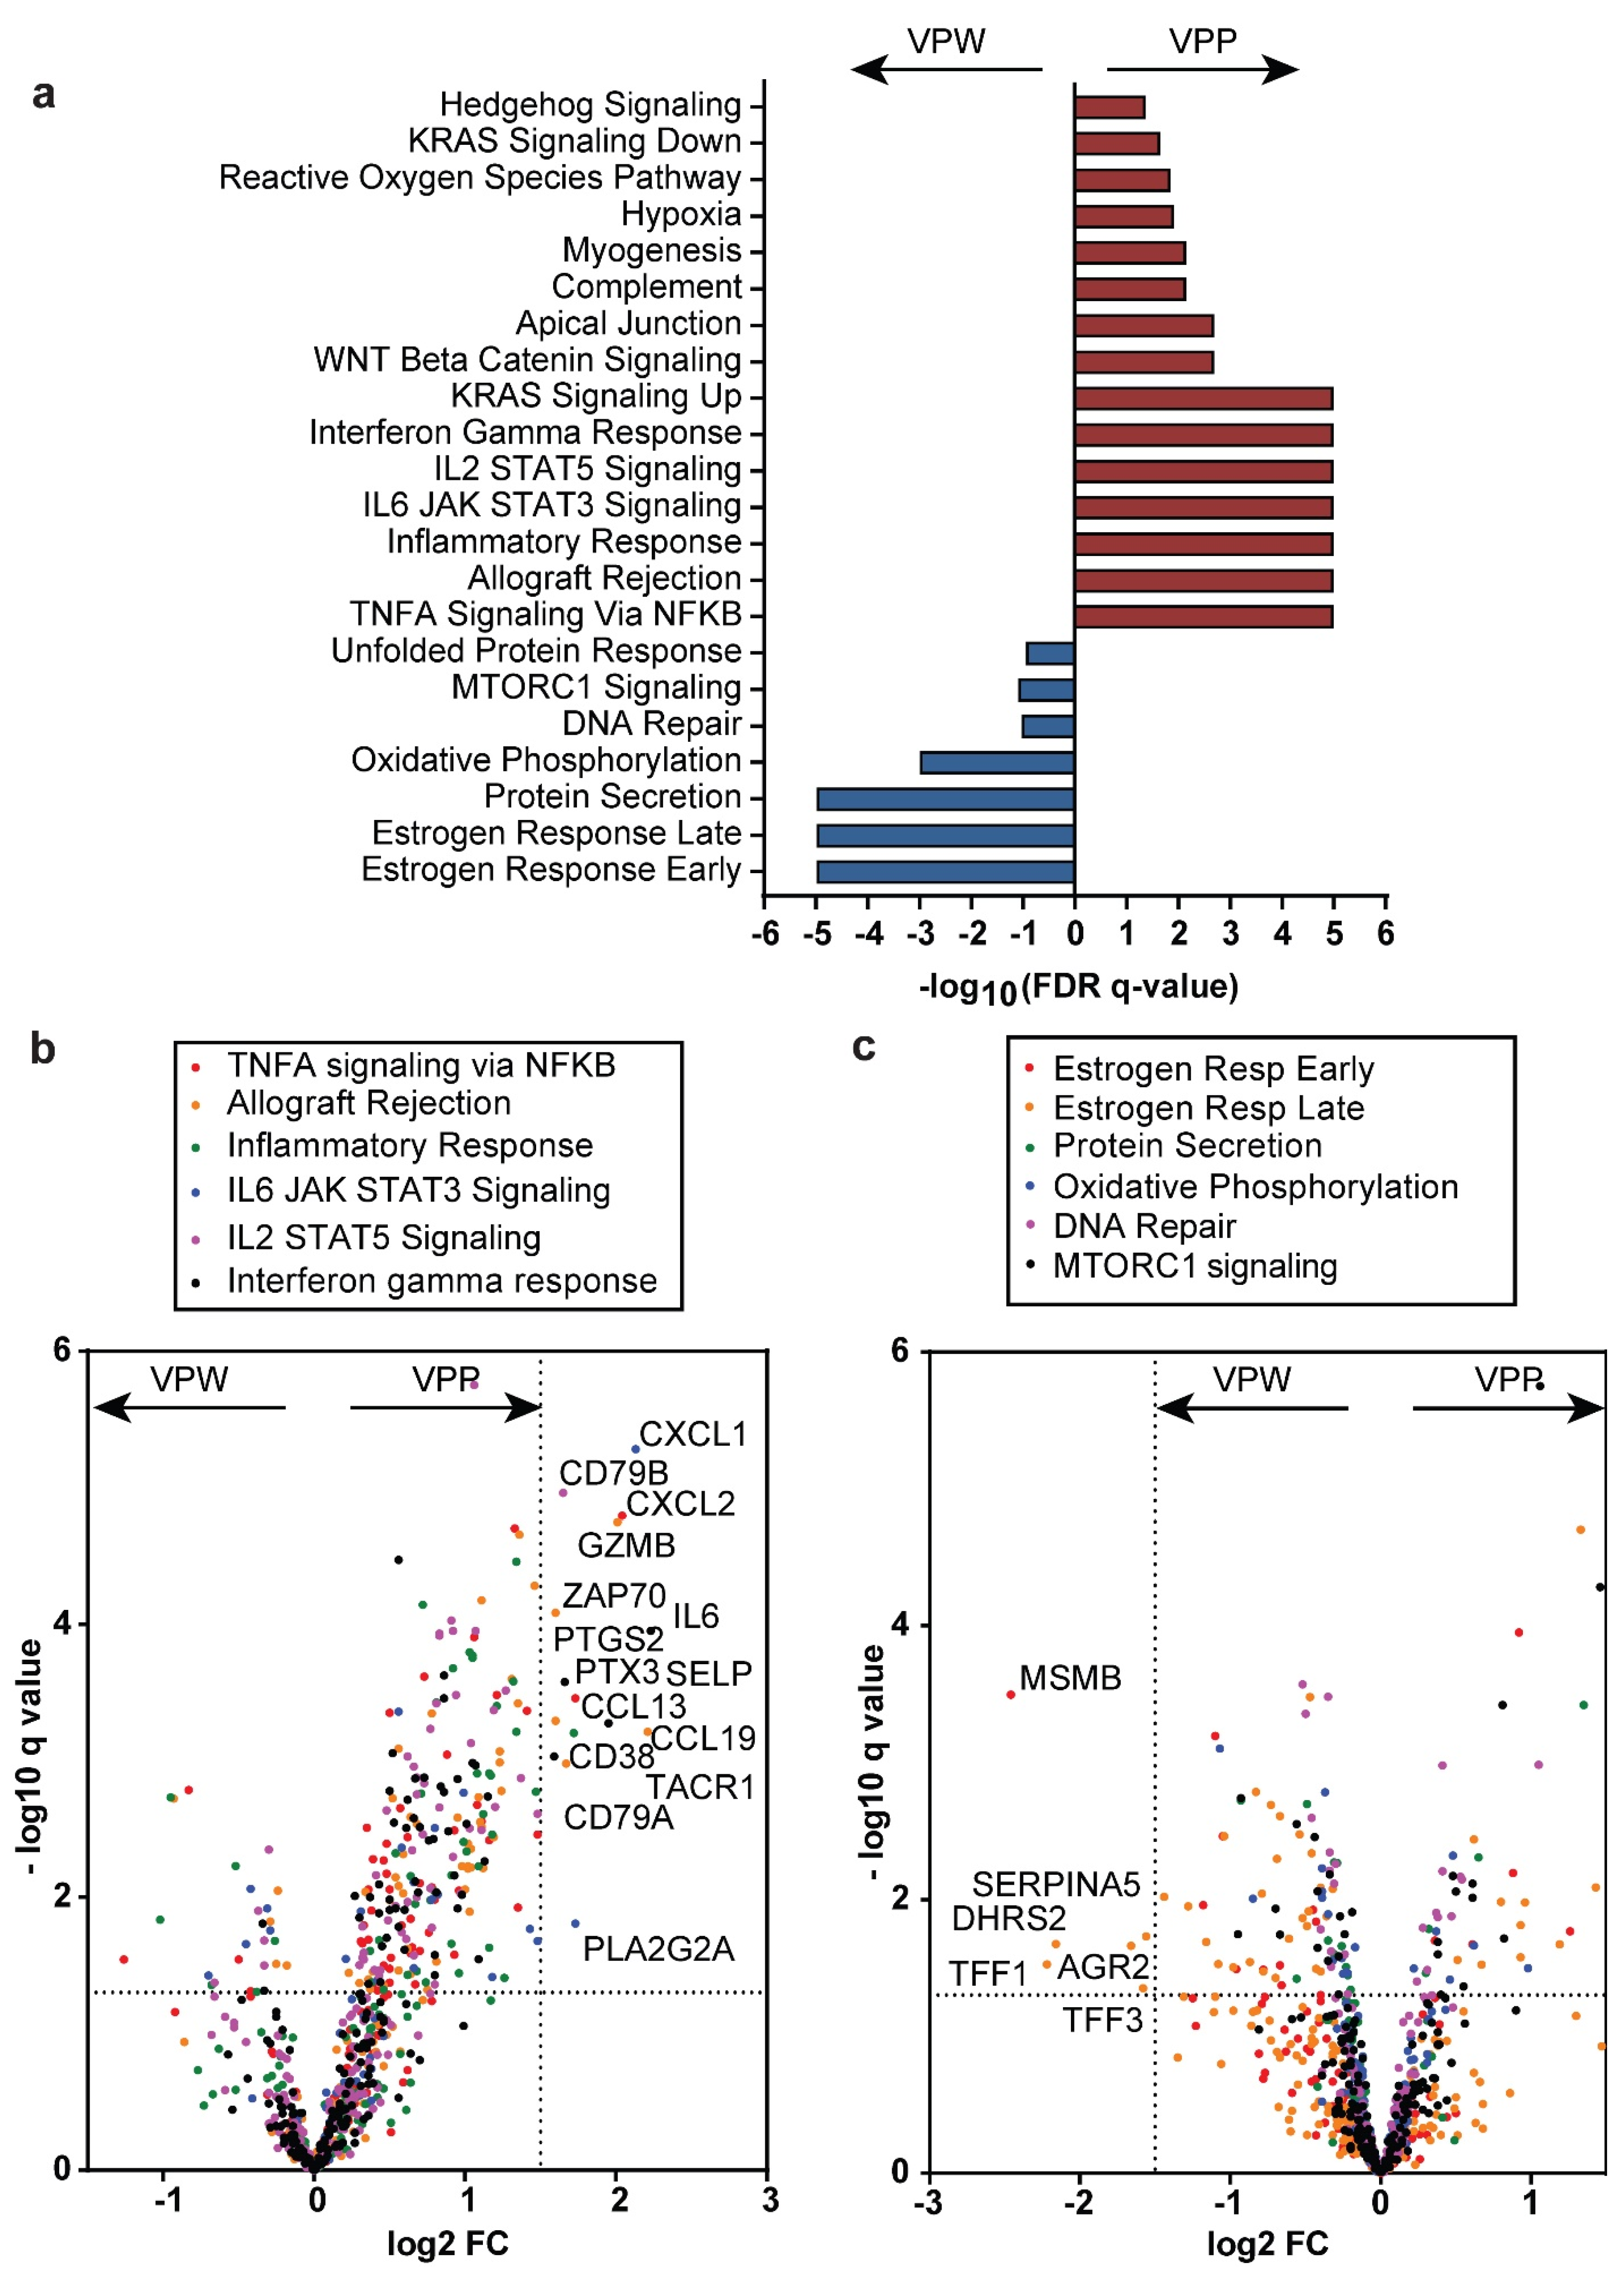
2.7. Versican Proteolytic Phenotype Signatures and Gene Set Enrichment Analysis

A cohort of 994 patient samples from the Breast Invasive Carcinoma TCGA PanCancer Atlas dataset [30] was chosen to identify Versican Proteolysis Predominant (VPP) and Versican Proteolysis Weak (VPW) subsets of breast cancer. mRNA z-score cutoffs for high and low expression of VCAN, ADAMTS4, or TIMP3 were set as >0.5 or <−1, respectively, to define VPP (VCANhi ADAMTS4hi TIMP3intermediate/low, n = 48) and VPW (VCANhi ADAMTS4intermediate/low TIMP3hi, n = 66) groups. Group differences in genomic alteration frequencies, disease staging, MSI MANTIS scores, tumor mutation burden, median diagnosis age, sex/race distribution, and relative expression of immunologically interesting markers were analyzed via cbioportal.org [25,26,31]. Differential expression data comparing VPP and VPW groups were used for Gene Set Enrichment Analysis (GSEA) [32,33] against the MSigDB Hallmark gene sets [34]. The differential expression of genes within gene sets was analyzed using R (Version 4.3.0 [29]), and all graphs were plotted using Graph Prism (Version 7.0a, 2 April 2016).

2.8. Statistical Considerations

Wilcoxon rank sum, t-tests, Chi-squared, and Jonckheere trend tests were conducted where reported in this manuscript. For all figures, * indicates p ≤ 0.05, ** indicates p ≤ 0.01, and *** indicates p ≤ 0.001.

3. Results

3.1. Clinical Characteristics

A representative cohort of patients at the University of Wisconsin Carbone Cancer Center was selected for this study. Most patients were white (n = 220), with the remaining either black (n = 5), Asian (n = 2), Hispanic (n = 2), or of unknown descent (n = 1). All patients were females between the ages of 30 and 94 at diagnosis. Most patients did not have a family history of breast cancer (n = 188), though a portion did (n = 37) with five patients of unknown family history. The majority of patients were post-menopausal (n = 140), though many were pre-menopausal (n = 86), perimenopausal (n = 1), or unknown (n = 3). Patients varied across stage (Stage I, n = 94; Stage II, n = 106; Stage III, n = 30) and tumor grade (grade 1, n = 41; grade 2, n = 106; grade 3, n = 83). Additionally, patients were divided into four distinct categories according to the hormone receptor and HER2 status of their tumors, including ER+/PR+/HER2− (n = 157), ER+/PR+/HER2+ (n = 25), ER−/PR−/HER2+ (n = 11), and ER−/PR−/HER2−, or triple-negative breast cancer (TNBC; n = 37).

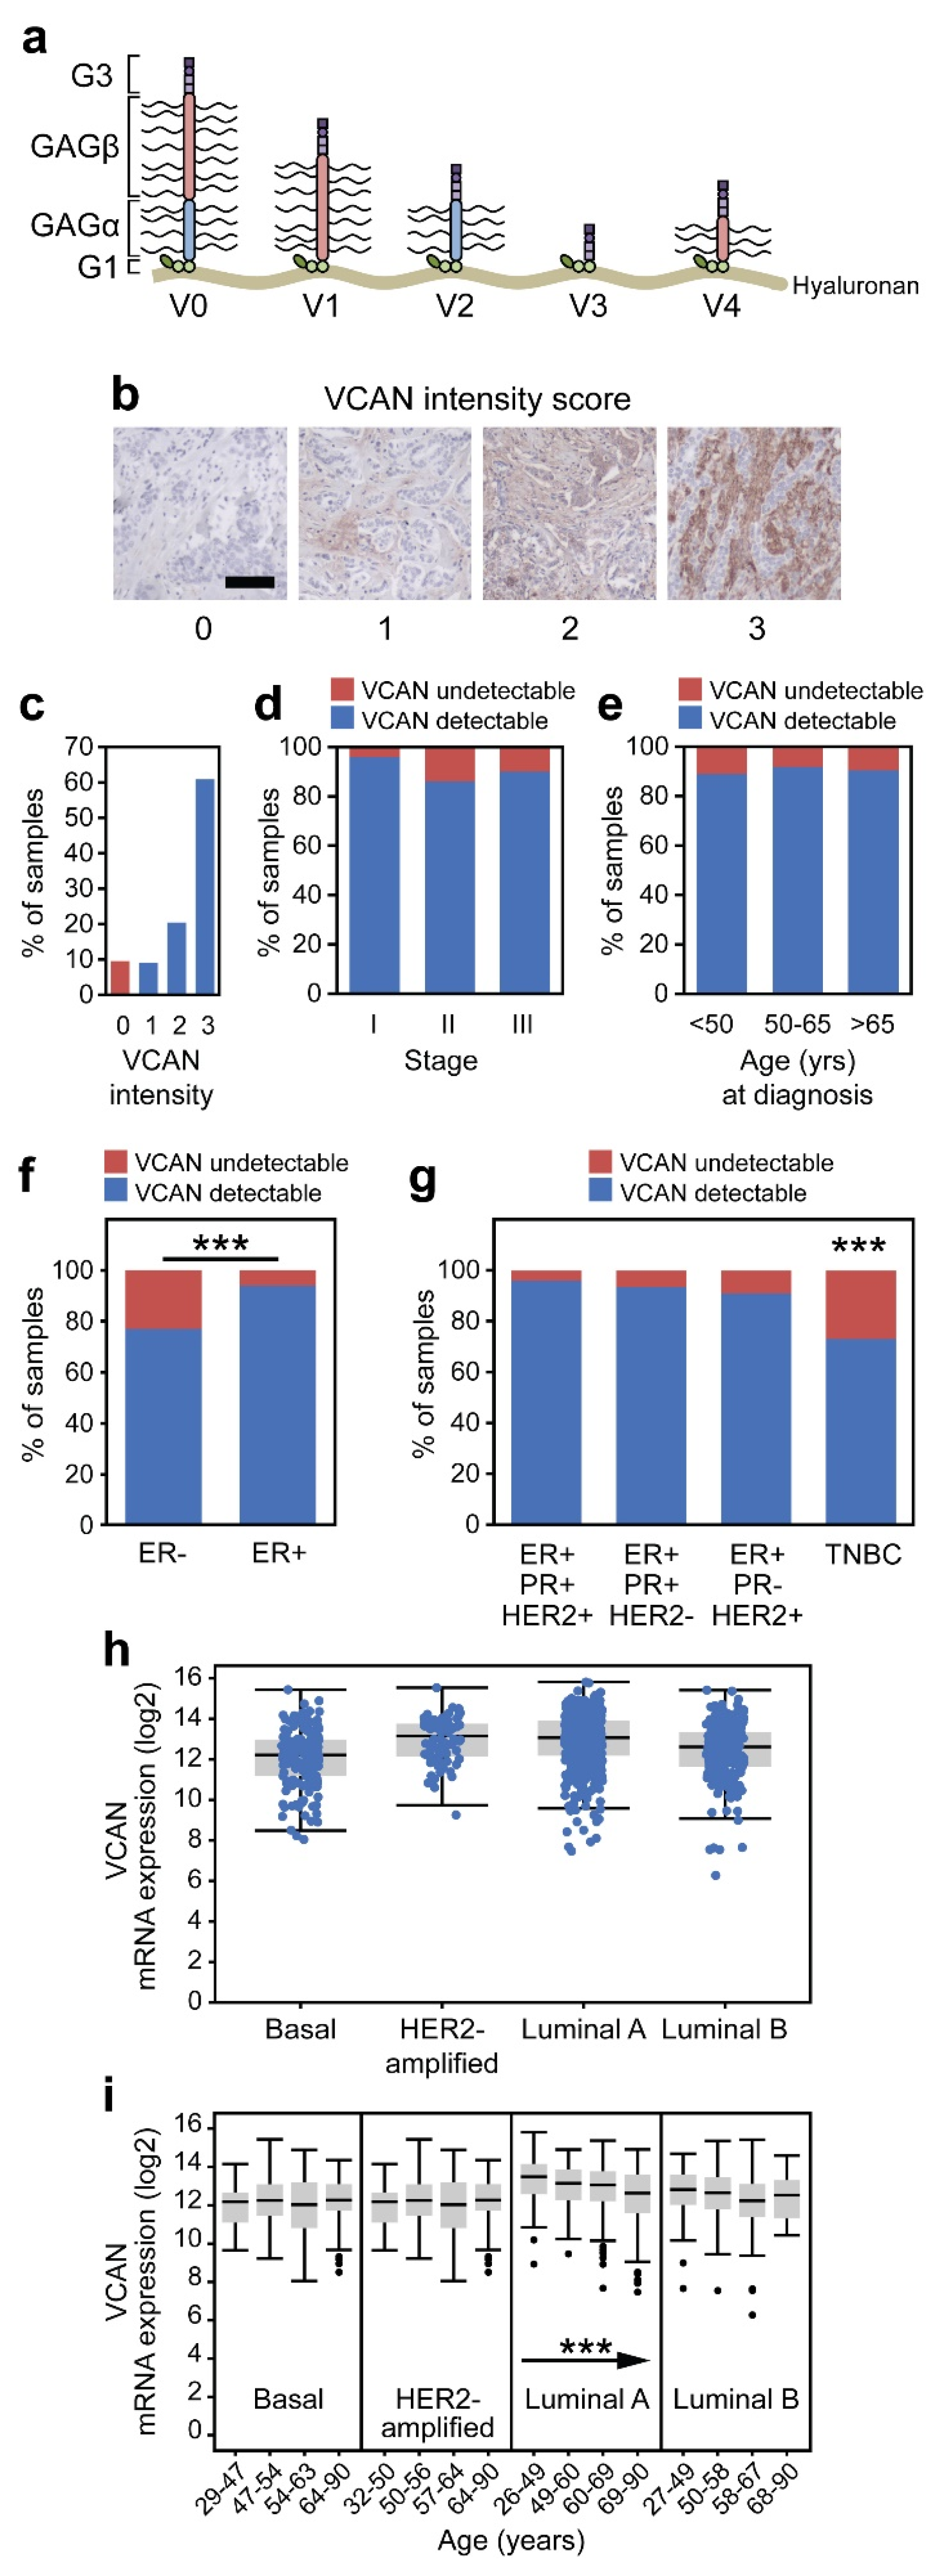
3.2. VCAN Accumulation Is a Common Feature of Breast Adenocarcinoma

Versican (VCAN) is commonly found within the ECM of solid tumors, anchored to hyaluronan through a pair of binding modules in the G1 domain (Figure 1a). Five main isoforms of VCAN exist as a product of alternative splicing of exons 7 and 8, which correspond to the GAGα and GAGβ domains, respectively, found in the central chondroitin-sulfate binding domain of the molecule [35]. The C-terminal G3 domain consists of two epidermal growth factor (EGF)-like repeats, a lectin-like motif (carbohydrate recognition domain), and a complement binding protein (CBP)-motif. The antigenic portion of VCAN recognized by the antibody is within the G1 domain and is therefore conserved across each of the isoforms [36]. A binning system was used to quantify the intensity of VCAN within the stroma (score = 0–3). (Figure 1b). VCAN accumulation within the stroma was abundant (score = 2–3) in 81.3% of breast cancers (Figure 1c). The proportion of cancers with detectable VCAN (1–3) did not significantly vary across the stage of the disease (Figure 1d) or the age of the patient (Figure 1e).
Breast cancer is a heterogeneous disease that has classically been grouped based on the expression of estrogen receptor (ER) and progesterone receptor (PR) as well as the overexpression of human epidermal growth factor receptor 2 (HER2) in tumors. Of the cancers that were investigated, 80% were ER-positive (ER+) (n = 184), and 20% were ER-negative (ER−) (n = 46). VCAN-detectable tumors represented a larger proportion of ER+ cancers than ER− cancers (93% vs. 77%; p < 0.001; Figure 1f). Twenty-seven percent of TNBCs lacked VCAN accumulation—the highest rate among subtypes (ER+/PR+/HER2+ 4%, ER+/PR+/HER2− 7%, HER2+ 9.1%, TNBC 27%; p < 0.001; Figure 1g).
Next, the expression of VCAN was assessed across the clinical subtypes of breast cancer using the TCGA dataset. The samples were divided across Luminal A (hormone-receptor-positive, HER2 negative, low Ki67), Luminal B (hormone-receptor-positive, HER2-negative or positive, high Ki-67), HER2-enriched/amplified (hormone-receptor negative, HER2-positive), and basal/triple negative (hormone-receptor negative, HER2 negative). Variable levels of VCAN expression were seen within the entire cohort but did not vary significantly between the clinical subtypes (Figure 1h). Interestingly, it was found that the expression of VCAN decreases as a function of age within the Luminal A subtype (p < 0.001; Figure 1i), potentially related to the presence of estrogen.

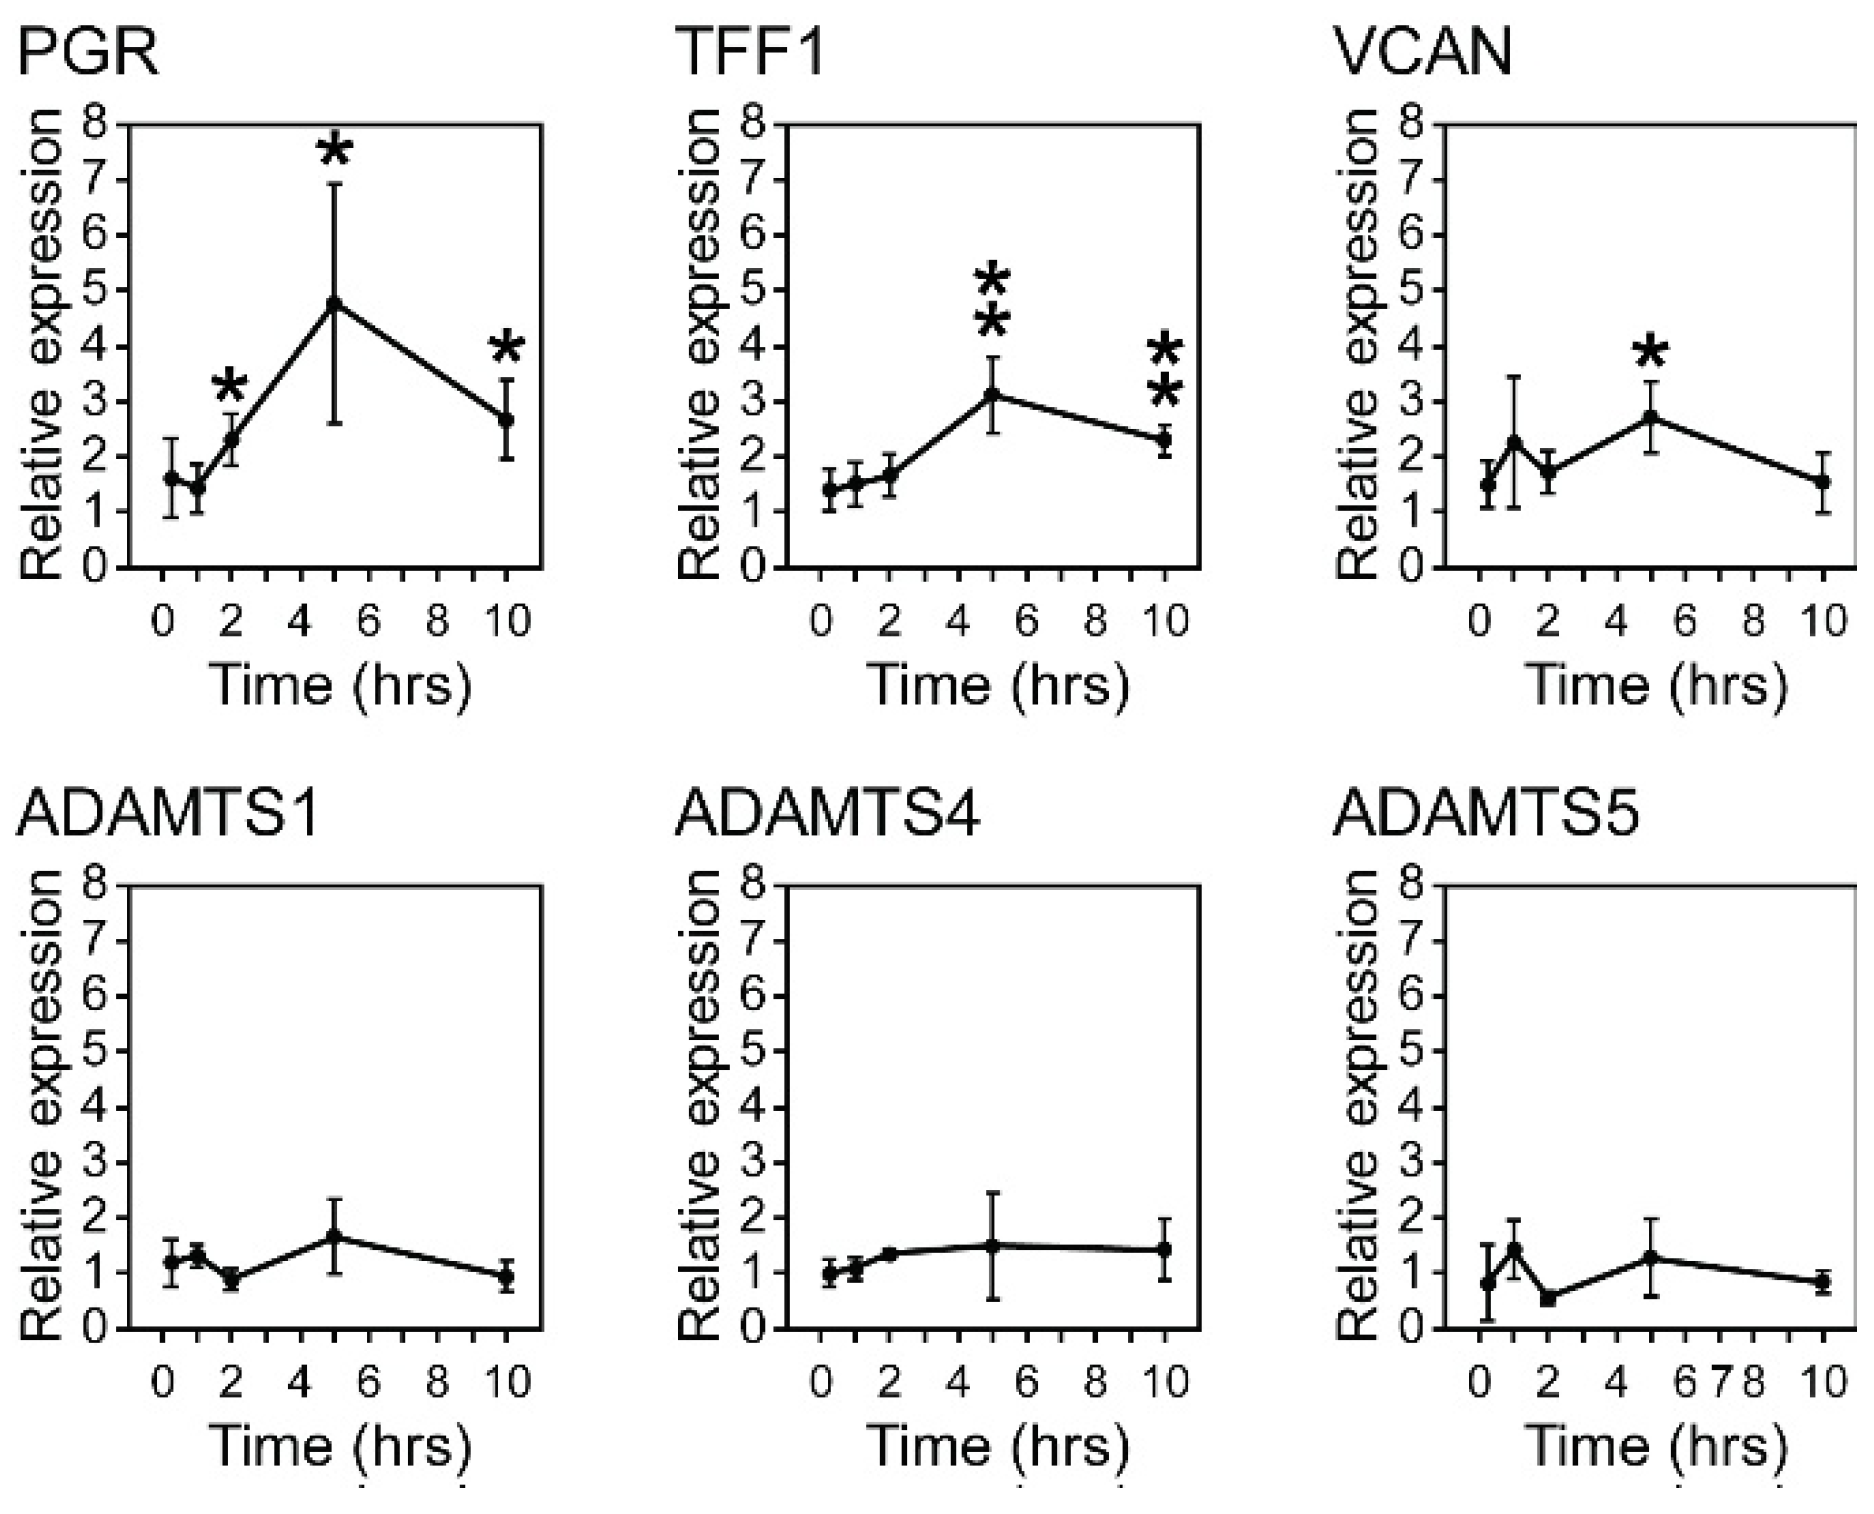
3.3. Estrogen Stimulation of VCAN Expression

As our findings demonstrated a significantly higher percentage of VCAN-detectable tumors in ER+ cancers compared to ER− cancers, there exists the possibility of a link between estrogen signaling and VCAN accumulation. To investigate this further, ER+ MCF7 cells were stimulated over 10 h with 10 nM β-estradiol and compared at various time points (15 min, 1 h, 2 h, 5 h, and 10 h) to a vehicle-only control (Figure 2). Relative expression levels of the estrogen-response genes progesterone receptor (PGR) and trefoil factor 1 (TFF1) served as positive controls. Estrogen response was identified at two hours (PGR only), as well as at five and ten hours. VCAN expression was significantly upregulated at five hours (2.7-fold increase, p = 0.013). However, none of the ADAMTS proteases were enhanced under estrogen stimulation, showing that the enhanced expression of VCAN is not coupled with increased cell-autonomous proteolysis under estrogen stimulation in MCF7 cells.

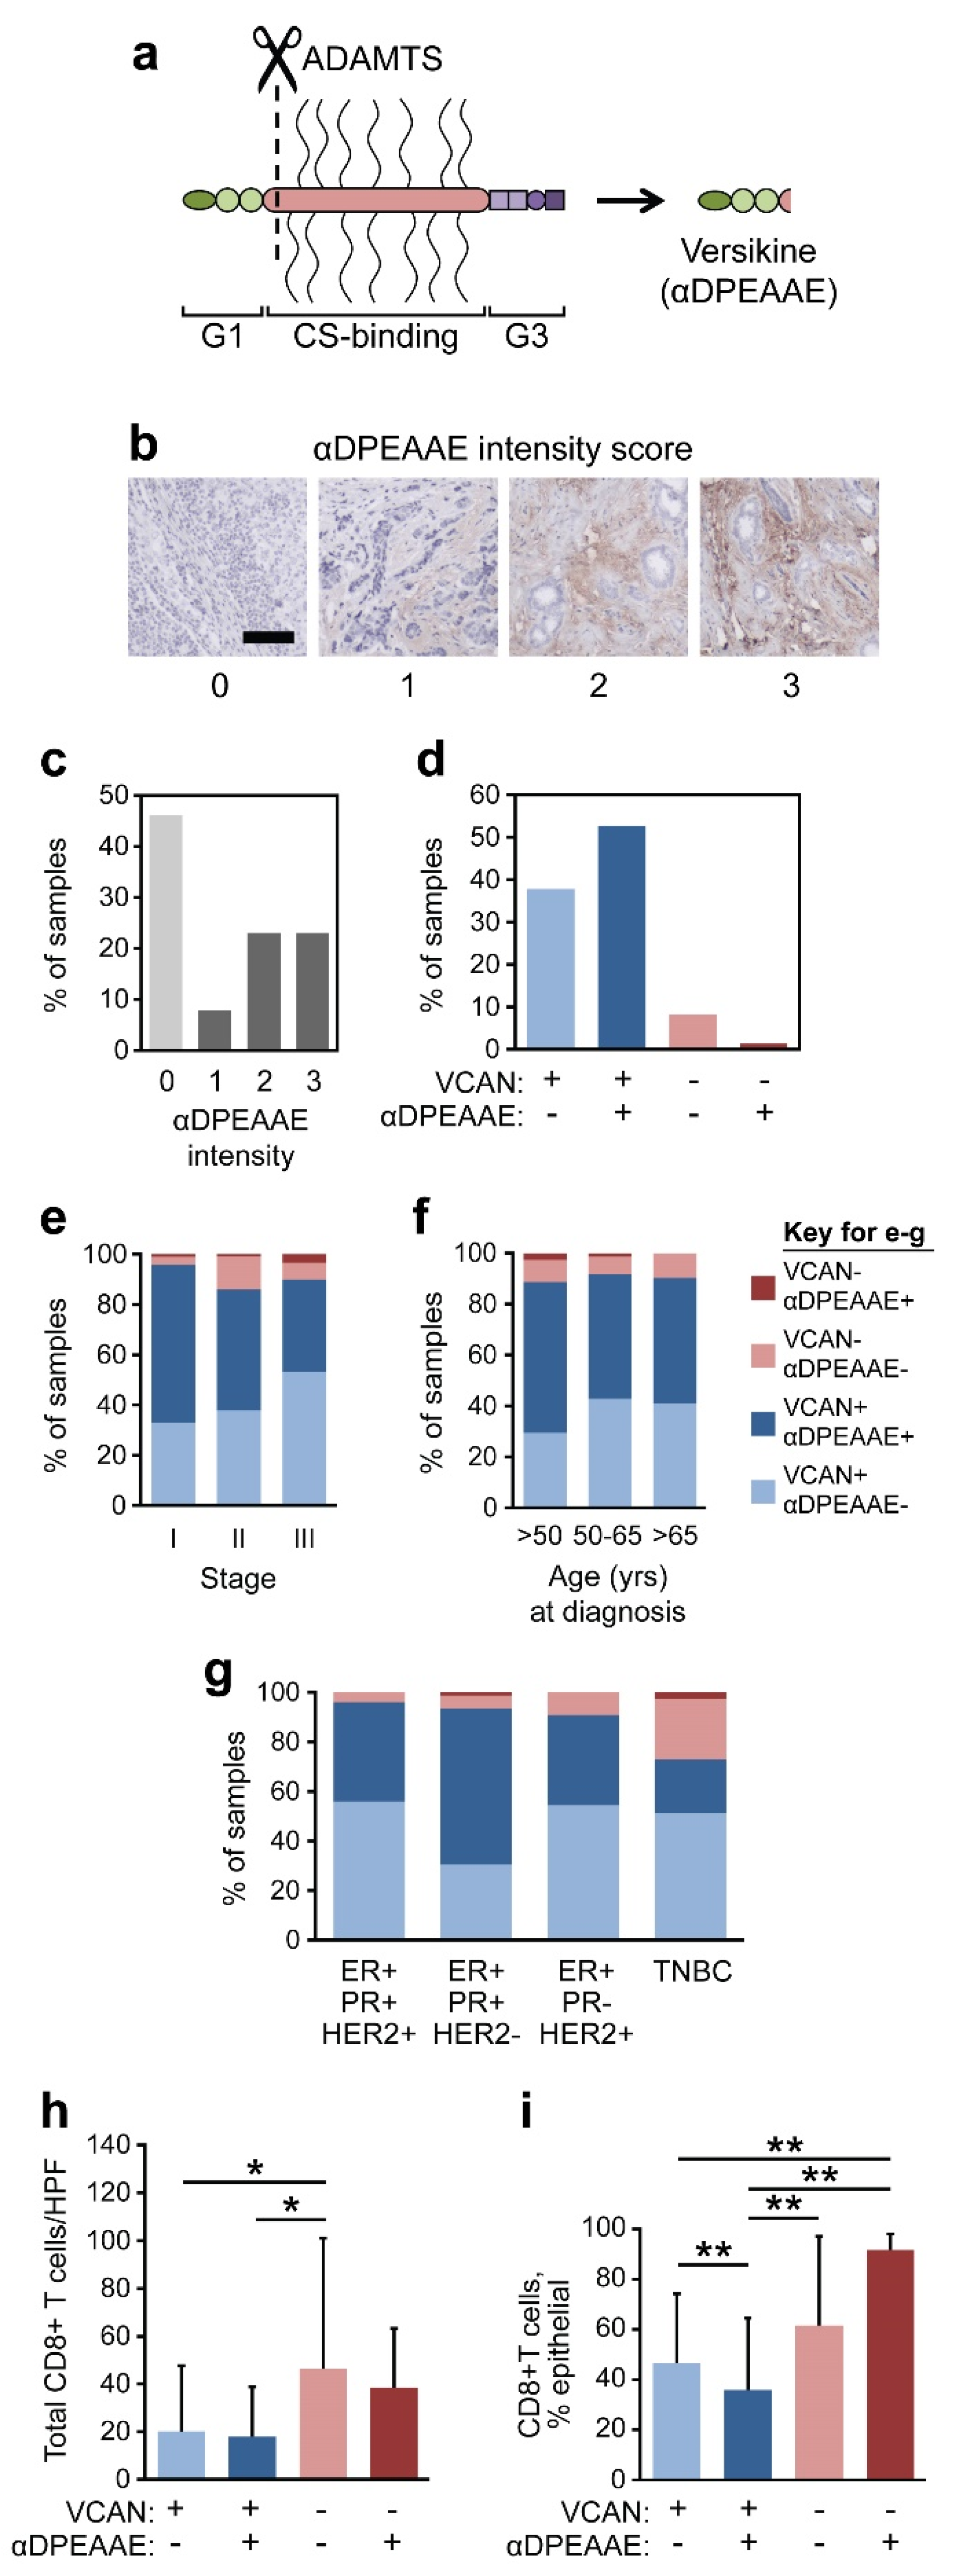
3.4. VCAN Accumulation Predicts CD8+ T Cell Exclusion in Breast Cancer

VCAN intensity was correlated with total CD8+ T cell numbers across patients (Figure 3a). Total CD8+ T cells for this study were quantified by counting the total number of positively stained lymphocytes per 400× high powered field (HPF), regardless of localization within the tissue. Cancers without detectable stromal VCAN staining had the greatest number of CD8+ T cells/HPF compared to those with detectable VCAN staining (p = 0.012; Figure 3b).
CD8+ T cells increased in more advanced stages of disease (p = 0.048; Figure 3c). Additionally, total CD8+ T cell numbers within tumors were reduced in older patients (p = 0.0028; Figure 3d). VCAN-undetectable tumors consistently contained more total CD8+ T cells than VCAN-detectable tumors across both age and stage of disease, reaching significance in Stage II (p = 0.029; Figure 3e,f). Many of the VCAN-undetectable subcategories had fewer than five patients, limiting statistical analyses. Total CD8+ T cells were also found to be similar in pre- and post-menopausal cancers (Supplementary Figure S1). Interestingly, post-menopausal status was associated with significantly more total CD8+ T cells in VCAN-undetectable cancers than in VCAN-detectable cancers (p < 0.001), but pre-menopausal status did not reach significance (Supplementary Figure S1).

3.5. VCAN Predicts CD8+ T Cells Across Clinical Subtypes of Breast Cancer

Next, we analyzed the total CD8+ T cells in these cancers according to receptor status. ER+ cancers demonstrated a strong trend towards fewer total CD8+ T cells as compared to ER− disease (p = 0.06; Figure 4a). Undetectable VCAN was associated with a significant increase in total CD8+ T cells in ER+ cancers (p = 0.028; Figure 4b). Upon including the PR and HER2 status of these cancers, it was found that TNBCs demonstrated the greatest average of total CD8+ T cells/HPF (Figure 4c). Interestingly, despite demonstrating the fewest total CD8+ T cells/HPF as a group, ER+/PR+/HER2− disease demonstrated a significant increase in total CD8+ T cells in VCAN-undetectable tumors (p = 0.032), and a similar trend was identified within TNBC (23.6 vs. 48.1, p = 0.3; Figure 4d).
Additionally, the TCGA dataset was used to correlate expression levels of CD8A (a marker indicative of CD8+ T cells) and VCAN across subtypes of breast cancer. Interestingly, CD8A and VCAN were nearly exclusive to one another, as revealed by the clustering of expression values across each subtype (Figure 4e).

3.6. VCAN Status Predicts Epithelial Infiltration of CD8+ T Cells

Recent reports have suggested that the location of cytotoxic T cells (intra-stromal vs. intra-epithelial) plays an important role in determining the prognostic relevance of these cells [37,38]. Therefore, these cells were stratified into either stromal or epithelial based on the tumor compartment in which the CD8+ T cells were localized (Figure 4f). The average epithelial CD8+ T cells/HPF in ER− breast cancer was double that of ER+ breast cancer (6.3 vs. 13.5, p = 0.058; Figure 4g). Intriguingly, the ER+ and ER− breast cancers had similar numbers of stromal CD8+ T cells (Figure 4h).
Despite the low prevalence of VCAN-undetectable tumors within the ER+ cohort, there was a trend toward more CD8+ T cells within the epithelial compartment of VCAN-undetectable cancers compared to VCAN-detectable tumors (p = 0.065; Supplementary Figure S2). Similarly, ER− cancers with undetectable VCAN contained significantly more intraepithelial CD8+ T cells (6.5 vs. 37.1, p = 0.022). With regard to the stromal CD8+ T cell counts across these subtypes, ER+ cancers demonstrated no difference based on VCAN status, whereas ER− cancers actually contained fewer stromal CD8+ T cells/HPF in VCAN-undetectable disease (p = 0.03; Supplementary Figure S2).
Upon including the PR and HER2 status of these cancers, it was found that TNBC demonstrated significantly more epithelial CD8+ T cells/HPF than ER+/PR+/HER2− tumors (p = 0.013; Figure 4i). However, there was little difference between these subgroups with regard to their numbers of stromal CD8+ T cells (Figure 4j). There was a trend towards more epithelial CD8+ T cells in VCAN-undetectable tumors in both ER+/PR+/HER2− (p = 0.08) and TNBC (p = 0.07; Figure 4k). The numbers of stromal CD8+ T cells actually decreased in TNBC in the absence of VCAN accumulation (p = 0.03; Figure 4l). To investigate whether our TMA cores were truly representative of CD8+ T cell localization in these tumors, full-tissue slides were stained for CD8 and evaluated by counting epithelial CD8+ T cells across five HPFs. The epithelial localization of CD8+ T cells was found to be consistent in the TMA cores when compared to full tissue sections across 32 patients (Supplementary Figure S3).
We hypothesize that stromal VCAN may sequester CD8+ T cells within the stromal compartment of tumors, preventing their invasion into epithelial regions and direct interaction with cancer cells. To address this question, we calculated the percentage of epithelial CD8+ T cells (epithelial/(epithelial + stromal)) across each of our ER/PR/HER2 subgroups, with little difference among the groups (Figure 4m). Upon separating these cancers by the detection of VCAN, it was found that TNBC demonstrated a statistically significant increase in the number epithelial % of CD8+ T cells in the absence of VCAN (p = 0.008); other subtypes demonstrated similar trends (Figure 4n).
To demonstrate the correlation of VCAN with cancer-associated fibroblast (CAF) associated genes in breast cancer, we conducted gene expression analyses across the TCGA PanCancer database for invasive breast carcinoma. It was found that VCAN expression clusters strongly with genes typically associated with stromal CAFs, such as COL1A1, FAP, PDGFRB, PDPN, and ACTA2 (Figure 4o). Additionally, expression of CD8A tended to be inversely related with VCAN and these other genes, suggesting that high expression of VCAN and the presence of fibroblasts may be exclusive of a robust epithelial infiltration of CD8A-expressing lymphocytes (likely CD8+ TILs).

3.7. VCAN Proteolysis in Breast Cancer

Next, we investigated the proteolysis of VCAN, an event predicted to release a bioactive fragment (matrikine), versikine (Vkine) [35]. Vkine is the 441-aa N-terminal fragment of the VCAN V1 isoform, which is released upon proteolytic cleavage by members of the ADAMTS (A Disintegrin And Metalloproteinase with a ThromboSpondin type 1 motif) family of proteases [39] (Figure 5a). Quantification of VCAN proteolysis was restricted to the tumor stroma, and it relies on the detection of the neoepitope αDPEAAE, which is formed upon proteolytic cleavage by ADAMTS proteases [40]. We had previously demonstrated that CRC tumors with both low total VCAN and high αDPEAAE staining intensity (termed VCAN proteolytic predominant, or VPP) demonstrated the greatest CD8+ T cell infiltration [17], and we discovered that recombinant Vkine has independent immunostimulatory activity in vitro [16,17]. Similar to VCAN accumulation, we quantified VCAN proteolysis using a binning system based on αDPEAAE intensity (Figure 5b). Of the 230 breast cancers analyzed, 45.9% did not demonstrate robust VCAN proteolysis in the stroma (0–1), while 46.3% had abundant VCAN proteolysis (2–3; Figure 5c).
Next, the cancers were categorized based on both the detection of VCAN and αDPEAAE. Due to our findings correlating biological significance in breast cancer with only the detectable/undetectable status of VCAN, we assessed VCAN proteolysis utilizing the detectable/undetectable designation for both VCAN and αDPEAAE (Figure 5d). Though rare, 1.3% of all patients were both VCAN-undetectable and αDPEAAE-detectable, and these were distributed across each stage and age group of these patients (Figure 5e,f). There was no significant difference in VCAN proteolysis across ER/PR/HER2 status (Figure 5g). Total CD8+ cells were significantly greater in VCAN-undetectable tumors compared to VCAN-detectable tumors regardless of the detection of αDPEAAE (Figure 5h). However, VCAN-undetectable/αDPEAAE-detectable tumors demonstrated 92% of CD8+ T cells penetrating the epithelial portion of the tumor, much greater than any of the other subgroups albeit without statistical significance from VCAN-undetectable/αDPEAAE-undetectable tumors (Figure 5i).
To expand this analysis, an RNA-based signature was developed, as outlined in the methods to identify cases likely to have the VCAN proteolytic predominant phenotype (VPP) or a VCAN proteolytic weak phenotype (VPW). The Breast Invasive Carcinoma TCGA PanCancer Atlas dataset was used to identify 48 VPP cases and 66 VPW cases based on the expression of VCAN, ADAMTS4, and TIMP3. GSEA was then performed by comparing these two cohorts. The VPP cohort was found to be enriched for pathways consistent with immune infiltration, including inflammatory response, allograft rejection, TNFα signaling, and interferon-gamma response (Figure 6a). The differentially expressed genes in the significantly altered pathways are presented in Figure 6b,c. In the VPP cancers, significant increases were observed in CXCL1, CXCL2, GZMB, IL6, CCL13, and CCL19, among others.

4. Discussion

Anti-PD1 immunotherapy is now a standard option in combination with chemotherapy for some patients with breast cancer, as outlined above [2,3,4,5,6]. It is only a subset of patients that actually respond, and the current biomarkers, including PD-L1 expression, fail to identify those patients most likely to respond. New biomarkers are needed to further aid in patient selection for these therapies.
VCAN has demonstrated relevance over several “hallmarks of cancer” and has been implicated in modulating both cancer cell-intrinsic and microenvironment properties in breast cancer [41,42]. Studies have demonstrated increased VCAN accumulation in breast tumors compared to normal breast tissue [43,44]. Our work corroborated these findings by showing that the vast majority of breast cancers have significant VCAN accumulation (Figure 1). This upregulation of VCAN has been associated with more aggressive disease [45] and poorer outcomes [21] for breast cancer patients.
Our prior work and other studies have highlighted the immunosuppressive activities of VCAN in solid tumors, specifically the connection between VCAN-enriched tumors and low infiltration of CD8+ T cells [16,17,46,47], and recruitment/activation of immunosuppressive myeloid cells [48,49]. Recent reports have discovered that VCAN-high breast cancers have a greater infiltration of tumor-associated macrophages, a critical piece of the immunosuppressive landscape of many solid tumors [20]. Additionally, in triple-negative breast cancer, an association between VCAN and the localization of CD8+ T cells to the tumor stroma was recently reported, and the specific chondroitin sulfate–glycosaminoglycan (CS-GAG) sulfation patterning is important for regulating T cell trafficking [47].
Predicting the infiltration of CD8+ T cells within solid tumors has been shown to identify patients more likely to respond to immune checkpoint inhibitors [50,51,52]. Whereas previous reports have demonstrated a difference in total CD8+ T cells in breast cancers across stage [53], age and menopause status [8,54,55], our findings indicate that a VCAN-status predicts more total CD8+ T cells across each of these clinical groups (Figure 3; Supplementary Figure S1). CD8+ T cell numbers have been reported to be greater in patients with negative hormonal status [56,57,58,59,60]. While we found greater CD8+ T cells across TNBC cancers compared to the ER+/PR+ cancers at large (Figure 4c), a lack of VCAN identified patients with a similar presence of CD8+ T cells regardless of ER/PR status (Figure 4d). Therefore, the higher average count of CD8+ T cells in TNBC can be partially attributed to the greater proportion of VCAN-undetectable TNBC patients compared to other hormone-receptor subtypes (Figure 1g). Based on these findings, VCAN detection should be explored as a biomarker for all breast cancer patients receiving immunotherapy and chemotherapy, including the neoadjuvant and metastatic settings [2,3,4,5,6].
Beyond VCAN accumulation leading to an excluded TME, VCAN proteolysis by ADAMTS proteases releases Vkine, a matrikine with immune stimulatory properties countering the immunoregulatory functions of VCAN [20,40,47]. These immunostimulatory properties include the increased/enhanced maturation, abundance, and activation of stimulatory type 1 conventional dendritic cells. Here, we demonstrate a trend for the VPP phenotype (low VCAN and high Vkine expression) to correlate with enhanced CD8+ T cell infiltration into the epithelial compartment, which is consistent with the immunostimulatory role of Vkine. The VPP phenotype deserves evaluation in a larger dataset as a clinical predictor of CD8+ T cell infiltration and immunotherapy response beyond the accumulation of VCAN as a biomarker for immune exclusion and immunotherapy resistance.
Our findings in this work further solidify the relationship between immunomodulatory VCAN accumulation and the lack of CD8+ T cells in many solid tumors. Many questions remain regarding the mechanisms that drive VCAN accumulation and the subsequent exclusion of tumor-reactive CD8+ T cells in breast cancer, and answering these questions will build on the findings presented here. Additionally, due to the robust correlation between high VCAN proteolysis and intraepithelial localization of CD8+ T cells, it will be necessary to understand the influence of Vkine and other VCAN-matrikines on the immune system. Investigating the utility of VCAN testing as a biomarker of immunotherapeutic response in future studies is warranted and achievable based on these studies, and identifying more accurate biomarkers in this space could expand therapeutic options and provide clinical benefit to thousands of breast cancer patients.

5. Conclusions

In this work, we have demonstrated a strong correlation between VCAN abundance and proteolysis and infiltration of CD8+ T cells. Therefore, VCAN is a promising candidate for a biomarker for immunotherapy response and should be investigated further for its predictive potential. Interestingly, our work identified that the association between VCAN and immune infiltration is consistent across breast cancer subtypes, indicating a potential to identify patients that may derive benefit from immunotherapy outside of the already approved TNBC subtype.

Supplementary Materials

The following supporting information can be downloaded at: https://www.mdpi.com/article/10.3390/cancers17091435/s1, Supplementary Figure S1: Total CD8+ T cells within the breast tumor based on menopausal status. Supplementary Figure S2: Epithelial and stromal CD8+ T cells in ER+ and ER− breast cancer samples. Supplementary Figure S3: Correlation of VCAN presence with CD8+ T cell counts comparing TMA cores and full breast cancer specimen slides.

Author Contributions

Conceptualization, P.B.E. and D.A.D.; Methodology: P.B.E., K.A.J., S.M.M. and D.A.D.; Validation, K.A.J. and L.C.; Formal Analysis, P.B.E., T.Q., K.A.J., S.C., K.M.C., N.B.V., M.G.D., L.C., C.A.P., A.P., M.E.B., K.B.W., S.M.M., F.A. and D.A.D.; Investigation: P.B.E., T.Q., K.A.J., S.C., K.M.C., N.B.V. and M.G.D.; Resources, M.E.B. and S.M.M.; Data Curation, P.B.E., K.A.J., L.C. and S.M.M.; Writing—Original Draft Preparation, P.B.E., S.C. and D.A.D.; Writing—Review and Editing, P.B.E., T.Q., K.A.J., S.C., K.M.C., N.B.V., M.G.D., L.C., C.A.P., A.P., M.E.B., K.B.W., S.M.M., F.A. and D.A.D.; Visualization, K.A.J., S.C. and L.C.; Supervision, D.A.D.; Project Administration, C.A.P.; Funding Acquisition, D.A.D. All authors have read and agreed to the published version of the manuscript.

Funding

This project was supported by Funk Out Cancer, the University of Wisconsin Carbone Cancer Center (P30 CA014520), and NIH/NCI R01 CA252937. Additionally, the Deming lab is funded by NIH/NCI R37 CA226526 and R01 CA272855.

Institutional Review Board Statement

All study procedures were completed per a University of Wisconsin–Madison Health Sciences IRB-approved protocol (IRB# 2016-0934). The research herein conforms to the principles outlined in the Declaration of Helsinki.

Informed Consent Statement

A waiver of consent was granted by the University of Wisconsin–Madison.

Data Availability Statement

Data are available upon email request to the corresponding author.

Conflicts of Interest

KBW is a consultant for Gilead, ALX Oncology, and Stemline, has grants from Pfizer and Novartis, honoraria from Pfizer, Loxo@Lilly, AstraZeneca, Gilead, and Stemline Therapeutics, and contracted research with Pfizer, Novartis, Sanofi, Seagen, Jazz, AstraZeneca, Puma, Relay, Genentech/Roche, and Alterome.

References

  1. Siegel, R.L.; Giaquinto, A.N.; Jemal, A. Cancer Statistics, 2024. CA Cancer J. Clin. 2024, 74, 12–49. [Google Scholar] [CrossRef] [PubMed]
  2. Cortes, J.; Cescon, D.W.; Rugo, H.S.; Nowecki, Z.; Im, S.A.; Yusof, M.M.; Gallardo, C.; Lipatov, O.; Barrios, C.H.; Holgado, E.; et al. Pembrolizumab plus Chemotherapy versus Placebo plus Chemotherapy for Previously Untreated Locally Recurrent Inoperable or Metastatic Triple-Negative Breast Cancer (KEYNOTE-355): A Randomised, Placebo-Controlled, Double-Blind, Phase 3 Clinical Trial. Lancet 2020, 396, 1817–1828. [Google Scholar] [CrossRef] [PubMed]
  3. Cortes, J.; Rugo, H.S.; Cescon, D.W.; Im, S.-A.; Yusof, M.M.; Gallardo, C.; Lipatov, O.; Barrios, C.H.; Perez-Garcia, J.; Iwata, H.; et al. Pembrolizumab plus Chemotherapy in Advanced Triple-Negative Breast Cancer. N. Engl. J. Med. 2022, 387, 217–226. [Google Scholar] [CrossRef]
  4. Schmid, P.; Cortes, J.; Pusztai, L.; McArthur, H.; Kümmel, S.; Bergh, J.; Denkert, C.; Park, Y.H.; Hui, R.; Harbeck, N.; et al. Pembrolizumab for Early Triple-Negative Breast Cancer. N. Engl. J. Med. 2020, 382, 810–821. [Google Scholar] [CrossRef] [PubMed]
  5. Loi, S.; Curigliano, G.; Salgado, R.F.; Romero Diaz, R.I.; Delaloge, S.; Rojas, C.; Kok, M.; Saura Manich, C.; Harbeck, N.; Mittendorf, E.A.; et al. LBA20 A Randomized, Double-Blind Trial of Nivolumab (NIVO) vs. Placebo (PBO) with Neoadjuvant Chemotherapy (NACT) Followed by Adjuvant Endocrine Therapy (ET) ± NIVO in Patients (Pts) with High-Risk, ER+ HER2− Primary Breast Cancer (BC). Ann. Oncol. 2023, 34, S1259–S1260. [Google Scholar] [CrossRef]
  6. Cardoso, F.; McArthur, H.L.; Schmid, P.; Cortés, J.; Harbeck, N.; Telli, M.L.; Cescon, D.W.; O’Shaughnessy, J.; Fasching, P.; Shao, Z.; et al. LBA21 KEYNOTE-756: Phase III Study of Neoadjuvant Pembrolizumab (Pembro) or Placebo (Pbo) + Chemotherapy (Chemo), Followed by Adjuvant Pembro or Pbo + Endocrine Therapy (ET) for Early-Stage High-Risk ER+/HER2− Breast Cancer. Ann. Oncol. 2023, 34, S1260–S1261. [Google Scholar] [CrossRef]
  7. Soysal, S.D.; Tzankov, A.; Muenst, S.E. Role of the Tumor Microenvironment in Breast Cancer. Pathobiology 2015, 82, 142–152. [Google Scholar] [CrossRef]
  8. Mahmoud, S.M.A.; Paish, E.C.; Powe, D.G.; Macmillan, R.D.; Grainge, M.J.; Lee, A.H.S.; Ellis, I.O.; Green, A.R. Tumor-Infiltrating CD8+ Lymphocytes Predict Clinical Outcome in Breast Cancer. J. Clin. Oncol. 2011, 29, 1949–1955. [Google Scholar] [CrossRef]
  9. Direkze, N.C.; Jeffery, R.; Hodivala-Dilke, K.; Hunt, T.; Playford, R.J.; Elia, G.; Poulsom, R.; Wright, N.A.; Alison, M.R. Bone Marrow-Derived Stromal Cells Express Lineage-Related Messenger RNA Species. Cancer Res. 2006, 66, 1265–1269. [Google Scholar] [CrossRef]
  10. Kalluri, R.; Zeisberg, M. Fibroblasts in Cancer. Nat. Rev. Cancer 2006, 6, 392–401. [Google Scholar] [CrossRef]
  11. Insua-Rodríguez, J.; Oskarsson, T. The Extracellular Matrix in Breast Cancer. Adv. Drug Deliv. Rev. 2016, 97, 41–55. [Google Scholar] [CrossRef] [PubMed]
  12. Gao, D.; Vahdat, L.T.; Wong, S.; Chang, J.C.; Mittal, V. Microenvironmental Regulation of Epithelial-Mesenchymal Transitionsin Cancer. Cancer Res. 2012, 72, 4883–4889. [Google Scholar] [CrossRef] [PubMed]
  13. Lv, D.; Zhang, Y.; Kim, H.J.; Zhang, L.; Ma, X. CCL5 as a Potential Immunotherapeutic Target in Triple-Negative Breast Cancer. Cell Mol. Immunol. 2013, 10, 303–310. [Google Scholar] [CrossRef] [PubMed]
  14. Sangaletti, S.; Tripodo, C.; Santangelo, A.; Castioni, N.; Portararo, P.; Gulino, A.; Botti, L.; Parenza, M.; Cappetti, B.; Orlandi, R.; et al. Mesenchymal Transition of High-Grade Breast Carcinomas Depends on Extracellular Matrix Control of Myeloid Suppressor Cell Activity. Cell Rep. 2016, 17, 233–248. [Google Scholar] [CrossRef]
  15. Wu, S.Z.; Roden, D.L.; Wang, C.; Holliday, H.; Harvey, K.; Cazet, A.S.; Murphy, K.J.; Pereira, B.; Al-Eryani, G.; Bartonicek, N.; et al. Stromal Cell Diversity Associated with Immune Evasion in Human Triple-negative Breast Cancer. EMBO J. 2020, 39, e104063. [Google Scholar] [CrossRef]
  16. Hope, C.; Foulcer, S.; Jagodinsky, J.; Chen, S.X.; Jensen, J.L.; Patel, S.; Leith, C.; Maroulakou, I.; Callander, N.; Miyamoto, S.; et al. Immunoregulatory Roles of Versican Proteolysis in the Myeloma Microenvironment. Blood 2016, 128, 680–685. [Google Scholar] [CrossRef]
  17. Hope, C.; Emmerich, P.B.; Papadas, A.; Pagenkopf, A.; Matkowskyj, K.A.; Van De Hey, D.R.; Payne, S.N.; Clipson, L.; Callander, N.S.; Hematti, P.; et al. Versican-Derived Matrikines Regulate Batf3–Dendritic Cell Differentiation and Promote T Cell Infiltration in Colorectal Cancer. J. Immunol. 2017, 199, 1933–1941. [Google Scholar] [CrossRef]
  18. Ricciardelli, C.; Brooks, J.H.; Suwiwat, S.; Sakko, A.J.; Mayne, K.; Raymond, W.A.; Seshadri, R.; LeBaron, R.G.; Horsfall, D.J. Regulation of Stromal Versican Expression by Breast Cancer Cells and Importance to Relapse-Free Survival in Patients with Node-Negative Primary Breast Cancer. Clin. Cancer Res. 2002, 8, 1054–1060. [Google Scholar]
  19. Van Bockstal, M.; Lambein, K.; Van Gele, M.; De Vlieghere, E.; Limame, R.; Braems, G.; Van den Broecke, R.; Cocquyt, V.; Denys, H.; Bracke, M.; et al. Differential Regulation of Extracellular Matrix Protein Expression in Carcinoma-Associated Fibroblasts by TGF-Β1 Regulates Cancer Cell Spreading but Not Adhesion. Oncoscience 2014, 1, 634–648. [Google Scholar] [CrossRef]
  20. dos Reis, D.C.; Damasceno, K.A.; de Campos, C.B.; Veloso, E.S.; Pêgas, G.R.A.; Kraemer, L.R.; Rodrigues, M.A.; Mattos, M.S.; Gomes, D.A.; Campos, P.P.; et al. Versican and Tumor-Associated Macrophages Promotes Tumor Progression and Metastasis in Canine and Murine Models of Breast Carcinoma. Front. Oncol. 2019, 9, 577. [Google Scholar] [CrossRef]
  21. Suwiwat, S.; Ricciardelli, C.; Tammi, R.; Tammi, M.; Auvinen, P.; Kosma, V.M.; LeBaron, R.G.; Raymond, W.A.; Tilley, W.D.; Horsfall, D.J. Expression of Extracellular Matrix Components Versican, Chondroitin Sulfate, Tenascin, and Hyaluronan, and Their Association with Disease Outcome in Node-Negative Breast Cancer. Clin. Cancer Res. 2004, 10, 2491–2498. [Google Scholar] [CrossRef] [PubMed]
  22. Qazi, M.S.; McGregor, S.M. Combined Use of SOX10 and GATA3 in Mammary Carcinoma. Pathol. Res. Pract. 2020, 216, 152801. [Google Scholar] [CrossRef] [PubMed]
  23. Remmele, W.; Schicketanz, K.H. Immunohistochemical Determination of Estrogen and Progesterone Receptor Content in Human Breast Cancer: Computer-Assisted Image Analysis (QIC Score) vs. Subjective Grading (IRS). Pathol. Res. Pract. 1993, 189, 862–866. [Google Scholar] [CrossRef] [PubMed]
  24. Evanko, S.P.; Chan, C.K.; Johnson, P.Y.; Frevert, C.W.; Wight, T.N. The Biochemistry and Immunohistochemistry of Versican. In Methods in Cell Biology; Elsevier: Amsterdam, The Netherlands, 2018; Volume 143. [Google Scholar]
  25. Cerami, E.; Gao, J.; Dogrusoz, U.; Gross, B.E.; Sumer, S.O.; Aksoy, B.A.; Jacobsen, A.; Byrne, C.J.; Heuer, M.L.; Larsson, E.; et al. The CBio Cancer Genomics Portal: An Open Platform for Exploring Multidimensional Cancer Genomics Data. Cancer Discov. 2012, 2, 401–404. [Google Scholar] [CrossRef]
  26. Gao, J.; Aksoy, B.A.; Dogrusoz, U.; Dresdner, G.; Gross, B.; Sumer, S.O.; Sun, Y.; Jacobsen, A.; Sinha, R.; Larsson, E.; et al. Integrative Analysis of Complex Cancer Genomics and Clinical Profiles Using the CBioPortal. Sci. Signal. 2013, 6, pl1. [Google Scholar] [CrossRef]
  27. Gu, Z. Complex Heatmap Visualization. iMeta 2022, 1, e43. [Google Scholar] [CrossRef]
  28. Gu, Z.; Eils, R.; Schlesner, M. Complex Heatmaps Reveal Patterns and Correlations in Multidimensional Genomic Data. Bioinformatics 2016, 32, 2847–2849. [Google Scholar] [CrossRef]
  29. R Core Team. R Core Team 2023 R: A Language and Environment for Statistical Computing. R Foundation for Statistical Computing. 2023. Available online: https://www.R-Project.org/ (accessed on 1 November 2023).
  30. Hoadley, K.A.; Yau, C.; Hinoue, T.; Wolf, D.M.; Lazar, A.J.; Drill, E.; Shen, R.; Taylor, A.M.; Cherniack, A.D.; Thorsson, V.; et al. Cell-of-Origin Patterns Dominate the Molecular Classification of 10,000 Tumors from 33 Types of Cancer. Cell 2018, 173, 291–304.e6. [Google Scholar] [CrossRef]
  31. de Bruijn, I.; Kundra, R.; Mastrogiacomo, B.; Tran, T.N.; Sikina, L.; Mazor, T.; Li, X.; Ochoa, A.; Zhao, G.; Lai, B.; et al. Analysis and Visualization of Longitudinal Genomic and Clinical Data from the AACR Project GENIE Biopharma Collaborative in CBioPortal. Cancer Res. 2023, 83, 3861–3867. [Google Scholar] [CrossRef]
  32. Subramanian, A.; Tamayo, P.; Mootha, V.K.; Mukherjee, S.; Ebert, B.L.; Gillette, M.A.; Paulovich, A.; Pomeroy, S.L.; Golub, T.R.; Lander, E.S.; et al. Gene Set Enrichment Analysis: A Knowledge-Based Approach for Interpreting Genome-Wide Expression Profiles. Proc. Natl. Acad. Sci. USA 2005, 102, 15545–15550. [Google Scholar] [CrossRef]
  33. Mootha, V.K.; Lindgren, C.M.; Eriksson, K.-F.; Subramanian, A.; Sihag, S.; Lehar, J.; Puigserver, P.; Carlsson, E.; Ridderstråle, M.; Laurila, E.; et al. PGC-1α-Responsive Genes Involved in Oxidative Phosphorylation Are Coordinately Downregulated in Human Diabetes. Nat. Genet. 2003, 34, 267–273. [Google Scholar] [CrossRef] [PubMed]
  34. Liberzon, A.; Birger, C.; Thorvaldsdóttir, H.; Ghandi, M.; Mesirov, J.P.; Tamayo, P. The Molecular Signatures Database Hallmark Gene Set Collection. Cell Syst. 2015, 1, 417–425. [Google Scholar] [CrossRef] [PubMed]
  35. Papadas, A.; Arauz, G.; Cicala, A.; Wiesner, J.; Asimakopoulos, F. Versican and Versican-Matrikines in Cancer Progression, Inflammation, and Immunity. J. Histochem. Cytochem. 2020, 68, 871–885. [Google Scholar] [CrossRef] [PubMed]
  36. Foulcer, S.J.; Day, A.J.; Apte, S.S. Isolation and Purification of Versican and Analysis of Versican Proteolysis. In Glycosaminoglycans Chemistry and Biology; Methods in Molecular Biology; Humana Press: New York, NY, USA, 2015; Volume 1229, pp. 587–604. [Google Scholar] [CrossRef]
  37. Wang, Z.Q.; Milne, K.; Derocher, H.; Webb, J.R.; Nelson, B.H.; Watson, P.H. CD103 and Intratumoral Immune Response in Breast Cancer. Clin. Cancer Res. 2016, 22, 6290–6297. [Google Scholar] [CrossRef]
  38. Angell, H.; Galon, J. From the Immune Contexture to the Immunoscore: The Role of Prognostic and Predictive Immune Markers in Cancer. Curr. Opin. Immunol. 2013, 25, 261–267. [Google Scholar] [CrossRef]
  39. Nandadasa, S.; Foulcer, S.; Apte, S.S. The Multiple, Complex Roles of Versican and Its Proteolytic Turnover by ADAMTS Proteases during Embryogenesis. Matrix Biol. 2014, 35, 34–41. [Google Scholar] [CrossRef]
  40. Papadas, A.; Deb, G.; Cicala, A.; Officer, A.; Hope, C.; Pagenkopf, A.; Flietner, E.; Morrow, Z.T.; Emmerich, P.; Wiesner, J.; et al. Stromal Remodeling Regulates Dendritic Cell Abundance and Activity in the Tumor Microenvironment. Cell Rep. 2022, 40, 111201. [Google Scholar] [CrossRef]
  41. Du, W.W.; Yang, W.; Yee, A.J. Roles of Versican in Cancer Biology-Tumorigenesis, Progression and Metastasis. Histol. Histopathol. 2013, 28, 701–713. [Google Scholar]
  42. Du, W.W.; Fang, L.; Yang, X.; Sheng, W.; Yang, B.L.; Seth, A.; Zhang, Y.; Yang, B.B.; Yee, A.J. The Role of Versican in Modulating Breast Cancer Cell Self-Renewal. Mol. Cancer Res. 2013, 11, 443–455. [Google Scholar] [CrossRef]
  43. Kischel, P.; Waltregny, D.; Dumont, B.; Turtoi, A.; Greffe, Y.; Kirsch, S.; De Pauw, E.; Castronovo, V. Versican Overexpression in Human Breast Cancer Lesions: Known and New Isoforms for Stromal Tumor Targeting. Int. J. Cancer 2010, 126, 640–650. [Google Scholar] [CrossRef]
  44. Takahashi, Y.; Kuwabara, H.; Yoneda, M.; Isogai, Z.; Tanigawa, N.; Shibayama, Y. Versican G1 and G3 Domains Are Upregulated and Latent Transforming Growth Factor-β Binding Protein-4 Is Downregulated in Breast Cancer Stroma. Breast Cancer 2012, 19, 46–53. [Google Scholar] [CrossRef] [PubMed]
  45. Skandalis, S.S.; Labropoulou, V.T.; Ravazoula, P.; Likaki-Karatza, E.; Dobra, K.; Kalofonos, H.P.; Karamanos, N.K.; Theocharis, A.D. Versican but Not Decorin Accumulation Is Related to Malignancy in Mammographically Detected High Density and Malignant-Appearing Microcalcifications in Non-Palpable Breast Carcinomas. BMC Cancer 2011, 11, 314. [Google Scholar] [CrossRef] [PubMed]
  46. Gorter, A.; Zijlmans, H.J.; Van Gent, H.; Trimbos, J.B.; Fleuren, G.J.; Jordanova, E.S. Versican Expression Is Associated with Tumor-Infiltrating CD8-Positive T Cells and Infiltration Depth in Cervical Cancer. Mod. Pathol. 2010, 23, 1605–1615. [Google Scholar] [CrossRef] [PubMed]
  47. Hirani, P.; McDermott, J.; Rajeeve, V.; Cutillas, P.R.; Jones, J.L.; Pennington, D.J.; Wight, T.N.; Santamaria, S.; Alonge, K.M.; Pearce, O.M.T. Versican Associates with Tumor Immune Phenotype and Limits T-Cell Trafficking via Chondroitin Sulfate. Cancer Res. Commun. 2024, 4, 970–985. [Google Scholar] [CrossRef]
  48. Pappas, A.G.; Magkouta, S.; Pateras, I.S.; Skianis, I.; Moschos, C.; Vazakidou, M.E.; Psarra, K.; Gorgoulis, V.G.; Kalomenidis, I. Versican Modulates Tumor-Associated Macrophage Properties to Stimulate Mesothelioma Growth. Oncoimmunology 2019, 8, e1537427. [Google Scholar] [CrossRef]
  49. Tang, M.; Diao, J.; Gu, H.; Khatri, I.; Zhao, J.; Cattral, M.S. Toll-like Receptor 2 Activation Promotes Tumor Dendritic Cell Dysfunction by Regulating IL-6 and IL-10 Receptor Signaling. Cell Rep. 2015, 13, 2851–2864. [Google Scholar] [CrossRef]
  50. Gettinger, S.N.; Choi, J.; Mani, N.; Sanmamed, M.F.; Datar, I.; Sowell, R.; Du, V.Y.; Kaftan, E.; Goldberg, S.; Dong, W.; et al. A Dormant TIL Phenotype Defines Non-Small Cell Lung Carcinomas Sensitive to Immune Checkpoint Blockers. Nat. Commun. 2018, 9, 3196. [Google Scholar] [CrossRef]
  51. Mushtaq, M.U.; Papadas, A.; Pagenkopf, A.; Flietner, E.; Morrow, Z.; Chaudhary, S.G.; Asimakopoulos, F. Tumor Matrix Remodeling and Novel Immunotherapies: The Promise of Matrix-Derived Immune Biomarkers. J. Immunother. Cancer 2018, 6, 65. [Google Scholar] [CrossRef]
  52. Tumeh, P.C.; Harview, C.L.; Yearley, J.H.; Shintaku, I.P.; Taylor, E.J.M.; Robert, L.; Chmielowski, B.; Spasic, M.; Henry, G.; Ciobanu, V.; et al. PD-1 Blockade Induces Responses by Inhibiting Adaptive Immune Resistance. Nature 2014, 515, 568–571. [Google Scholar] [CrossRef]
  53. Glajcar, A.; Szpor, J.; Hodorowicz-Zaniewska, D.; Tyrak, K.E.; Okoń, K. The Composition of T Cell Infiltrates Varies in Primary Invasive Breast Cancer of Different Molecular Subtypes as Well as According to Tumor Size and Nodal Status. Virchows Arch. 2019, 475, 13–23. [Google Scholar] [CrossRef]
  54. Desmedt, C.; Salgado, R.; Fornili, M.; Pruneri, G.; Van Den Eynden, G.; Zoppoli, G.; Rothe, F.; Buisseret, L.; Garaud, S.; Willard-Gallo, K.; et al. Immune Infiltration in Invasive Lobular Breast Cancer. J. Natl. Cancer Inst. 2018, 110, 768–776. [Google Scholar] [CrossRef] [PubMed]
  55. Miyashita, M.; Sasano, H.; Tamaki, K.; Chan, M.; Hirakawa, H.; Suzuki, A.; Tada, H.; Watanabe, G.; Nemoto, N.; Nakagawa, S.; et al. Tumor-Infiltrating CD8+ and FOXP3+ Lymphocytes in Triple-Negative Breast Cancer: Its Correlation with Pathological Complete Response to Neoadjuvant Chemotherapy. Breast Cancer Res. Treat. 2014, 148, 525–534. [Google Scholar] [CrossRef] [PubMed]
  56. Baker, K.; Lachapelle, J.; Zlobec, I.; Bismar, T.A.; Terracciano, L.; Foulkes, W.D. Prognostic Significance of CD8+ T Lymphocytes in Breast Cancer Depends upon Both Oestrogen Receptor Status and Histological Grade. Histopathology 2011, 58, 1107–1116. [Google Scholar] [CrossRef]
  57. Liu, S.; Lachapelle, J.; Leung, S.; Gao, D.; Foulkes, W.D.; Nielsen, T.O. CD8+ lymphocyte Infiltration Is an Independent Favorable Prognostic Indicator in Basal-like Breast Cancer. Breast Cancer Res. 2012, 14, R48. [Google Scholar] [CrossRef]
  58. Mittendorf, E.A.; Philips, A.V.; Meric-Bernstam, F.; Qiao, N.; Wu, Y.; Harrington, S.; Su, X.; Wang, Y.; Gonzalez-Angulo, A.M.; Akcakanat, A.; et al. PD-L1 Expression in Triple-Negative Breast Cancer. Cancer Immunol. Res. 2014, 2, 361–370. [Google Scholar] [CrossRef]
  59. Stanton, S.E.; Disis, M.L. Clinical Significance of Tumor-Infiltrating Lymphocytes in Breast Cancer. J. Immunother. Cancer 2016, 4, 59. [Google Scholar] [CrossRef]
  60. Thompson, E.; Taube, J.M.; Elwood, H.; Sharma, R.; Meeker, A.; Warzecha, H.N.; Argani, P.; Cimino-Mathews, A.; Emens, L.A. The Immune Microenvironment of Breast Ductal Carcinoma in Situ. Mod. Pathol. 2016, 29, 249–258. [Google Scholar] [CrossRef]
Figure 1. VCAN accumulation across breast cancers. (a) VCAN is expressed as one of five isoforms in breast cancer due to alternative splicing, each of which is recognized via IHC due to antibody binding of the conserved G1 domain. (b) Representative images of VCAN binning intensities. The scale bar is 100 µm. (c) Patients were grouped based on stromal intensity across all cancers and subsequently separated into VCAN-undetectable (intensity of 0) or VCAN-detectable (intensity of 1–3). (dg) The distribution of VCAN-detectable tumors is represented across patients of different stages, age ranges, ER status and subsequent ER/PR/HER2 status (Chi-square). VCAN expression as a function of subtype (h) and age within each subtype ((i) Jonckheere trend test) from TCGA data. *** p < 0.001.
Cancers 17 01435 g001
Figure 2. Estrogen receptor signaling increases VCAN expression in ER+ breast cancer cells. MCF7 cells were cultured for 96 h in DMEM + 10% charcoal-stripped FBS prior to the addition of 10 nm β-estradiol or vehicle control. qPCR was conducted to determine the expression of known estrogen response genes PGR and TFF1 as well as VCAN and ADAMTS1, 4, and 5. RNA was harvested from cells collected at the indicated time point following treatment and compared to vehicle-control cells collected at 10 h (t-test). * p < 0.05; ** p < 0.01.
Cancers 17 01435 g002
Figure 3. VCAN detection is associated with reduced presence of CD8+ T cells across ages and stages. (a) Representative images of staining of H&E, VCAN, and CD8+ TILs across examples of VCAN-detectable/undetectable samples. The scale bar is 100 µm. (bd) Total CD8+ TILs across VCAN intensity, stage of disease, and age of the patient (Jonckheere trend test). (e,f) Total CD8+ TILs across the stage of disease and age of patient according to VCAN status (Wilcoxon rank sum). * p < 0.05; ** p < 0.01.
Cancers 17 01435 g003
Figure 4. VCAN predicts CD8+ lymphocyte infiltration. (a,b) Total CD8+ TILs were assessed according to ER status alone (a) or in conjunction with VCAN status (b). (c,d) Similar assessments were conducted according to ER/PR/HER2 status. Statistical significance was determined using Wilcoxon rank-sum tests. (e) Gene-expression heatmaps clustered to show the relationship between CD8A and VCAN expression across breast cancer subtypes using TCGA data. (f) The localization of each CD8+ T cell was determined to be either epithelial (red arrow) or stromal (black arrow). The scale bar is 100 µm. (g,h) Epithelial and stromal CD8+ T cell numbers were assessed according to ER status. (il) Epithelial and stromal CD8+ T cell numbers were assessed across ER/PR/HER2 subgroups at baseline and according to VCAN status. (m,n) The epithelial % of CD8+ T cells was calculated as follows: (epithelial)/(epithelial + stromal) × 100. This was assessed across ER/PR/HER2 status and VCAN status. Statistical significance was determined using Wilcoxon rank-sum tests. (o) Gene expression analysis clustered to demonstrate associations between CD8A, COL1A1, FAP, VCAN, PDGFRB, PDPN, and ACTA2 across the TCGA PanCancer breast cancer database. * p < 0.05; ** p < 0.01.
Cancers 17 01435 g004
Figure 5. VCAN proteolysis predicts epithelial infiltration by CD8+ T cells. (a) Cartoon depiction of VCAN proteolysis via ADAMTS proteases. (b) Representative images of αDPEAAE binning intensities. The scale bar is 100 µM. (c) Distribution of patients based on αDPEAAE intensities. (d) Distribution of patients based on presence of VCAN and αDPEAAE. (+) indicates detectable, (−) indicates undetectable. (eg) Distribution of patients across stage, age, and ER/PR/HER2 status. (h,i) Average total or epithelial % of CD8+ T cells according to VCAN/αDPEAAE status. Statistical significance was determined using Wilcoxon rank-sum tests. * p < 0.05; ** p < 0.01.
Cancers 17 01435 g005
Figure 6. VCAN proteolysis is associated with immune infiltration pathways. (a) Top differentially enriched Hallmark gene sets identified from gene set enrichment analysis of VPP (VCANhi ADAMTS4hi TIMP3intermediate/low) and VPW (VCANhi ADAMTS4intermediate/low TIMP3hi) cohorts from the TCGA PanCancer Atlas Breast Invasive Carcinoma dataset. (b) Volcano plot of differential expression of genes in the top gene sets enriched in the VPP cohort. (c) Volcano plot of differential expression of genes in the top gene sets enriched in the VPW cohort. Dashed lines in (b,c) correspond to a log2 fold change of ±1.5 and a q-value of 0.05.
Cancers 17 01435 g006
Disclaimer/Publisher’s Note: The statements, opinions and data contained in all publications are solely those of the individual author(s) and contributor(s) and not of MDPI and/or the editor(s). MDPI and/or the editor(s) disclaim responsibility for any injury to people or property resulting from any ideas, methods, instructions or products referred to in the content.

