2.1. Radiation Alone
We estimate radiation-induced secondary cancer risks as excess relative risk (ERR), in order to be consistent with the results obtained by Sachs and Brenner [
19]. We first extract the proliferation rates of cells in lung, breast and thyroid tissue from the historical data. The number of radiotherapy fractions typically administered, the cell kill and mutation rates for breast and lung are taken from [
19]. The growth rate parameters (λ,
r) in the system are extracted using radiation-induced secondary breast and lung cancer data by Sachs and Brenner (see [
19]), and the proportionality factor, i.e., the function
in Equation (1) for thyroid is assumed to be equal to one. The relative growth rate of pre-malignant thyroid cells was determined to be 0.68 by fitting the function to the historical ERR data [
20].
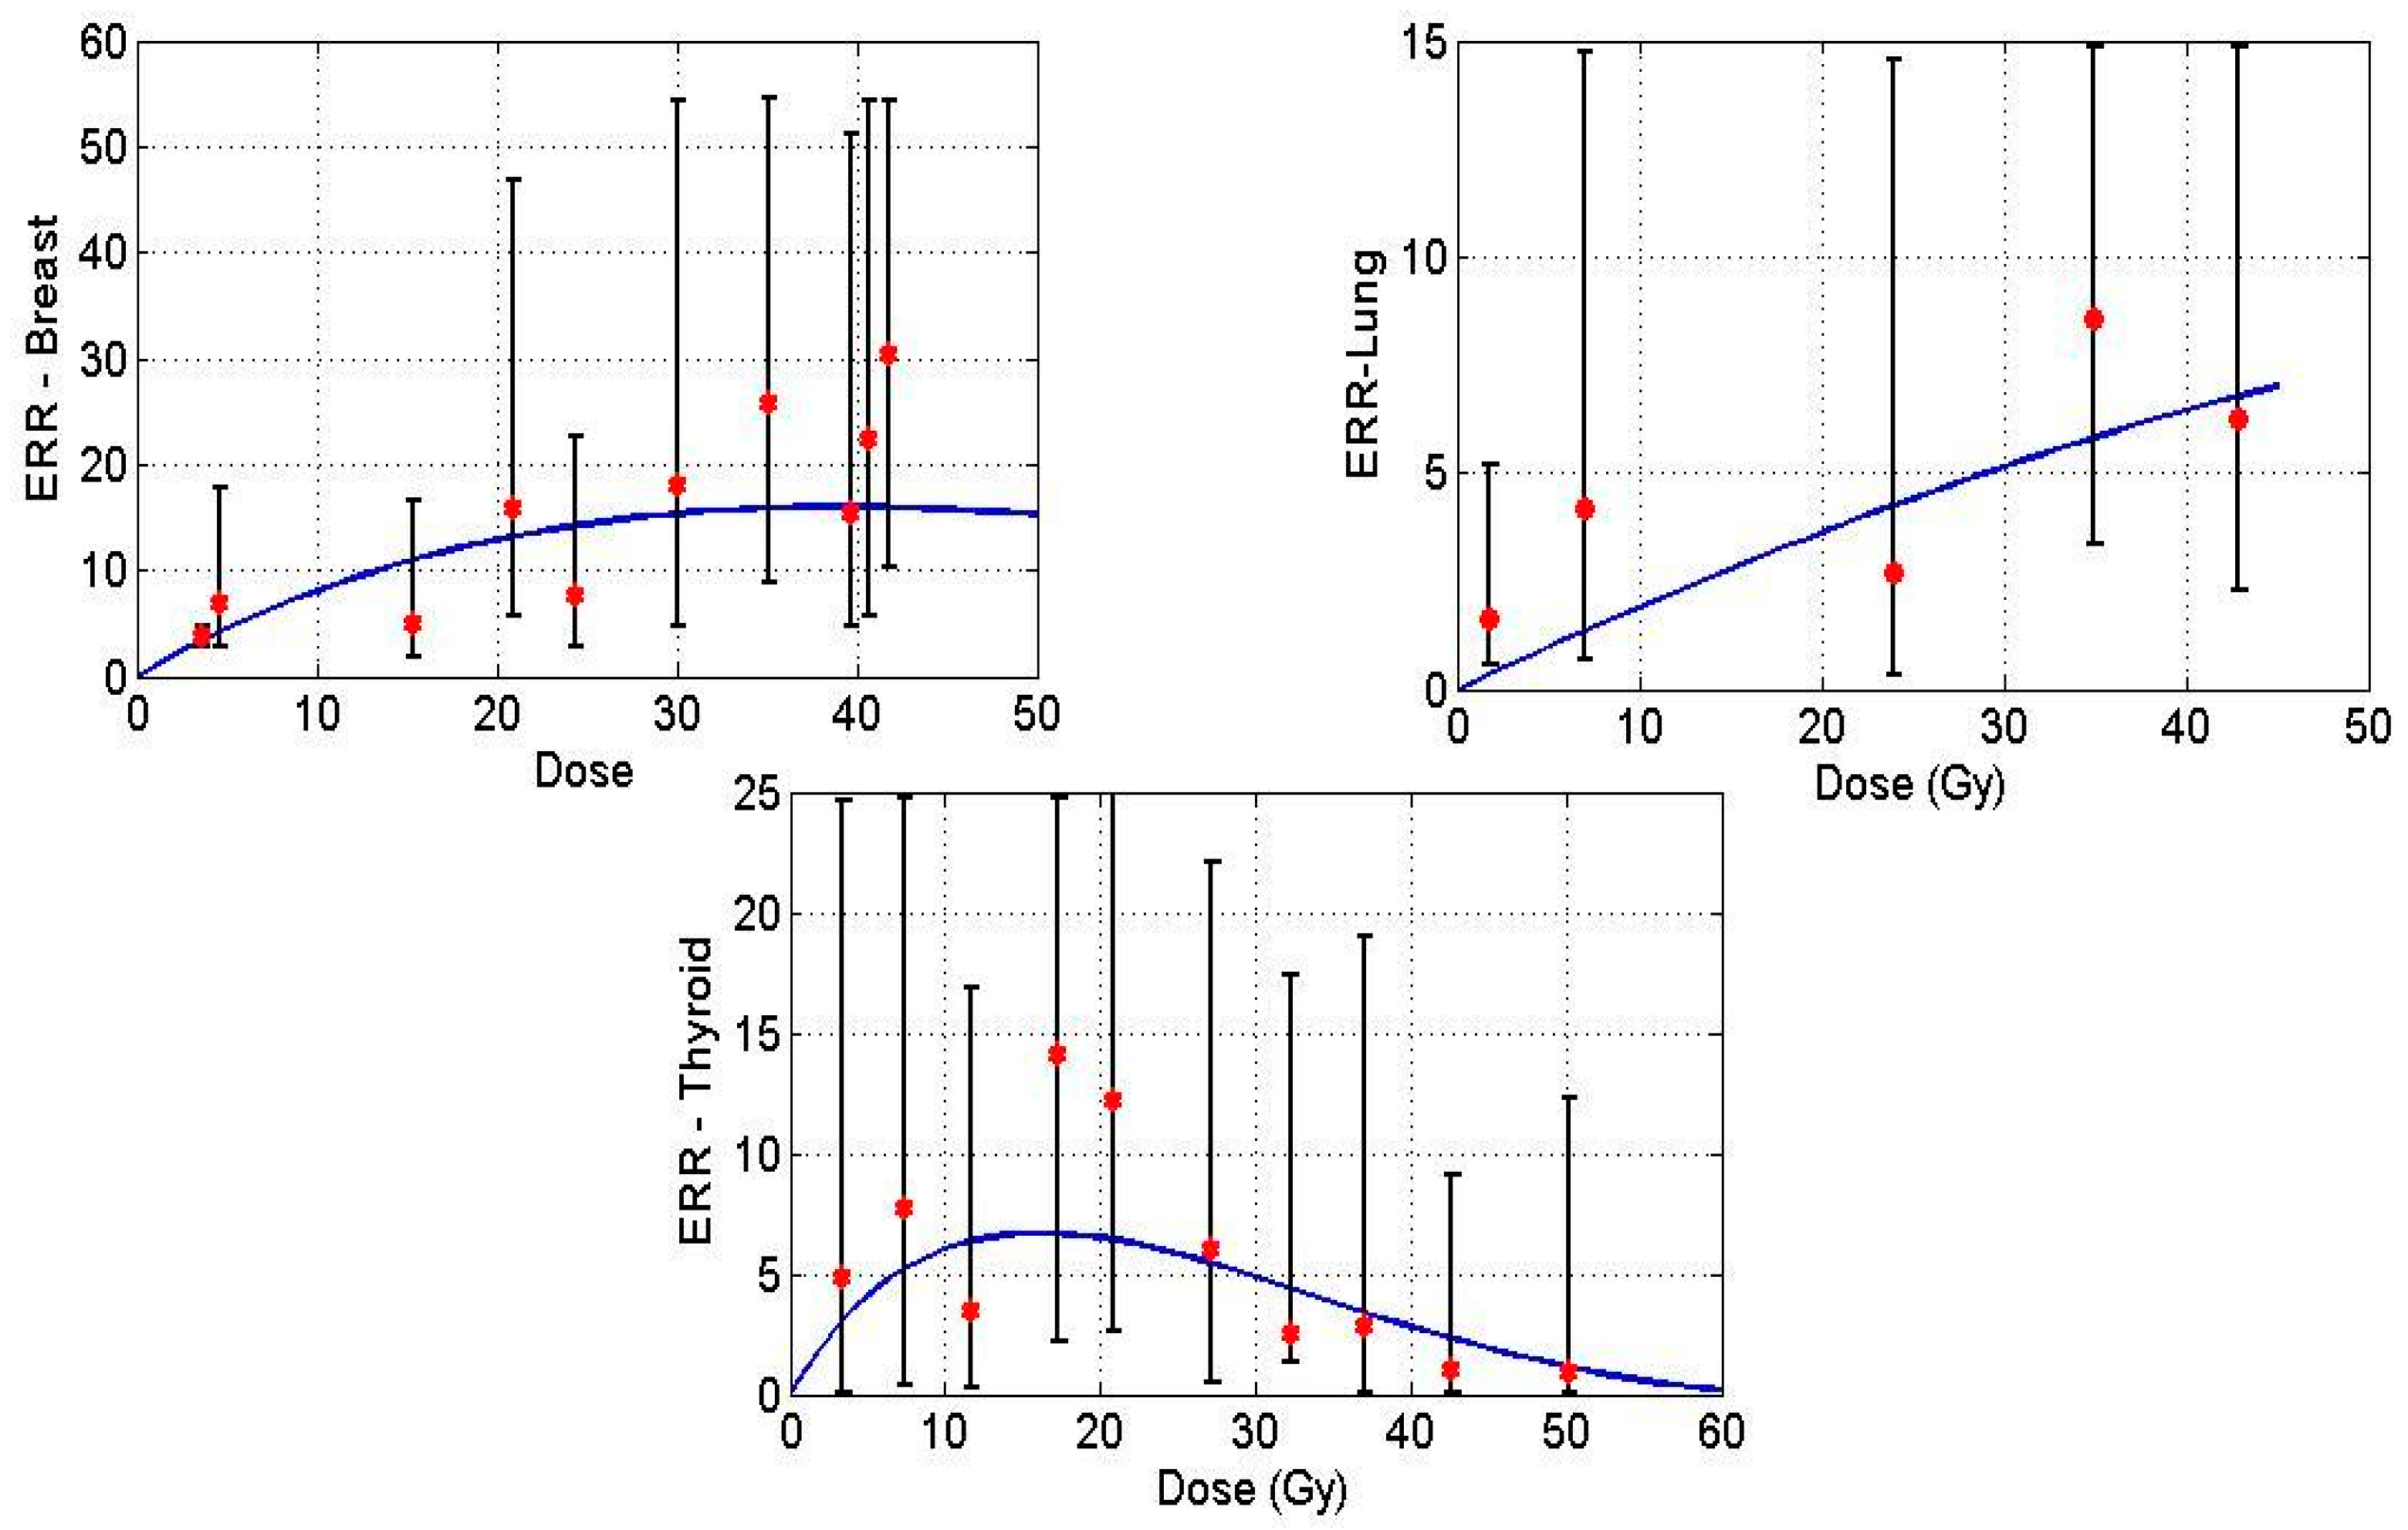
Table 1 summarizes the parameters used to estimate radiation-induced carcinogenic risks.
Figure 1 displays model predictions with the historical breast, lung and thyroid data treated with radiation treatment only for Hodgkin’s Lymphoma (HL) patients. Solid lines in the figures denote the prediction made by the mathematical model, and the points indicate epidemiological data.
2.2. Chemotherapy Alone
We use the same model in the aforementioned section to describe the action of chemotherapy in normal tissue. We assume the same mechanisms to shape the dose-response curve for chemotherapy, i.e., cell growth, cell kill and mutation induction. For the case of “chemotherapy only”, we assume the growth rate of normal and pre-malignant cells and the total number of normal cells to be similar to that used for estimating radiation-induced cancer risks. Having extracted the relative growth rate of pre-malignant cells for thyroid in the previous section, we now investigate the case of secondary cancer induction through chemotherapy only. The parameters such as average number of days per chemotherapy cycle, number of cycles and dose per cycle are taken from the literature (see
Table 2). Using the epidemiological data, we extract the mutation induction per cycle of chemotherapy for breast, lung and thyroid tissue. For this purpose, we assumed the cell kill in normal tissue to be 0.2 (m
2/mg) per cycle, close to the radiotherapy only value, as there is no data for chemotherapy cell kill in normal tissue. The cell kill parameter should be interpreted as an average value of alkylating agents used in a specific regimen. In addition, we also performed a sensitivity analysis by altering the value of cell kill from 0.1 to 0.3, and examined its effect on the mutation induction rate. The order of magnitude of the mutation induction rate did not change with varying cell kill, meaning that our results are relatively robust towards our initial assumptions. We consider the total number of cells N = 10
6 similar to the analysis on radiation-induced cancer risks.
Table 2 summarizes chemotherapy related parameters that are taken from the literature. The number of chemotherapy cycles used in epidemiological studies [
22,
23] was quantified into three groups, 1–4, 5–8 and >9, however, in [
20], groups were defined as lower, middle and upper tertiles. In order to approximate these groups quantitatively, we have chosen the average number of chemotherapy cycles for these groups to be 3, 6 and 10.
The proliferation rate of chemotherapy-induced pre-malignant cells is assumed to be the same as the growth rate of radiation-induced pre-malignant cells. Additionally, the proportional factor
used to estimate chemotherapy-induced risks is assumed to be the same as the one used to estimate radiation-induced carcinogenic risks. The model fit is carried out using secondary breast and lung cancer data in HL cancer survivors, and secondary thyroid cancer data from childhood cancer survivors [
17,
19,
20].
To estimate a specific dosage of a specific drug is not possible, as a variety of chemotherapy drugs are used in different combinations in the treatment of childhood cancer. Therefore, we used the dosage of mechlorethamine (12 mg/m
2) per cycle of MOPP (Mustargen, Oncovin, Procarbazine and Prednisone) [
25], one of the most popular regimens during the time the data was taken [
20,
22,
23], as substitute for the chemotherapy dose per cycle.
Following clinical practice, the fit was then carried out by varying the number of chemotherapy cycles
, while keeping the dosage per cycle fixed. The model fit for breast and lung is carried out by taking the average number of chemotherapy cycles per group (see, [
20,
22,
23]) as 3, 6 and 10. From the model fit, we extracted the chemotherapy-induced mutation induction parameter per cycle for breast, lung and thyroid, which are presented in
Table 3.
The low rate for chemotherapy-induced relative risks for breast is consistent with the historical data, which show that alkylating agents decrease the risk of secondary breast cancer in HL survivors [
20].
Table 4 and
Table 5 present a summary of relative risks predicted by a mathematical model against the epidemiological breast and lung data.
The overall increase or decrease in relative risk can also depend on the hormonal changes in the patient post treatment, especially in secondary breast cancer. Due to the scarcity of data with respect to hormonal status of a patient, we exclude the dependence of hormonal factors in this study. According to the formulation, ERR can asymptotically be close to zero but can never become zero, due to which we observe some relative risk for the breast organ.
As the low and medium exposed patients are grouped together in the data [
17], we therefore take the average number of cycles to be 5, and 10 for the highly exposed group.
Table 6 presents a summary of chemotherapy-induced relative risks for thyroid.
2.3. Concurrent Therapy
Many patients in the historical study have been given chemotherapeutic agents concurrently with radiation. In order to estimate the induced secondary cancer risks, it is essential to quantify the additional risk from the interaction between radiation and chemotherapy. In the following analysis, we want to explore if there is such an interaction and how it impacts secondary cancer risks.
All the concurrent therapy related parameters that we have derived from the clinical data up to this point will be used (see
Table 1 and
Table 2) to estimate the risk from concurrent therapy. All other parameters used are the same as the ones in
Table 2 and
Table 3.
Because the exact treatment schedules are not known, we assume that radiation is administered in the first cycle of chemotherapy. In the historical studies, radiation dose has been categorized into various groups (for instance, D = 0 Gy, D ≤ 20 Gy, D > 20 Gy) to quantify the associated secondary cancer risks. We assumed the average number of chemotherapy cycles to be 5 for all the three organs, estimated from the literature [
20,
22,
23]. Furthermore, the average radiation dose for lung, breast and thyroid is taken to be 20 Gy, 25 Gy, 20 Gy respectively.
Table 7 presents a summary of relative risks induced by concurrent therapy for all the critical organs, assuming that the terms for radio- and chemotherapy just act independently in terms of cell kill and mutation induction.
As can be seen from the model results in
Table 7, the predicted relative risks for lung are close to the clinical values, well within the confidence intervals of the epidemiological data [
23]. This indicates that radiation and chemotherapy might only have an additive effect for secondary cancer induction in these organs.
On the other hand, the model predicts the relative risks for breast and thyroid as ~9, ~7 respectively, far higher than those found in clinical studies [
20,
22]. As outlined in the methods, there is only one factor in the model that decreases the number of pre-malignant cells, and that is cell kill during therapy, because it can decrease the number of pre-malignant cells.
We therefore introduce an interaction term between the chemotherapeutic agent and radiation through a radiation sensitivity factor ε. This factor quantifies the radio-sensitization through chemotherapy within an organ of interest, and acts as a multiplier of the radiation dose. So we can fit the strength of the chemo-radiation interaction to the clinical data by adjusting the radiation sensitivity factor
ε.
Table 8 shows the results of the clinical data with an interacting term
ε = 2.6, the relative risks now within the confidence intervals from the historical data.
Summing up, our model predicts relative risks (RR) for lung within the confidence intervals of the epidemiological data, while for thyroid and breast we introduced a radio-sensitization factor for cell kill to bring the model prediction in line with the clinical data [
20,
22]. This implies that chemo-radiation interactions are highly tissue dependent.


