Abstract
Given the importance of perceived susceptibility to a disease in adopting preventive behaviors, and the negative impact of optimism bias on prevention, this paper aimed to explore to what extent comparative optimism bias (understood as the tendency to assess a lower probability for oneself to experience negative health events compared to others) is present in the specific context of the Covid-19 pandemic, in two countries with different profiles in terms of the spread of the disease: Italy and Romania. After identifying optimism bias in both countries, we tested whether it depends on respondents’ characteristics like gender, age, education, health status and whether or not they have the opportunity to work from home. We surveyed 1126 Romanians and 742 Italians, and found that optimism bias depends on self-reported health status, and that optimism bias increases with age. Inconclusive evidences were found regarding gender and education level, as well as the option to work from home.
1. Introduction
“People tend to think they are invulnerable. They expect others to be victims of misfortune, not themselves” [1].
After more than two months of virtually global lockdown, the mitigating measures against the COVID-19 pandemic, caused by the new coronavirus SARS-CoV-2, have entered into a new phase of less coercion and more personal responsibility. While gradually relaxing the restrictions on mobility and social interactions, governments continue to advocate the key role of maintaining health-preventing behaviors. If public risk perception was important from the beginning of the process, it becomes paramount at this point [2,3].
The research on previous pandemics (SARS, MERS) reflects upon correctly understanding the motivating factors behind the adoption of prevention [4,5,6,7]. Perceived susceptibility to the disease or perceived risk constitutes one major determinant for prevention under different theoretical frameworks applied to health psychology: theory of planned behavior [8], health belief model [9] or protection-motivation theory [10]. Perception is in general subject to emotions and judgment biases, among which the optimism bias is central in explaining how we process negative and positive information differently [11]. For the purpose of this research, we adopt the comparative view on optimism bias and define it as the tendency to assess a lower probability for oneself to experience negative health events compared to others [12]. Thus, it expresses a mismatch between perceived risk and actual risk [13]. As main features, the optimism bias distinguishes itself through a high resistance to de-biasing attempts [1,14,15] and a pervasiveness across populations and situations [16].
This paper proposes new empirical evidence regarding these two properties of the optimism bias and addresses the following questions:
- (1)
- Does the optimism bias affect people’s beliefs in the case of the Covid-19 pandemic, as it affects other contexts discussed in the literature?
- (2)
- Are there particular instances, and associated objective and subjective factors, of how the optimism bias was experienced in Romania and Italy, at different moments of the pandemic evolution?
The first research question builds upon how the optimism bias was measured in other health contexts, of different magnitudes and urgency: influenza A/H1N1 flu [17,18,19], Ebola [20] and different types of cancer screening (e.g., breast cancer [21]; sun related behavior [22]). Additionally, there is also some very recent work documenting the existence of optimism bias in the COVID-19 case, with application to the U.K., U.S., Germany [23], France, Italy, Switzerland [24], China [25] and Poland [26].
The second question brings a comparison between two countries with very different profiles. Given the rapid intra-community transmission of the virus, Italy stands as a reference case of susceptibility to, and severity of the disease. Romania stands at a different corner, having managed the health crisis with a reasonable number of infections and deaths. A direct comparison between Romania and Italy provides a layer of spatial and socio-economic variation against which the nature of optimism bias can be better understood. In addition, we aim to test whether the optimism bias depends on the level of perceived susceptibility. We go into a line of research that is currently inconclusive, showing mixed evidences regarding the relationship between personal risk judgement and objective risk factors [1,16].
The contribution of our work is multifold. First, our data captures real time measurement. In both cases we measured actual and not remembered experiences, avoiding potential memory biases [27]. Second, we propose a comparison of two alternative measurements for an optimism index, showing that direct versus indirect measurements has an influence on how people perceive their susceptibility to the virus. Third, we discuss several sources of perceived susceptibility introducing novel contextual variables, like the possibility of remote work, and we propose practical recommendations to improve preventive campaigns.
The rest of the paper is organized as follows: Section 2 presents our research hypotheses, measurement and data, and Section 3 follows in describing the analysis method. Section 4 illustrates the results, while the implications, conclusions and future directions of research are discussed in the last section.
2. Research Hypotheses, Questionnaire and Data
2.1. Research Hypotheses
The universality of cognitive biases is both an appealing and debatable topic, given the scarcity of comparable cross-cultural studies. The views on optimism bias are also split between favoring either the cultural variation perspective (e.g., from West to East, [28]) or rather its generalized acceptance, with the inclusion of the differentiating impact of self-efficacy beliefs filtered by individualist and collectivist dimensions [29,30].
Given that within Europe there is a sense of growing convergence between Western and Eastern Europe, we affiliate with the opinion that both Romanians and Italians experience the optimism bias.
Hypothesis 1a:
Romanians show an optimism bias when expressing their beliefs regarding a potential infection with Covid-19.
Hypothesis 1b:
Italians show an optimism bias when expressing their beliefs regarding a potential infection with Covid-19.
In Italy, the lack of information on the virus’ seriousness caused alternating optimistic and pessimistic moods, which reached the point of severe collective concern from March onwards. At the time of our measurement the pandemic severity in Italy was far higher than in Romania, and since this information was public knowledge, we expect a more salient optimism bias in the latter case. This is in line with the adaptive feature of optimism and the prediction that the bias magnitude increases with the level of uncertainty [11,31]. We postulate that uncertainty was higher in Romania at the time of measurement, as we were not able to estimate both the spread and the response of the population and of the health system.
Hypothesis 1c:
Romanians show a stronger optimism bias than Italians regarding a potential infection with Covid-19.
Previous literature shows that optimism bias transcends population socio-demographic characteristics [11].
Hypothesis 2a:
There are no statistically significant gender differences in how people experience the optimism bias, in Romania and Italy.
Hypothesis 2b:
There are no statistically significant educational differences in how people experience the optimism bias, in Romania and Italy.
However, there is a lack of consistency in the findings concerning the relation between optimism bias and age. We formulated hypothesis 2c following the more recent neuroimaging studies which favor the assumption that optimism bias is enhanced in older age [32].
Hypothesis 2c:
Optimism bias increases with age, in Romania and Italy.
Concrete exposure to the virus has an impact on people’s risk perception, making them more concerned about possible contamination. To that extent, the possibility of working from home may act as a proxy for non-exposure to the environment, and thus the virus, preserving the optimism illusion (by comparison to those than do not have the option of remote work).
Hypothesis 3:
Respondents who have the option to work from home are more optimistic than those who do not, in both countries.
Healthy individuals consistently experience a more salient optimism bias than depressed individuals [33,34,35]. Correspondingly, chronic patients report unrealistic pessimism in case of diabetes conditions [36], cancer [37,38] or hepatitis C [39]. Thus, we assume that self-reported health has an important influence on the bias.
Hypothesis 4:
Respondents with lower levels of self-reported health status are less optimistic than those with higher levels.
2.2. Questionnaire
Our surveys were conducted by adopting a combination of convenience sampling [40,41] and snowball sampling methods [42,43] through online questionnaires administered in Romania and Italy. Convenience sampling is increasingly used in online surveys [44] because they are cost-saving, fast, and have readily available respondents [45,46]. Similarly, snowball sampling, based on ”contacting one participant via the other” [43], is appreciated in online research for maximizing the time-cost trade off and increasing sample size [41]. Previous studies [42] showed that as the sample expands wave by wave, it approaches an equilibrium that is independent of the convenience sample of seeds from which it started. Therefore, any selection of seeds produces the same equilibrium sample composition if the sample size reaches a large enough threshold value, and it does not matter if the initial sample was non-random. For this research, Facebook, Linkedin and online personal networks have been used as initial convenience samples of seeds [42] from which the snowball sampling began.
Our questionnaire consisted of 11 questions (Table 1). We measured perceived severity to the infection with Covid-19 using four items adapted from previous measurements of perceived susceptibility to a disease [47]. In addition, we included questions related to the respondents’ demographic and socioeconomic backgrounds. We also measured self-reported health status, and whether the respondents could work remotely, given the pandemic and the imposed state of emergency in both countries.

Table 1.
The questionnaire.
The Romanian questionnaire was launched on Friday, 13 March 2020, at 1:36 p.m. and closed on 27 March at 12:27 p.m. As such, our measurement for Romania covers three periods of time: the beginning of discussions about the epidemic (13 March), the lockdown announcement (14 March), and the immediate post–implementation of the measure (16 March). The Italian questionnaire was launched on Wednesday 18 March 2020 at 5:40 p.m. and closed on 1 April at 01:27 a.m. Thus, we divided the responses in two categories: answers received until the total lockdown was announced (22 March at 9:50 p.m., active from 0:00 on 23 March), and responses after that moment.
2.3. Data
The Romanian data consists of 1126 respondents, while the Italian sample consists of 742 respondents. These sample sizes ensure that biases from the non-random initial selection of seeds can be excluded [42]. The descriptive statistics are presented in Table 2, showing sample similarities in terms of age, gender, education and self-reported health status. However, the percentage of the Italian respondents working remotely is 30% higher than the percentage of the Romanians. This can be explained by the higher severity of the crisis in Italy compared to Romania at the time of measurement, coupled with the early preparation of Italian companies for remote work (since the beginning of March, when a possible lockdown was considered).
Table 2.
Descriptive statistics.
3. Method
The items used to derive the optimism indices were measured on a 1–7 Likert scale, where 1 means total disagreement, and 7 means total agreement. We aligned with the literature accepting that variables measured on such scale can be considered numerical and therefore that usual statistical tests are robust and can be applied to such data [48,49,50,51]. Following this trend, we used the Wilcoxon rank sum test to test whether two samples are drawn from the same population, the Kruskal Wallis test to see whether three samples originate from the same population, and the post–hoc Pairwise Wilcoxon Rank Sum Tests whenever pairwise comparisons between group levels were required. If numerical variables were involved, we tested the statistical significance of their Spearman correlation. The use of non–parametric statistics was driven by the lack of normality of our variables. Statistical inference based on bootstrapping compensated for not randomly selected samples. We used R software, version 3.4.3. This section is organized as follows: (1) we explain how we measured the optimism indices; (2) we show that optimism bias exists, both for Romania and Italy; (3) we explore whether optimism indices differ across countries; (4) we explore potential correlations between each index and other variables.
We measure optimism bias based on optimism indices derived using a standard comparative methodology [1]:
Optimism index = Perceived likelihood that an infection with Covid-19 can happen to the respondent − Perceived likelihood that an infection with Covid-19 can happen to another person
Previous research suggests that differences in optimism bias are rather the result of different measurement methods, and that comparisons between methods are usually impossible as each research employs one single measurement [52]. Therefore, we employ both direct and indirect measurement [53]. In addition, to account for the order in which risk assessment is made, we alternate the questions to assess the respondent’s perceived risk first, the risk attached to another person and again the respondent’s risk [54]. Table 3 summarizes the items used in assessing the optimism indices.
Table 3.
Items involved in the optimism bias measurement.
Table 4 presents the descriptive statistics attached to each index, and Figure 1 shows comparative distributions by country.
Table 4.
Descriptive statistics of the optimism indices.
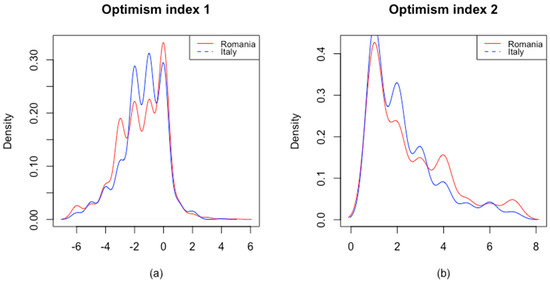
Figure 1.
Optimism indices (a)–indirect measurement, (b) direct measurement.
The next section presents arguments in favor of optimism bias, and reports the tests for potential differences between countries, and across measurements.
4. Results
This section is organized as follows: first, we test whether optimism bias exists in both countries, and if Italians are less optimistic than Romanians, given the difference in pandemic severity. Second, we explore whether personal characteristics like gender, education, perceived health status and age, as well as the respondents’ opportunity for remote work, are related to their level of optimism.
4.1. Testing Optimism Bias
Optimism bias exists if the respondents systematically under-evaluate their likelihood to get infected compared to the likelihood assigned to other people [1]. To prove that optimism bias exists we test whether the distribution of the optimism index has zero as true location for the first index, and four for the second index.
As Figure 1a shows, the values of the first optimism index that resulted from indirect measurement are systematically negative, showing that in both countries the respondents underestimated their likelihood to get infected with Covid-19 compared to the likelihood assigned to other people. A Wilcoxon rank sum test shows that the true location for both distributions is lower than 0 (p-value < 2.2 × 10⁻¹⁶ for both Romania and Italy), thus confirming that optimism bias exists (H1a and b). In addition, a similar test shows that the two distributions are not different (W = 406575, p-value = 0.316). We conclude that in the indirect measurement, the Romanian respondents are as optimistic as the Italians, thus infirming H1c.
Figure 1b shows the distribution of the third index, obtained from direct assessment. Given the 1–7 measurement, the lack of optimism bias is translated into a distribution centered on the middle value, 4. Our tests show that optimism bias exists both for Romania and Italy for the direct measurement, and also that Romanians are slightly more optimistic than Italians, thus confirming H1a, b and c. Table 5 summarizes these findings.
Table 5.
Tests associated to the first research hypothesis, H1.
The next subsection explores what characteristics are related to optimism bias, for each country and measurement.
4.2. Non–Parametric Tests to Identify Correlations
To test the second research hypothesis, we checked whether our optimism indices differed across gender and education, using the same Mann-Whitney-Wilcoxon Tests as before. In addition, we used the Spearman Rho to identify potential significant correlations between optimism bias and age.
Table 6 summarizes the findings, showing that for the Romanian case there are no gender differences regardless of the measurement method, so H2a is supported. In Italy there are gender differences only for index 1, and a supplementary test shows that women scored higher than men (W = 58846, p-value = 0.01353).
Table 6.
Tests related to H2 and H3.
The results also show that in the Romanian case higher education is related to lower levels of optimism (W = 117340, p-value = 1.098 × 10⁻⁵ for index 1, and W = 110986, p-value = 1.01 × 10⁻⁸ for index 2), so H2b is rejected. The Italian case is different, showing no differences in optimism level by education regardless the index, so H2b is supported.
With respect to age all correlations are positive and statistically significant, so H2(c) is supported. The last variable discussed in Table 6 accounts for potential correlation between the respondents’ level of optimism and whether or not they have the option to work from home. Regardless of the measurement, there is no correlation in the Italian case, nor in the case of the first optimism index in Romania. The second index in the Romanian case differs across categories, supplementary tests showing that those who have the option to work from home score higher levels of optimism than those who don’t have this option (W = 160143, p-value = 0.0041), thus H3 is not confirmed.
In the last part we used the Kruskal-Wallis test to check whether self-reported health status influences the level of optimism. In addition, when necessary, we applied the post–hoc pairwise Wilcoxon rank sum tests to understand which categories are different. Table 7 shows that there are indeed differences in optimism across health status categories, as expected.
Table 7.
Optimism level by health status.
The post hoc tests presented in Table 8 and Table 9 show that H4 is confirmed for the two extreme categories: lower than others and higher than others health status.
Table 8.
Post–hoc test for health status: Optimism index 1.
Table 9.
Post–hoc test for health status: Optimism index 2.
We found that those with self-reported health status lower than others score higher than those with better health compared to other people, which confirms that lower health status is associated with less optimistic attitudes compared to better health status.
5. Conclusions, Implications and Future Research
Given the importance of perceived susceptibility to a disease in adopting preventive behavior, and the negative impact of optimism bias on prevention, this paper aimed to explore to what extent optimism bias is present in the specific context of the Covid-19 pandemic, in two countries with different profiles.
Our first goal was to explore whether optimism bias exists in each context. Second, given the different evolution of the disease in the two countries, we expected the Italians to be less optimistic than Romanians. After identifying optimism bias in both countries, we tested whether it depends on respondents’ characteristics like gender, age, education, health status and possibility to work remotely. Following the extensive literature showing that optimism bias depends on the measurement, we tested our hypotheses across direct and indirect measurements.
5.1. Theoretical Implications
A first general comment on the study concerns the confirmation of optimism biases [11] in influencing people’s perception of the risk of contagion caused by Covid-19. This clearly emerges in both the Romanian and the Italian samples. Moreover, the two indices are substantially similar between the two countries.
The results captured by H1a and H1b are in line with the existing literature, which states that optimism bias affects people’s beliefs in the case of collective health issues [20,23,24]. However, the magnitude of the bias did not increase with the level of uncertainty and perceived risk, contrary to what previous studies highlighted [11,31]. Connected with this result is what emerged with regard to the hypothesis (H1c) that Romanians show a stronger optimism bias than Italians facing the Covid-19 disease, given the higher severity of the infection in Italy. The hypothesis was only partially confirmed, as the optimism bias of the Romanian sample was only slightly higher than the Italian one.
The analysis of characteristics, both objective and subjective, associated with optimism bias, showed contrasting results. With regard to gender, no differences emerged in Romania between males and females, while in Italy some difference emerged for the first index (OPT 1, Table 3). This result substantially confirms the initial hypotheses (H2a), in line with the literature about the relationship between risk perception and socio-demographic factors. However, other studies on gender differences and risk attitude show that males engage in more risk-taking behaviors than females [55], due to various factors including an increased self-esteem which strengthens the optimism bias [56,57]. These studies found larger gender differences in observed behavior than in self-report measures. Therefore, since our survey was based on self-reported evaluations, a slight difference between males and females found in Italy is consistent with this perspective.
Contrasting results have also been found on the differences by education (H2b). In Romania, as the level of education increases, the optimism bias decreases. Therefore, what the literature reported was not confirmed for Romania, indicating that a lower level of education could enhance the optimism bias. On the other side, in the case of Italy, the lack of clarity of the information provided by public authorities and scientists weakened the ability to assess the perceived risk, even by people with a higher level of education. It is necessary to remember that social networks fueled confusion by feeding disinformation mechanisms and fake news [2,58,59,60].
Age was confirmed as a factor that positively affects the optimism bias (H2c), in line with what the most recent contributions suggested [32]. However, the literature seems controversial on this topic. If the positive relationship between age and dispositional optimism–defined as a generalized positive expectation for the future [61,62]–is recognized, less homogeneous results emerge from studies on optimism bias, especially if associated with risk perception, which often lowers as age decreases [63,64].
Among the objective factors, working from home–hypothesized to correlate with a lower risk perception (H3)–was instead unrelated. A possible explanation is that in the initial stages of the epidemic (or even more advanced in the case of Italy) it was not clear whether social isolation achieved through working remotely was indeed related to a lower probability of being infected.
Finally, the self-reported health status of interviewees was, as hypothesized (H4), influential on the level of optimism regarding the risk of contracting the infection. This confirms that poor health affects the perception of being exposed to greater risk. However, it should be noted that in the specific case of Covid-19 it was clear enough from the beginning, also at the informative level, that certain pathologies significantly increased the risk of complications in the disease and even death [65]. It must be underlined that the greater risk was related to the aggravation of the disease, not to the possibility of contagion, and this may confirm that the optimism bias can be influenced by factors not directly related to the causal process under analysis.
The survey also revealed that the level of optimism was reduced only for those who reported a worse state of health than others, while those reporting conditions similar to the other people were not affected by a drop in optimism. This further confirms that what weakens the optimism bias mechanism are objective conditions of fragility, rather than other conditioning factors, including those related to how information is addressed.
5.2. Practical Implications
The aim of this study was to verify whether the optimism bias affects people’s beliefs in the case of the Covid-19 pandemic, and whether some identified factors (gender, level of education, age, possibility to work from home and state of health) influence the level of optimism. The results contribute to the existing knowledge in this field and inform interventions.
First of all, in the two analyzed countries the optimism bias occurred on the occasion of the Covid-19 pandemic, similarly to what happened in previous contexts of endemic and pandemic diseases [17,20,22,66,67]. This provides useful indication on the reaction of population facing the emergence of a new and not well-known (or even unknown) disease, as it was the case for Ebola, HIV, Sars and others, albeit with different dynamics, diffusion level and severity. Although looking at the experience of previous diseases can be useful to retrieve precious indications on how to manage population reaction, in the case of Covid-19 the novelty of the disease and the speed of contagion did not allow certain indications on how to prevent and contrast it. This affected people’s perceptions and their behaviors. In such circumstances, the communication from public authorities plays a key role, in order to provide information as clearly as possible and reduce psychological effects.
Information/communication campaigns should be aimed at addressing people’s mental models [68] and the consequent inferential rules which arise when people lack explicit information about the magnitude of risks [69]. More specifically, it should be recognized that there is a difference between people understanding that something is risky, and acknowledging that they are personally at risk [70,71].
Taking the example of information campaigns adopted in previous epidemics with the objective to decrease transmission, such as pandemic (H1N1) 2009 [72], bird flu A (H5N1) [73] and others [64] differences emerged in individual or group-specific exposure to public health communication messages, and in the capacity to act upon the information received by specific sub-groups. Such differences are in line with what have been called communication inequalities by previous studies [64].
What emerged from our study is that there are differences in the subjective characteristics and objective conditions of the population that lead to differentiated behaviors regarding the optimism bias.
Understanding these factors can help communication campaigns tailor messages to different target audiences, by calibrating the messaging format and optimizing channels of communication. More focused and better-addressed communication can close the gap of communication inequality and increase the effectiveness of the response to pandemics. With this aim, it is important to work with physicians, communication specialists and mass media to improve the reach, accuracy and timeliness of public health messages. However, in the case of Covid-19, an excess of communication, both official and unofficial, the latter conveyed mainly by social media, led to a state of uncertainty that increased the probability of strengthening behaviors related to people’s mental models. Related to this is the inoculation theory [74,75], which suggests that if people are given the worst-case scenario when only a hypothetical risk of catastrophe exists, they will process the risk as less dangerous, come to terms, and be less likely to panic should a pandemic occur [73].
5.3. Limitations and Future Research
The main limitation of this research is that our data was collected based on convenience sampling combined with snowball sampling. Although we found support in the literature that the sample size ran out the risk of biases, we still consider that a similar study would bring more information if conducted on country-representative data. In the meantime, during pandemics there are many other priorities that the public health system usually faces, therefore real time attitude measurement on country representative samples may not be a priority. An important future direction of research involves expanding the list of measures to capture optimism bias by considering some widely documented effects that impact our perception. The framing effect in measuring optimism may be one future direction. Further cultural variation may also be useful in strengthening the theoretical background on optimism bias during health crises.
Author Contributions
Conceptualization, E.D.; methodology, E.D.; software, E.D.; validation, E.D., F.M. and R.I.-C.; formal analysis, E.D.; investigation, E.D., F.M. and R.I.-C.; data curation, E.D. and F.M.; writing—original draft preparation, E.D., F.M. and R.I.-C.; writing—review and editing, E.D., F.M. and R.I.-C. All authors have read and agreed to the published version of the manuscript.
Funding
This research received no external funding.
Acknowledgments
We express our gratitude, and dedicate this paper to Raffaella Pittureri, and to all her Italian and Romanian medical professionals who fought against Covid-19 in hospitals of both countries.
Conflicts of Interest
The authors declare no conflict of interest.
References
- Weinstein, N.D. Unrealistic optimism about future life events. J. Personal. Soc. Psychol. 1980, 39, 806–820. [Google Scholar] [CrossRef]
- Van Bavel, J.J.; Baicker, K.; Boggio, P.; Capraro, V.; Cichocka, A.; Crockett, M.; Cikara, M.; Crum, A.; Douglas, K.; Druckman, J.; et al. Using social and behavioural science to support COVID-19 pandemic response. Nat. Hum. Behav. 2020, 4, 460–471. [Google Scholar] [CrossRef] [PubMed]
- Dryhurst, S.; Schneider, C.R.; Kerr, J.; Freeman, A.L.J.; Recchia, G.; van der Bles, A.M.; Spiegelhalter, D.; van der Linden, S. Risk perceptions of COVID-19 around the world. J. Risk Res. 2020, 1–13. [Google Scholar] [CrossRef]
- Peeri, N.C.; Shrestha, N.; Rahman, M.S.; Zaki, R.; Tan, Z.; Bibi, S.; Baghbanzadeh, M.; Aghamohammadi, N.; Zhang, W.; Haque, U. The SARS, MERS and novel coronavirus (COVID-19) epidemics, the newest and biggest global health threats: What lessons have we learned? Int. J. Epidemiol. 2020. [Google Scholar] [CrossRef]
- Park, J.-H.; Cheong, H.-K.; Son, D.-Y.; Kim, S.-U.; Ha, C.-M. Perceptions and behaviors related to hand hygiene for the prevention of H1N1 influenza transmission among Korean university students during the peak pandemic period. BMC Infect. Dis. 2010, 10, 222. [Google Scholar] [CrossRef]
- Bish, A.; Michie, S. Demographic and attitudinal determinants of protective behaviours during a pandemic: A review. Br. J. Health Psychol. 2010, 15, 797–824. [Google Scholar] [CrossRef]
- Agüero, F.; Adell, M.N.; Pérez Giménez, A.; López Medina, M.J.; Garcia Continente, X. Adoption of preventive measures during and after the 2009 influenza A (H1N1) virus pandemic peak in Spain. Prev. Med. 2011, 53, 203–206. [Google Scholar] [CrossRef]
- Godin, G.; Kok, G. The theory of planned behavior: A review of its applications to health-related behaviors. Am. J. Health Promot. 1996, 11, 87–98. [Google Scholar] [CrossRef]
- Champion, V.L.; Skinner, C.S. The health belief model. In Health Behavior and Health Education: Theory, Research, and Practice, 4th ed.; Jossey-Bass: San Francisco, CA, USA, 2008; pp. 45–65. ISBN 978-0-7879-9614-7. [Google Scholar]
- Floyd, D.L.; Prentice-Dunn, S.; Rogers, R.W. A meta-analysis of research on protection motivation theory. J. Appl. Soc. Psychol. 2000, 30, 407–429. [Google Scholar] [CrossRef]
- Sharot, T. The optimism bias. Curr. Biol. 2011, 21, R941–R945. [Google Scholar] [CrossRef]
- Klein, G. Naturalistic decision making. Hum. Factors 2008, 50, 456–460. [Google Scholar] [CrossRef] [PubMed]
- Jones, S.M.W.; Gell, N.M.; Roth, J.A.; Scholes, D.; LaCroix, A.Z. The Relationship of Perceived Risk and Biases in Perceived Risk to Fracture Prevention Behavior in Older Women. Ann. Behav. Med. Publ. Soc. Behav. Med. 2015, 49, 696–703. [Google Scholar] [CrossRef] [PubMed]
- Ludolph, R.; Schulz, P.J. Debiasing Health-Related Judgments and Decision Making: A Systematic Review. Med. Decis. Mak. Int. J. Soc. Med. Decis. Mak. 2018, 38, 3–13. [Google Scholar] [CrossRef]
- Weinstein, N.D.; Klein, W.M. Resistance of personal risk perceptions to debiasing interventions. Health Psychol. 1995, 14, 132–140. [Google Scholar] [CrossRef] [PubMed]
- Gouveia, S.O.; Clarke, V. Optimistic bias for negative and positive events. Health Educ. 2001, 101, 228–234. [Google Scholar] [CrossRef]
- Kim, H.K.; Niederdeppe, J. Exploring optimistic bias and the integrative model of behavioral prediction in the context of a campus influenza outbreak. J. Health Commun. 2013, 18, 206–222. [Google Scholar] [CrossRef]
- Rudisill, C. How do we handle new health risks? Risk perception, optimism, and behaviors regarding the H1N1 virus. J. Risk Res. 2013, 16, 959–980. [Google Scholar] [CrossRef]
- Cho, H.; Lee, J.-S.; Lee, S. Optimistic bias about H1N1 flu: Testing the links between risk communication, optimistic bias, and self-protection behavior. Health Commun. 2013, 28, 146–158. [Google Scholar] [CrossRef]
- Fischhoff, B.; Wong-Parodi, G.; Garfin, D.R.; Holman, E.A.; Silver, R.C. Public Understanding of Ebola Risks: Mastering an Unfamiliar Threat. Risk Anal. Off. Publ. Soc. Risk Anal. 2018, 38, 71–83. [Google Scholar] [CrossRef]
- Katapodi, M.C.; Lee, K.A.; Facione, N.C.; Dodd, M.J. Predictors of perceived breast cancer risk and the relation between perceived risk and breast cancer screening: A meta-analytic review. Prev. Med. 2004, 38, 388–402. [Google Scholar] [CrossRef]
- Bränström, R.; Kristjansson, S.; Ullén, H. Risk perception, optimistic bias, and readiness to change sun related behaviour. Eur. J. Public Health 2006, 16, 492–497. [Google Scholar] [CrossRef] [PubMed]
- Kuper-Smith, B.J.; Doppelhofer, L.M.; Oganian, Y.; Rosenblau, G.; Korn, C. Optimistic beliefs about the personal impact of COVID-19. PsyArXiv 2020. [Google Scholar] [CrossRef]
- Raude, J.; Debin, M.; Souty, C.; Guerrisi, C.; Turbelin, C.; Falchi, A.; Bonmarin, I.; Paolotti, D.; Moreno, Y.; Obi, C.; et al. Are people excessively pessimistic about the risk of coronavirus infection? PsyArXiv 2020. [Google Scholar] [CrossRef]
- Study of COVID-19 Risk Communication Finds “Optimistic Bias” Slows Preventive Behavior. Available online: https://today.uconn.edu/2020/04/study-covid-19-risk-communication-finds-optimistic-bias-slows-preventive-behavior/ (accessed on 20 June 2020).
- Dolinski, D.; Dolinska, B.; Zmaczynska-Witek, B.; Banach, M.; Kulesza, W. Unrealistic Optimism in the Time of Coronavirus Pandemic: May It Help to Kill, If So—Whom: Disease or the Person? J. Clin. Med. 2020, 9, 1464. [Google Scholar] [CrossRef]
- Levine, L.J.; Lench, H.C.; Karnaze, M.M.; Carlson, S.J. Bias in predicted and remembered emotion. Curr. Opin. Behav. Sci. 2018, 19, 73–77. [Google Scholar] [CrossRef]
- Heine, S.J.; Lehman, D.R. Cultural variation in unrealistic optimism: Does the West feel more vulnerable than the East? J. Personal. Soc. Psychol. 1995, 68, 595–607. [Google Scholar] [CrossRef]
- Gierlach, E.; Belsher, B.E.; Beutler, L.E. Cross-Cultural Differences in Risk Perceptions of Disasters. Risk Anal. 2010, 30, 1539–1549. [Google Scholar] [CrossRef]
- Klassen, R.M. Optimism and realism: A review of self-efficacy from a cross-cultural perspective. Int. J. Psychol. 2004, 39, 205–230. [Google Scholar] [CrossRef]
- Johnson, D.D.P.; Fowler, J.H. The evolution of overconfidence. Nature 2011, 477, 317–320. [Google Scholar] [CrossRef]
- Chowdhury, R.; Sharot, T.; Wolfe, T.; Düzel, E.; Dolan, R.J. Optimistic update bias increases in older age. Psychol. Med. 2014, 44, 2003–2012. [Google Scholar] [CrossRef]
- Strunk, D.R.; Lopez, H.; DeRubeis, R.J. Depressive symptoms are associated with unrealistic negative predictions of future life events. Behav. Res. Ther. 2006, 44, 861–882. [Google Scholar] [CrossRef] [PubMed]
- Korn, C.W.; Sharot, T.; Walter, H.; Heekeren, H.R.; Dolan, R.J. Depression is related to an absence of optimistically biased belief updating about future life events. Psychol. Med. 2014, 44, 579–592. [Google Scholar] [CrossRef] [PubMed]
- Garrett, N.; Sharot, T.; Faulkner, P.; Korn, C.W.; Roiser, J.P.; Dolan, R.J. Losing the rose tinted glasses: Neural substrates of unbiased belief updating in depression. Front. Hum. Neurosci. 2014, 8, 639. [Google Scholar] [CrossRef] [PubMed]
- Asimakopoulou, K.G.; Skinner, T.C.; Spimpolo, J.; Marsh, S.; Fox, C. Unrealistic pessimism about risk of coronary heart disease and stroke in patients with type 2 diabetes. Patient Educ. Couns. 2008, 71, 95–101. [Google Scholar] [CrossRef]
- Jansen, L.A.; Mahadevan, D.; Appelbaum, P.S.; Klein, W.M.P.; Weinstein, N.D.; Mori, M.; Degnin, C.; Sulmasy, D.P. Perceptions of control and unrealistic optimism in early-phase cancer trials. J. Med. Ethics 2018, 44, 121–127. [Google Scholar] [CrossRef]
- Jansen, L.A.; Mahadevan, D.; Appelbaum, P.S.; Klein, W.M.P.; Weinstein, N.D.; Mori, M.; Degnin, C.; Sulmasy, D.P. Variations in Unrealistic Optimism Between Acceptors and Decliners of Early Phase Cancer Trials. J. Empir. Res. Hum. Res. Ethics 2017, 12, 280–288. [Google Scholar] [CrossRef]
- Treloar, C.; Hopwood, M. “Look, I’m fit, I’m positive and I’ll be all right, thank you very much”: Coping with hepatitis C treatment and unrealistic optimism. Psychol. Health Med. 2008, 13, 360–366. [Google Scholar] [CrossRef]
- Kitchenham, B.; Pfleeger, S.L. Principles of survey research: Part 5: Populations and samples. ACM SIGSOFT Softw. Eng. Notes 2002, 27, 17–20. [Google Scholar] [CrossRef]
- Baltar, F.; Brunet, I. Social research 2.0: Virtual snowball sampling method using Facebook. Internet Res. 2012, 22, 57–74. [Google Scholar] [CrossRef]
- Heckathorn, D.D. Snowball versus respondent-driven sampling. Sociol. Methodol. 2011, 41, 355–366. [Google Scholar] [CrossRef]
- Browne, K. Snowball sampling: Using social networks to research non-heterosexual women. Int. J. Soc. Res. Methodol. 2005, 8, 47–60. [Google Scholar] [CrossRef]
- Leiner, D. Our Research’s Breadth Lives on Convenience Samples. A Case Study of the Online Respondent Pool “SoSci Panel”. Stud. Commun. Media 2016, 5, 367–396. [Google Scholar] [CrossRef]
- Schmidt, M.; Hollensen, S. Marketing Research: An International Approach; Prentice Hall/Financial Times: Harlow, UK; New York, NY, USA, 2006; ISBN 978-0-273-64635-8. [Google Scholar]
- Wright, K.B. Researching Internet-Based Populations: Advantages and Disadvantages of Online Survey Research, Online Questionnaire Authoring Software Packages, and Web Survey Services. J. Comput. Mediat. Commun. 2005, 10. [Google Scholar] [CrossRef]
- Champion, V.L. Instrument development for health belief model constructs. Adv. Nurs. Sci. 1984, 6, 73–85. [Google Scholar] [CrossRef]
- Baggaley, A.R.; Hull, A.L. The Effect of Nonlinear Transformations on a Likert Scale. Eval. Health Prof. 1983, 6, 483–491. [Google Scholar] [CrossRef]
- Maurer, T.J.; Pierce, H.R. A comparison of Likert scale and traditional measures of self-efficacy. J. Appl. Psychol. 1998, 83, 324–329. [Google Scholar] [CrossRef]
- Norman, G. Likert scales, levels of measurement and the “laws” of statistics. Adv. Health Sci. Educ. 2010, 15, 625–632. [Google Scholar] [CrossRef]
- Vickers, A.J. Comparison of an ordinal and a continuous outcome measure of muscle soreness. Int. J. Technol. Assess. Health Care 1999, 15, 709–716. [Google Scholar] [CrossRef]
- Hoorens, V.; Buunk, B.P. Social Comparison of Health Risks: Locus of Control, the Person-Positivity Bias, and Unrealistic Optimism. J. Appl. Soc. Psychol. 1993, 23, 291–302. [Google Scholar] [CrossRef]
- Fife-Schaw, C.; Barnett, J. Measuring Optimistic Bias. In Doing Social Psychology Research; Breakwell, G.M., Ed.; The British Psychological Society and Blackwell Publishing Ltd.: Oxford, UK, 2008; pp. 54–74. ISBN 978-0-470-77627-8. [Google Scholar]
- Otten, W.; Van Der Pligt, J. Context Effects in the Measurement of Comparative Optimism in Probability Judgments. J. Soc. Clin. Psychol. 1996, 15, 80–101. [Google Scholar] [CrossRef]
- Ronay, R.; Kim, D.-Y. Gender differences in explicit and implicit risk attitudes: A socially facilitated phenomenon. Br. J. Soc. Psychol. 2006, 45, 397–419. [Google Scholar] [CrossRef] [PubMed]
- Caprara, G.V.; Steca, P.; Alessandri, G.; Abela, J.R.; McWhinnie, C.M. Positive orientation: Explorations on what is common to life satisfaction, self-esteem, and optimism. Epidemiol. Psichiatr. Soc. 2010, 19, 63–71. [Google Scholar] [CrossRef] [PubMed]
- Puskar, K.R.; Bernardo, L.M.; Ren, D.; Haley, T.M.; Tark, K.H.; Switala, J.; Siemon, L. Self-esteem and optimism in rural youth: Gender differences. Contemp. Nurse 2010, 34, 190–198. [Google Scholar] [CrossRef] [PubMed]
- Kouzy, R.; Abi Jaoude, J.; Kraitem, A.; El Alam, M.B.; Karam, B.; Adib, E.; Zarka, J.; Traboulsi, C.; Akl, E.W.; Baddour, K. Coronavirus Goes Viral: Quantifying the COVID-19 Misinformation Epidemic on Twitter. Cureus 2020, 12, e7255. [Google Scholar] [CrossRef]
- Types, Sources, and Claims of Covid-19 misinformation. Available online: https://reutersinstitute.politics.ox.ac.uk/types-sources-and-claims-covid-19-misinformation (accessed on 15 June 2020).
- Pennycook, G.; McPhetres, J.; Zhang, Y.; Rand, D.G. Fighting COVID-19 misinformation on social media: Experimental evidence for a scalable accuracy nudge intervention. Psychol. Sci. 2020, 31, 770–780. [Google Scholar] [CrossRef]
- Scheier, M.F.; Carver, C.S. Optimism, coping, and health: Assessment and implications of generalized outcome expectancies. Health Psychol. 1985, 4, 219–247. [Google Scholar] [CrossRef]
- You, J.; Fung, H.H.L.; Isaacowitz, D.M. Age differences in dispositional optimism: A cross-cultural study. Eur. J. Ageing 2009, 6. [Google Scholar] [CrossRef]
- Cohn, L.D.; Macfarlane, S.; Yanez, C.; Imai, W.K. Risk-perception: Differences between adolescents and adults. Health Psychol. 1995, 14, 217–222. [Google Scholar] [CrossRef]
- Reniers, R.L.E.P.; Murphy, L.; Lin, A.; Bartolomé, S.P.; Wood, S.J. Risk Perception and Risk-Taking Behaviour during Adolescence: The Influence of Personality and Gender. PLoS ONE 2016, 11, e0153842. [Google Scholar] [CrossRef]
- Jordan, R.E.; Adab, P.; Cheng, K.K. Covid-19: Risk factors for severe disease and death. BMJ 2020, m1198. [Google Scholar] [CrossRef]
- Lipkus, I.M.; Klein, W.M.P.; Skinner, C.S.; Rimer, B.K. Breast cancer risk perceptions and breast cancer worry: What predicts what? J. Risk Res. 2005, 8, 439–452. [Google Scholar] [CrossRef]
- Johnson, B.B. Explaining Americans’ responses to dread epidemics: An illustration with Ebola in late 2014. J. Risk Res. 2017, 20, 1338–1357. [Google Scholar] [CrossRef]
- Dougherty, M.R.; Franco-Watkins, A.M.; Thomas, R. Psychological plausibility of the theory of probabilistic mental models and the fast and frugal heuristics. Psychol. Rev. 2008, 115, 199–211. [Google Scholar] [CrossRef] [PubMed]
- Fischhoff, B.; Bostrom, A.; Quadrel, M.J. Risk Perception and Communication. Annu. Rev. Public Health 1993, 14, 183–203. [Google Scholar] [CrossRef]
- Sibley, C.G.; Harré, N. The impact of different styles of traffic safety advertisement on young drivers’ explicit and implicit self-enhancement biases. Transp. Res. Part F Traffic Psychol. Behav. 2009, 12, 159–167. [Google Scholar] [CrossRef]
- Weinstein, N.D. The precaution adoption process. Health Psychol. 1988, 7, 355–386. [Google Scholar] [CrossRef]
- Bell, D.M.; Weisfuse, I.B.; Hernandez-Avila, M.; del Rio, C.; Bustamante, X.; Rodier, G. Pandemic Influenza as 21st Century Urban Public Health Crisis. Emerg. Infect. Dis. 2009, 15, 1963–1969. [Google Scholar] [CrossRef]
- Jones, S.C.; Waters, L.; Holland, O.; Bevins, J.; Iverson, D. Developing pandemic communication strategies: Preparation without panic. J. Bus. Res. 2010, 63, 126–132. [Google Scholar] [CrossRef]
- Anderson, L.R.; McGuire, W.J. Prior Reassurance of Group Consensus as a Factor in Producing Resistance to Persuasion. Sociometry 1965, 28, 44. [Google Scholar] [CrossRef]
- McGuire, W.J. Vaccine for brainwash. Psychol. Today 1970, 3, 36. [Google Scholar]

© 2020 by the authors. Licensee MDPI, Basel, Switzerland. This article is an open access article distributed under the terms and conditions of the Creative Commons Attribution (CC BY) license (http://creativecommons.org/licenses/by/4.0/).