Article

Flow Simulations Including Iron Nanoparticle Nucleation, Growth and Evaporation for Floating Catalyst CNT Production

by
Filip K. A. Gökstorp
and
Matthew P. Juniper
*
Department of Engineering, University of Cambridge, Trumpington Stree, Cambridge CB2 1PZ, UK
*
Author to whom correspondence should be addressed.
Catalysts 2020, 10(12), 1383; https://doi.org/10.3390/catal10121383
Submission received: 4 November 2020 / Revised: 23 November 2020 / Accepted: 24 November 2020 / Published: 27 November 2020

Abstract

:
We use a computational fluid dynamics model coupled with a particle dynamics model to simulate how catalyst nanoparticles nucleate, grow and evaporate over the length of a floating catalyst reactor. We focus on the influence of the flowrate in the reactor and the ferrocene mass fraction on the production of the catalyst nanoparticles. In the downstream region of the reactor, where the majority of CNT growth occurs, we find that, as either the flowrate or the ferrocene mass fraction increases, the particle mass fraction profile changes, with the mass fraction peak shifting away from the centreline. This displacement away from the centreline of the mass fraction peak may explain why the CNTs form a hollow, sock-like, aerogel at the downstream end of the reactor.

Graphical Abstract

1. Introduction

In the floating catalyst chemical vapour deposition (FC-CVD) process, pioneered by Li et al. [1], carbon nanotubes (CNTs) are continuously produced in a heated reactor. The working fluid in the reactor contains a carrier gas (typically hydrogen) mixed with a carbon source (typically methane), an iron source (typically ferrocene) and a sulphur source (typically thiophene). Hydrogen is the dominant species accounting for the majority of the total mass of the mixed fluid in the reactor. Ferrocene and thiophene account for 0.5% and 3% of the total fluid mass, respectively. Methane accounts for approximately 20% of the total mass, if present. The fluid is heated in the reactor to a peak temperature that can vary from 1150 to 1300 °C. The iron source decomposes into iron vapour, which forms iron nanoparticles. The iron particles form the catalyst surface on which carbon nanotubes grow, promoted by the sulphur.
We wish to improve this process in order to enhance the CNT material properties and increase the CNT yield. A study by Weller et al. [2] concludes that nanoparticle catalyst selectivity is an important next step to improve the CNT material properties. It is known that varying the flowrate of the reactor has a significant effect on the finished CNT product, affecting both product quality and yield, as shown by Motta et al. [3] and Kaniyoor et al. [4]. A recent study by Bulmer et al. [5] explored the significance of multiple experimental factors (such as flow rate, precursor concentrations and reactor temperature) and found that varying the flowrate had the most significant impact on the quality of the produced CNTs and their specific conductivity. Reguero et al. [6] found that the diameter of the catalyst nanoparticle has an impact of the type of carbon nanotube formed, with larger particles forming predominantly multi-walled nanotubes and smaller particles forming predominantly single-walled nanotubes.
To understand how the inputs to the FC-CVD process affect the formation of the carbon nanotubes, we model the nucleation, growth and evaporation of the iron catalyst nanoparticles. In practice, the catalyst nanoparticles also contain carbon, and contain sulphur on the surface. However, for our model, we only model the iron content of the catalyst nanoparticles. In previous studies, Kuwana et al. [7] and Conroy et al. [8] used a simple model of ferrocene decomposing directly into 1-atom iron particles to calculate the catalyst particle diameter in their reactor. Kuwana et al. [7] looked at how the reactor wall temperature affected the catalyst particle diameter. Their work was for a similar FC-CVD process but using much lower peak temperatures, from 600 to 800 °C. Conroy et al. [8] modelled the decomposition of ferrocene in their FC-CVD reactor for different flowrates. They calculated the number of nucleated catalyst particles formed and the catalyst particle volume fraction (summed volume of all catalyst particles per unit of reactor volume). We extend the simplistic nucleation mechanism used by those studies by including the intermediate iron vapour, where ferrocene first decomposes into iron vapour, and then this iron vapour nucleates into an iron catalyst particle. Using this more realistic nucleation mechanism also allows us to model the condensation and evaporation of the catalyst particles and to better capture the catalyst particle diameter evolution as the catalyst particles are convected through the hot zone.

2. Results and Discussion

We use our model (detailed in Section 3) to investigate the effect of flowrate, temperature and ferrocene mass fraction of the working fluid on the production of catalyst nanoparticles. We perform three sets of simulations. In each set, only one input parameter is varied. In the first set, we vary the flowrate of the working fluid from 0.5 to 2.0 l min 1 with a peak temperature of 1250 °C and 0.5 mass% ferrocene mass fraction (see Methods and [9]). For the second set, we keep the flowrate at 1.0 l min 1 and vary the peak temperature from 1150 to 1300 °C, also with a ferrocene mass fraction of 0.5 mass%. For the third set, we keep the flowrate fixed at 1.0 l min 1 and the peak temperature fixed at 1250 °C, while we vary the ferrocene mass fraction from 0.5 to 2.0 mass%.
For each simulation, we generate the base flow velocity ( u , in m   s 1 ), temperature (T, in K ) and density ( ρ , in k g   m 3 ), as well as the iron vapour mass fraction (g, in k g of iron vapour per k g of working fluid), iron particle mass fraction (Y, in k g of iron particle mass per k g of working fluid) and iron particle number density (M, in number of iron particles per k g of working fluid). We also calculate the particle diameter ( d p , in nm ) from Y and M.

2.1. Model Comparison

We compare our numerical results with the experimental results from Hoecker et al. [9]. In their study, Hoecker et al. measured the particle mass concentration as a function of distance from the reactor inlet, with the reactor peak temperature at the same values we simulate (1150 °C to 1300 °C) and a flowrate of 0.5 l min 1 , using an alumina reactor tube (700 mm long, inner diameter 40 mm and outer diameter 50 mm). Figure 1 shows our numerical results (solid lines) compared with the experimental results (red dots) for different peak temperatures. For 1250 °C peak temperature, our model results match the experimental results well. The 1300 °C case also matches the experimental results well, with a slight overprediction of the peak mass fraction. The lower temperature cases, 1150 and 1200 °C, are only qualitatively correct. There may be more factors significantly contributing to the production of catalyst nanoparticles and CNTs that are not yet captured in the model, such as the reactor tube composition, which is known to have a significant effect on the CNT production process [10]. Additionally, while it is known that the presence of sulphur is critical to the FC-CVD process, it is not yet clear whether this affects the particle nucleation and growth or the CNT formation.

2.2. Overall Results

In all our simulations, the ferrocene decomposes and releases iron vapour about 200 mm downstream from the reactor inlet. Figure 2 shows how this distance varies with flowrate and peak temperature. Figure 3a plots the resulting rapid increase of the saturation ratio to very high orders of magnitude as iron vapour is released by the ferrocene decomposition. The extremely high saturation ratio ( S = g / g s of the order of 10 15 , where g is the mass of iron vapour and g s is the saturation mass of iron vapour in the carrier gas) drives rapid nucleation and particle growth. Figure 3b shows the difference between the mass fraction of iron vapour and the saturation amount. The difference peaks at 200 mm, after which there is enough particle surface area for condensation to dominate further iron release from the decomposition of ferrocene.
The peak in the particle mass fraction appears at a distance of 250 mm from the reactor inlet, increasing slightly for higher flowrates. The particle nucleation and growth appears first close to the wall, where the convection velocity is lower, and therefore the residence time is higher. The increased residence time gives particles a longer time to grow before they enter the hot zone, situated from 300 to 400 mm downstream from the inlet. In the hot zone, the high temperature increases the saturation pressure of the carrier gas, and the particles start to evaporate. Some of the evaporated iron vapour condenses on the reactor walls, decreasing the overall mass of iron in the reactor. Lower flowrates lead to a longer residence time in the hot zone and therefore to more iron vapour condensing on the reactor wall. The condensed iron on the reactor wall may build up over time, but there will not be a significant amount of CNTs grown from the depositions on the wall of the reactor. Figure 4 plots the particle mass fraction and particle number within the reactor. At 0.5 l min 1 , particle mass is rapidly lost to the wall once the flow enters the hot zone at 300 mm, as particles begin to evaporate and the the iron vapour deposits on the reactor wall. Beyond 400 mm, the temperature drops, the particles stop evaporating and the particle mass fraction stabilises. The particles continue to grow slightly as the flow cools and iron vapour condenses onto the particles. At these conditions, roughly 400 mm to 500 mm downstream of the inlet, the carbon nanotubes grow, align, bundle and form an aerogel. The residence time in this region varies from 4 s to 1 s for flowrate from 0.5 to 2.0 l min 1 , which is enough time for CNTs to grow on the catalyst particles.
Figure 5a,b shows the radial profile of particle mass fraction and how it varies as a function of the input parameters. The dashed green line shows the common reference case of 1 l min 1 , 1250 °C and 0.5 mass% ferrocene. At low flowrates ( 0.5 l min 1 ) or low ferrocene mass fractions ( 0.25 mass%) most of the particle mass is found very close the the centreline. Additionally, at low flowrates the iron particles have a longer residence time in the hot zone and more iron vapour is able to evaporate and diffuse to the wall.Therefore, only the particles that are furthest from the wall survive the hot zone, and the particle mass is concentrated on the centreline. At low ferrocene mass fraction there is less particle mass, so a shorter residence time in the hot zone is required for the same evaporation effect, therefore the mass is also concentrated at the centreline for low ferrrocene mass fractions, even at normal flowrates (1 l min 1 ). At higher flowrates and higher ferrocene mass fractions, the peak particle mass is found at a distance away from the centreline. The distance of the peak from the centreline increases with increasing flowrates and increasing ferrocene mass fraction. As the particles closer to the wall evaporate first in the hot zone, reducing the residence time leads to reduced mass loss from the particles close to the wall, and therefore the particle mass fraction peak shifts towards the wall. The same effect is seen as ferrocene mass fraction increases. As particles have larger mass, it takes a longer time for them to evaporate and therefore more particles close to the wall survive the hot zone, moving the mass fraction peak towards the wall.
Figure 5c,d shows the axial profile of the radially-averaged particle mass fraction and how it varies as a function of the input parameters. Increased ferrocene mass fractions uniformly increases the particle mass fraction profile, while increasing flowrate reduces the mass particle fraction before the hot zone and increases it after the hot zone. This suggests that at higher flowrates the particle nucleation and growth is stretched out over a longer region, therefore leading to a lower peak.
The effect of the process parameters on the particle diameter is similar to that on the particle mass fraction. Figure 6a,b plots the radial profiles of particle diameter, at 500 mm from the reactor inlet. At low flowrates ( 0.5 l min 1 ) or low ferrocene mass fractions ( 0.25 mass%), the peak of the particle diameter is located at the centreline. As flowrate and ferrocene mass fraction increase, however, the peak of the particle diameter moves away from the centreline. Increasing the flowrate significantly increases the particle diameter. This is because higher flowrates reduce the time the iron vapour spends in conditions favourable to nucleation, so fewer particles are formed. Instead, the iron vapour condenses on the existing particles, increasing the particle diameter. Increasing the flowrate also reduces the time spent in the hot evaporation zone, therefore reducing the mass evaporated from the particles and subsequently lost to the wall, and leaving larger particles. Increasing the ferrocene mass fraction also increases catalyst particle diameter, because there is more iron mass in the system to form particles, and therefore the particles coagulate more quickly, to larger sizes, during their residence in the reactor.
Figure 6c,d shows the axial profile of the radially-averaged particle diameter. The particle diameter peaks at 250 mm just at the start of the hot zone, decreases during the hot zone until 400 mm at which point it starts growing again. After 400 mm, the particle growth is mainly due to coagulation, as particle mass fraction is constant. Increasing the flowrate has only a small effect on the particle diameter as flowrate is increased from 0.5 to 1.0 l min 1 . At higher flowrates (1.5 and 2.0 l min 1 ), the particle diameter is much larger despite the reduced time for particles to coagulate. This happens because fewer particles nucleate and therefore the released iron vapour condenses onto fewer particles, making the average particle larger. Larger average catalyst particle diameter may be more likely to grow multi-walled CNTs, but the link between catalyst particle diameter and CNT diameter for sulphur coated particles is not yet clear. Increasing the ferrocene mass fraction instead reduces the particle diameter peak before the hot zone, again because fewer particles are nucleated and instead the existing particles grow due to condensation. The particle diameter after the hot zone increases with increasing ferrocene mass fraction, as more mass remains in the reactor after the hot zone and therefore particles can grow larger. More ferrocene also produces more particles through nucleation, therefore there is more rapid size growth due to coagulation after the hot zone.
Figure 7a,b plots the total particle surface area (sum of the surface area of all the particles in the reactor, per kg of carrier gas) as a function of radius, at 500 mm from the reactor inlet. At low flowrates or low ferrocene mass fractions ( 0.5 l min 1 and 0.25 mass%, respectively), the total surface area is concentrated around the centreline. At higher flowrates or higher ferrocene mass fractions, the radial profile forms a plateau instead of a distinct peak away from the centreline. Figure 7c,d plots the radially-averaged total particle surface area over the reactor length. Increasing ferrocene mass fractions increases the total surface area in the reactor, both at the peak before the hot zone, and in the CNT growth region after the hot zone. Increasing the flowrate reduces the total surface area before the hot zone and increases it slightly after the hot zone. At very high flowrates (2 l min 1 ), the total surface area after the hot zone is lower than for the other cases. This is because fewer particles are formed, and therefore the total surface area is lower, despite the particle mass fraction being higher.

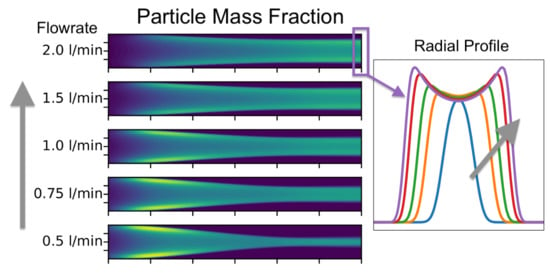
2.3. The Tendency of the Aerogel to Form a Sock

As reported by many different sources [1,3,8,9], the CNTs aggregate into a hollow and flexible tube (a sock) towards the end of the reactor. Hou et al. [11] found that increased iron mass is correlated with increased CNT production rate. Except for at low flowrates or low ferrocene mass fractions, the iron particle peaks are found a distance away from the centreline. This phenomenon is similar to that reported in [12,13,14]. In their experiments, Segré and Silberberg used significantly larger particles of a diameter from 0.32 to 1.71 mm, while in the reactor we expect particle sizes to remain below 100 nm. They found that the particle number profile form peaks close to the wall, while we find the effect most pronounced in the particle mass fraction and not noticeable in the particle number profile. The reported position of the peak is at 0.6 of the radius from the centreline, which matches well with the position of the peak that we find in our simulations. The fluid velocity is lower closer to the wall, which increases the residence time. Higher residence times means particles grow larger due to more condensation and coagulation occurring. However, particles also diffuse and if the particles collide with the wall they stick and the mass is lost from the flow. Close to the wall the diffusion dominates and the particle mass fraction is very low. Slightly further away from the wall, the residence time is still high, particles grow larger and more mass condenses onto the particles. At the centreline there is still significant particle mass, but because the residence time is lower the particle mass fraction is also lower. Therefore, the particle mass fraction peaks are found a distance away from the centreline, and this distance varies with the reactor flowrate.
Hoecker et al. [15] found that there is a critical particle mass concentration required for the production of spinnable CNTs of 110 m g m 3 to 160 m g m 3 . Figure 8 shows the dimensional mass concentration estimated using the model. Figure 8a shows the radially-averaged mass concentration evolution over the length of the reactor, while Figure 8b shows the radial profile of mass concentration at 500 mm downstream from the reactor inlet. For all flowrates, the radial averaged values are below the minimum mass concentration, however, for the higher flowrates (1.5 and 2.0 l min 1 ), the mass concentration peak is very close to the minimum mass concentration of 110 m g m 3 . As the iron particle mass peaks are found a distance away from the centreline, CNTs are more likely to be produced in these regions. At the centreline, the mass concentration is around 80 m g m 3 , significantly below the minimum particle mass concentration, therefore no CNTs are produced there.
As most CNTs are produced in an annulus, the resulting aerogel is hollow as observed in experiments. Figure 9 plots the radial location of the peaks of the particle mass fraction and particle diameter as a function of flowrate, along experimental results from Conroy et al. [8]. The shift of the peak of the particle mass fraction towards the wall as flowrate increases agrees qualitatively with the experimental observations. As our model does not include the dynamics of the aerogel itself, or the effect of its winding speed, we do not expect the results to match quantitatively.

3. Methods

Our model of the FC-CVD process has three components: the fluid motion, the precursor decomposition and the particle production. The fluid motion is independent of the precursor decomposition and the particle formation. The precursor decomposition depends on the fluid motion, but is independent of the particle formation, while the particle formation depends on both the fluid motion and the precursor decomposition.
Figure 10 shows a diagram of our model geometry. We base the geometry, properties and boundary conditions on the reactor used by Hoecker et al. [9]. The reactor has an inner diameter of 40 m m and a length of 700 m m . A clam-shell furnace is used to heat the reactor to a peak temperature of 1100 °C to 1300 °C, which occurs at the midpoint of the reactor. The working fluid enters with uniform velocity using a flow diffuser and quickly reaches a parabolic velocity profile. For simplicity, we model the inlet flow as parabolic. Figure 11 shows the fluid temperature and the wall temperature profile in the reactor. The wall temperature profile is based on wall measurements of the physical reactor by Hoecker et al. [9]. Typical process conditions are a peak temperature of 1250 °C, a fluid flow rate of 0.5 l min 1 , a ferrocene mass fraction of 0.5 mass% and a thiophene mass fraction of 3.0 mass% [9,15].

3.1. The Fluid Kinetics and Dynamics

Equations for mass, momentum and energy are modelled using a Low Mach Number expansion of the Navier–Stokes equations. This choice of fluid model allows us to capture the variations of density of the gas in the reactor as the temperature changes over the length of the reactor, without having to also capture acoustic waves. This formulation also allows for the gas composition to affect the fluid density.
The working fluid is predominantly hydrogen, H 2 , mixed with methane, C H 4 , with small additions of ferrocene, Fe ( C 5 H 5 ) 2 , and thiophene, C 4 H 4 S [9]. Given that the additions are small, we model the fluid as pure hydrogen gas, obeying:
ρ t + · ( ρ u ) = 0    Mass conservation
ρ u t + ρ ( u · ) u = p + · τ + ρ g Momentum conservation
c p ρ θ t + c p ρ ( u · ) θ = · ( ρ k θ ) Energy conservation
ρ θ = p th / R Equation of state
p th = 0 Uniform thermodynamic pressure
where ρ is the fluid density, u is the fluid velocity, p is the fluid kinematic pressure, τ is the fluid shear stress tensor, g is the acceleration due to gravity, θ is the fluid temperature (in an absolute scale), c p is the fluid specific heat capacity, k is the fluid heat conductivity, p th is the fluid thermodynamic pressure ( p th p ) and R is the fluid’s gas constant. We solve these equations with boundary conditions,
u = u 0 , θ = θ 0 at the inlet ,
u = 0 , θ = θ w at the reactor wall ,
to obtain the density, ρ , velocity, u , and temperature, θ , fields in the reactor. We choose the boundary conditions ( u 0 , θ 0 and θ w ) to match the experimental conditions.
The experimental results are for a horizontal reactor, but the process also works with a vertical reactor [4]. We choose to model a horizontal reactor and impose axisymmetry on our solution. This assumption reduces the computational cost, but means we have to ignore the effect of gravity. It is possible to include the effects of gravity for a horizontal reactor using our methods, but a 3D solution is required, which increases the computational cost. Hou et al. [16] showed that the inclusion of gravity terms affect the inlet and outlet of their reactor, causing convection vortices. Our model is unable to capture this phenomenon, however we expect the upstream vortex to not extend into the hot zone. Therefore, the inclusion of gravity would not significantly affect the decomposition of the precursor and the subsequent nucleation of the catalyst nanoparticles. Similarly, we do not expect the outlet vortex to extend as far back as the hot zone, and therefore we do not expect the inclusion of gravity in our model to significantly affect the particle mass fraction or average size at our location of interest, 500 mm downstream of the inlet. Therefore, the axisymmetric assumption is justifiable for this paper.

3.2. The Ferrocene Decomposition

With the calculated fluid velocity, we model the advection of ferrocene through the temperature field. As ferrocene heats up, it decomposes and releases iron vapour, which form the catalyst nanoparticles. We assume that the ferrocene concentration in the reactor is sufficiently low that the temperature change due to decomposition can be neglected, and therefore we assume that the decomposition does not affect the fluid motion. Following Kuwana and Saito [17], we assume that ferrocene decomposes with a single step process that can be adequately captured as an Arrhenius rate,
ρ ϕ t + ρ ( u · ) ϕ = · ( ρ D ϕ ) ρ ω ˙ ,
ω ˙ ϕ A exp ( E a / R g θ ) ,
where u , θ and ρ are defined as above, ϕ is the ferrocene mass fraction, D is the ferrocene diffusivity, R g is the universal gas constant, A is the rate constant and E a is the activation energy. Kuwana and Saito [17] used a ferrocene decomposition activation energy ( E a ) of 209 kJ and a decomposition rate ( A ) of 1 × 10¹⁴ s 1 , adopted from Lewis and Smith [18]. These values do not account for the hydrogen-rich environment in which the precursor decomposes and overestimate the decomposition rate in the reactor. To model the decomposition-inhibiting effect of hydrogen, we base an alternative decomposition rate on experimental data of the decomposition of thiophene in the reactor [9]. A best fit to the thiophene decomposition data gives an activation energy of 88 kJ and a decomposition rate of 3 × 10³ s 1 . Table 1 presents the decomposition rates and activation energies for the different chemicals.
It has been shown [19] that the presence of sulphur is critical to the FC-CVD process. To simplify the modelling, we assume the iron source decomposes at the same rate as the sulphur source. This simplification can also be justified by assuming that the presence of sulphur is required for the iron nanoparticles to begin nucleating. Figure 12a demonstrates the effect that using the ferrocene or the thiophene decomposition rate has on the particle mass fraction in the reactor. With the thiophene-based decomposition rate, our model nucleation rate agrees well with the experimental measurements from Hoecker et al. [9]. Figure 12b shows the fraction of undecomposed ferrocene and thiophene as a function of distance from the reactor inlet. The thiophene starts decomposing about 50 mm further downstream than the ferrocene and has reached full decomposition over 100 mm further downstream than the ferrocene. This means particles form much later, as seen in the experimental results.

3.3. The Particle Formation

Finally, we model the creation and growth of the iron catalyst nanoparticles. We extend the monodisperse models used by Kuwana and Saito [17] and Conroy et al. [8], and also model the mass of (particle) material as a vapour, as well as the number of particles and total mass of condensed material. The three components are the mass of material as a vapour g, the mass of material in condensed (particle) phase Y and the number density of particles N, obeying:
ρ g t + ρ ( u · ) g = · ( ρ D g g ) + ρ f g + ρ ω ˙
ρ Y t + ρ ( u · ) Y = · ( ρ D p Y ) + ρ f Y
ρ N t + ρ ( u · ) N = · ( ρ D p N ) + ρ f N
where u , ρ , θ are defined above, ω ˙ is the iron vapour source from the decomposition of ferrocene, as defined above and f g , f Y , f N are the particle model source terms, defined as:
f g k * J E ,
f Y k * J + E ,
f N J C ,
where J is the rate of new particle formation, using the self-consistent kinetic model by Girshick and Chiu [20]; k * is the initial mass of a newly formed particle; E is the net mass transfer rate from vapour to condensed state due to evaporation and condensation; and C is the coagulation rate of particles. All these terms further depend on temperature, particle size, particle number and vapour saturation. The fully expanded terms are given in Appendix A. We assume all particle–particle collisions result in coagulation, and that no particles are destroyed due to evaporation.

3.4. Normalising the Particle Equations

We normalise the governing equations by the number of ferrocene atoms per kg of carrier gas. For our comparison case [9], the ferrocene mass fraction is 0.5 mass%, which gives a normalisation constant of 1.62 × 10²² atoms per kg. We call this value ϕ 0 . Using this normalisation process, g = 1 means all the mass is vapourous and Y = 1 means all the mass is condensed. If g + Y is less than 1, then missing mass has been lost to the walls. The scaled N variable gives the number of particles as a fraction of the number of ferrocene atoms at the inlet, or mol of particles per mol of input ferrocene atoms.

3.5. Iron Vapour and Particle Diffusivity

For the iron vapour, we assume the diffusivity, D g , is of the same order as the diffusivity of ferrocene, which is about 1 × 10⁻⁵ m 2 s 1 . For the particles, we assume the diffusivity, D p , can be modelled as a function of temperature and particle drag f [21], obeying:
D p = k B T f .
The particle drag factor, f, depends on particle diameter. The catalyst nanoparticles in the reactor are all smaller than 100 n m in diameter. This much smaller than the free mean path of the hydrogen carrier gas, which is of the order of 1000 n m . In this kinetic regime, the particle drag factor, f, is modelled by:
f = 2 3 d p 2 ρ 2 π R T M 1 2 1 + π α 8 ,
α = 0.9 .
In the hot zone of the reactor, particles evaporate, reducing the particle diameter, d p . As d p approaches zero, D p will grow to infinity and we will experience numerical problems. To avoid these numerical problems we instead impose an a-priori diffusivity that varies between a high-diffusivity value (upstream of the hot zone, where the particles are nucleating) and a low-diffusivity value (downstream of the hot zone, where the particles have grown large) over the reactor length. We model the change from a high-diffusivity regime in the initial nucleation zone to a low-diffusivity regime downstream of the nucleation region with an analytical function. This approach keeps the numerical solution stable in regions of rapid particle diameter change:
D p = ψ D high + ( 1 ψ ) D low ,
ψ = 1 1 + exp z z 0 0.01 L ,
where z is the distance from the reactor inlet, z 0 is the position at which diffusivity changes and L is the length of the reactor. The value for z 0 is increased with flowrate to better match the theoretical diffusivity calculated from the particle diameter. We choose values for D high , D low and z 0 that approximate the theoretical values of D p , without making our simulations numerically unstable. The value of D h i g h is 4 × 10⁻⁵ m 2 s 1 and D l o w is 4 × 10⁻⁷ m 2 s 1 . The value of D p also varies with the temperature in the reactor. The effect of the temperature on the diffusivity of the particles is very small compared to the effect of the particle diameter. Figure 13 plots the difference between this analytical approximation of D p and the theoretical value calculated from the particle diameter. From the reactor inlet to about 175 mm, the analytical function matches the theoretical diffusivity well. After this point, the analytical function underpredicts the diffusivity before the hot zone and overpredicts the diffusivity after the hot zone. However, after 250 mm downstream from the inlet, both the analytical and the theoretical diffusivity falls below 1 × 10⁻⁶ m 2 s 1 , at which point the effect of diffusivity is negligible compared to the effect on convection on the particles.

3.6. Solving the Equations

We solve our partial-differential equations using FEniCS, a finite-elements partial differential equation solver package [22]. The computational grid is generated using Gmsh [23].

4. Conclusions

In this study, we develop a model capable of simulating the nucleation, growth and evaporation of catalyst nanoparticles in a reactor for the production of carbon nanotubes. We looked at three different measurements of the particles: (a) particle mass fraction; (b) average particle diameter; and (c) total particle surface area. We found that varying the flowrate or the ferrocene mass fraction entering the reactor has the most significant effect on the measurements in two different regions: the region before the hot zone (150 mm to 300 mm) and the region after the hot zone (400 mm to 700 mm). As the flowrate through the reactor increases, the particle mass fraction found in the region after the hot zone increases, while the particle mass fraction in the region before the hot zone decreases. With increasing ferrocene mass fractions, the particle mass fraction increases over both zones. For the particle diameter, increasing flowrate from 0.5 to 1.0 l min 1 increases the diameter only in the region after the hot zone, while increasing the flowrate further from 1.0 to 2.0 l min 1 increases the particle diameter in both regions. The total particle surface area sees a decrease in the region before the hot zone as flowrate increases, while the value in the region after the hot zone is does not change strongly with flowrates above 0.5 l min 1 . As ferrocene mass fraction increases, the total surface area increases in both zones.
At low flowrate or low ferrocene mass fraction, the particle mass fraction is concentrated at the centreline of the reactor. The profile of particle diameter is also highest at the centreline for those conditions. As flowrate in the reactor increases, the peaks of the particle mass fraction and the particle diameter move away from the centreline. The same effect occurs for increasing ferrocene mass fraction. This displacement away from the centreline of the mass fraction peak explains why the CNTs form a hollow sock-like aerogel at the downstream end of the reactor.
With further experimental data, our model can be made more predictive. The model can also be extended to model the growth of the CNTs. A further study could also investigate the effects of gravity. Further numerical studies on different reactor geometries will also help to explore what process parameters are critical for the production of the nanoparticles that produce CNTs and determine if different geometries and inlet conditions can reduce the loss of material to the reactor walls. The effects of sulphur on the nucleation process could also be explored by including an additional modelling term. This would help us understand what role the sulphur could have on the nucleation of the nanoparticles and why sulphur is so critical in the FC-CVD process.

Author Contributions

Conceptualisation, F.K.A.G. and M.P.J.; methodology, F.K.A.G.; software, F.K.A.G.; validation, F.K.A.G.; writing—original draft preparation, F.K.A.G.; writing—review and editing, M.P.J.; visualisation, F.K.A.G.; and supervision, M.P.J. All authors have read and agreed to the published version of the manuscript.

Funding

This research was funded by EPSRC UK award EP/M015211/1.

Acknowledgments

Open Access Funding by University of Cambridge.

Conflicts of Interest

The authors declare no conflict of interest. The funders had no role in the design of the study; in the collection, analyses, or interpretation of data; in the writing of the manuscript, or in the decision to publish the results.

Abbreviations

The following abbreviations are used in this manuscript:
CNTCarbon Nanotube
FC-CVDFloating Catalyst Chemical Vapour Deposition

Appendix A

The particle model uses the self-consistent nucleation equation developed by Girshick and Chiu [20] and particle collision equations from Friedlander [21]. The source terms for the particle model obey,
f g k * J E ,
f Y k * J + E ,
f N J C ,
where J is the rate of new particle formation, k * is the initial mass of a newly formed particle, E is the net mass transfer rate from vapour to condensed state due to evaporation and condensation and C is the coagulation rate of particles.
For the rate of new particle formation J per unit mass of carrier gas,
J ρ n s 2 S 2 σ m 1 π ρ p 2 1 2 exp Θ 4 Θ 3 27 Θ ln 2 S ,
Θ = σ s 1 k B T ,
where ρ is the density of the working fluid; n s is the saturation number of iron atoms per unit volume; σ is the surface tension of a nucleated iron particle; v 1 , m 1 and s 1 are the volume, mass and surface area, respectively, of a one-atom iron particle; ρ p is the density of the particle material; k B is the Kelvin–Boltzmann constant; and T is the temperature of the working fluid in Kelvin. Θ is the nondimensionalised surface tension of a particle.
The initial mass of a newly formed particle k * obeys,
k * m 1 g * ,
g * = 2 Θ 3 ln S 3 ,
where g * is the number of atoms in a newly formed particles, and the other terms are defined above.
The net mass transfer rate, E, depends on the collision rate between a particle and a iron vapour atom, obeying,
E β 1 , p ( S K ) n s M ,
K = exp 4 σ m 1 k B T d p ,
β 1 , p = 3 4 π 1 6 6 k B T ρ p 1 2 v 1 1 + v p 1 1 2 v 1 1 3 + v p 1 3 2 ,
v p = Y ρ p M ,
d p = 6 v p π 1 3 ,
where β 1 , p is the collision rate, per unit of volume, between a iron particle of volume v p and an iron vapour atom; K is the Kelvin effect constant, increasing the saturation amount of vapour around a curved surface; and d p is the particle diameter; and the other terms are defined above.
The coagulation rate depends on a collision between two particles. We assume the particles are monodisperse, therefore all particles at a particular point and time have the same volume v p , and the coagulation rate obeys,
C 1 2 ρ β p , p M 2 ,
β p , p = 32 3 4 π 1 6 6 k B T ρ p 1 2 v p 1 6 ,
where all the terms are defined above.

References

  1. Li, Y.L.; Kinloch, I.A.; Windle, A.H. Direct Spinning of Carbon Nanotube Fibers from Chemical Vapor Deposition Synthesis. Science 2004, 304, 276–278. [Google Scholar] [CrossRef] [PubMed]
  2. Weller, L.; Smail, F.R.; Elliott, J.A.; Windle, A.H.; Boies, A.M.; Hochgreb, S. Mapping the parameter space for direct-spun carbon nanotube aerogels. Carbon 2019, 146, 789–812. [Google Scholar] [CrossRef]
  3. Motta, M.; Kinloch, I.; Moisala, A.; Premnath, V.; Pick, M.; Windle, A. The parameter space for the direct spinning of fibres and films of carbon nanotubes. Phys.-Low-Dimens. Syst. Nanostruct. 2007, 37, 40–43. [Google Scholar] [CrossRef]
  4. Kaniyoor, A.; Bulmer, J.; Gspann, T.; Mizen, J.; Ryley, J.; Kiley, P.; Terrones, J.; Miranda-Reyes, C.; Divitini, G.; Sparkes, M.; et al. High throughput production of single-wall carbon nanotube fibres independent of sulfur-source. Nanoscale 2019, 11, 18483–18495. [Google Scholar] [CrossRef]
  5. Bulmer, J.S.; Kaniyoor, A.; Gspann, T.; Mizen, J.; Ryley, J.; Kiley, P.; Ratering, G.; Sparreboom, W.; Bauhuis, G.; Stehr, T.; et al. Forecasting continuous carbon nanotube production in the floating catalyst environment. Chem. Eng. J. 2020, 390, 124497. [Google Scholar] [CrossRef]
  6. Reguero, V.; Alemán, B.; Mas, B.; Vilatela, J.J. Controlling Carbon Nanotube Type in Macroscopic Fibers Synthesized by the Direct Spinning Process. Chem. Mater. 2014, 26, 3550–3557. [Google Scholar] [CrossRef]
  7. Kuwana, K.; Endo, H.; Saito, K.; Qian, D.; Andrews, R.; Grulke, E.A. Catalyst deactivation in CVD synthesis of carbon nanotubes. Carbon 2005, 43, 253–260. [Google Scholar] [CrossRef]
  8. Conroy, D.; Moisala, A.; Cardoso, S.; Windle, A.; Davidson, J. Carbon nanotube reactor: Ferrocene decomposition, iron particle growth, nanotube aggregation and scale-up. Chem. Eng. Sci. 2010, 65, 2965–2977. [Google Scholar] [CrossRef]
  9. Hoecker, C.; Smail, F.; Bajada, M.; Pick, M.; Boies, A. Catalyst nanoparticle growth dynamics and their influence on product morphology in a CVD process for continuous carbon nanotube synthesis. Carbon 2016, 96, 116–124. [Google Scholar] [CrossRef] [Green Version]
  10. Rodiles, X.; Reguero, V.; Vila, M.; Alemán, B.; Arévalo, L.; Fresno, F.; O’Shea, V.A.d.l.P.; Vilatela, J.J. Carbon nanotube synthesis and spinning as macroscopic fibers assisted by the ceramic reactor tube. Sci. Rep. 2019, 9, 9239. [Google Scholar] [CrossRef] [Green Version]
  11. Hou, G.; Ng, V.; Song, Y.; Zhang, L.; Xu, C.; Shanov, V.; Mast, D.; Schulz, M.; Liu, Y. Numerical and Experimental Investigation of Carbon Nanotube Sock Formation. MRS Adv. 2017, 2, 21–26. [Google Scholar] [CrossRef]
  12. Segré, G.; Silberberg, A. Radial Particle Displacements in Poiseuille Flow of Suspensions. Nature 1961, 189, 209–210. [Google Scholar] [CrossRef]
  13. Segré, G.; Silberberg, A. Behaviour of macroscopic rigid spheres in Poiseuille flow Part 1. Determination of local concentration by statistical analysis of particle passages through crossed light beams. J. Fluid Mech. 1962, 14, 115–135. [Google Scholar] [CrossRef]
  14. Segré, G.; Silberberg, A. Behaviour of macroscopic rigid spheres in Poiseuille flow Part 2. Experimental results and interpretation. J. Fluid Mech. 1962, 14, 136–157. [Google Scholar] [CrossRef]
  15. Hoecker, C.; Smail, F.; Pick, M.; Weller, L.; Boies, A.M. The Dependence of CNT Aerogel Synthesis on Sulfur-driven Catalyst Nucleation Processes and a Critical Catalyst Particle Mass Concentration. Sci. Rep. 2017, 7, 14519. [Google Scholar] [CrossRef] [Green Version]
  16. Hou, G.; Su, R.; Wang, A.; Ng, V.; Li, W.; Song, Y.; Zhang, L.; Sundaram, M.; Shanov, V.; Mast, D.; et al. The effect of a convection vortex on sock formation in the floating catalyst method for carbon nanotube synthesis. Carbon 2016, 102, 513–519. [Google Scholar] [CrossRef]
  17. Kuwana, K.; Saito, K. Modeling CVD synthesis of carbon nanotubes: Nanoparticle formation from ferrocene. Carbon 2005, 43, 2088–2095. [Google Scholar] [CrossRef]
  18. Lewis, K.E.; Smith, G.P. Bond dissociation energies in ferrocene. J. Am. Chem. Soc. 1984, 106, 4650–4651. [Google Scholar] [CrossRef]
  19. Gspann, T.S.; Smail, F.R.; Windle, A.H. Spinning of carbon nanotube fibres using the floating catalyst high temperature route: Purity issues and the critical role of sulphur. Faraday Discuss. 2014, 173, 47–65. [Google Scholar] [CrossRef]
  20. Girshick, S.L.; Chiu, C. Kinetic nucleation theory: A new expression for the rate of homogeneous nucleation from an ideal supersaturated vapor. J. Chem. Phys. 1990, 93, 1273–1277. [Google Scholar] [CrossRef]
  21. Friedlander, S.K. Smoke, Dust, and Haze: Fundamentals of Aerosol Dynamics, 2nd ed.; Oxford University Press: New York, NY, USA, 2000. [Google Scholar]
  22. Alnæs, M.S.; Blechta, J.; Hake, J.; Johansson, A.; Kehlet, B.; Logg, A.; Richardson, C.; Ring, J.; Rognes, M.E.; Wells, G.N. The FEniCS Project Version 1.5. Arch. Numer. Softw. 2015, 3. [Google Scholar] [CrossRef]
  23. Geuzaine, C.; Remacle, J.F. Gmsh: A 3-D finite element mesh generator with built-in pre-and post-processing facilities. Int. J. Numer. Methods Eng. 2009, 79, 1309–1331. [Google Scholar] [CrossRef]
Figure 1. Model data (blue line) compared to experimental measurements by [9] (red circles). The model and experiments use a flowrate of 0.5 l min 1 and ferrocene mass fraction of 0.5 mass%: (a) a peak temperature of 1150 °C; (b) a peak temperature of 1200 °C; (c) a peak temperature of 1250 °C; and (d) a peak temperature of 1300 °C.
Catalysts 10 01383 g001
Figure 2. Plot of the simulation of the decomposition of ferrocene as a function of distance from the inlet, normalised by the ferrocene mass fraction at the inlet. Each line corresponds to different flowrates.
Catalysts 10 01383 g002
Figure 3. Plots of the (a) iron vapour saturation ratio S = g / g s * and (b) iron vapour oversaturation Δ g = g g s * , as a function of distance from the reactor inlet, for different flowrates.
Catalysts 10 01383 g003
Figure 4. Plots of (a) normalised particle mass fraction and (b) normalised particle number density, for different inlet flowrates, at a peak temperature of 1250 °C and a ferrocene mass fraction of 0.5 mass%. Nucleation starts at about 200 mm from the inlet, and the main evaporation zone is between 300 and 400 mm.
Catalysts 10 01383 g004
Figure 5. Plots of the normalised particle mass fraction: (a,b) the radial profile of the particle mass fraction, 500 mm downstream from the inlet; (c,d) the axial profile of the particle mass fraction, averaged over the reactor radius; (a,c) the variations with flow rate (at 1250 °C peak temperature and 0.5 mass% ferrocene mass fraction); and (b,d) the variations with input iron mass (at 1 l min 1 and 1250 °C peak temperature).
Catalysts 10 01383 g005
Figure 6. Average particle diameter in the reactor: (a,b) the radial particle diameter profile, 500 mm downstream from the inlet; (c,d) the axial profile, averaged over the reactor radius; (a,c) the variations with flowrate (at 1250 °C peak temperature and 0.5 mass% ferrocene); and (b,d) the variations with input iron mass (at 1 l min 1 and 1250 °C peak temperature).
Catalysts 10 01383 g006
Figure 7. Total particle surface area in the reactor, assuming a monodisperse size distribution: (a,b) the radial profile, 500 mm downstream from the inlet; (c,d) the axial profile, averaged over the radius; (a,c) the variations with flowrate (at 1250 °C peak temperature and 0.5 mass% ferrocene mass fraction); and (b,d) the variations with input iron mass (at 1 l min 1 and 1250 °C peak temperature).
Catalysts 10 01383 g007
Figure 8. Plots of the dimensional catalyst particle mass concentration: (a) over the length of the reactor; and (b) as a radial slice 500 mm downstream of the reactor. Each line corresponds to a different flowrate.
Catalysts 10 01383 g008
Figure 9. Radial location of the peak values of particle mass fraction and particle diameter as a function of flowrate, at a peak temperature of 1250 °C and ferrocene mass fraction of 0.5 mass%. The experimentally measured aerogel diameter from Conroy et al. [8] are included. The aerogel measurements are for a reactor with a larger diameter and a process that uses a different ferrocene mass fraction.
Catalysts 10 01383 g009
Figure 10. Diagram of the reactor, not to scale. Working fluid enters on the left and is heated up as it flows downstream. The temperature peaks at the middle of the reactor at 350 mm.
Catalysts 10 01383 g010
Figure 11. Wall temperature of the reactor. The red line is the smooth model temperature and the blue circles are the experimental measurements from Hoecker et al. [9].
Catalysts 10 01383 g011
Figure 12. Comparison of thiophene (blue) and ferrocene (orange) decomposition rates, with experimental data from Hoecker et al. [9]: (a) the mass fraction evolution; and (b) the decomposition of the source using the different decomposition rates.
Catalysts 10 01383 g012
Figure 13. Comparison of the theoretical, diameter based, particle diffusivity (blue), and the analytically approximated particle diffusivity with a function (orange). Both lines are for a flowrate of 0.5 l min 1 , temperature of 1250 °C and ferrocene mass fraction of 0.5 mass%.
Catalysts 10 01383 g013
Table 1. Decomposition rates of the iron precursor.
A [ s 1 ] E a [ k J ]Reference
Ferrocene-like1 × 1014209Kuwana and Saito [17]
Thiophene-like3 × 10388Infered from Hoecker et al. [9]
Publisher’s Note: MDPI stays neutral with regard to jurisdictional claims in published maps and institutional affiliations.

