Abstract
The photonic post-processing of suspended carbon nanotube (CNT) ribbons made by floating catalyst chemical vapor deposition (FC-CVD) results in selective sorting of the carbon nanotubes present. Defective, thermally non-conductive or unconnected CNTs are burned away, in some cases leaving behind a highly crystalline (as indicated by the Raman G:D ratio), highly conductive network. However, the improvement in crystallinity does not always occur but is dependent on sample composition. Here, we report on fundamental features, which are observed for all samples. Pulse irradiation (not only by laser but also white light camera flashes, as well as thermal processes such as Joule heating) lead to (1) the sweating-out of catalyst nanoparticles resulting in molten catalyst beads of up to several hundreds of nanometres in diameter on the textile surface and (2) a significant improvement in CNT bundle alignment. The behavior of the catalyst beads is material dependent. Here, we show the underlying mechanisms of the photonic post-treatment by modelling the macro- and microstructural changes of the CNT network and show that it is mainly the amount of residual catalyst which determines how much energy these materials can withstand before their complete decomposition.
1. Introduction
Carbon nanotubes (CNTs) and CNT bulk materials, such as papers, films or textiles, have been investigated extensively for a wide range of commercial applications [1]. Textiles spun directly from floating catalyst chemical vapour deposition (FC-CVD) processes have an advantage over other morphologies, such as filtered buckypapers, since they offer high intrinsic bundle alignment due to being spun out of an aerogel cloud. The spinning process works due to the entanglement of the CNT bundles inside the reactor. This entanglement gives the CNT network its mechanical strength and integrity, allowing for higher tensile forces to be applied during extraction of aerogel, but may impair its electrical or thermal conductivity [2,3,4] compared to an ideal, perfectly aligned assembly of nanotubes. Similarly, any co-synthesized bundle coating, depending on its nature and amount, may affect the physical properties of the nanotube textile [3]. Naturally, without any mechanical integrity, the material is in danger of tearing easily, which then irreversibly terminates any current flow. Several publications have discussed the advantages of CNT bundle alignment for mechanical, electrical, and thermal properties of CNT films or fibres [5,6,7,8,9]. Hence, many research efforts have focused on increasing CNT alignment without jeopardizing the as-produced mechanical integrity of the textiles.
Photonic post-processing, as described in [10], was mainly investigated for its ability to selectively sort the CNTs present in a textile sample. Narrow ribbons of CNT textile were suspended between electrodes and briefly illuminated using a laser, causing a rapid temperature rise. Defective, thermally non-conductive, or unconnected CNT bundles that cannot dissipate the heat away quickly enough are burned away, leaving behind a highly crystalline, highly conductive network. The surviving CNT material shows a much-improved Raman G:D ratio to the point where the defect-related D-peak is below the level of signal noise, even at longer laser wavelengths. The improvement in Raman G:D ratio was restricted to a certain specific material class derived from our floating catalyst CVD reactor. All FC-CVD spun CNT textiles, irrespective of the Raman G:D improvement, shared similar features when exposed to pulsed radiation of any kind, namely, a major improvement in alignment as well as catalyst sweating (expulsion of molten metal nanoparticles to the surface). For the case of “fluffy” CNT powder, photonic processing in the form of flash studies was reported to lead to ignition of the sample [11,12,13,14,15,16,17], catalysed by metal nanoparticles present in the sample either as residue from synthesis process or deliberately mixed in. Dong et al. [11] reported that with increasing content of Fe nanoparticles, from 5–30 wt%, the minimum CNT ignition energy decreases linearly. However, the temperature rise from burning would likely be simultaneously lowered by the addition of Fe nanoparticles. In CNT textiles, given the percolated network of connected CNT bundles, the samples do not ignite and burn completely. However, the role of catalyst particles in determining the laser processing effects is unknown and is the focus of the present study.
In this paper, we present photonic processing as a fast, scalable method to enhance a CNT textile’s microstructure, independent of its graphenic crystallinity. Expanding the observations described in [10], we show that the presence and number of metallic nanoparticles in the material determine the success of the laser treatment process. We concentrate on the structural changes of the network under laser irradiation and present a comprehensive interpretation of our results regarding the sample’s pre-existing anisotropy, the ratio of sample width to laser spot diameter, and the amount of carbonaceous bundle coating in the material.
The paper is constructed in three main sections: (1) an overview of single-point laser irradiation effects on the sample morphology and a model to interpret the macrostructural changes observed for all material classes, (2) the sweating of catalyst particles to the surface together with the description of the material classes this effect depends on, and (3) the bundle alignment and a simple microstructural model to explain it. We will mainly concentrate on the discussion of laser-irradiated samples, yet we will expand the photonic sorting to conventional camera flashes which achieve similar effects, as well as electrical heating mechanisms such as Joule heating.
2. Results and Discussion
2.1. Laser-Induced Change of Morphology
The CNT textiles shown in Figure 1 were irradiated by a single laser flash with a laser beam of 10.6 µm wavelength, 40 W average power, 150 ms duration (train of 740 pulses, each 40 µs long), laser polarization in the direction of CNT microstructure alignment, and a laser spot diameter of 7 mm. Depending on the thickness and density of other samples, the power applied was adjusted to keep the energy delivered per unit weight constant. For further details on the laser processing, please refer to the methods section below and reference [10]. In contrast to [10], where the laser beam was scanned over entire samples, here, in order to isolate effects of a sustained laser heating, we concentrate on single point irradiation experiments where the laser pulses are fixed on one location on the CNT sample.
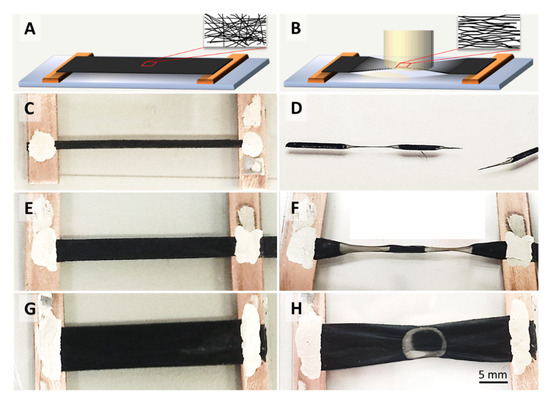
Figure 1.
Schematics and photographs carbon nanotube (CNT) film samples of different widths before (A,C,E,G) and after (B,D,F,H) single point laser irradiation. The laser irradiated areas are visibly more transparent and contract into an hourglass shape, provided that the sample width is smaller than the laser spot. If the sample width matches or is larger than the laser spot, the network contracts in a non-uniform manner, in certain cases (H) even showing annular transparent regions. The insets in A and B show schematically the changes in microstructure alignment.
The samples were mounted between two tabs or Cu electrodes as shown in Figure 1, suspended from the substrate and straightened, but were not put under tension. The samples of 2 and 4 mm widths shown in Figure 1C,E were each irradiated in two separate positions, and the sample of 8 mm width in one single central position as shown in Figure 1G. Macroscopically, the laser-irradiated samples show an hourglass shape if the laser spot exceeds the sample width (Figure 1D,F). The irradiated portions become transparent due to the degree of CNT decomposition. The corresponding mass loss depends on the energy delivered and the sample’s material composition, which will be discussed later.
According to [18], CNTs contract longitudinally at increased temperatures, which is opposite the response of most materials. We will show in the following sections that thermal contraction of the individual tubes or bundles can indeed explain the sample network’s lateral contraction (Figure 1D,F,H) into an hourglass shape, as well as the microstructure alignment (insets in Figure 1, and SEMs figures in Section 2.3), if the aspect ratio of sample width-to-length is small and the sample width is smaller than the laser spot diameter (Figure 1C–F).
The annular ring shape of the transparent region shown in Figure 1H is a particular effect which occurs in samples wider than the laser spot diameter. Although the laser beam’s intensity is distributed in a Gaussian shape over the laser spot area, the transparent region can either be in the centre, as would be intuitively expected, or as an annular ring at the rim of the spot as shown in Figure 1H. This effect is material-dependent, and we will attempt an explanation after the mechanical stress evolution and catalyst sweating has been rationalized (see Section 2.2 for the description of the two material types referred to). Here, we merely point out that sample widths that are larger than the laser spot diameter generally led to an inhomogeneous strain across the width of the CNT strip.
Aside from the bundle alignment (Section 2.3), we observe a diaphoresis or “sweating-out” of particles to the surface: particle impurities from unused carbon-encapsulated catalyst, or catalyst which grew short highly defective CNTs, re-melt and push their way through the bundles to the surface. On their way, they dissolve carbon, mainly defective carbons, and therefore help clean up the bundle network. We see no evidence for the particles having a sorting effect on the CNTs or bundles; the preferential disappearance of defective or thermally unconnected CNTs is due to laser-induced combustion.
Modelling the Macrostructural Changes
Figure 2 shows a macroscale time-dependent thermal-mechanical model for the CNT film, modelled with a commercial finite element package (ABAQUS). The detailed setup and material properties used in this analysis are described in Section 3. We modelled two sample widths corresponding to the experiments: 4 mm as the standard case, and 8 mm for when the laser spot diameter (7 mm) is close to the sample width. For both the temperature (left) and the von Mises stress (right), we show snapshots of the predictions at their initial state (0 ms) and after 100 ms which, according to [10], is when the laser pulse has taken its main effect. The von Mises stress is used to determine when a material will fail under complex loading, i.e., the combination of longitudinal, transversal, and torsional stresses. Note that plasticity or fracture is not considered in this computational model, hence it is reversible once the heat dissipation reaches equilibrium. In the real-life experiments, irreversible deformation of CNT film was observed due to CNT thermal contraction and burning. Therefore, we report snapshots rather than the model reaching thermal equilibrium.
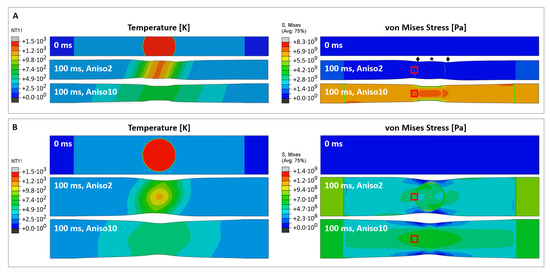
Figure 2.
Predictions of temperature profiles (left) and von Mises stress (right) for CNT film samples of a 4 mm (A) and 8 mm width (B). The units for the temperature and von Mises stress are [] and [], respectively. The snapshots show the initial state (0 ms, top), and temperature and stress distribution after 100 ms, for two different materials with anisotropy factors of 2 (middle) and 10 (bottom). The star and diamond symbols in (A) mark the different Poisson’s contraction of the pseudo-isotropic material around the laser spot boundaries which agrees with [21]. The red boxes mark where the readings for local lateral stress σ22 have been taken, plotted in Figure 3.
According to the two material types described, we investigate two cases of anisotropy, wherein we use the ratio of electrical conductivity measured in an axial and transverse direction as an anisotropy factor: a material with anisotropy factor of 2 (denoted “Aniso2” in the figure), i.e., close to isotropic, and a material with anisotropy factor 10 (“Aniso10”). The thermal expansion coefficient for the CNT film is unknown; according to the measured thermal contraction, the value was calibrated to −3 × 10⁻⁴ K−1. Note that this value is 25 times higher than the predicted value for individual CNTs [18]. Tomanek’s group predicted that individual CNTs would show a negative thermal expansion coefficient up to 1300 K, with a maximum of −0.1% strain at 800 K. In a macroscopic CNT network, the thermal expansion behavior is quite different from an individual CNT and depends on the microstructural deformation of the overall CNT bundle network. According to in situ tensile testing of CNT films [4,19], their mechanical properties are determined by the bending and shear behaviors of CNT bundles, rather than by axial stretching alone. The localized tensile stress generated by the thermal contraction is effectively stretching the CNT film [20]. This will align the CNT bundles towards the loading direction and subsequently introduce transverse contraction (i.e., a Poisson effect). The parameters used for the macroscale model are summarized in the table in Methods and Materials.
For a quasi-isotropic material (Figure 2A, “Aniso2”), the temperature does not level off as quickly as in the anisotropic case (Figure 2A, “Aniso10”) and hence remains on a steeper gradient. As a result, the thermally induced stress is overall lower but more localized around the laser spot circumference. For the wide, quasi-isotropic sample in Figure 2B, we observe stress concentration at two points on the laser spot circumference close to the sample edges which correspond nicely with Figure 1F, where the sample tore at the predicted location after laser irradiation.
Interestingly, the Poisson’s contraction is affected by the sample’s anisotropy as predicted by [21]. Most obvious for the narrow quasi-isotropic sample, the network contracts less at mid length than at the laser spot sides (marked by a star or diamonds in Figure 2A, respectively), while for the anisotropic sample (Aniso10) we observe a pure hourglass contraction. This behaviour can be understood from the different microstructure for different anisotropies, as schematically shown in [21], wherein an isotropic network would expand under stretching, and an anisotropic network would contract. For the anisotropic case (bottom right in both Figure 2A,B), we observe an anisotropic stress field, which in turn will lead to a higher alignment of the microstructure. This agrees with our experiments, where the highest alignment ever seen during laser irradiation was observed for an anisotropic sample (spun under low H2 conditions and gave a Chebyshev orientation parameter T2 = 0.77, see Appendix A, Figure A1).
Figure 3 shows the nominal longitudinal stress σ11 between sample ends (A) and the lateral stress σ22 at the circumference of the laser spot (B) as marked in Figure 2. The nominal longitudinal stress is calculated by normalizing the reaction force at the fixed end of CNT sample against the net cross-section area. In agreement with the experiments shown in [10], we see the main effect of a longitudinal stress increase at 100 ms; after that, the stress would decrease and relax over time, while for the experiment, the irreversible deformation will remain at this state.
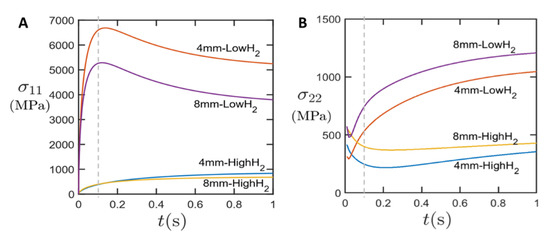
For the samples of high anisotropy, we see a significant increase in longitudinal stress, while there is slower and only moderate increase in stress for the quasi-isotropic cases. The stress developed in the anisotropic CNT films are about ten times higher than the quasi-isotropic CNT films (100 ms). A higher nominal stress was observed in the samples with smaller width. This is because the laser spot size (7 mm) is larger than sample width of 4 mm, but smaller than the 8-mm-wide sample. Therefore, the thermal gradient (dissipated heat per unit cross-section area) is larger in the 4 mm sample, which generates a higher thermal stress.
In the transverse direction (Figure 3B), the transverse compressive stress developed in anisotropic CNT films is again much higher than in the pseudo-isotropic CNT films, which can be attributed to the higher lateral contraction. For the anisotropic CNT films, transverse stress σ22 increases over time. In contrast, in isotropic CNT films, transverse stress σ22 decreases. This might be due to stress redistribution in the quasi-isotropic CNT films during the first 200 ms.
Note that in the finite element modelling, the CNT film is assumed to be a linear elastic material without any plasticity. Therefore, the value reported is only meant to show the variation of stress with the temperature change. After reaching the peak stress due to the largest thermal contraction, the stress would decrease and relax over time as the heat is dissipated over the whole sample. If any plasticity is considered, the stress will be capped by the yield strength, therefore much lower than elastic prediction.
2.2. Catalyst Sweating
2.2.1. Coarsening of Sweated Nanoparticles
During the time interval that heat is applied, catalyst particles, predominantly iron in various different states of oxidation, melt and travel along the bundles driven by the temperature gradient towards the lower temperature and collide, coalescing into bigger particles. The particles move faster, the higher the central temperature, i.e., the more liquid the particle, and steeper the temperature gradient, but also, the more aligned and zipped-up the network. Hence, we find a lot of the bigger particles at the edges of the films, where the lateral contraction of the network brings the bundles closest (see Section 2.3). However, note that the effects of temperature gradient and bundle alignment cannot be observed separately with regards to particle motion, as the bundle alignment itself is caused by the thermal contraction of the CNTs.
2.2.2. Dependence on Material Class
The process to spin CNT fibres or textiles from floating catalyst CVD has been described in detail before [2,22,23,24] and is summarized in the methods section. One important parameter that has a major effect on the material and indeed subdivides it into two very distinct classes has been reported recently by Kaniyoor et al. [24]: the carrier gas flow rate. In brief, “low H2”-spun material, as we refer to material that was spun with a low flow rate (<2 L min−1) of the hydrogen carrier gas, is composed of a mixture of few-wall and multi-wall CNTs, with a low percentage of iron residue (<5%), but a high amount of carbonaceous bundle coating (>10%), and shows a high anisotropy (represented in the mechanical models as “Aniso10”). “High H2”-spun material (>3.5 L min−1) contains predominantly single walled CNTs (SWCNTs) with a remarkably high radial breathing mode (RBM) located around 152 cm−1 and shows a higher amount of iron residue (>20%), but a very low amount of carbonaceous coating (<5%). In this material, the bundle network is of poor alignment, represented as “Aniso2” above. We acknowledge that the floating catalyst CVD is a multi-parameter process, wherein the material’s composition could be adjusted by varying many other parameters such as the type and concentration of the carbon, sulphur, or catalyst precursors used (i.e., ratios of C/S/Fe), or the overall dilution of the reactants in the carrier gas. However, we found the overall flow rate to play a dominant role in determining CNT type [2,3,24].
In the present work, we produced CNT fibres using toluene as the carbon source under low H2 and n-butanol as the carbon source under high H2 conditions. Both samples were condensed with acetone to increase physical contact between the CNT bundles. The samples produced in the two flow regimes exhibit the typical differences in their physical properties. (Please refer to Appendix A, Figure A2 for Raman measurements, and Figure A3 for elemental analysis.) The as-spun physical properties are well documented in [3] for “low H2”-spun and [2,7,10] for “high H2”-spun material. The specific tensile strength and specific electrical conductivity are 2 N tex−1 and 700 S m2 kg−1 for “low H2”-spun material, and 0.3 N tex−1 and 100 S m2 kg−1 for “high H2”-spun material, respectively. The extrinsic properties, in particular the alignment of the sample as-spun, outweigh the intrinsic properties, such as CNT type, CNT defectivity, etc. After laser treatment, the sample was very thin and fragile; therefore, mechanical properties were not measured. The supporting Cu tabs allowed us to probe the resistance in situ after laser treatment, and typically the resistivity would double while the weight decreased by >80%, which refers to a significant increase in specific conductivity. For the measurement of the specific conductivity without the dead weight of the metallic particles, the laser treated samples were acid washed and thereby condensed into a fibre. The specific conductivity of “high H2”-spun material then increased to 1330 S m2 kg−1 on average [2].
Given the differences in hydrogen flow rate, we expect that the difference in the catalyst particles’ residence time in the reaction zone might result in a difference not only in CNT diameter but also length. Length measurements by atomic force microscopy or electron microscopy, however, can only be conducted for individualized tubes; in textiles, bundle length and mechanical integrity, although advantageous for a sample’s physical properties, impede individualization. Accordingly, both material types, and in particular “low H2”-spun material, resisted successful individualization (Figure A5A inset). We were therefore not able to unambiguously measure the real length of CNTs present in either material. Some CNT bundle fragments which were knocked out of the main sample were analyzed in SEM, giving lower bounds on the bundle lengths of 44 and 78 µm for “low”- and “high H2”-spun material, respectively (note that the actual lengths of the pristine CNT bundles would be significantly higher than these). Noticeably, “low H2”-spun CNT fragments are visibly stiff and straight compared to the wavy “high H2”-spun CNT fragments (Figure A5). That, together with the even shorter fragment length of “low H2”-spun material, supports that this material type is comprised of few- to multi-walled CNTs and stiffened by carbonaceous bundle coating, while “high H2”-spun material consists of predominantly single wall CNTs with little to no bundle coating and is therefore easier to individualize while preserving more of the pristine length.
The SEM and TEM images in Figure 4 show how “high H2”-spun material (Figure 4A,B) or “low H2”-spun material (Figure 4C,D) react to laser treatment: for “high H2”-spun material, catalyst particles re-melt and move through the bundle network towards the surface, which we describe as sweating. The droplets sit neatly on top of the bundles but do not wet them. In rare cases, they may even fall off without any outside interference (Appendix A, Figure A10H). When rinsed with an acid, the droplets leave an empty carbonaceous shell behind (Figure 4B), from which the metal has been dissolved out. Note, however, that upon contact with a liquid the network simultaneously condenses. Therefore, to preserve the improvement of alignment gained, the textile needs to be kept under tension as described in [7].
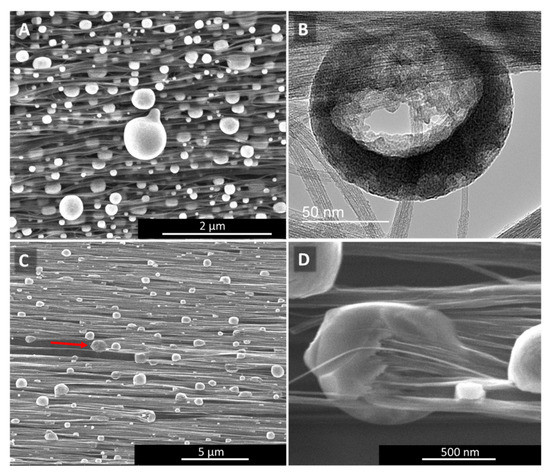
Figure 4.
Catalyst sweating (A,B) in “high H2”-spun material and catalyst consumption of CNTs (C,D) in “low H2”-spun material. The red arrow in (C) marks the direction of the catalyst consuming the bundle of CNTs still protruding from the particle on one side (higher magnification in (D)), and the void of bundles it left behind. For each particle consuming CNT bundles, we can observe CNT bundles protruding on one end and a void at the other.
For “low H2”-spun material on the other hand, while particles have coarsened through coalescence, the particles have not fully protruded to the surface but remain within the bundle network. Rather than sitting atop the bundles as perfect or partly squeezed spheres, as in Figure 4A, the particles encase the bundle ends (Figure 4C,D). At sufficiently elevated temperatures (above 600 °C, based on [25]) and if in close thermal contact with the bundles, the catalysts can re-consume and dissolve the bundles. For each particle “eating” its way along the bundles, we can observe a void or tear behind the particle (red arrow). Figure 4C SEM refers to a position in the centre of the laser spot. Heat would be conducted away into both directions which is why we see particles moving both to the right and to the left, each with voids behind them. Compared to “high H2”-spun material, the energy input during laser treatment is limited by the decomposition of the bundle network. Due to the close contact of particles and bundle network, it was not possible to rinse the metallic nanoparticles out; rather, acid washing a laser-treated “low H2”-spun sample resulted in the sample’s disintegration.
We attribute this difference in particle behavior to the difference in the amount of carbonaceous coating and amount of residual catalyst particles present in the respective materials, which we will discuss in the following section.
2.2.3. Carbonaceous Bundle Coating
Thermogravimetric analysis (TGA) of the samples is shown in Figure 5. The as-is uncondensed samples have two characteristic peaks indicating two different populations of CNTs: multi-wall and few/single-wall, respectively. In comparison, the “high H2”-spun sample shows one dominant population. Together with the appearance of a stronger RBM peak in the Raman spectrum (Figure A2 in Appendix A), and as detailed in our earlier work [24], this shows that at high flow rates, SWCNTs are formed preferentially. In addition, as shown in the TGA comparison in Figure 5A, by condensation of “low H2”-spun material with acetone or toluene, a new peak appears around 345 °C. Our hypothesis is that the solvent links the flakes of carbonaceous coating together via coalescence of amorphous carbon (or PAHs) structure, forming a new compound via cross-linking or functionalization which binds the network tightly. This process is highly advantageous for all properties, be it mechanical, electrical or thermal [3,26], but prevents most forms of post-processing. By contrast, the “high H2”-spun material does not show any change in amorphous carbon (300–450 °C) when condensed, which is likely due to the lower amorphous carbon content in “high H2”-spun samples. However, the “high H2”-spun material shows overall poorer physical properties as-spun [2,7], but can be post-processed due to the much lower amount of bundle coating.
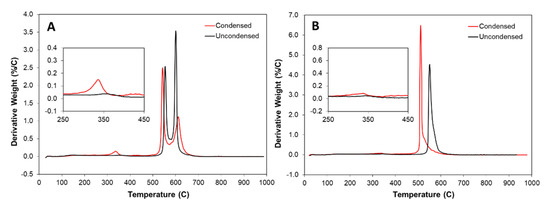
Figure 5.
Thermogravimetric Analysis: Derivative weight versus temperature of (A) “low H2”-spun, and (B) “high H2”-spun material, uncondensed (black) and acetone condensed (red). Note the new peak at 335 °C appearing when “low H2 “-spun material is condensed with acetone (inset), which we attribute to the carbonaceous bundle coating crosslinking. The two main peaks correspond to two populations of nanotubes, wherein the peak at 550 °C corresponds to multi-walled CNTs and at 600 °C corresponds to few- or single-walled CNTs. For further information, please refer to the TGA/Raman/SEM comparison studies in [23,24]. In “high H2”-spun material, in particular if spun from alcohol as shown here, we do not observe any new populations by acetone condensation, but rather a shift of the main peak to lower temperatures due to higher density and increased contact between CNTs. This one single peak corresponds according to Raman spectroscopy (Figure A2) to SWCNTs.
Given our empirical knowledge of the process and characterization of samples, we understand that the carbonaceous coating’s structure depends on the carbon source. For example, it can be either aliphatic when spun from an alcohol, or polyaromatic if spun from toluene. In either case, since this carbonaceous material is highly defective, it would be most susceptible to corrosive attack during laser annealing as compared to CNT walls. Hence, we would expect the carbonaceous material to be preferentially re-dissolved by the re-molten particles. However, it can be seen from the TEM images shown in [10] that the carbonaceous coating is still present. If at all, it only partly dissolves in the particles and contributes to the carbon that precipitates from the cooling ferrous particle and leaves the shell after acid treatment.
One aspect that became more obvious from the camera flash experiments described in Section 2.4, more easily observable here due to the stepwise nature of the experiments at lower energy, is that condensed and uncondensed materials react very differently. Here, too, it is important to state that the material in which we observed such differences is spun from toluene which means that the carbonaceous bundle coating is of high aromaticity [3]. As shown in the TGA comparison in Figure 5, by solvent condensation of the material, a new peak appears around 345 °C. However advantageous this may be for the spinning process or as-spun fibre properties, during post-processing, this binding effect leads to collateral damage of the entire material upon laser exposure, rather than just ablation of defective CNTs or individual flakes of amorphous carbon. Therefore, under laser irradiation, “low H2”-spun material often fully decomposed and was excluded from the study presented in [10].
Additionally, the density of the “high H2”-spun material’s network is generally lower due to the overall lower alignment of the as-is material (using the method described in [3] for alignment quantification) as well as the lower amount of bundle coating. This facilitates the re-molten particles to move relatively unhindered through the network.
2.2.4. Nanoparticles from Catalyst Residue Catalyze CNT Oxidation
As shown for more than 370 samples in Figure 6B (further trends discussed in [2]), the higher the H2 flow rate, the higher the amount of residual weight from (mainly unused) catalyst in the material. Note that the data shown include all samples characterized in [10], covering different precursor sources and ratios, spinning recipes, and injection methods which lead to the large scatter.
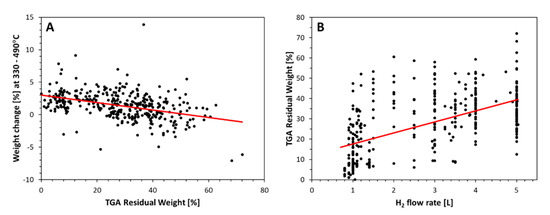
Figure 6.
TGA data points of >370 samples. (A) shows the weight loss or gain in [%] for the temperature region 330–490 °C, (B) shows the residual weight at 800–1000 °C.
Further, as we can see from the electronic supplementary information in [24], the higher the H2 flow rate, the more we observe a weight increase from 350 to 450 °C, just before the onset of the first carbon nanotube burning event. Figure 6A shows the weight change in [%] calculated as area under the TGA derivative curve for the temperature range 330 to 490 °C, wherein positive values correlate to material burning. The higher the residual weight, the more said weight change is negative, i.e., correlates to weight gain. This is usually interpreted as resulting from metallic particles oxidizing: here unused residual catalyst particles encapsulated in carbon shells.
This is the type of particle that will drive the material change under laser irradiation as these particles are the most accessible for oxidation as well as melting, compared to the very small particles encapsulated inside the carbon nanotubes during their growth [14].
In the “low H2”-spun material, which has a very low residual Fe content (around 5 wt% for the sample discussed in this publication), and consists mainly of few- or multi-walled CNTs, the catalyst particles efficiently decompose the CNTs on irradiation since most of the laser energy is available for activating the reaction with oxygen. However, in the “high H2”-spun material, which has up to 30 wt% Fe residue and consists mainly of SWNTs, the catalyst provides a larger effective thermal mass which reduces the heating effect due to irradiation below the temperature at which oxidation of CNTs can be activated. In short, successful laser treatment requires a large amount of catalyst residue to be present in the CNT network. The metal nanoparticles can both catalyze the oxidation of CNTs to commence at lower temperatures, but also absorb a large amount of thermal energy so that CNT bundles are protected from oxidation, so long as they are sufficiently well connected to conduct the residual heat away.
2.2.5. Elemental Analysis of Metallic Nanoparticles after Laser Treatment
Transmission electron microscopy (TEM) confirms the much higher loading with catalyst residue for “high H2”-spun material, both before and after laser annealing, with much larger (coarsened) particles after laser treatment. Overall, the “high H2”-spun material appears finer and denser and is less contaminated by amorphous bundle coating. Figure A8 shows STEM-HAADF (high-angle annular dark field) images of the bundle networks sprinkled with the coalesced particles and an elemental analysis in Figure A8C and Table 1. The catalyst particles, visible as bright features in the STEM images, are up to a few hundred nanometers in size. The “low H2”-spun material shows significantly smaller (few nanometer sized), evenly distributed catalyst nanoparticles after laser treatment; these can be observed as iron signals in the area-averaged energy dispersive X-ray (EDX) spectra. The lower Fe content observed for laser treated “low H2”-spun material agrees with the much lower amount of catalyst residue as-spun (refer to “Dependence on material class” and Figure 6). Some sub-micro-meter particles can be seen but are attributed to calcium contamination. The elemental analysis is reported in Table 1. The quantification is affected by a spurious signal from the TEM support grid (Cu) as well as a strong carbon signal, originating from the CNT surrounding the catalyst particles.

Table 1.
Elemental analysis of nanoparticles after laser treatment.
Some of the larger particles show a significant amount of calcium, which originates from the reactor tube material, mullite. Calcium is used to modify the ceramic’s morphology to be needle-shaped and for the needles to interlock, so that the material can withstand higher temperatures than platelet-shaped mullite. As we observed in [2], the reactor tube undergoes ageing over the weeks of spinning. During this ageing process, some elements ablated from the ceramic reactor tube walls are integrated in the catalyst/nanotube network, wherein the depletion is more significant at the beginning of a reactor tube’s lifetime and occurs faster for higher H2 flows. Figure A3 shows the elemental analysis of a “low H2”-spun sample where Ca or Al are observed as incorporated in the catalyst particle, while Si is mainly to be found in the carbonaceous bundle coating. Elemental analysis also shows a significant difference in Si content for low and “high H2”-spun material, which, as it is attributed to the carbonaceous coating, agrees well with the difference in amorphous carbon measured in TGA (in the range of 10 or 2%, respectively).
2.2.6. Annular Ring or Transparent Centre
As mentioned above, for samples wider than the laser spot, depending on the material, irradiation either causes a transparent annular ring or a transparent, often completely burned centre (Figure 1 and Figure A9). We believe this difference can be explained based on the amount of catalyst present in the material combined with the mechanical stress developing for the two different anisotropies. For “high H2”-spun material, the thermally caused von Mises stress is concentrated in an annular ring, while for “low H2”-spun material, the stress is highest at the centre of the laser spot. Together with the much lower metallic nanoparticle residue in “low H2”-spun material which cannot absorb as much heat energy, this leads to burning and tearing at the laser spot centre.
2.3. Bundle Alignment and Orientation
Apart from the catalyst particle sweating, for all samples we observe a significant increase in bundle alignment. These effects occur for both material classes similarly. In the following, we will investigate the underlying processes using a “high H2”-spun sample as an example.
Figure 7 shows a 4-mm-wide sample after single-spot irradiation. While the bundles in the region at laser spot centre is well aligned (Figure 7B,D), at the sides, bundles at the outer rim of the irradiated area are locked together spot-wise at entanglement points only. This results in a bundle waviness (Figure 7D) that originates from a lateral strain which can even lead to micro-tears (Figure 7C). In general, the wider the sample, the more uneven the bundle alignment is. Bundles close to the central axis (parallel to the bundle alignment) cannot zip together as much as those close to the edges.
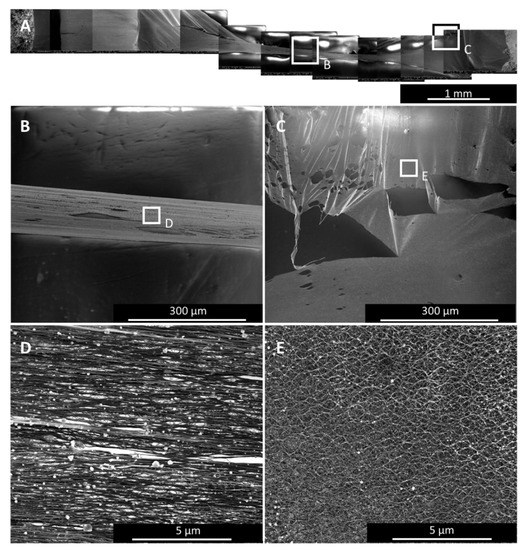
Figure 7.
SEM images of a 4-mm-wide sample after single spot irradiation. (A) shows the overview of the whole sample with two specific areas marked: in the centre (B), where the bundles are well aligned (C), and at the rim of the laser treated region (D), where the lateral strain hinders the irradiated material to contract as it would want to, leading to internal stress, which shows as bundle waviness (E) and micro-tears (D).
Irradiation or Joule heating, as described in Section 2.4, lead to two main effects regarding the sample’s network microstructure: (1) bundle alignment and (2) the increase in the bundle diameter. In Figure 8, we show SEM images at four different positions of a sample irradiated at one single spot as marked in the sketch: at the outside (A) where the sample is untreated, and from positions in the laser spot: at the rim (B), an intermediate position (C), and in the very centre of the laser spot (D). Image analysis shows that both the bundle alignment and bundle diameter increase, the closer to the laser spot the image is taken. The increase in bundle alignment was quantified by Fourier transformation of the SEM images into intensity distribution vs. angle of bundle orientation as described in [3,27,28]. Table 2 summarizes the full-width-at-half-maximum (FWHM) of the FFT intensity distribution peaks, Chebyshev orientation parameter determined according to [27], and the increase in bundle diameter as determined by ImageJ software.
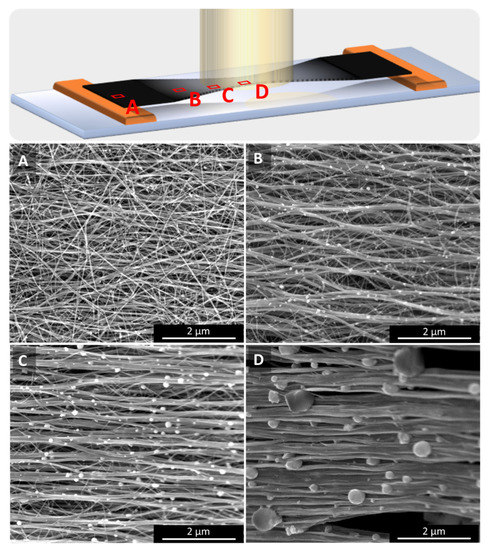
Figure 8.
Four measurement positions on a single spot irradiated sample as marked on the top sketch: (A) on the outside of the treated region, i.e., untreated as-spun, (B) at the rim, (C) an intermediate position within the laser spot, and (D) in the centre of the laser spot. The temperature at the laser spot centre being the highest, alignment and bundle diameter both increase with the temperature, as does the size of the catalyst particles that sit on the bundles.
Table 2.
Chebyshev orientation parameter T2, FWHM of the SEM image’s intensity distribution, and the bundle diameter determined by image analysis of the SEM images A–D in Figure 8.
Note that due to a cosine-squared dependence on the angle of orientation ϕ (), the change in Chebyshev orientation parameter T2 is not linear within its range of 0 to 1 (perfectly misaligned or perfectly aligned respective to the axis of main orientation, respectively). For a plot of the orientation parameter against the FWHM of the intensity distribution, the steepest gradient occurs for orientation parameters between 0.5 and 1 [27]. Hence, for orientation parameters between 0 and 0.5, a significant change of FWHM results in only a small change of orientation parameter. Here, between the rim of the laser spot (Figure 8B, where only the top surface appears to be aligned) and centre of the laser spot (Figure 8C), the orientation parameter change indicates a very high degree of alignment.
The highest alignment we observed during these studies, showing an order parameter T2 = 0.77 (Figure A1), was for “low H2”-spun material, given its pre-existing much higher anisotropy as-spun.
A uniform improvement of alignment was seen only if the whole width of the textile ribbon was irradiated simultaneously with equal intensity. For the procedure discussed in [10], the laser beam was scanned over a narrow ribbon. That mitigates the effects at the spot rim over the whole sample length that was irradiated, so that only the very ends of the sample had to be discarded. As we will discuss in the next paragraph, the sample must be long and narrower than the laser spot to allow for the network to contract without too much counter-stress from untreated material.
Modelling the Microstructure Alignment
In Figure 9, we show a simplified case of a fishnet network in three different widths. For simplicity, the aspect ratio has been kept the same as in the experiments and the same as in the macroscale modelling, described above. The elements shown here are obviously much larger than CNTs or CNT bundles, if one assumes the same overall dimensions as the experimental samples. The intention is merely to show the principle of how the aspect ratio of the sample will influence the ability of the individual elements to align when subjected to contraction, for example, thermally induced.
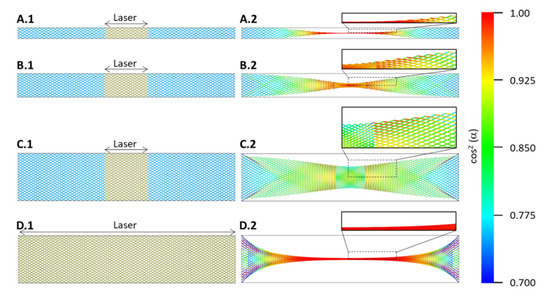
Figure 9.
Microstructural model showing the effect on microstructure alignment for three sample widths, for simplicity corresponding to the aspect ratios used in experiments. (A–C) show single point experiments, where the marked central region (left) contracts and causes an overall structural change (right). The colour code gives the cosine-squared of the angle between each element, and the horizontal axis is hence a measure for the alignment. (D) shows the case when either the whole sample is irradiated at once or a laser beam is scanned over the sample, extending the aligned section and causing stronger edge effects.
The precise sample length is not of particular consequence as long as it is longer than approximately three times the diameter of the laser spot. However, the ratio of sample width to laser spot diameter largely determines whether the microstructure can align under contraction. As long as the sample width is significantly smaller than the laser spot diameter, the elements align, which can be understood from the colour change to red signifying the smaller angle to the horizontal axis (the colour code refers to the squared cosine of the angle between element and horizontal axis).
When the sample width is close to or equal to the laser spot diameter, here simplified to a square section (Figure 9C.1), the effect flips: the alignment increases at the outside of the irradiated region and in particular at the edges there, while within the laser spot region, we observe only a marginal improvement in the centre and not at all at the edges.
For the case in which the whole sample is irradiated at once (Figure 9D.1) or scanned over by the laser as discussed in [10], the aligned region can be extended. However, the restraining effect of the tabs also increases, and it is likely that the samples tear at the ends. In both Figure 9C.2,D.2, we notice triangular shaped sections towards both sample ends. It is within these triangles, where the bundles turn darker blue that one would observe increased waviness of the bundles (Figure 7D,E) up to tearing.
This much simplified model shows the overall structural change under mechanical contraction in the areas marked (denoted “laser”). There are several aspects of the laser irradiation effect not included, such as that the laser spot being circular rather than rectangular, having a Gaussian intensity profile, and that because of the laser irradiation a significant percentage of the CNTs is burned away, and the density of the irradiated region is decreased accordingly. The untreated sample ends would be several times the density of the treated section and increase the restraining force of the ends.
As we can observe in Figure 8, the bundle diameter more than doubles from 23 to 53 nm from the outside as-spun material to the centre laser spot region, respectively. This effect, not included in the fishnet model of Figure 9, has been described for CNT networks by several groups in recent literature [29,30,31,32,33]. In particular, [30] describes how, by straining an unaligned CNT film, the stretched network undergoes restructuring. Bundling increases locally and pores undergo squashing under the transverse contraction caused by the Poisson’s effect and the zipping relaxation directed by the strain direction. This is equivalent to the effect we observe here for laser processing, with the only difference being that in this case the overall stress is caused internally by thermal contraction of the microstructural elements rather than external strain.
2.4. Alternative Post-Treatment Methods
Although in this paper we will concentrate on effects observed for laser irradiated samples, we deem it important to emphasize that other methods such as camera flashing (Figure 10 and Figure A10) or Joule heating (Figure 11) will lead to comparable effects due to the same physical principles being at work. For the success of the post-treatment, it is crucial that the textiles are suspended. If the textiles are in thermal contact with a substrate, heat may be absorbed by the substrate and the CNT bundles might be deprived of their freedom of motion within the textile matrix. However, they do not need to be connected electrically, freestanding films or films suspended between paper tabs work just as well.
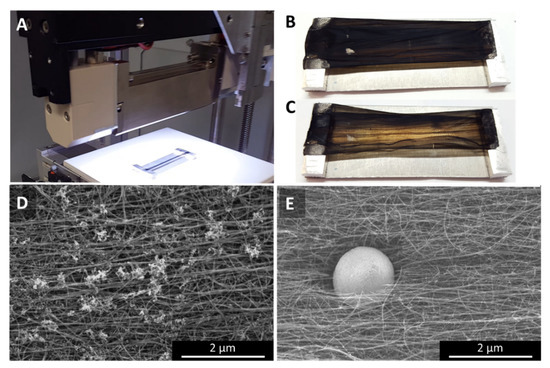
Figure 10.
White light flash irradiation with a commercial setup (Heraeus Noblelight). The samples were fully illuminated over the whole area (A). Compared to the as-prepared sample (B), the samples look significantly more transparent after the flash (C). Interestingly, the sample appears a lot cleaner microscopically. The cluster impurities (D) which are typical for “low H2”-spun samples spun from n-butanol have largely disappeared, leaving very sparse, but very large spherical particles sitting in a dent of material, surrounded by CNT bundle ends (E).
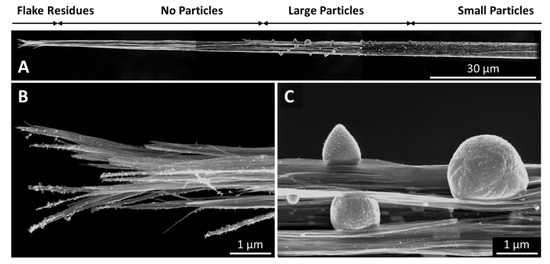
Figure 11.
A CNT fibre after an ampacity test in air. The overview (A) shows a particle free region close to the tip, where the fibre has failed, i.e., burned in the ampacity test. At the very tip, there are still flake residues (B), but no evidence of any catalyst. There follows a 60-mm-long region which is very clean, and where the bundles are highly aligned, followed by the region where we find very large particles sweated to the surface (C). The further away from the point of failure, the smaller the particles, as well as the bundle diameter.
2.4.1. White Light Camera Flashes
Multiple flashes (in our experiments, 5 to 50) from a commercial camera flash (Figure A10) as well as flashes from an industrial white light flash (Heraeus Noblelight, Figure 10) led to increasingly transparent networks, with both the alignment increasing with the number of flashes as well as the size of the particles at the surface. In case of the Heraeus Noblelight setup, despite the transparency, we observed less bundle alignment than first expected, while a few big spherical particles appeared to have eaten their way in or out of the network. In retrospect, the absence of bundle alignment can be explained by the width of the sample which opposed the alignment as was previously explained in the modelling section.
The sample chosen for the industrial setup was a “low H2”-spun sample using n-butanol as carbon precursor. As-spun, the sample shows the small cluster impurities typical for alcohol-spun material (Figure 10D and Appendix A, Figure A10A–C). After the white light treatment, the material appears very clean, with only sparsely occurring, very large particles (Figure 10E and Figure A10G–I). In contrast, the commercial camera flash shows the same distribution of cluster impurities as as-spun, with the impurities themselves having changed from wads of tubular entities to clusters of spherical particles (Figure A10D–F). In a sense, even samples partially burned in TGA show a similar result [23]; however, here there is no directionality of the heat, but the sample is heated uniformly. Therefore, we do not observe any movement or coalescence of the particles.
2.4.2. Joule Heating
The effect that Joule heating caused leads us to conclude that the underlying processes are the same, although the setup and experimental aim was somewhat different to the other methods presented here. In particular the heating rate was significantly lower, with the overall experimental duration being in the range of an hour rather than less than one second. Furthermore, the experiments were performed on fibres rather than textile sheets or ribbons; therefore, the alignment was, as-spun, already substantially higher than for the films. After the experiment, we see substantially increased alignment and bundle growth paired with particles sweating out through the bundle network, and all of the effects increase as the spot that ultimately burned under the Joule heating experiment is approached (Figure 10). At the very tip where the fibre has failed under the Joule heating, we can still observe small flakes on the CNT bundles (Figure 11B), but no evidence of catalyst particles. Over a length of several tens of micrometres, the bundle network is very clean, up to a point where we suddenly find very large particles (Figure 11C). Molten particles move, driven by the heat gradient and coalesce to bigger droplets. The further away from the failure zone, the lower the heat, the less molten and mobile, and therefore the smaller the particles.
Apart from the rate of heating, another key difference between the optical methods and Joule heating is that whereas camera flashing provides an even amount of energy spread over the whole surface of the sample (with decreasing results the thicker the samples), Joule heating will heat the bulk of the sample, though it will preferentially heat where a conductive network is pre-existing through which the current can flow. This means that impurities are only heated indirectly, and Joule heating might not be as effective at cleaning the fibre without damaging the conductive network. However, around the actual fracture zone, the Raman G:D ratio is improved (Figure A11), similar to what was already discussed in case of laser processing [10].
3. Materials and Methods
3.1. CNT Material Preparation
3.1.1. CNT Film Spinning
The floating catalyst process for synthesis and direct spinning of carbon nanotube fibres and textiles has been described at length before [3,22,23,24]. In short, a carbon and sulphur precursor, in this case toluene (CAS: 108-88-3, HPLC grade, Fisher Scientific, Loughborough, UK) or n-butanol (CAS: 71-36-3, LR grade, Fisher Scientific, Loughborough, UK) and thiophene (CAS: 110-02-1, 99%, Alfa Aesar, Heysham, UK), together with a catalyst precursor, in this case ferrocene (CAS: 102-54-5, 99%, Alfa Aesar, Heysham, UK), are introduced into a tube furnace (Elite tmvh15/105/900, Elite Thermal Systems Ltd., Market Harborough, LS, UK), break down catalytically in the reaction zone and form an aerogel of carbon nanotubes. By adjusting the carrier gas flow, the ratio of precursors and their dilution, and thermal conditions during synthesis, the aerogel can be tailor-made regarding the CNT’s number of walls, bundle length, entanglement and alignment, and the amount of co-synthesized coating and ferrous impurities anchored in the network. The aerogel is then pulled out, wound up continuously and layered up to form a non-woven textile. The samples used in this work are laser-cut ribbons of CNT textile, with the microstructure alignment of the bundles in the long direction of the ribbon. For the sake of completeness, samples with the bundle alignment perpendicular to the ribbon’s length have been trialed but broke either at sample preparation or at the latest when irradiated.
3.1.2. CNT Sample Preparation for Post-Treatment
The condensed film’s thickness typically ranged from 10–30 µm. The laser-cut ribbons were of a 65–70 mm length and a width of 4–5 mm, if not otherwise stated. For the industrial Noblelight flashing, the width chosen was significantly larger, 20 mm, to investigate the scalability of the process.
For the laser annealing and the industrial Noblelight flashing, CNT ribbons were suspended between two copper electrodes and elevated a few millimetres over a glass substrate, as depicted in Figure 8A. Note, that those electrodes were merely used for electrical characterization before and after treatment [10] but are not essential as electrical contacts during irradiation itself. At irradiation, the mechanical fixing of the sample ends between the electrodes induces internal stress, as it opposes the thermally induced contraction of the CNT bundles. For the commercial camera flashing experiments, cardboard tabs were attached on both ends and the sample was mounted hanging with the bottom tab being weighed down with a 5 g peg to prevent extensive wafting of the sample. We noticed that the sample “jumps” under the flash (not discussed in this work).
3.2. Experimental Methods
3.2.1. Laser Annealing
We used a collimated, linearly polarized, 10.6 μm laser beam (Rofin CO2 slab laser, Coherent Inc., Plymouth, MI, USA) with typically 40 W average power, a 5 kHz pulsed repetition rate, and a 20% duty cycle. The beam intensity profile is pseudo-Gaussian with a 1/e2 diameter of 10 mm. This yields an average intensity of 50 W cm−2. Per pulse, the peak intensity and fluence are 250 W cm−2 and 0.25 J cm−2, respectively. These parameters are not optimized; in particular, depending on the CNT film thickness and density, the result varies significantly. A 1030 nm fibre laser was also tested and yielded similar results.
3.2.2. Camera Flashing
The camera flash experiments were executed with a commercial flashgun, Neewer TT520 Flash Speedlite (Shenzhen Neewer Technology Co. Ltd., Guangdong, China), guide number of 33 (ISO 100). The flash duration is given as 1/800s-1/2000s. The flashgun was set to full power at 25 mm distance from the hanging sample. The experiments were executed in an enclosure inside a fume hood to reduce ambient lighting and simultaneously protect the experimenter from particles becoming airborne by the material’s decomposition.
The large-area camera flash experiments were executed with a Heraeus Noblelight flash system (Heraeus Noblelight Ltd., Cambridge, UK). A wide sample of 25 × 70 mm was fully irradiated from a distance of 50 mm. The parameters chosen for these preliminary tests were four pulses of a frequency of 10 Hz, pulse duration 1 ms and 400 V.
3.2.3. Joule Heating
The main aim of the Joule heating experiments was to determine the failure currents of CNT “wires” (to be discussed in a further publication), and thus the materials differ from those used for other sections. These fibres are obtained by spraying acetone on the CNT aerogel as it comes out of the reactor. Tested fibres were spun in low H2 conditions and had apparent diameters between 5 and 15 µm and effective densities of around 0.65 g cm−3. Secondly, heat was applied at a much slower rate than on lasing or flashing experiments: samples were mounted on a typical 4-probe set-up (external probes for injecting current and internal ones for measuring the voltage drop) connected to a Keithley 2400 source meter (Tektronix UK. Ltd., Berkshire, UK) in which the 10 mm length of fibre was suspended between the voltage probes. A small amount of slack was allowed to ensure that the fibre would burn rather than snap due to thermal contraction. Silver conductive paint (Electrolube, Leicestershire, UK) was used to affix the fibre to the copper probe electrodes. The current through the fibre was ramped up from a base current to a variable maximum current. The fibre would be kept at current for a fixed time and then taken back to the base current. This cycle was repeated to progressively higher currents until the sample failed (i.e., the sample’s resistance would become so high that the target current would not be reached).
3.3. Analysis
3.3.1. Transition Electron Microscopy
CNT film samples were mounted on folding copper TEM grids. The samples were characterized in a FEI Tecnai Osiris S/TEM (FEI Company, Hillsboro, OR, USA) operated at an acceleration voltage of 80 kV. TEM images were acquired on a Gatan Ultrascan camera (Gatan Inc., Pleasanton, CA, USA); STEM-EDX data were acquired using a large-area Bruker EDX detector (Bruker, Billerica, MA, USA) with four segments (Super-X), with a total collection angle of 0.9 sr. Data were processed using ES Vision and Hyperspy (an open-source Python toolkit for electron microscopy data analysis).
3.3.2. Alignment Analysis
To determine fibre alignment, SEM images of the samples were captured at a magnification of 20 kx at different spots along the sample (FEI Nova NanoSEM, FEI Company, Hillsboro, OR, USA). Fourier power spectra were obtained from the SEM images using an analysis program written in Python. For further analysis, the power spectra were converted to an intensity distribution profile, plotting the radial intensity over the angle of orientation. The intensity profile was fitted with a Lorentzian distribution, which the program then used to calculate Chebyshev orientation parameter, which is the 2D equivalent of the Hermans factor [3,27]. The orientation parameter varies from zero to unity non-linearly, with zero representing random alignment in plane (completely unaligned sample) and unity representing perfect uniaxial alignment in plane (fully aligned sample).
3.4. Computational Modelling
3.4.1. Microscale Mechanical Model
The fishnet microstructure was generated as a regular 2D rhombic lattice of straight harmonic spring elements of equal length. The initial angles within a rhombus were chosen to be 60° and 120°. For all considered samples, the length was set to 50 rhombi to mitigate finite size effects while still resolving the microstructure. The height of the lattice was chosen to mimic the aspect ratios of the experimental (Figure 1) and macroscopic computational samples (Figure 2) as closely as possible.
To simulate the effect of the structure contracting where exposed to laser irradiation, within a rectangular central region highlighted and denoted as “laser spot” in Figure 9A.1,B.1,C.1, the natural spring length is set such that the final strain after contraction will be −0.38 in agreement with thermal contraction due to a thermal expansion coefficient of −3 × 10⁻⁴ K−1 at a temperature of 1450 . Hence, the initial configuration is not in equilibrium and, as a result, will contract. In order to compute the contracted equilibrium configuration, the junctions of the spring elements are treated as particles and their positions are evolved in time using the Molecular Dynamics package LAMMPS [34]. The mechanical support of the sample ends is implemented by excluding the junctions at both ends of the sample from time evolution, corresponding to fixed boundary conditions. The excess potential energy of the initial configuration is additionally dissipated using a linearly viscous background medium in which the particles move.
The structures shown in Figure 9A.2,B.2,C.2 are the converged equilibrium configurations resulting from this procedure. Apart from the chosen applied strain in the laser irradiated region, the choice of simulation parameters is arbitrary and will result in the same final structure as long as the simulation is numerically stable. To illustrate alignment effects, the squared cosine of the relative angle of each spring element with the horizontal axis are computed after the structure is relaxed, i.e., the warmer the colour, the more aligned the element with respect to the horizontal axis.
3.4.2. Macroscale Thermal–Mechanical Model
A coupled thermal–mechanical model is implemented in the finite element software ABAQUS (Dassault Systèmes, Vélizy-Villacoublay, France) to predict the macroscopic behavior of CNT films. Heat conduction and thermal stress are considered in the model. Fourier’s law is assumed to govern the heat conduction as follows:
where is the local heat flux density, the thermal conductivity, and the temperature gradient. Thermal stress is mechanical stress generated by any change in the temperature of CNT film.
where is the thermal expansion coefficient, the change of temperature, and the Young’s modulus of the material. The CNT film is treated as an anisotropic homogenized continuum in the finite element (FE) simulations. The material parameters used in the simulations are listed in the Table 3. CNT film density and thickness reported in Table 3 refer to the experimental values reported in [3]; for the macroscale model, density and thickness were kept constant to isolate the effect of anisotropy. Four-node plane stress elements (CPS4T in ABAQUS notation) of a 0.2 mm size are used in the computational analysis.
Table 3.
Material parameters for the finite element (FE) simulations.
4. Conclusions
According to our observations from experiments, microscopy, and computational methods, we propose the following as the process underlying the laser treatment and other photonic and thermal treatments. For CNT samples containing a large amount of metallic catalyst residue (>20%), the majority of metallic nanoparticles were not used for CNT growth but are incorporated into the network as large cluster impurities. These clusters catalyze the oxidation of CNT bundles during photonic or thermal processing but simultaneously consume the largest amount of thermal energy due to their own thermal mass. The nanoparticles melt and coarsen, moving towards the network surface and, once on the surface, move along the CNT bundles following the heat gradient. Defective or thermally unconnected CNTs burn, not being able to conduct away the heat received. The surviving network, being thus thinned out, gains more freedom of motion and aligns due to thermal contraction of the CNTs. Bundles align and increase in diameter; pores are squashed due to zipping relaxation directed by the strain direction, as far as the outside geometry and boundary conditions allow.
Whether the material shows a significant improvement of Raman G:D ratio or decomposes before depends on the composition of the material. In our case, “high H2”-spun material shows the extreme improvement in crystallinity as described in [10], whereas “low H2”-spun material decomposes driven by particle consumption, as there is less thermal mass to reduce the heat which is now taken up by the nanotubes and leads to their decomposition. At lower energies, however, this “low H2”-spun material shows after laser treatment the highest alignment ever observed in our group. Overall, photonic or thermal post-processing is a promising method to increase microstructure alignment and, to a degree, for sample purification.
Author Contributions
Conceptualization, T.S.G., J.S.B.; software and validation, W.T., P.A.K.; formal analysis, T.S.G., J.M., A.K., J.T., J.D.C., D.T., F.R.S.; investigation, T.S.G., J.S.B., A.K., J.T., J.M.; data curation, J.M., G.D., J.S.B., A.K.; writing—original draft preparation, T.S.G.; writing—review and editing, all authors; visualization, W.T., P.A.K., T.S.G.; supervision and funding acquisition, J.A.E. All authors have read and agreed to the published version of the manuscript.
Funding
J.A.E., T.S.G., and J.S.B. acknowledge funding from the Engineering and Physical Sciences Research Council (EPSRC) grant, “Instrumentation and Control of Carbon Nanotube Fibre Manufacture” reference number EP/M02086X/1. W.T. acknowledges financial support from the European Commission Graphene Flagship Core Project 3 (GrapheneCore3) under grant No. 881603. P.A.K. would like to gratefully acknowledge the Cambridge Commonwealth, European & International Trust and the Engineering and Physical Sciences Research Council (EPSRC) for funding to conduct this research under the auspices of the Centre for Doctoral Training in Computational Methods for Materials Science, EP/L015552/1.
Institutional Review Board Statement
Not applicable.
Informed Consent Statement
Not applicable.
Data Availability Statement
The data presented in this study are openly available in the University of Cambridge Apollo repository at https://doi.org/10.17863/CAM.65746.
Acknowledgments
The authors wish to thank Heraeus Holding GmbH, Cambridge, and in particular Martin Brown for allowing us to use their Noblelight setup for the large area white light flash experiments. D. Tune further wishes to acknowledge Benjamin Flavel, Institute of Nanotechnology at the Karlsruhe Institute of Technology, in whose group’s laboratory the CNT bundle individualization experiments were conducted.
Conflicts of Interest
The authors declare no conflict of interest.
Appendix A
Appendix A.1. Sample Showing Highest Alignment yet, with T2 = 0.77

Figure A1.
SEM images ((A), and higher magnification in (B)) of the highest uniaxial alignment observed in our tests so far showing a Chebyshev orientation parameter T2 = 0.77. The sample was a “low H2”-spun sample, with toluene as carbon precursor, after laser processing.
Figure A1.
SEM images ((A), and higher magnification in (B)) of the highest uniaxial alignment observed in our tests so far showing a Chebyshev orientation parameter T2 = 0.77. The sample was a “low H2”-spun sample, with toluene as carbon precursor, after laser processing.

Appendix A.2. Raman Analysis of As-Spun Material
Concluding from the presence and height of the RBM in Figure A2, “high H2”-spun material consists predominantly of SWCNTs. Note that the Raman spectra (Bruker Senterra, Ettlingen, Germany) shown here are averaged over 5 to 10 measurement positions on each sample. Therefore, the preserved intensity of the RBM depicts that CNTs of this diameter are present overall. “Low H2”-spun material shows only sporadic, less intense RBMs, if any, which represents a mixture of CNT types, but predominantly multi-walled, and a higher D-peak. Hence, based on the nature and defectiveness of the CNTs present, “low H2”-spun material would be more susceptible to attack.

Figure A2.
Averaged Raman spectra of “high H2”-spun (black) and “low H2”-spun material (grey), as-spun, as used for the laser processing shown in Figure 4. For more detailed characterization of these samples, please refer to [3].
Figure A2.
Averaged Raman spectra of “high H2”-spun (black) and “low H2”-spun material (grey), as-spun, as used for the laser processing shown in Figure 4. For more detailed characterization of these samples, please refer to [3].

Appendix A.3. TEM, EDX–Elemental Analysis of As-Spun Material
In Figure A3, we show elemental analysis by STEM EDX of a “low H2”-spun sample. A and B are the high-angle annular dark-field (HAADF) images corresponding to the TEM image (D) of two CNT bundles branching. Three large and two smaller ferrous catalyst particles not used for CNT growth are trapped in the branch and bridged by co-synthesized carbonaceous compounds. The elemental analysis shows carbon (C) as expected in the bundles and as onion shells around the catalyst particles, as well as in the polyaromatic coating. Oxygen is found inside the catalyst particles, but also appears strongly in the PAH coating (D), probably introduced by the acetone spray for condensation of the CNT film. Acetone links the as-prepared carbonaceous coating and produces a new compound (compare TGA in Figure 5). Silicon and aluminium (G, H) both stem from the reactor tube material, mullite, a combination of alumina and silica with a small amount of calcium. Interestingly, aluminium is mainly present inside the catalyst particles, while silicon apparently has affinity to the PAH coating.

Figure A3.
STEM high-angle annular dark-field (HAADF) images (A,B), and TEM image (E) of a CNT bundle branching with catalyst particles trapped in the branch. (C–H) show the elemental analysis of carbon (C), oxygen (D), iron (F), silicon (G), and aluminium (H).
Figure A3.
STEM high-angle annular dark-field (HAADF) images (A,B), and TEM image (E) of a CNT bundle branching with catalyst particles trapped in the branch. (C–H) show the elemental analysis of carbon (C), oxygen (D), iron (F), silicon (G), and aluminium (H).


Appendix A.4. Bundle Individualization for Length Measurements
The “low-” and “high H2”-spun samples were mixed with chlorosulphonic acid (CSA) (Merck KGaA, Darmstadt, BW, Germany) at 0.5 mg mL−1 to dissolve the material for processing. After several days of stirring, the “high H2”-spun material was only partially dissolved, with the appearance of dark fluffy agglomerates in clear, dark brown liquid. The “low H2”-spun material was not dissolved at all, with the appearance of black dense particles that rapidly sedimented in a clear, colourless liquid. Samples of both materials were heated to 400 °C in air for 1 h and dissolution in CSA was again attempted. In this case, the “high H2”-spun material could be dissolved at 1.33 mg mL−1 after brief (c.a. 20 s) bath sonication followed by 3 days stirring at 800 rpm (4 mg in 3 mL CSA in a 20 mL glass vial with a heavy elliptical stir bar), yielding a homogeneous bronze liquid. The “low H2”-spun material was again not dissolved and could only be effectively dissolved after a process consisting of stirring in conc. HCl (Merck KGaA, Darmstadt, BW, Germany) at 85 °C for three days, cooling to room temperature, diluting to 10% whilst stirring in an ice bath, filtering, refluxing for 24 h in 3 M HNO3 (Merck KGaA, Darmstadt, BW, Germany), filtering, washing with copious DI water, drying at 160 °C for 2 h, and then stirring in CSA at 1 mg mL−1 for 3 days after brief (c.a. 20 s) bath sonication, which finally yielded the expected homogeneous bronze liquid, although this liquid had a more black/grey shade than the “high H2”-spun material. Both samples were diluted 1:100 in CSA, spin coated in a N2 glovebox at 3000 rpm onto silicon substrates with 800 nm thermal oxide, then dried under N2 at 160 °C for 30 min before imaging.
The “low H2”-spun material was difficult to image with SEM (Zeiss, Oberkochen, BW, Germany) due to strong charging of the samples, even at a low accelerating voltage, indicating a high level of amorphous carbon impurities. This resulted in many image artifacts, such as those seen in Figure A6. However, successive scans of the electron beam cleaned off much of the impurities, after which the image quality improved and the artifacts were reduced. An alternative method to achieve high quality images was to spin the material onto samples with metallic grids–nanotubes that were electrically connected to the metallic grids could be easily observed without charging or other artifacts, in contrast to adjacent but electrically isolated nanotubes (Figure A5C).
The “high H2”-spun material was not difficult to image, and few artifacts were observed. Comparing the appearance of the high and “low H2”-spun material in Figure A5, clear differences were observed: while the “low H2”-spun material consisted predominantly of straight tubes with few bends, the “high H2”-spun material was much more “wavy”, with few really straight tubes observed. In both cases, a very wide distribution of tube/bundle lengths was observed, ranging from a few microns up to several tens of microns. However, it must be noted that shortening of the tubes/bundles during the dissolution process is likely, especially via oxidative cutting at defect sites, and this can be assumed to have skewed the distribution towards shorter lengths.

Figure A5.
SEM images of individualized bundles of “low H2”-spun (A,C) and “high H2”-spun (B,D) material. The inset in (A) shows the insufficient individualization and remaining bundle wads. Scale bar refers to 20 µm. (C) shows “low H2”-spun material spin coated onto substrates with metallic grids visible at the top right corner of the image, clearly showing contrast between electrically “grounded” (to nearby metallic electrodes) nanotubes (bright white) and electrically isolated nanotubes (grey, with imaging artifacts).


Figure A6.
Sequence of SEM images showing the disappearance of loop-like artifacts with successive scans of the beam, from from single scan to four scans (A–D).
Figure A6.
Sequence of SEM images showing the disappearance of loop-like artifacts with successive scans of the beam, from from single scan to four scans (A–D).

Appendix A.5. SEM, EDX–Elemental Analysis of Laser Treated CNT Films
The catalyst particles sweating out from “low H2”- and “high H2”-spun material differ not only in their ability to decompose CNT bundles, but also in their shape and composition (Figure A7). The particles in Figure A7A could be described as boulders or lumps, neither spherical, nor with clear crystal lattices. For “high H2”-spun material (B–D), we observe two kinds of particles sweating out: (1) a majority of particles that appear evidently molten and smooth, and at least nearly spherical (B) and (2) a small number of particles that show distinct crystalline faceting (C–D).

Figure A7.
SEM images of particles shaped by laser treatment of (A) “low H2”-spun material, and (B–D) “high H2”-spun material. In the latter, particles are in majority smooth (B), but sometimes show clear crystalline faceting as in (C,D).
Figure A7.
SEM images of particles shaped by laser treatment of (A) “low H2”-spun material, and (B–D) “high H2”-spun material. In the latter, particles are in majority smooth (B), but sometimes show clear crystalline faceting as in (C,D).

In Table A1 we show the atomic percentage corresponding to the magenta marked boxes in Figure A7. Note however, that the spectrum is influenced by a wider interaction volume and is dominated by the carbon nanotubes, probably oxidized, surrounding and supporting the particle. The typical atomic ratio of particles forming out of “low H2”-spun material is Fe:O:C = 1:5:9 (Figure A7A). This second class of distinctly faceted particles in “high H2”-spun material shows the same composition as for “low H2”-spun material, while for the spherical particles, the relative content of oxygen and carbon is significantly higher with Fe:O:C = 1:20:15.
In general, the low content of Fe shows that the measured values are influenced by a far larger interaction volume than only the selection chosen and are dominated by the surrounding CNTs network. Additionally, we observed a distinct difference in that Ca appears at a low percentage in those spherical particles (3–5 at%).
Table A1.
Elemental analysis of the sections marked magenta in Figure A7.
Table A1.
Elemental analysis of the sections marked magenta in Figure A7.
| Atom % | Low H2 Spun, Boulders | High H2 Spun, Faceted Particles | High H2 Spun, Spherical Particles |
|---|---|---|---|
| C K | 59.8 | 61.1 | 40.3 |
| O K | 30.6 | 31.6 | 52.2 |
| Fe K | 6.3 | 7.3 | 2.7 |
| Ca K | 0.1 | - | 3.5 |
| Al K | 1.4 | - | 0.7 |
| Traces of Sample holder (Cu and/or Au) | 1.8 | - | 0.6 |
Appendix A.6. TEM–Elemental Analysis of Laser Treated CNT Films

Figure A8.
STEM-HAADF images of a “high H2”-spun material (A,B), each with marked positions of (B) and where the EDX spectrum (C) is taken, respectively.
Figure A8.
STEM-HAADF images of a “high H2”-spun material (A,B), each with marked positions of (B) and where the EDX spectrum (C) is taken, respectively.

Appendix A.7. Annular Ring or Hole Formation for Single Spot Laser Treatment of Wide Samples

Figure A9.
Single spot laser treatment of samples wider than the laser spot diameter leads for (A) “high H2”-spun material to the formation of a transparent annular ring with an opaque centre and for (B) “low H2”-spun material to formation of a hole, where the centre is either transparent or largely burnt away.

Appendix A.8. Comparison of Commercial Camera Flashing and Industrial Flashing
Figure A10 shows a “low H2”-spun sample, spun from n-butanol, thiophene, and ferrocene as-spun (A–C), after camera flashing (D–F) and after industrial white flash treatment (G–I). Note that for better visibility of the particles, G–I are shown in lower magnification than A–C and D–F, respectively.

Figure A10.
SEM images of (A–C) as-spun material—”low H2”-spun from n-butanol as carbon precursor, (D–F) treated with a commercial camera flash, (G–I) treated with an industrial white light flash.
Figure A10.
SEM images of (A–C) as-spun material—”low H2”-spun from n-butanol as carbon precursor, (D–F) treated with a commercial camera flash, (G–I) treated with an industrial white light flash.

Appendix A.9. Joule Heating—Raman G:D Ratio Improvement around the Fracture Zone

Figure A11.
(A) Raman G:D map overlayed over the optical microscopy image (B) of a CNT fibre after failure induced by Joule heating. Here, too, the G:D ratio seems to increase close to the failure point. This suggests graphitization due to annealing. Of course, Joule heating is a destructive process, hence all G:D ratios are significantly lower.

Appendix A.10. Joule Heating—Folding in Particles for Fibres Spun from Benzyl Alcohol

Figure A12.
For benzyl alcohol, some of the large, sweated particles show an anomaly as they collapse and fold in on themselves after sweating. The tip, same as shown in Figure 11, is clean of any particles, but shows small flake residues.
Figure A12.
For benzyl alcohol, some of the large, sweated particles show an anomaly as they collapse and fold in on themselves after sweating. The tip, same as shown in Figure 11, is clean of any particles, but shows small flake residues.

References
- DeVolder, M.F.L.; Tawfick, S.H.; Baughman, R.H.; Hart, A.J. Carbon Nanotubes: Present and Future Commercial Applications. Science 2013, 339, 535–539. [Google Scholar] [CrossRef]
- Bulmer, J.; Kaniyoor, A.; Gspann, T.; Mizen, J.; Ryley, J.; Kiley, P.; Ratering, G.; Sparreboom, W.; Bauhuis, G.; Stehr, T.; et al. Forecasting continuous carbon nanotube production in the floating catalyst environment. Chem. Eng. J. 2020, 390, 124497. [Google Scholar] [CrossRef]
- Gspann, T.S.; Juckes, S.M.; Niven, J.F.; Johnson, M.B.; Elliott, J.A.; White, M.A.; Windle, A.H. High thermal conductivities of carbon nanotube films and micro-fibres and their dependence on morphology. Carbon 2017, 114, 160–168. [Google Scholar] [CrossRef]
- Stallard, J.; Tan, W.; Smail, F.; Gspann, T.; Boies, A.; Fleck, N. The mechanical and electrical properties of direct-spun carbon nanotube mats. Extrem. Mech. Lett. 2018, 21, 65–75. [Google Scholar] [CrossRef]
- Hone, J.; Llaguno, M.; Nemes, N.; Johnson, A.; Fischer, J.; Walters, D.; Casavant, M.; Schmidt, J.; Smalley, R. Electrical and thermal transport properties of magnetically aligned single wall carbon nanotube films. Appl. Phys. Lett. 2000, 77, 666–668. [Google Scholar] [CrossRef]
- Badaire, S.; Pichot, V.; Zakri, C.; Poulin, P.; Launois, P.; Vavro, J.; Guthy, C.; Chen, M.; Fischer, J.E. Correlation of properties with preferred orientation in coagulated and stretch-aligned single-wall carbon nanotubes. J. Appl. Phys. 2004, 96, 7509–7513. [Google Scholar] [CrossRef]
- Bulmer, J.S.; Mizen, J.E.; Gspann, T.S.; Kaniyoor, A.; Ryley, J.B.; Kiley, P.J.; Sparkes, M.R.; O’Neill, B.; Elliott, J.A. Extreme stretching of high G:D ratio carbon nanotube fibers using super-acid. Carbon 2019, 153, 725–736. [Google Scholar] [CrossRef]
- Koziol, K.; Vilatela, J.; Moisala, A.; Motta, M.; Cunniff, P. High-Performance Carbon Nanotube Fiber. Science 2007, 318, 1892. [Google Scholar] [CrossRef] [PubMed]
- Tran, C.D.; Humphries, W.; Smith, S.M.; Huynh, C.; Lucas, S. Improving the tensile strength of carbon nanotube spun yarns using a modified spinning process. Carbon 2009, 47, 2662–2670. [Google Scholar] [CrossRef]
- Bulmer, J.; Gspann, T.; Orozco, F.; Sparkes, M.; Koerner, H.; Bernardo, A.D.; Niemiec, A.; Robinson, J.; Koziol, K.; Elliott, J.; et al. Photonic Sorting of Aligned, Crystalline Carbon Nanotube Textiles. Sci. Rep. 2017, 7, 12977. [Google Scholar] [CrossRef]
- Liu, D.; Liu, Y.; Liu, G. Effects of carbon nanotubes additions on flash ignition characteristics of Fe and Al nanoparticles. Fuller. Nanotub. Carbon Nanostruct. 2018, 26, 168–174. [Google Scholar] [CrossRef]
- Ajayan, P.M.; Terrones, M.; de la Guardia, A.; Huc, V.; Grobert, N.; Wei, B.Q.; Lezec, H.; Ramanath, G.; Ebbesen, T.W. Nanotubes in a Flash—Ignition and Reconstruction. Science 2002, 296, 705. [Google Scholar] [CrossRef]
- Braidy, N.; Botton, G.A.; Adronov, A. Oxidation of Fe Nanoparticles Embedded in Single-Walled Carbon Nanotubes by Exposure to a Bright Flash of White Light. Nano Lett. 2002, 2, 1277–1280. [Google Scholar] [CrossRef]
- Kumar, M.; Rawat, N.; Santhanam, K. Effect of nanostructure on the thermal oxidation of atomized iron. In MRS Online Proceedings Library Archive; 0899-N07-01; Volume 899: Symposium N—Dynamics in Small Confining Systems VIII; Cambridge University Press: Cambridge, UK, 2005. [Google Scholar]
- Tseng, S.H.; Tai, N.H.; Hsu, W.K.; Chen, L.J.; Wang, J.H.; Chiu, C.C.; Lee, C.Y.; Chou, L.J.; Leou, K.C. Ignition of carbon nanotubes using a photoflash. Carbon 2007, 45, 958–964. [Google Scholar] [CrossRef]
- Carlucci, P.; Visconti, P.; Primiceri, P.; Strafella, L.; Ficarella, A.; Laforgia, D. Photo-Induced Ignition of Different Gaseous Fuels Using Carbon Nanotubes Mixed with Metal Nanoparticles as Ignitor Agents. Combust. Sci. Technol. 2017, 189, 937–953. [Google Scholar] [CrossRef]
- Visconti, P.; Primiceri, P.; Longo, D.; Strafella, L.; Carlucci, P.; Lomascolo, M.; Cretì, A.; Mele, G. Photo-ignition process of multiwall carbon nanotubes and ferrocene by continuous wave Xe lamp illumination. Beilstein J. Nanotechnol. 2017, 8, 134–144. [Google Scholar] [CrossRef]
- Kwon, Y.-K.; Berber, S.; Tomanek, D. Thermal Contraction of Carbon Fullerenes and Nanotubes. Phys. Rev. Lett. 2004, 92, 015901. [Google Scholar] [CrossRef] [PubMed]
- Tan, W.; Stallard, J.; Smail, F.; Boies, A.; Fleck, N. The mechanical and electrical properties of direct-spun carbon nanotube mat-epoxy composites. Carbon 2019, 150, 489–504. [Google Scholar] [CrossRef]
- Heo, Y.J.; Yun, C.H.; Kim, W.N.; Lee, H.S. The effect of mesoscopic shape on thermal properties of multi-walled carbon nanotube mats. Curr. Appl. Phys. 2011, 11, 1144–1148. [Google Scholar] [CrossRef]
- Ma, Y.J.; Yao, X.F.; Zheng, Q.S.; Yin, Y.J.; Jiang, D.J.; Xu, G.H.; Wei, F.; Zhang, Q. Carbon nanotube films change Poisson’s ratios from negative to positive. Appl. Phys. Lett. 2010, 97, 061909. [Google Scholar] [CrossRef]
- Li, Y.-L.; Kinloch, I.; Windle, A. Direct spinning of carbon nanotube fibers from chemical vapor deposition synthesis. Science 2004, 304, 276–278. [Google Scholar] [CrossRef] [PubMed]
- Gspann, T.S.; Smail, F.R.; Windle, A.H. Spinning of carbon nanotube fibres using the floating catalyst high temperature route: Purity issues and the critical role of sulphur. Faraday Discuss. 2014, 173, 47–65. [Google Scholar] [CrossRef]
- Kaniyoor, J.; Bulmer, T.; Gspann, J.; Mizen, J.; Ryley, P.; Kiley, J.; Terrones, C.; Miranda-Reyes, G.; Divitini, M.; Sparkes, B.; et al. High throughput production of single-wall carbon nanotube fibres independent of sulfur-source. Nanoscale 2019, 11, 18483–18495. [Google Scholar] [CrossRef]
- Feng, X.; Chee, S.W.; Sharma, R.; Xie, K.L.X.; Li, Q.; Fan, S.; Jiang, K. In Situ TEM Observation of the Gasification and Growth of Carbon Nanotubes Using Iron Catalysts. Nano Res. 2011, 4, 767–779. [Google Scholar] [CrossRef]
- Thiagarajan, V.; Wang, X.; Bradford, P.; Zhu, Y.; Yuan, F. Stabilizing carbon nanotube yarns using chemical vapor infiltration. Compos. Sci. Technol. 2014, 90, 82–87. [Google Scholar] [CrossRef]
- Kaniyoor, A.; Gspann, T.; Elliott, J. Bundle Alignment in Carbon Nanotube Yarns and 2D anisotropic systems. J. Appl. Polym. Sci. 2021. submitted. [Google Scholar]
- Mikhalchan, A.; Gspann, T.; Windle, A. Aligned carbon nanotube–epoxy composites: The effect of nanotube organization on strength, stiffness, and toughness. J. Mater. Sci. 2016, 51, 10005–10025. [Google Scholar] [CrossRef]
- Cranford, S.; Yao, H.; Ortiz, C.; Buehler, M.J. A single degree of freedom “lollipop” model for carbon nanotube bundle formation. J. Mech. Phys. Solids 2010, 58, 409–427. [Google Scholar] [CrossRef]
- Wang, Y.; Xu, H.; Drozdov, G.; Dumitrica, T. Mesoscopic friction and network morphology control the mechanics and processing of carbon nanotube yarns. Carbon 2018, 139, 94–104. [Google Scholar] [CrossRef]
- Li, S.; Park, J.G.; Liang, Z.; Siegrist, T.; Liu, T.; Zhang, M.; Cheng, Q.; Wang, B.; Zhang, C. In situ characterization of structural changes and the fraction of aligned carbon nanotube networks produced by stretching. Carbon 2012, 50, 3859–3867. [Google Scholar] [CrossRef]
- Volkov, N.; Zhigilei, L.V. Mesoscopic Interaction Potential for Carbon Nanotubes of Arbitrary Length and Orientation. J. Phys. Chem. C 2010, 114, 5513–5531. [Google Scholar] [CrossRef]
- Ostanin, I.; Ballarini, R.; Dumitricə, T. Distinct element method for multiscale modeling of cross-linked carbon nanotube bundles: From soft to strong nanomaterials. J. Mater. Res. 2014, 30, 19–25. [Google Scholar] [CrossRef]
- Plimpton, S. Fast Parallel Algorithms for Short-Range Molecular Dynamics. J. Comput. Phys. 1995, 117, 1–19. [Google Scholar] [CrossRef]
- Shirasu, K.; Yamamoto, G.; Tamaki, I.; Ogasawara, T.; Shimamura, Y.; Inoue, Y.; Hashida, T. Negative axial thermal expansion coefficient of carbon nanotubes: Experimental determination based on measurements of coefficient of thermal expansion for aligned carbon nanotube reinforced epoxy composites. Carbon 2015, 95, 904–909. [Google Scholar] [CrossRef]


Publisher’s Note: MDPI stays neutral with regard to jurisdictional claims in published maps and institutional affiliations. |
© 2021 by the authors. Licensee MDPI, Basel, Switzerland. This article is an open access article distributed under the terms and conditions of the Creative Commons Attribution (CC BY) license (http://creativecommons.org/licenses/by/4.0/).