Article

In Situ TEM Study of Rh Particle Sintering for Three-Way Catalysts in High Temperatures

1
N.E. CHEMCAT Corporation, Numazu 410-0314, Japan
2
Department of Applied Physics, Tohoku University, Sendai 980-8579, Japan
3
National Institute for Materials Science, Tsukuba 305-0044, Japan
4
Graduate School of Science and Technology, Saitama University, Shimo-Okubo 338-8570, Japan
*
Author to whom correspondence should be addressed.
Catalysts 2021, 11(1), 19; https://doi.org/10.3390/catal11010019
Submission received: 4 December 2020 / Revised: 19 December 2020 / Accepted: 21 December 2020 / Published: 26 December 2020
(This article belongs to the Section Environmental Catalysis)

Abstract

:
One of the main factors in the deterioration of automobile three-way catalysts is the sintering of platinum group metals (PGMs). In this study, we used in situ tunneling electron microscopy (TEM) to examine the sintering of Rh particles as the temperature increases. Two types of environmental conditions were tested, namely, vacuum atmosphere with heating up to 1050 °C, and N2 with/without 1% O2 at 1 atm and up to 1000 °C. Under vacuum, Rh particles appeared to be immersed in ZrO2. In contrast, at 1 atm N2 with or without 1% O2, the sintered Rh particles appeared spherical and not immersed in ZrO2. The latter trend of Rh sintering resembles the actual engine-aged catalyst observed ex situ in this study. In the N2 atmosphere, the sintering of support material (ZrO2 or Y-ZrO2) was first observed by in situ TEM, followed by Rh particle sintering. The Rh particle size was slightly smaller on Y-ZrO2 compared to that on ZrO2. To better understand these experimental results, density functional theory was used to calculate the systems’ junction energies, assuming three layers of Rh(111) 4 × 4 structures joined to the support material (ZrO2 and Y-ZrO2). The calculated energies were consistent with the in situ TEM observations in the N2 atmosphere.

Graphical Abstract

1. Introduction

Platinum group metals (PGMs) such as Pt, Pd, and Rh are commonly used as active sites in catalytic after-treatment applications in automobiles, especially the three-way catalyst (TWC) for gasoline engines. Such PGMs are dispersed on Al2O3 and/or CZ (ceria–zirconia, a solid solution or composite of CeO2 and ZrO2). The PGM species and support material are optimized to maximize the degradation of hydrocarbons (HCs), CO, and NOx. To meet the regulations in each region [1], it is crucial to stabilize the dispersion of PGMs, which determines the active site density in the catalyst. To maintain highly dispersed PGMs after aging or the required life usage of the catalyst, many studies have focused on understanding the mechanism of PGM sintering and suppressing such behavior. One approach toward hindering PGM particle sintering is strengthening the interaction between the particles and the support material. For example, Pt sintering could be suppressed by loading Pt particles onto CeO2 [2] or MgO [3]. Pd sintering was suppressed by loading Pd onto CeO2 [4] or YSZ (Y-doped ZrO2) [5]. Rh sintering was also suppressed by loading Rh onto Nd-doped La-ZrO2 [6]. Another approach is the creation of a physical matrix around the PGM particles, such as the use of Al2O3 material against Pt sintering [7] and Al2O3 nanorod material [8] against Rh sintering. Regarding the PGM sintering mechanism, both macro- and micro-scale theories have been reported. Suzuki et al. developed multiscale theoretical methods for predicting the sintering behavior of Pt on various catalyst supports [9]. On the microscale, density functional theory (DFT) calculations are commonly applied, and reported examples include Pt, Pd, and Rh particles on CeO2, ZrO2, and CZ [10,11]. In these calculations, the PGM-support interaction energy is estimated and used to discuss the PGM sintering.
Experimentally, the PGM sintering behavior could be analyzed by in situ tunneling electron microscopy (TEM) observations. Simonsen et al. reported Pt sintering in Pt/SiO2 using information obtained by in situ TEM. They analyzed the sintering during exposure to 10 mbar air at 650 °C [12]. Two other research groups used such a technique on systems other than automotive catalysts: DeLaRiva et al. reported Ni sintering in Ni/MgAl2O4 at 750 °C [13], and Fujita et al. reported microstructure changes of nanoporous Ni–Co catalyst during gas reaction [14]. Experimental studies on the sintering of nanoparticles by means of in situ TEM were listed in the study by Fujita et al. [13]. However, in situ studies of sintered PGM nanoparticles are limited to Pt/CeO2 [15], Pt/Al2O3, and Pt/SiO2 [16]. Recent high-resolution TEM (HRTEM) studies using combinations of Rh nanoparticles and various support materials provided ex situ observations [17]. An in situ TEM observation of the Rh deposition behavior of Rh/CaTiO3 catalysts under varying oxidizing and reducing atmospheres at 250–700 °C has been reported [18]. The study directly supported the design concept of the Rh/CaTiO3 catalyst. In situ observations of PGM sintering would provide important information for inhibiting the aforementioned behavior and improving catalyst durability.
Rh is a PGM commonly used in TWCs because it is more active and durable than Pd and Pt [19]. Therefore, it is important to analyze the details of Rh sintering in the development of TWC. As aforementioned, many studies on PGM sintering have been reported. However, the degree of PGM sintering was mainly quantified by postmortem analysis, and a detailed analysis of the PGM particle and support material interface has not been conducted. In addition, Rh maintains a small particle size after aging, making it difficult to observe the Rh particle growth in real time. In addition, the high temperature (900–1100 °C) of the TWCs’ durability conditions makes it difficult to observe the Rh sintering behavior in situ. Given this background, the real-time observation and characterization of Rh sintering behavior in this study is expected to provide meaningful information for the development of TWCs.
To observe the real-time sintering of Rh in TWC, experiments were performed, focusing on high-temperature measurements, the measurement atmosphere, and various supports for Rh particles. We applied in situ TEM equipment to Rh/oxide support systems in two types of environments. One was a vacuum atmosphere, with heating up to 1050 °C for Rh/ZrO2, Rh/Y-ZrO2, Rh/CeO2, and Rh/Al2O3. The other was 1 atm N2 gas with or without 1% O2, and the temperature was increased up to 1000 °C for Rh/ZrO2 and Rh/Y-ZrO2 (Supplementary Materials). These observations were compared with the Rh sintered state of TWC after engine aging, and the validity of the in situ observations was discussed. In addition, the mechanism of different Rh sintering behaviors according to the in situ conditions was studied theoretically, in terms of the affinity of Rh and the support material. The binding energy of Rh and each support material was calculated by the DFT technique. The details of Rh sintering were analyzed based on the in situ TEM observations and DFT calculations.

2. Results and Discussion

2.1. Postmortem Analysis of Engine-Aged Catalyst by Ex Situ TEM Observations

To determine the status of Rh in a used automobile catalyst (TWC), ex situ scanning TEM (STEM) observation was performed on an engine-aged catalyst sample. After aging by the engine, catalyst powder was sampled from the catalyst layer coated on the honeycomb substrate. The STEM image and energy-dispersive spectrometry (EDS) mapping results of Rh are shown in Figure 1. Additional EDS mapping (not shown here) indicated that the support material in the STEM image (Figure 1a) was CeO2 and ZrO2. The two white spots can be identified as Rh based on the EDS result (Figure 1b). The average Rh particle size was approximately 16 nm. The Rh after engine aging was considered to be sintered because it appeared as two spherical particles deposited on the oxide material. These findings were compared to the in situ STEM observations.

2.2. In Situ TEM Observations

The TEM observation results and EDS mapping of Rh under vacuum conditions are shown in Figure 2, Figure 3, Figure 4 and Figure 5 for Rh/ZrO2, Rh/Y-ZrO2, Rh/CeO2, and Rh/Al2O3, respectively. In Figure 2 (Rh/ZrO2), changes in the morphology of ZrO2 and the sintering of oxide were observed at 900 °C. At 950 °C, remarkable Rh particle sintering was observed; however, the STEM image was not sufficiently clear to separate the Rh and oxide parts. Rather, EDS mapping information was required to identify the Rh. In addition, the Rh appeared to be immersed in ZrO2 rather than as spherical particles on the oxide. This phenomenon is discussed later in this paper. At 950 °C and above, the sintering of oxide became more severe. As shown in Figure 3 (Rh/Y-ZrO2), the morphology of Y-ZrO2 began to change, and oxide sintering was observed at 1000 °C. At 1050 °C, remarkable Rh particle sintering was also observed. Compared to Rh/ZrO2, Y-ZrO2 exhibited significantly more optimized resistance against oxide sintering, possibly because of the stabilizing effect of Y-doping on ZrO2. Figure 4 (Rh/CeO2) shows that the morphology of CeO2 began to change and oxide sintering was observed at 900 °C; remarkable Rh particle sintering was observed at 1050 °C. As shown in Figure 5 (Rh/Al2O3), the morphology of Al2O3 began to change and oxide and Rh particle sintering were observed at 1000 °C. Table 1 provides a summary of the sintering behavior of Rh and oxide for different material combinations.
TEM observation results and EDS mapping of Rh in Rh/ZrO2 under flowing gas at 1 atm (N2 or 1% O2 with balance N2) at various temperatures are shown in Figure 6. The morphology of ZrO2 began to change and oxide sintering was observed at 900 °C (N2 gas flow). At 950 °C, remarkable Rh particle sintering was observed, and the morphology of Rh particles was very different from that under the vacuum conditions (Figure 2). In this study, the Rh particle appeared spherical and was deposited on ZrO2. At 1000 °C in 1% O2 (balance N2) gas flow, the ZrO2 material was severely sintered, and even the grain boundary of the crystal could not be seen.

2.3. Effects of Rh–ZrO2 Interaction on the In Situ Sintering Behavior

As can be seen in Figure 2 and Figure 6, the in situ status of the Rh particles on Rh/ZrO2 clearly depends on the atmosphere (vacuum or gas flow, respectively). After heating in vacuum, the Rh particle was not clearly visible and appeared to be immersed in ZrO2, whereas the Rh particle heated in gas flow appeared spherical and deposited on ZrO2. One possible explanation for this is the oxygen partial pressure. In Figure 3, because of the very low oxygen partial pressure at high temperatures, the electron beam irradiated during the STEM and EDS measurements may have reduced the ZrO2. While a quantitative discussion may be difficult, the electron irradiation of EDS is 90 times higher than that of STEM. Because frequent EDS measurements were performed under the vacuum conditions in addition to the STEM observations in Figure 2, a certain portion of ZrO2 may have been reduced, and the affinity between Rh and ZrO2 increased.
Next, the reduction of Rh2O3 to Rh in various gas conditions was examined by Differential thermal analysis–thermogravimetry (DTA-TG). As seen in Figure 7, Rh2O3 reduction was observed at 200 °C in H2, 800 °C in N2, and 1050 °C in 1% O2 (N2 balance). The amounts of weight loss in the high-temperature region in pure N2 and 1% O2 (N2 balance) were consistent with the amount of Rh reduction from Rh2O3. Thus, the reduction of Rh2O3 to Rh was considered to occur on ZrO2. This result also suggested that Rh on ZrO2 existed as Rh2O3 after the pre-oxidation treatment. However, the weight loss in the H2 atmosphere exceeded the reduction amount of Rh. It has also been reported that Rh2O3 on ZrO2 is reduced at low temperatures in an H2 atmosphere [6]. Therefore, the weight loss above 300 °C was attributed to the reduction of a part of the ZrO2. In this study, the H2 environment used for measurement was considered to have a very low oxygen partial pressure, similar to that under the vacuum conditions. From these results, the vacuum and high-temperature conditions (e.g., >900 °C) for the in situ TEM observation were considered sufficient for reducing both Rh oxide and ZrO2. Then, the interaction between Rh and ZrO2 became sufficiently strong to generate a partial solid solution. Nonetheless, a certain amount of oxygen was present on the sample in the N2 environment, even without the 1% O2. In these environments, at least the ZrO2 is not severely reduced, resulting in less mutual affinity between Rh and ZrO2.
Compared to the ex situ STEM observations for the actual aged catalyst (Figure 1), the in situ observations in vacuum (Figure 2) varied slightly, while those in N2 or 1% O2 (balance N2) (Figure 6) exhibited greater similarity. This result shows that the gas cell is effective in the observation of real conditions, and the beam effects should be eliminated in in situ TEM studies for catalytic analysis [20].

2.4. In Situ TEM Observation in N2 and O2 Atmospheres

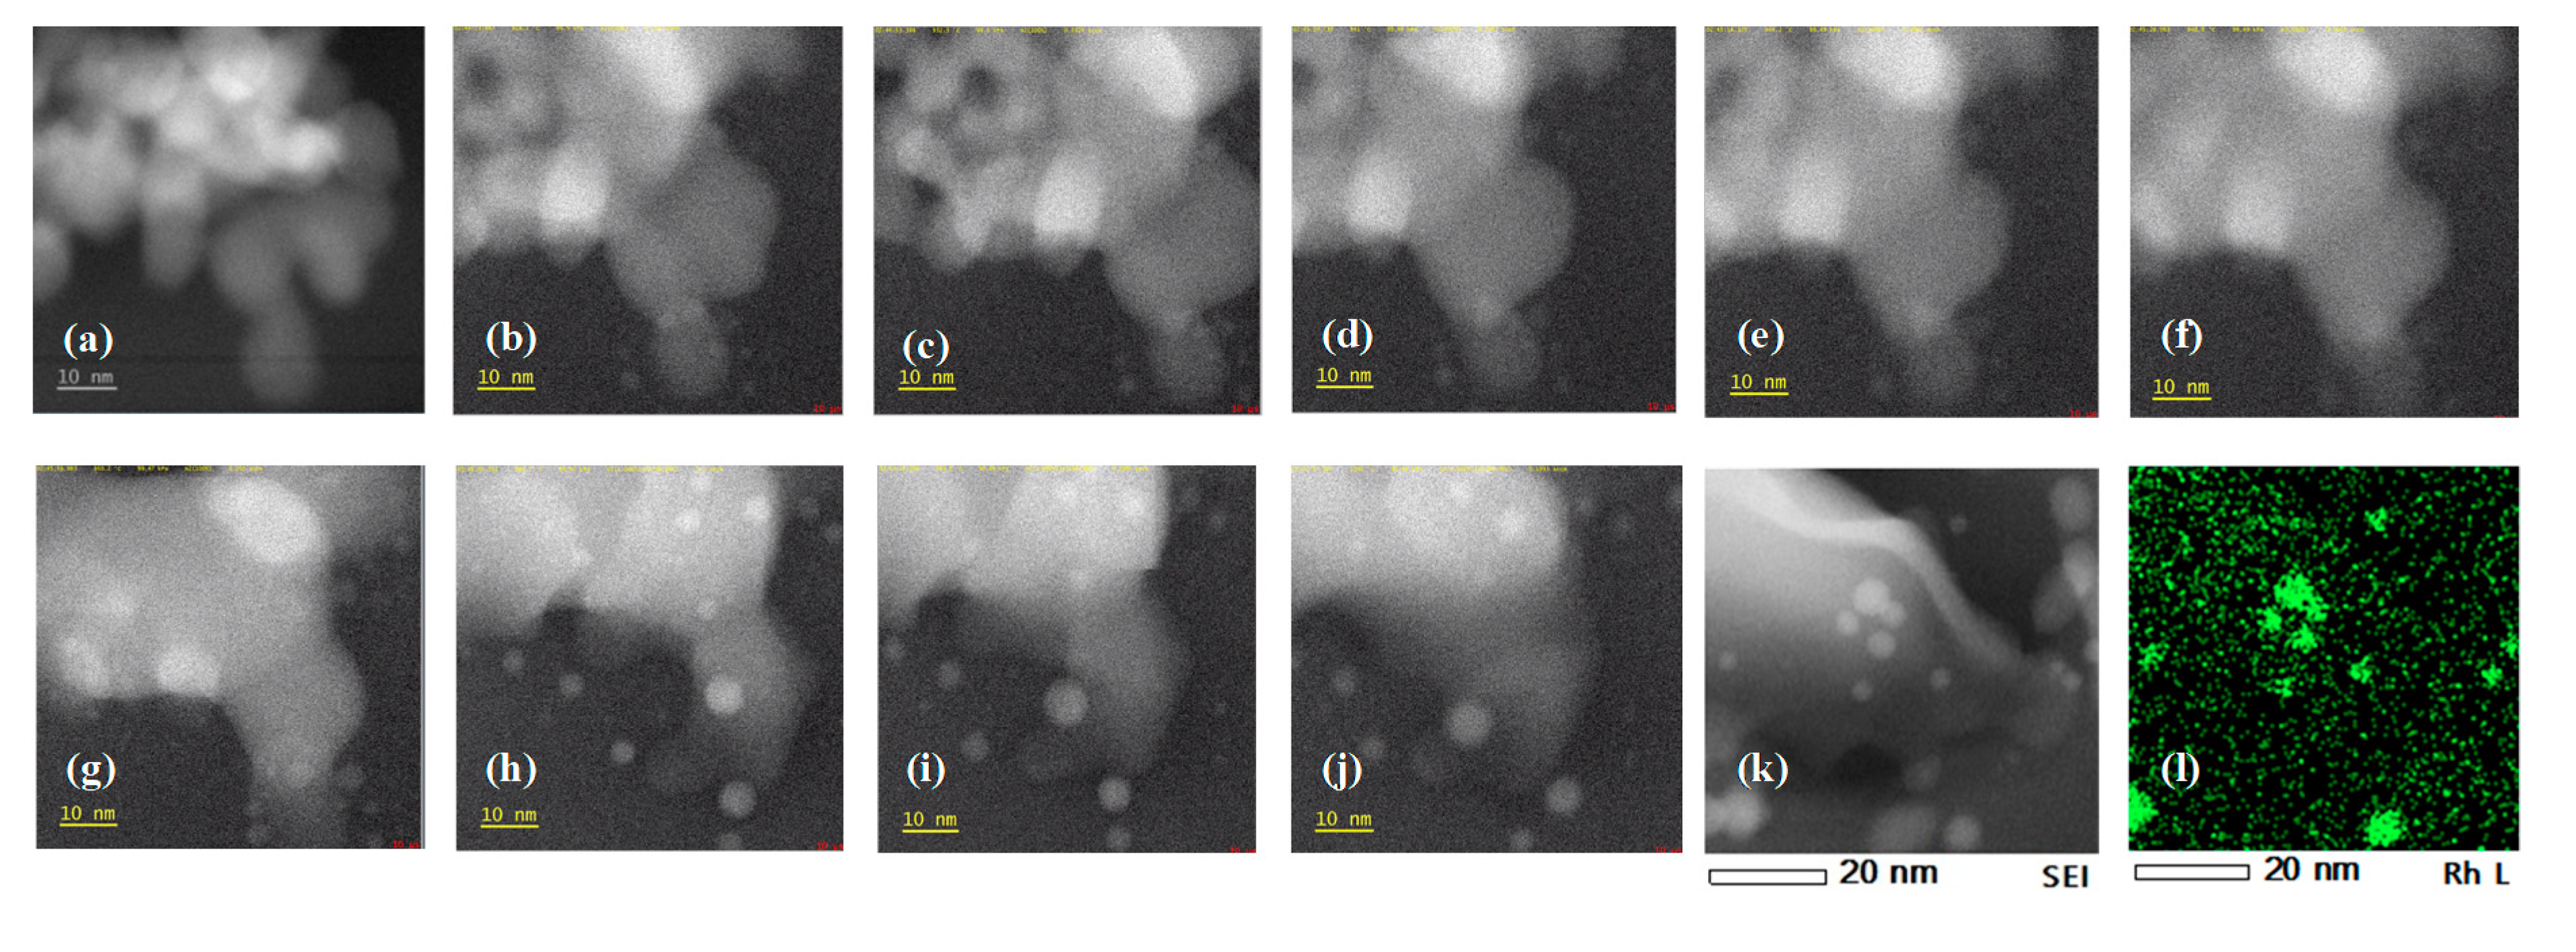
Sets of in situ TEM images in N2 and O2 atmospheres are shown in Figure 8 for Rh/ZrO2 and Figure 9 for Rh/Y-ZrO2. In addition, the Rh particle size measured in each in situ TEM observation is shown in Figure 10. The Rh particle sizes were obtained using the TEM images from 940 to 950 °C in the N2 atmosphere, wherein the samples were assumed to be in the Rh/ZrO2 state. For the Rh particles, the circle equivalent diameter was calculated by adjusting the threshold value of the mode method for the target Rh particles, as shown in Figure 10. In the case of Rh/ZrO2, aggregation of ZrO2 began at 918.1 °C, and Rh particles began to precipitate. At higher temperatures, ZrO2 aggregation and Rh particle growth were observed. After reaching 950 °C, the switch to O2 atmosphere promoted Rh particle growth, as many Rh particles were observed. In the case of Rh/Y-ZrO2, no remarkable aggregation of Y-ZrO2 was observed between 900 and 950 °C; however, particles that were thought to be Rh were observed from 934.2 °C onwards. After reaching 950 °C, switching to the O2 atmosphere promoted ZrO2 aggregation and Rh particle growth, as many Rh particles were observed. The observed Rh particle shape was different from the in situ TEM measurement result in vacuum and resembled that in the engine-aged actual catalyst. As mentioned earlier, the observation of Rh particles by STEM was probably because the support material was not reduced and the Rh/oxide state was maintained during the in situ measurement. Overall, sintering of the support material (ZrO2 and Y-ZrO2) began first, followed by Rh particle sintering. A smaller Rh particle size was observed for Rh/Y-ZrO2 compared to Rh/ZrO2, as detailed in Figure 10.

2.5. DFT Calculation Results

DFT calculations were carried out with two purposes. The first was to examine the electronic state of a system of Rh particles embedded in the given supports, as shown in the STEM image in vacuum. The second purpose was to correlate the effect of different supports on the sintering behavior with the theoretical binding energies.
As mentioned earlier, the STEM images in vacuum showed Rh particles embedded in the ZrO2 support (Figure 2d,e). This embedding may be attributed to the reduction of the support by the electron beam under vacuum and high-temperature conditions. We further examined the stability of this state of Rh particles embedded in a reduced ZrO2 support using DFT calculations. We adopted the (111) surface of cubic ZrO2 as the simplest model on which Rh particles were supported. First, a Rh12 cluster was placed on a flat Zr-terminated surface, which is a simple model of a strongly reduced state. However, our energy and structural relaxation calculations failed to identify a stable adsorption state, suggesting that the Rh clusters do not adsorb stably on this surface. Next, we studied the adsorption of a Rh cluster on a depressed ZrO2 surface, which was created by removing four Zr ions from the top surface, as shown in Figure 11. The slab of the support was constructed by stacking five layers of ZrO2 with a 3 × 3 structure on the (111) surface of cubic ZrO2. Three layers of atoms from the surface of the slab and the Rh12 cluster were structurally relaxed, while the atom positions of the remaining two layers of the slab were fixed at the position of the bulk crystal. The vacuum layer was set to exceed 15 Å. The energy and structural relaxation calculations showed that the Rh12 cluster was strongly bound to the ZrO2 surface (Figure 12). Some Rh atoms were located in surface depressions, and the Rh cluster embedded in the surface became a stable structure. This result is consistent with the STEM images obtained in vacuum. The binding energy between the Rh12 cluster and the ZrO2 slab was −15.3 eV. This binding energy was defined by subtracting the energies of the two isolated subsystems of the Rh12 cluster and ZrO2 slab (with the structures shown in Figure 12) from the total energy of the system. Because a total of six Rh ions are bound to the support, the binding energy per bond is −2.6 eV. This binding is stronger than that of the system with a Rh12 cluster adsorbed on a flat oxygen-terminated surface. The latter structure is shown in Figure 13, wherein the settings of the vacuum layer and atoms being relaxed were the same as those for determining the structure in Figure 12. The Rh cluster is bound to the oxygen ion at the top surface through six bonds, and the binding energy per bond in this system is −1.5 eV.
A more strongly bound system (i.e., the one with Rh clusters embedded in a surface depression) is expected to display strong metal–support interaction (SMSI) effects. Figure 14 shows the differential electron density distributions for the two systems of Rh clusters embedded in the depressed Zr-terminated surface and adsorbed on the flat oxygen-terminated surface. The differential electron density is given as Δρ = ρ(Rh12/support)-ρ(Rh12)-ρ(support), where ρ(material) is the electron number density of the given isolated material. Δρ represents the change in the number of electrons due to binding of the Rh cluster to the support. Rh atoms in the Δρ > 0 region have increased ability to donate electrons due to this binding, while Rh ions in the Δρ < 0 region have a stronger ability to accept electrons. An increase in electron donating/reverse-donating capacity due to the bonding of Rh clusters to the support material could be one of the SMSI effects. In a system with Rh clusters bound to the depressed support, the region of non-zero Δρ extends not only to the position of the bound Rh cluster but also in the region between the Rh ions near the apex of the Rh cluster. This means that the region of higher catalytic activity is more extensive in the case where the Rh clusters are embedded in surface depressions.
We calculated the binding energies between Rh and various types of supports using DFT and compared them with our STEM observations of Rh sintering. In particular, we focused on the supports for which we measured the temperature-dependent Rh particle size, namely, ZrO2 and Y-ZrO2, as shown in Figure 10. Cubic ZrO2, Y-ZrO2, oxygen-deficient Y-ZrO2, and CeO2 were chosen as supports, and the (111) surface of each support was adopted as the surface for Rh binding. The same crystal symmetry was assumed to compare the binding energy on different support materials. Structural relaxation with small Rh clusters on the support surface resulted in multiple local stable states with different cluster shapes that have different numbers of bonds between Rh and oxygen in the support material. To eliminate such multiple states, we calculated the junction energy at the Rh–support interface, instead of the binding energy between the Rh cluster and the support.
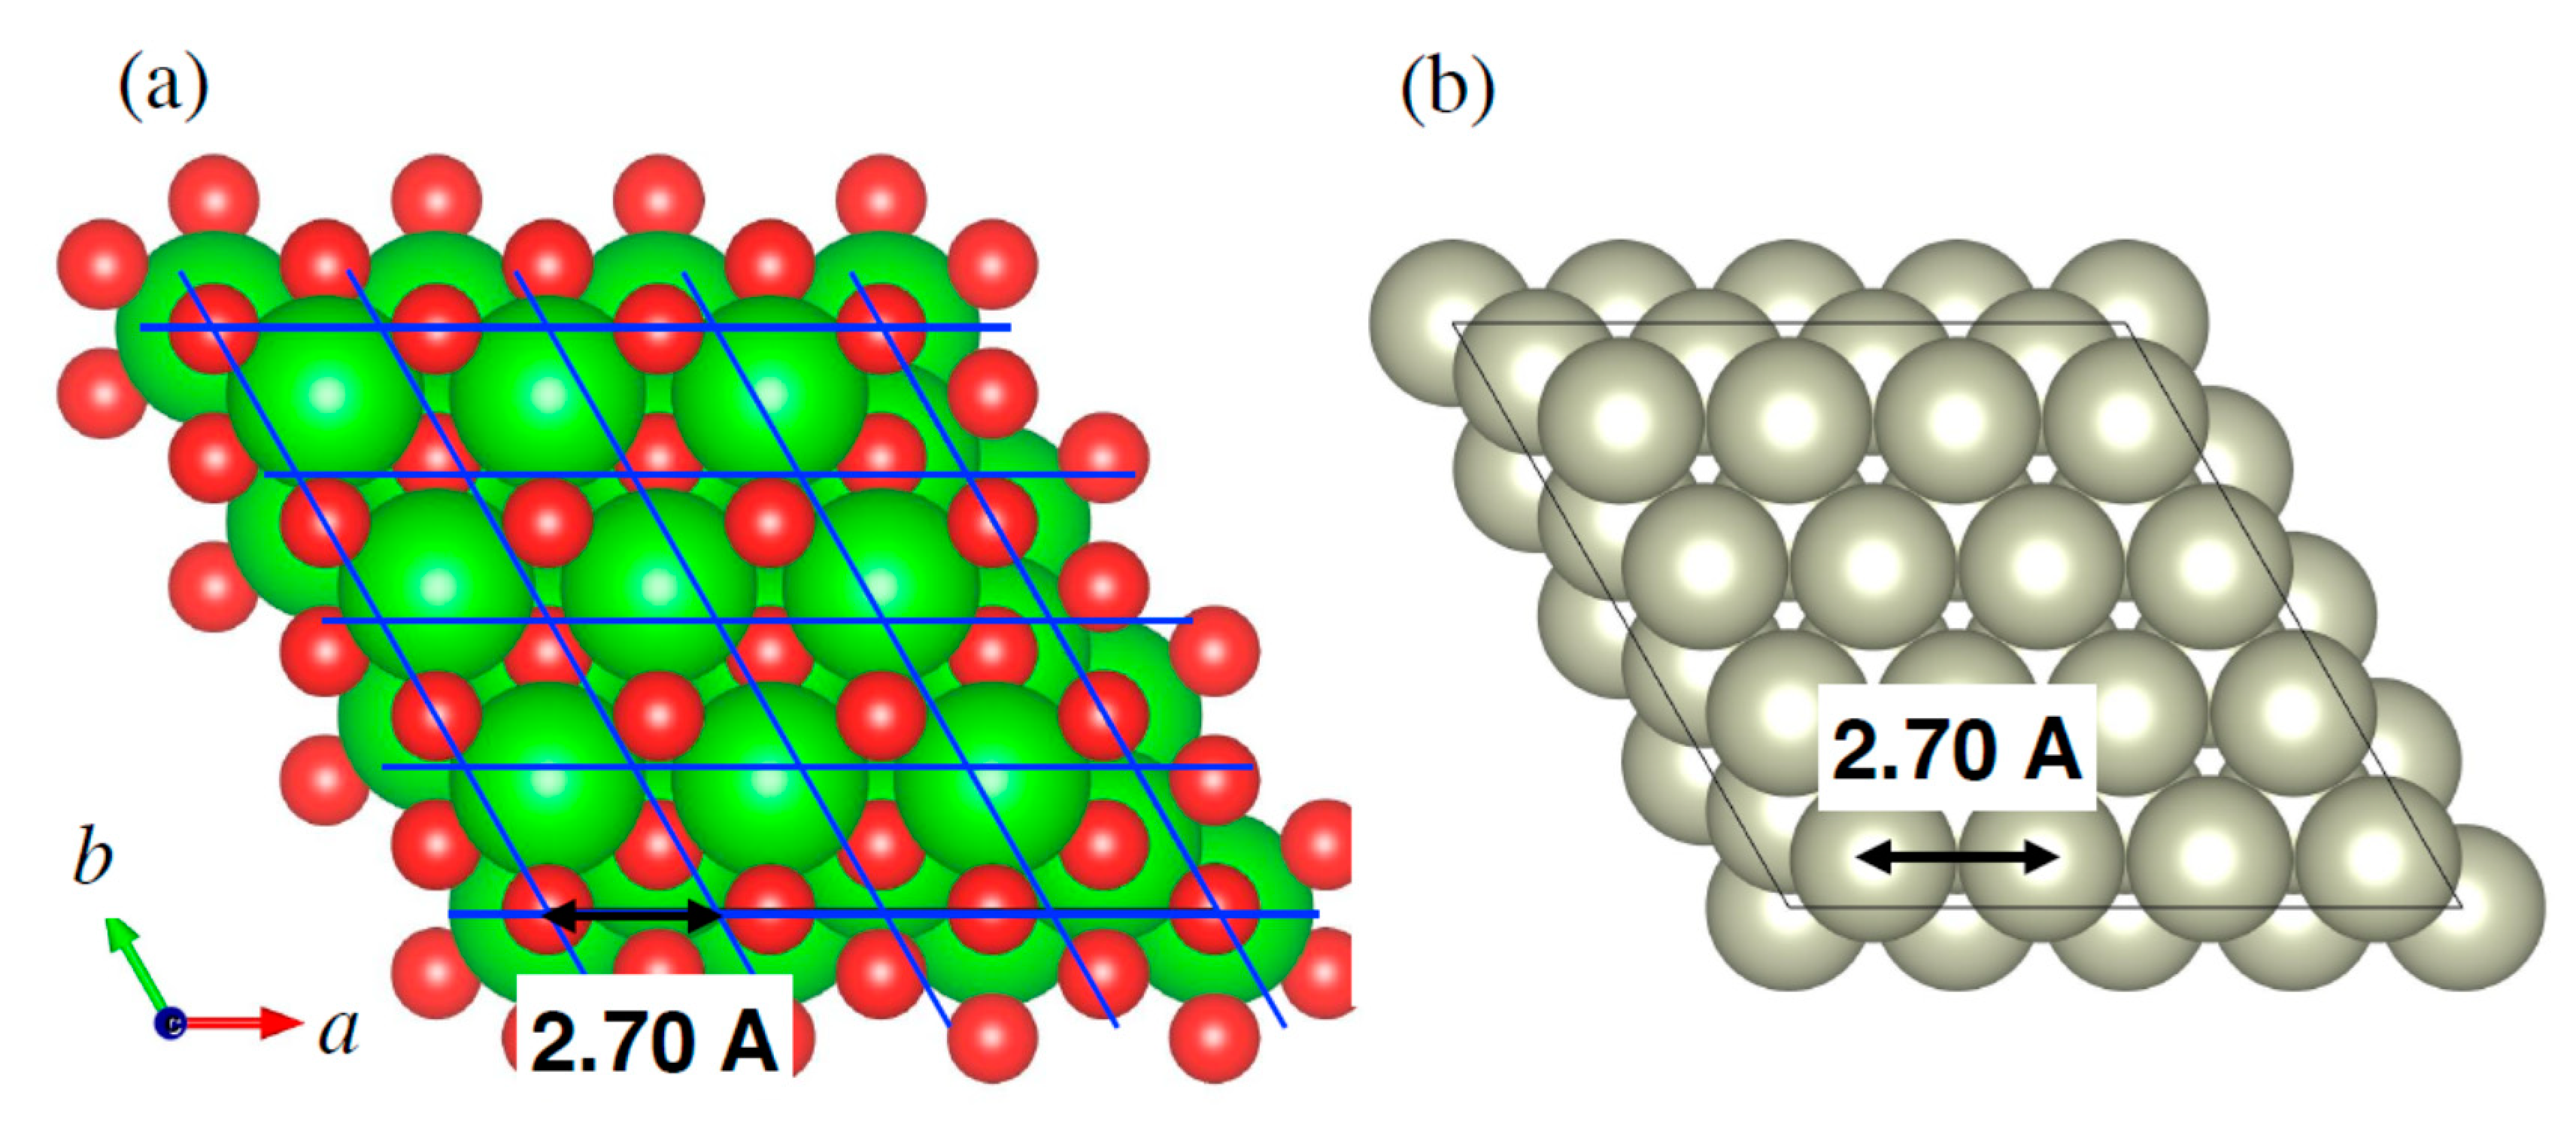
Figure 15a is a top view of the five-layered 3 × 3 structure of the (111) plane of oxygen-terminated ZrO2. The slab structure, which was structurally relaxed along the c-axis, was based on the lattice parameters of structurally relaxed cubic ZrO2. Figure 15b is a top view of the three-layered 4 × 4 structure of the (111) plane of fcc-Rh. The blue lines in Figure 15a indicate a good match between the ab-planes of the surface of the ZrO2 slab and the Rh 4 × 4 structure. After structural relaxation, some Rh atoms in the bottom layer are expected to bind to the oxygen of the support, and those not bound to oxygen should be stabilized by the metal bonds in Rh. The same may be true for the binding of support materials to the Rh particles, a few nanometers in size, measured in our STEM experiments. Structural relaxation calculations were performed for the three-layered structure of Rh and the interfacial three-layered structure of ZrO2, and the junction energy at the interface was −6.24 eV. The junction energy was defined here by subtracting the sum of the energy of the two isolated subsystems (Rh layers and ZrO2 slab, with the calculated structures in the entire system) from the total energy of the entire system. The junction energy per Rh number at the interface was −0.39 eV.
Figure 16 shows the six-layered 3 × 3 structure for the (111) plane of oxygen-terminated Y-ZrO2. Each layer contains one Y atom and eight Zr atoms. Because the ionic radius of Y is larger than that of Zr, the a- and b-axis lengths of the unit cell of the structurally relaxed Y-ZrO2 are slightly longer than those of ZrO2. However, the matching between the ab-plane of the surface of the Y-ZrO2 slab and the Rh 4 × 4 structure remains adequate. Structural relaxation calculations were performed, and the junction energy per Rh atom at the interface was found to be −1.06 eV. The bonding of Rh to Y-ZrO2 at the interface was thus illustrated to be stronger than the bonding to ZrO2. This is consistent with the STEM observation showing that the Rh particles supported on Y-ZrO2 were less sintered than those supported on ZrO2 (Figure 10).
Along with the two results presented so far, Table 2 shows the junction energies of the system with three layers of Rh(111) 4 × 4 structures joined to oxygen-deficient Y-ZrO2 and CeO2 slabs. One oxygen between the Y-Zr layers connected to the two Y atoms was chosen as the deficient site. The binding strength with the Rh layer could be ranked as ZrO2 < oxygen-deficient Y-ZrO2 < Y-ZrO2. This order can be attributed to the difference in valence between Y and Zr. The oxygen at the top surface coupled to Y receives more electrons from Rh than do those coupled to Zr. Hence, the bond between Rh and the terminating oxygen in Y-ZrO2 is relatively stronger. When an oxygen deficiency occurs near Y, sufficient electrons are supplied from that Y to the top surface oxygen. As a result, the coupling between the top surface oxygen and the Rh layer is weakened. Figure 17 shows the structural relaxation results of the bond between the Rh layer and various support slabs. The binding of oxygen to Rh increases near the Y site in Y-ZrO2. However, when an oxygen deficiency is introduced near the Y site, the tight coupling between Rh and oxygen is relaxed.

3. Experimental

3.1. Catalyst Preparation

Using Rh nitrate as the precursor, Rh was loaded at 3 wt% on different support materials (ZrO2, Y-ZrO2, CeO2, and Al2O3) by the conventional incipient wetness impregnation method, followed by calcination at 600 °C for 30 min in air. The details of each support material are summarized in Table 3.
For comparison with the Rh/oxide powder catalyst, an actual TWC was prepared and engine-aged for ex situ STEM observations. The TWC was a Pd/Rh commercial modified double-layer catalyst in which Pd was loaded on Al2O3 in the top layer and Rh was loaded on both Al2O3 and ZrO2/CeO2 materials in the bottom layer. The Pd loading was 1.8 g/L, and the Rh loading was 0.2 g/L. The catalyst was coated on cordierite honeycomb and engine-aged with a lean/rich cycle at temperatures higher than 900 °C for 50 h. The lean/rich cycle was exothermic fuel cuts (F/C) every 20 s followed immediately by 5 s rich spikes (air/fuel ratio λ = 0.83).

3.2. In Situ and Ex Situ STEM Observations

In situ and ex situ STEM observations and EDS elemental analysis and mapping were carried out using a JEOL JEM-ARM200F NEOARMex instrument (JEOL Ltd., Tokyo, Japan) with a maximum resolution of 82 pm, together with two different in situ chips. Details of the conditions for STEM and EDS observations are shown in Table 4. The following two in situ chips were supplied by Protochips (Protochips, Morrisville, NC, USA): FusionTM for vacuum observation at a maximum temperature of 1200 °C, and AtmosphereTM at 1 atm gas flow with a maximum temperature of 1000 °C.
During the in situ STEM observation in vacuum (ca. 2.0 × 10⁻⁵ Pa) with FusionTM, the temperature was rapidly ramped up to 300 °C. Then, EDS analysis was performed, and the results were used to select a site with an adequate amount of Rh. STEM imaging and EDS element mapping were carried out at the selected site. The temperature was ramped to 900 °C, followed by STEM imaging and EDS element mapping. The same procedure was repeated after ramping from 900 to 950 °C, from 950 to 1000 °C, and from 1000 to 1050 °C. To fix the observation point, STEM was observed in real time during the measurement.
During the in situ STEM observation in N2 gas with AtmosphereTM, pure N2 initially flowed to the chip at 30 mL/min. The temperature was rapidly ramped up to 300 °C in N2, and EDS analysis was performed. The subsequent steps were similar to those described above for the vacuum environment; however, EDS analysis was not performed at temperatures above 300 °C in order to avoid the electron beam effect. Further, upon reaching 950 °C, the gas was changed from pure N2 to 1% O2 with N2 balance. STEM movies were created for each heating period. The purities of both the N2 and O2 gas cylinders used in the experiments were over 99.99995%.

3.3. DTA-TG Measurement

Differential thermal analysis–thermogravimetry (DTA-TG) was carried out on a Thermo plus EVO2 device (Rigaku corporation, Tokyo, Japan), into which various gases can be flowed. Measurements were performed on Rh/ZrO2 in three different atmospheres: N2, 7%O2/N2, and 2%H2/N2. The sample (15 mg) was placed on a platinum pan (5 mm diameter and 5 mm height). The temperature was ramped up to 200 °C at a rate of 30 °C/min, and then to 1100 °C at 10 °C/min.

3.4. DFT Calculations

Electronic state calculations based on density functional theory (DFT) were performed using the Vienna Ab-Initio Simulation Package (VASP) (VASP Software GmbH, Vienna, Austria), version 5 [21]. The generalized gradient approximation method of Perdew–Burke–Ernzerhof (GGA-PBE) [22] and the projector augmented wave method [23] were employed. Following single-point structural relaxation calculation, Brillouin zone integration was performed with a 3 × 3 × 1 Monkhorst-Pack mesh [24] to obtain the total energy and electron density distribution. The cut-off energy of the plane wave was set to 400 eV. The convergence condition of energy relaxation in the self-consistent calculation of the wavefunction and the charge density was smaller than 1.0 × 10⁻⁵ eV. The convergence condition of the structural relaxation calculations was assumed to be less than 0.03 eV/Å for all forces. The slab models and electron number densities of the calculated systems were visualized using VESTA(Visualization for Electronic Structural Analysis) [25].

4. Conclusions

In this study, in situ STEM and EDS observations of Rh on various oxide supports were obtained and then compared with each other, as well as with ex situ observations of an actual TWC catalyst aged by an engine. Both the in situ STEM and EDS techniques achieved Rh particle sintering on ZrO2, yttria-doped ZrO2, CeO2, and Al2O3 support materials. Observation via the two in situ observation techniques showed that the sample was more strongly reduced under vacuum and high temperature than under N2 or 1% O2 (balance N2) gas flow conditions. The Rh sintering phenomenon was further examined in real time using Rh/ZrO2 and Rh/YZrO2 as examples, by tracking Rh particles in a N2 atmosphere using in situ TEM. General sintering of the support material (ZrO2 and Y-ZrO2) began, followed by Rh particle sintering. The Rh particle size was slightly smaller on Rh/Y-ZrO2 compared to that on Rh/ZrO2. These experimental results were supported by DFT calculations. In the calculation results, some Rh atoms were located in surface depressions, and the Rh cluster embedded in the surface stabilized. These predictions are consistent with the images obtained by STEM experiments in vacuum. In addition, strong metal–surface interaction was suggested by the calculated electronic density difference data. The junction energies of the system with three layers of Rh(111) 4 × 4 structures joined to various support materials were also calculated using DFT techniques. The computational Rh–substrate interactions showed remarkable correlation with the in situ TEM observations in an N2 atmosphere. Considering these results, the thermal durability of the support material and the junction energy obtained by DFT calculations are important for preventing Rh sintering of TWCs under high-temperature conditions such as engine aging. This study is expected to be very useful not only for the development of TWCs but also for the development of specific catalyst analysis methods.

Supplementary Materials

The following are available online at https://www.mdpi.com/2073-4344/11/1/19/s1, Figure S1: In-situ TEM images in N2 atmosphere of Rh/ZrO2 at (a) 941 °C, (b) 944.2 °C, (c) 948.8 °C, (d) 950 °C, and Rh/Y-ZrO2 (e) 942 °C, (f) 948.5 °C, (g) 950 °C; Figure S2: The Rh particles determined by the mode method after contrast adjustment of Rh/ZrO2 at (a) 941 °C, (b) 944.2 °C, (c) 948.8 °C, (d) 950 °C, and Rh/Y-ZrO2 (e) 942 °C, (f) 948.5 °C, (g) 950 °C.

Author Contributions

Conceptualization, M.N., and Y.S.; methodology, M.N., and Y.S.; software, Y.S.; validation, H.N., M.N., and Y.S.; formal analysis, H.N., M.N. and Y.S.; investigation, H.N., H.A., M.N. and Y.S.; resources, H.N., M.N. and Y.S.; data curation, H.N., M.N. and Y.S.; writing—original draft preparation, H.N., M.N. and Y.S.; writing—review and editing, H.A., M.N. and Y.S.; visualization, H.N., M.N. and Y.S.; supervision, Y.S.; project administration, M.N and Y.S.; All authors have read and agreed to the published version of the manuscript.

Funding

This research received no external funding

Data Availability Statement

The data presented in this study are available on request from the corresponding author.

Conflicts of Interest

The authors declare no conflict of interest.

References

  1. Joshi, A. Review of Vehicle Engine Efficiency and Emissions. SAE Tech. Pap. 2020. [Google Scholar] [CrossRef]
  2. Nagai, Y.; Hirabayashi, T.; Dohmae, K.; Takagi, N.; Minami, T.; Shinjoh, H.; Matsumoto, S. Sintering inhibition mechanism of platinum supported on ceria-based oxide and Pt-oxide–support interaction. J. Catal. 2006, 242, 103–109. [Google Scholar] [CrossRef]
  3. Tanabe, T.; Nagai, Y.; Dohmae, K.; Sobukawa, H.; Shinjoh, H. Sintering and redispersion behavior of Pt on Pt/MgO. J. Catal. 2008, 257, 117–124. [Google Scholar] [CrossRef]
  4. Wang, N.; Li, S.; Zong, Y.; Yao, Q. Sintering inhibition of flame-made Pd/CeO2 nano catalyst for low temperature methane combustion. J. Aerosol. Sci. 2017, 105, 64–72. [Google Scholar] [CrossRef]
  5. Wu, Y.; Chen, J.; Qu, P.; Hu, W.; Shen, P.; Zhang, G.; Jiao, Y.; Zhong, L.; Chen, Y. Promotion of yttrium (Y) on the water resistance and hydrothermal stability of Pd/ZrO2 catalyst coated on the monolith for complete methane oxidation. J. Taiwan Inst. Chem. Eng. 2019, 103, 44–56. [Google Scholar] [CrossRef]
  6. Tanabe, T.; Morikawa, A.; Hatanaka, M.; Takahashi, N.; Nagai, Y.; Sato, A.; Kuno, O.; Suzuki, H.; Shinjoh, H. The interaction between supported Rh- and Nd2O3-enriched surface layer on ZrO2 for Rh sintering suppression. Catal. Today 2012, 184, 219–226. [Google Scholar] [CrossRef]
  7. Yati, I.; Ridwan, M.; Jeong, G.E.; Lee, Y.; Choi, J.W.; Yoon, C.W.; Suh, D.J.; Ha, J.M. Effects of sintering-resistance and large metal–support interface of alumina nanorod-stabilized Pt nanoparticle catalysts on the improved high temperature water gas shift reaction activity. Catal. Commun. 2014, 56, 11–16. [Google Scholar] [CrossRef]
  8. Morikawa, A.; Tanabe, T.; Hatanaka, M.; Takahashi, N.; Sato, A.; Kuno, O.; Suzuki, H.; Shinjoh, H. Inhibition of Rh sintering and improved reducibility of Rh on ZrO2 nanocomposite with an Al2O3diffusion barrier. Appl. Catal. A: Gen. 2015, 493, 33–39. [Google Scholar] [CrossRef]
  9. Suzuki, A.; Nakamura, K.; Sato, R.; Okushi, K.; Tsuboi, H.; Hatakeyama, N.; Endou, A.; Takaba, H.; Kubo, M.; Williams, M.C.; et al. Multi-scale theoretical study of support effect on sintering dynamics of Pt. Surf. Sci. 2009, 603, 3049–3056. [Google Scholar] [CrossRef]
  10. Koga, H.; Hayashi, A.; Ato, Y.; Tada, K.; Hosokawa, S.; Tanaka, T.; Okumura, M. Effect of ceria and zirconia supports on NO reduction over platinum-group metal catalysts: A DFT study with comparative experiments. Catal. Today 2019, 332, 236–244. [Google Scholar] [CrossRef]
  11. Gerceker, D.; Önal, I. A DFT study on CO oxidation on Pd4 and Rh4 clusters and adsorbed Pd and Rh atoms on CeO2 and Ce0.75Zr0.25O2supports for TWC applications. Appl. Surf. Sci. B 2013, 285, 927–936. [Google Scholar] [CrossRef]
  12. Simonsen, S.B.; Chorkendorff, I.; Dahl, S.; Skoglundh, M.; Sehested, J.; Helveg, S. Ostwald ripening in a Pt/SiO2 model catalyst studied by in situ TEM. J. Catal. 2011, 281, 147–155. [Google Scholar] [CrossRef] [Green Version]
  13. DeLaRiva, A.T.; Hansen, T.W.; Challa, S.R.; Datye, A.K. In situ Transmission Electron Microscopy of catalyst sintering. J. Catal. 2013, 308, 291–305. [Google Scholar] [CrossRef] [Green Version]
  14. Fujita, T.; Higuchi, K.; Yamamoto, Y.; Tokunaga, T.; Arai, S.; Abe, H. In-Situ TEM Study of a Nanoporous Ni–Co Catalyst Used for the Dry Reforming of Methane. Metals 2017, 7, 406. [Google Scholar] [CrossRef] [Green Version]
  15. Hirata, H.; Kishita, K.; Nagai, Y.; Dohmae, K.; Shinjoh, H.; Matsumoto, S. Characterization and dynamic behavior of precious metals in automotive exhaust gas purification catalysts. Catal. Today 2011, 164, 467–473. [Google Scholar] [CrossRef]
  16. Simonsen, S.B.; Chorkendorff, I.; Dahl, S.; Skoglundh, M.; Sehested, J.; Helveg, S. Direct Observations of Oxygen-induced Platinum Nanoparticle Ripening Studied by In Situ TEM. J. Am. Chem. Soc. 2010, 132, 7968–7975. [Google Scholar] [CrossRef] [Green Version]
  17. Goula, G.; Botzolaki, G.; Osatiashtiani, A.; Parlett, C.M.A.; Kyriako, G.; Lambert, R.M.; Yentekakis, I.V. Oxidative Thermal Sintering and Redispersion of Rh Nanoparticles on Supports with High Oxygen Ion Lability. Catalysts 2019, 9, 541. [Google Scholar] [CrossRef] [Green Version]
  18. Dai, S.; Zhang, S.; Katz, M.B.; Graham, G.W.; Pan, X. In Situ Observation of Rh-CaTiO3 Catalysts during Reduction and Oxidation Treatments by Transmission Electron Microscopy. ACS Catal. 2017, 7, 1579–1582. [Google Scholar] [CrossRef]
  19. Toya, Y.; Nakayama, H.; Hara, H.; Nagata, M. Optimization of TWC Design for Various Engine Operation Conditions. Sae Tech. Pap. 2019. [Google Scholar] [CrossRef]
  20. Ye, F.; Xu, M.; Dai, S.; Tieu, P.; Ren, X.; Pan, X. In Situ TEM Studies of Catalysts Using Windowed Gas Cells. Catalysts 2020, 10, 779. [Google Scholar] [CrossRef]
  21. Kresse, G.; Hafner, J. Ab initio molecular dynamics for liquid metals. Phys. Rev. B 1993, 47, 558–561. [Google Scholar] [CrossRef] [PubMed]
  22. Perdew, J.P.; Burke, K.; Ernzerhof, M. Generalized Gradient Approximation Made Simple. Phys. Rev. Lett. 1996, 77, 3865–3868. [Google Scholar] [CrossRef] [PubMed] [Green Version]
  23. Blöchl, P.E. Projector augmented-wave method. Phys. Rev. B 1994, 50, 17953–17979. [Google Scholar] [CrossRef] [PubMed] [Green Version]
  24. Monkhorst, H.J.; Pack, J.D. Special points for Brillouin-zone integrations. Phys. Rev. B 1976, 13, 5188–5192. [Google Scholar] [CrossRef]
  25. Momma, K.; Izumi, F. VESTA 3 for three-dimensional visualization of crystal, volumetric and morphology data. J. Appl. Crystallogr. 2011, 44, 1272–1276. [Google Scholar] [CrossRef]
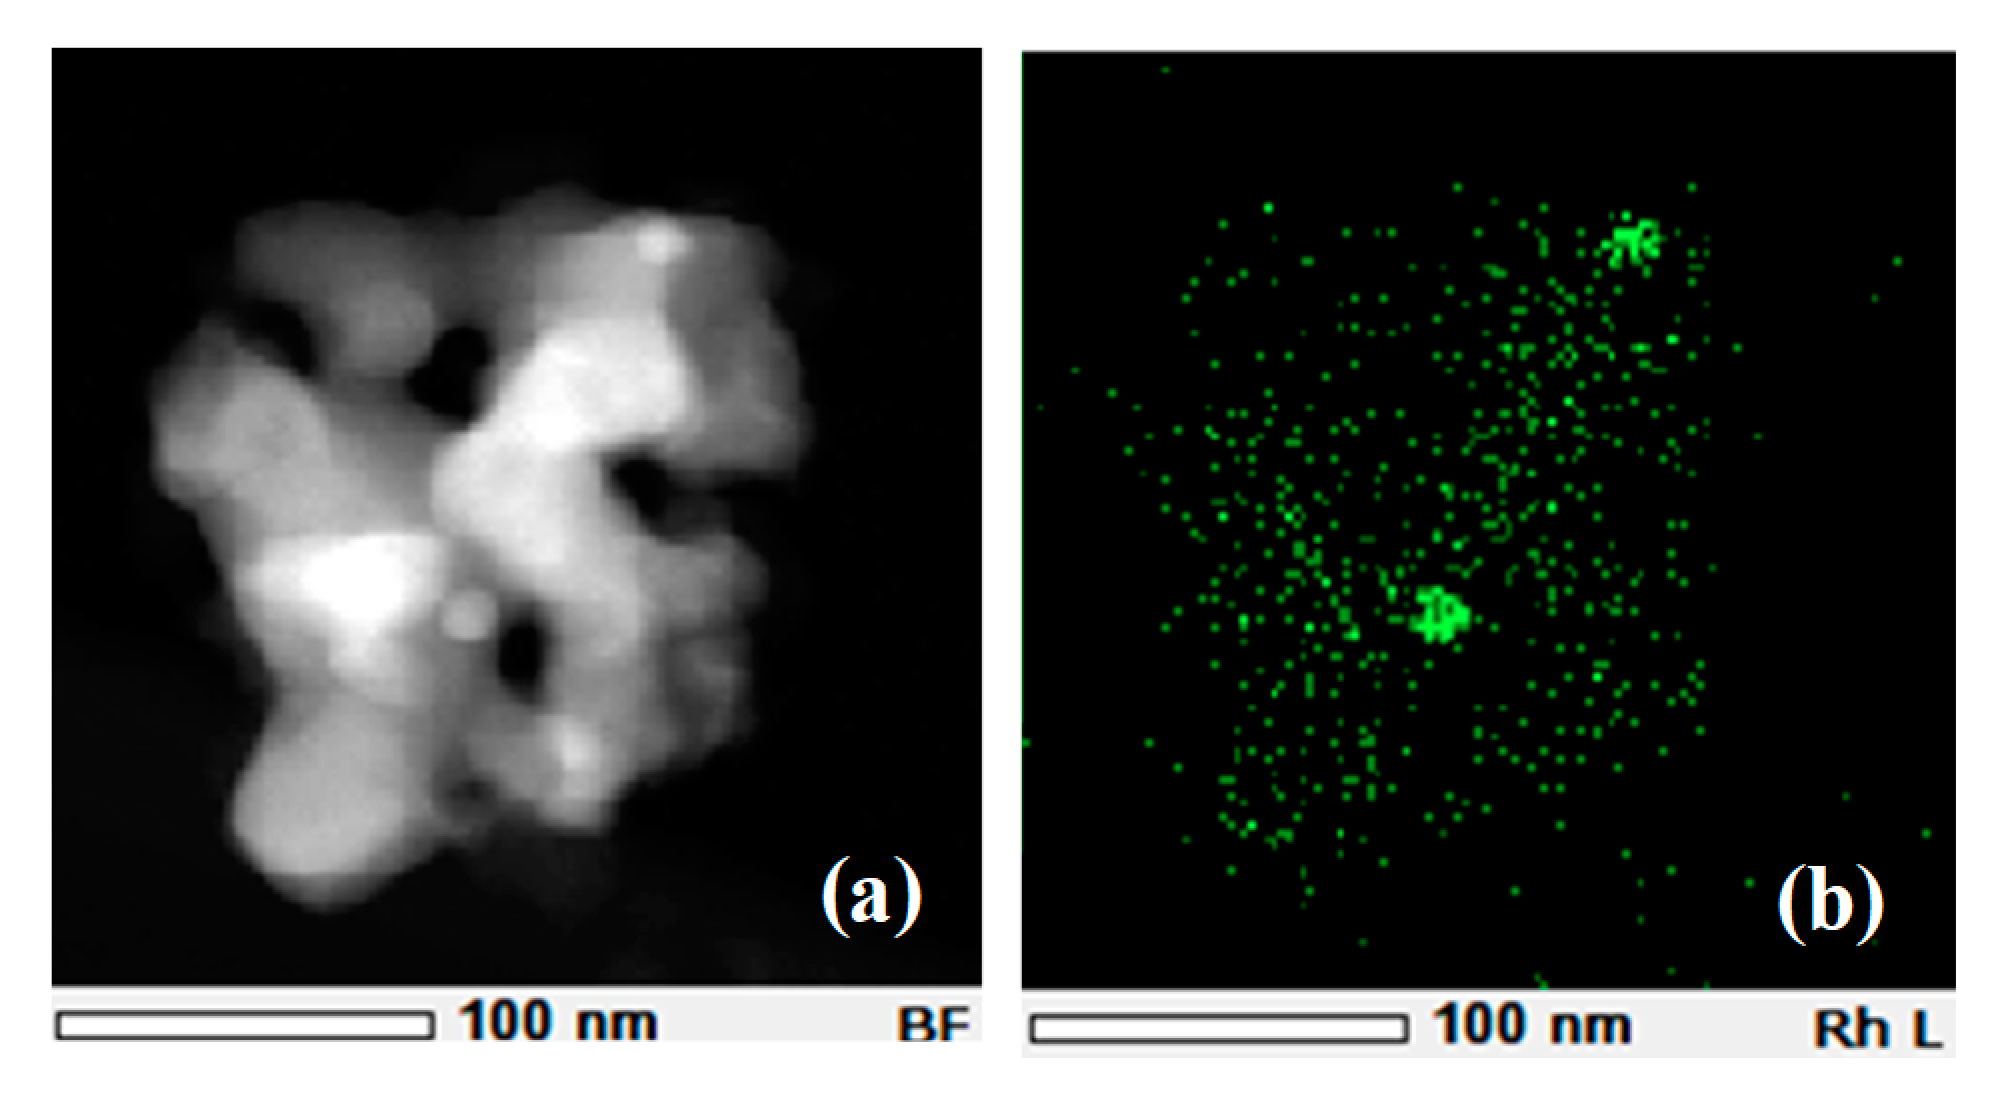
Figure 1. (a) Ex situ tunneling electron microscopy (TEM) image and (b) EDS mapping of engine-aged catalyst.
Catalysts 11 00019 g001
Figure 2. TEM images and EDS mapping of Rh in Rh/ZrO2 under vacuum conditions at (a) 300 °C, (b) 900 °C, (c) 950 °C, (d) 1000 °C, and (e) 1050 °C.
Catalysts 11 00019 g002
Figure 3. TEM images and EDS mapping of Rh in Rh/Y-ZrO2 under vacuum conditions at (a) 300 °C, (b) 900 °C, (c) 950 °C, (d) 1000 °C, and (e) 1050 °C.
Catalysts 11 00019 g003
Figure 4. TEM images and EDS mapping of Rh in Rh/CeO2 under vacuum conditions at (a) 300 °C, (b) 900 °C, (c) 950 °C, (d) 1000 °C, and (e) 1050 °C.
Catalysts 11 00019 g004
Figure 5. TEM images and EDS mapping of Rh in Rh/Al2O3 under vacuum conditions at (a) 300 °C, (b) 900 °C, (c) 950 °C, (d) 1000 °C, and (e) 1050 °C.
Catalysts 11 00019 g005
Figure 6. In situ TEM and EDS images of Rh/ZrO2 at (a) 300 °C in N2, (b) 900 °C in N2, (c) 950 °C in N2, and (d) 950 °C in 1% O2 (balance N2); (e) TEM data at 300 °C after cooling from 1000 °C. (f) EDS measurement result after (e) at the same observation point.
Catalysts 11 00019 g006
Figure 7. DTA−TG measurement results for Rh/ZrO2 in O2, N2, and H2.
Catalysts 11 00019 g007
Figure 8. In situ TEM images of Rh/ZrO2 at (a) 300 °C, (b) 918.1 °C, (c) 932.5 °C, (d) 941 °C, (e) 944.2 °C, (f) 948.8 °C, (g) 950 °C, (h) 968.7 °C, (i) 983.8 °C, and (j) 1000 °C. (k) TEM data at 300 °C after cooling from 1000 °C. (l) EDS measurement result after (j) at the same observation point. The atmosphere was N2 for (a)–(g) and changed to 1% O2/N2 in (h)–(j).
Catalysts 11 00019 g008
Figure 9. In situ TEM images of Rh/Y-ZrO2 at (a) 300 °C, (b) 910.4 °C, (c) 923.2 °C, (d) 934.2 °C, (e) 942 °C, (f) 948.5 °C, (g) 950 °C, (h) 967.3 °C, (i) 985.2 °C, and (j) 1000 °C. (k) TEM results at 300 °C after cooling from 1000 °C. (l) EDS measurement result after (j) at the same observation point. The atmosphere was N2 in (a)–(g) and changed to 1% O2/N2 in (h)–(j).
Catalysts 11 00019 g009
Figure 10. (a) Temperature dependence of the Rh particle size, which was obtained from tracking the corresponding Rh particle in the STEM images in Figure 8 and Figure 9. (b) and (c) are STEM images of Rh/ZrO2 and Rh/Y-ZrO2 at 950 °C in N2 gas. The size of the Rh particles within the dashed circle was evaluated.
Catalysts 11 00019 g010
Figure 11. Top view of a 3 × 3 Zr-terminated (111) surface of cubic ZrO2. The large green spheres represent Zr atoms, and the small red spheres represent oxygen atoms. The dashed black circles represent the four Zr atoms that were removed to create a depression in the surface.
Catalysts 11 00019 g011
Figure 12. A Rh12 cluster bound to a depression in a Zr-terminated surface, which was structurally relaxed by DFT calculations. The large green spheres represent Zr atoms, the small red spheres represent oxygen atoms, and the gray spheres represent Rh atoms. (a) is the top view and (b) is the side view.
Catalysts 11 00019 g012
Figure 13. A Rh12 cluster bound to a flat oxygen-terminated surface, which was structurally relaxed by DFT calculations. The large green spheres represent Zr atoms, the small red spheres represent oxygen atoms, and the gray spheres represent Rh atoms. (a) is the top view and (b) is the side view.
Catalysts 11 00019 g013
Figure 14. Side views of the electron density distributions in two systems: (a) a Rh12 cluster embedded in a depressed Zr-terminated surface and (b) a Rh12 cluster adsorbed on a flat oxygen-terminated surface. The positions of ions in (a) and (b) are the same as those in Figure 12b and Figure 13b, respectively. The yellow-green isosurface represents positive Δρ = ρ(Rh12/support) ρ(Rh12) ρ(support), and the sky blue isosurface represents negative Δρ. Δρ ~ 0 in the region where no isosurface is displayed.
Catalysts 11 00019 g014
Figure 15. (a) Top view of a 3 × 3 O-terminated (111) surface of cubic ZrO2. The large green spheres represent Zr atoms and the small red spheres represent oxygen atoms. The blue lines represent a 4 × 4 mesh spaced 2.70 Å apart. (b) Top view of the three-layered Rh(111) 4 × 4 structure.
Catalysts 11 00019 g015
Figure 16. (a) Top view of a six-layered 3 × 3 O-terminated (111) surface of cubic Y-ZrO2. The blue lines represent a 4 × 4 mesh spaced 2.71 Å apart. (b) Side view of the structure. The large green spheres represent Zr atoms, the small red spheres represent oxygen atoms, and the large dark gray spheres are Y atoms. One Zr was substituted for Y in each layer of ZrO2.
Catalysts 11 00019 g016
Figure 17. Side view of the interface between a three-layered Rh(111) 4 × 4 structure and various support slabs: (a) ZrO2, (b) Y-ZrO2, and (c) oxygen-deficient Y-ZrO2. The Rh–O bonds are drawn when the bond length is less than 2.25 Å.
Catalysts 11 00019 g017
Table 1. Summary of the starting temperatures for the support materials and Rh particles.
1900 ℃950 ℃1000 ℃1050 ℃
Rh/ZrO2ZrO2Rh
Rh/Y-ZrO2 Y-ZrO2Rh
Rh/CeO2CeO2 Rh
Rh/ɤ-Al2O3 Al2O3/Rh
Table 2. Junction energies of the system with three-layered Rh(111) 4 × 4 structures joined to various support slabs. The energy is given per Rh atom at the interface.
SupportJunction Energy (eV)
ZrO2−0.39
Y-ZrO2−1.06
Y-ZrO2-δ−0.67
CeO2−0.52
Table 3. Properties of the catalyst support materials.
MaterialCompositionBET Surface Area (m2/g)Supplier
ZrO2100% ZrO293.8DKKK (a)
Y-ZrO222.7mol% Y2O3-ZrO271.7DKKK
CeO2100% CeO2100.6DKKK
ɤ-Al2O3100% Al2O3141.0Sasol(Sandton, South Africa)
(a) Daiichi Kigenso Kagaku Kougyo (Osaka, Japan).
Table 4. Conditions of STEM and EDS measurements.
ConditionsSTEMEDS
Acceleration voltage (kV)200200
Irradiation current (pA/cm2) 6868
Image size in pixels1024 × 1024256 × 256
Pixel Size (nm/pixel)0.0640.26
Dwell time10 μs0.2 ms
Publisher’s Note: MDPI stays neutral with regard to jurisdictional claims in published maps and institutional affiliations.