
Effect of Preparation Methods on the Performance of Pt/TiO2 Catalysts for the Catalytic Oxidation of Carbon Monoxide in Simulated Sintering Flue Gas

Abstract
:1. Introduction
2. Results and Discussion
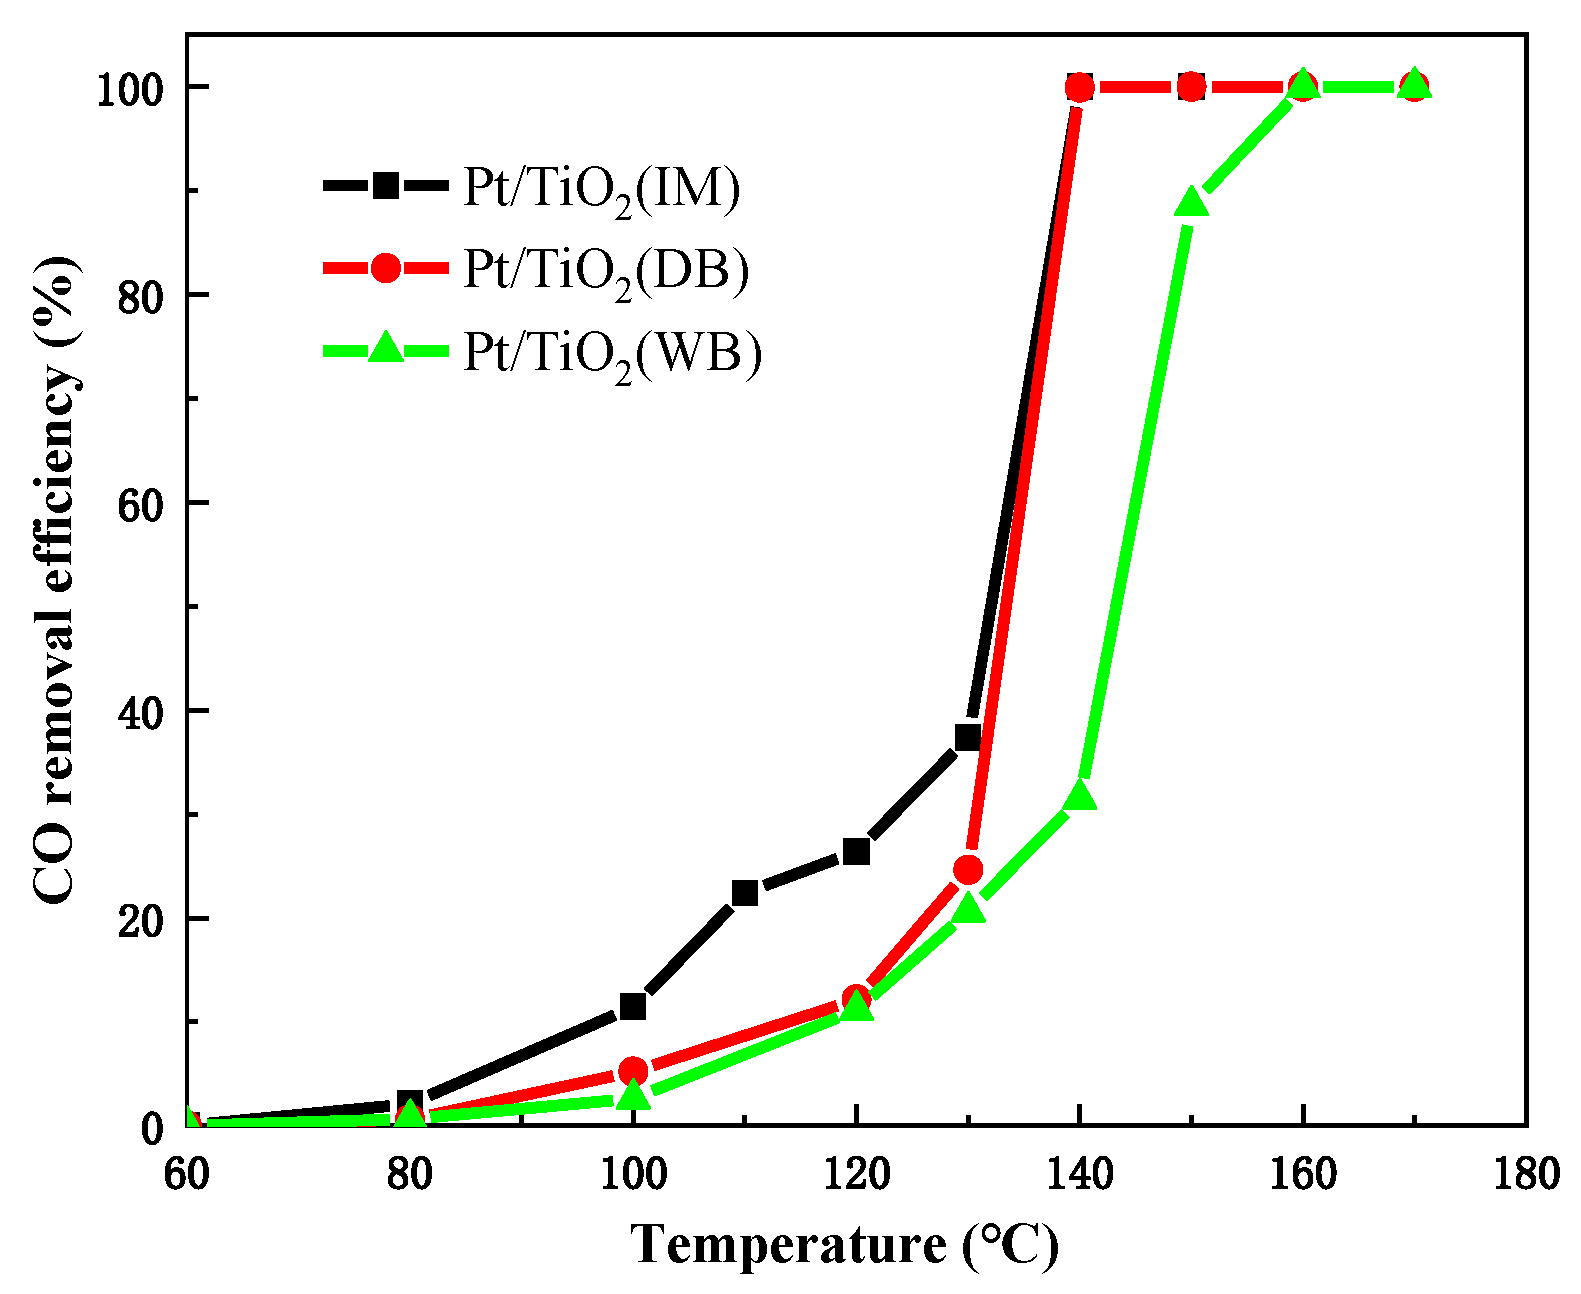
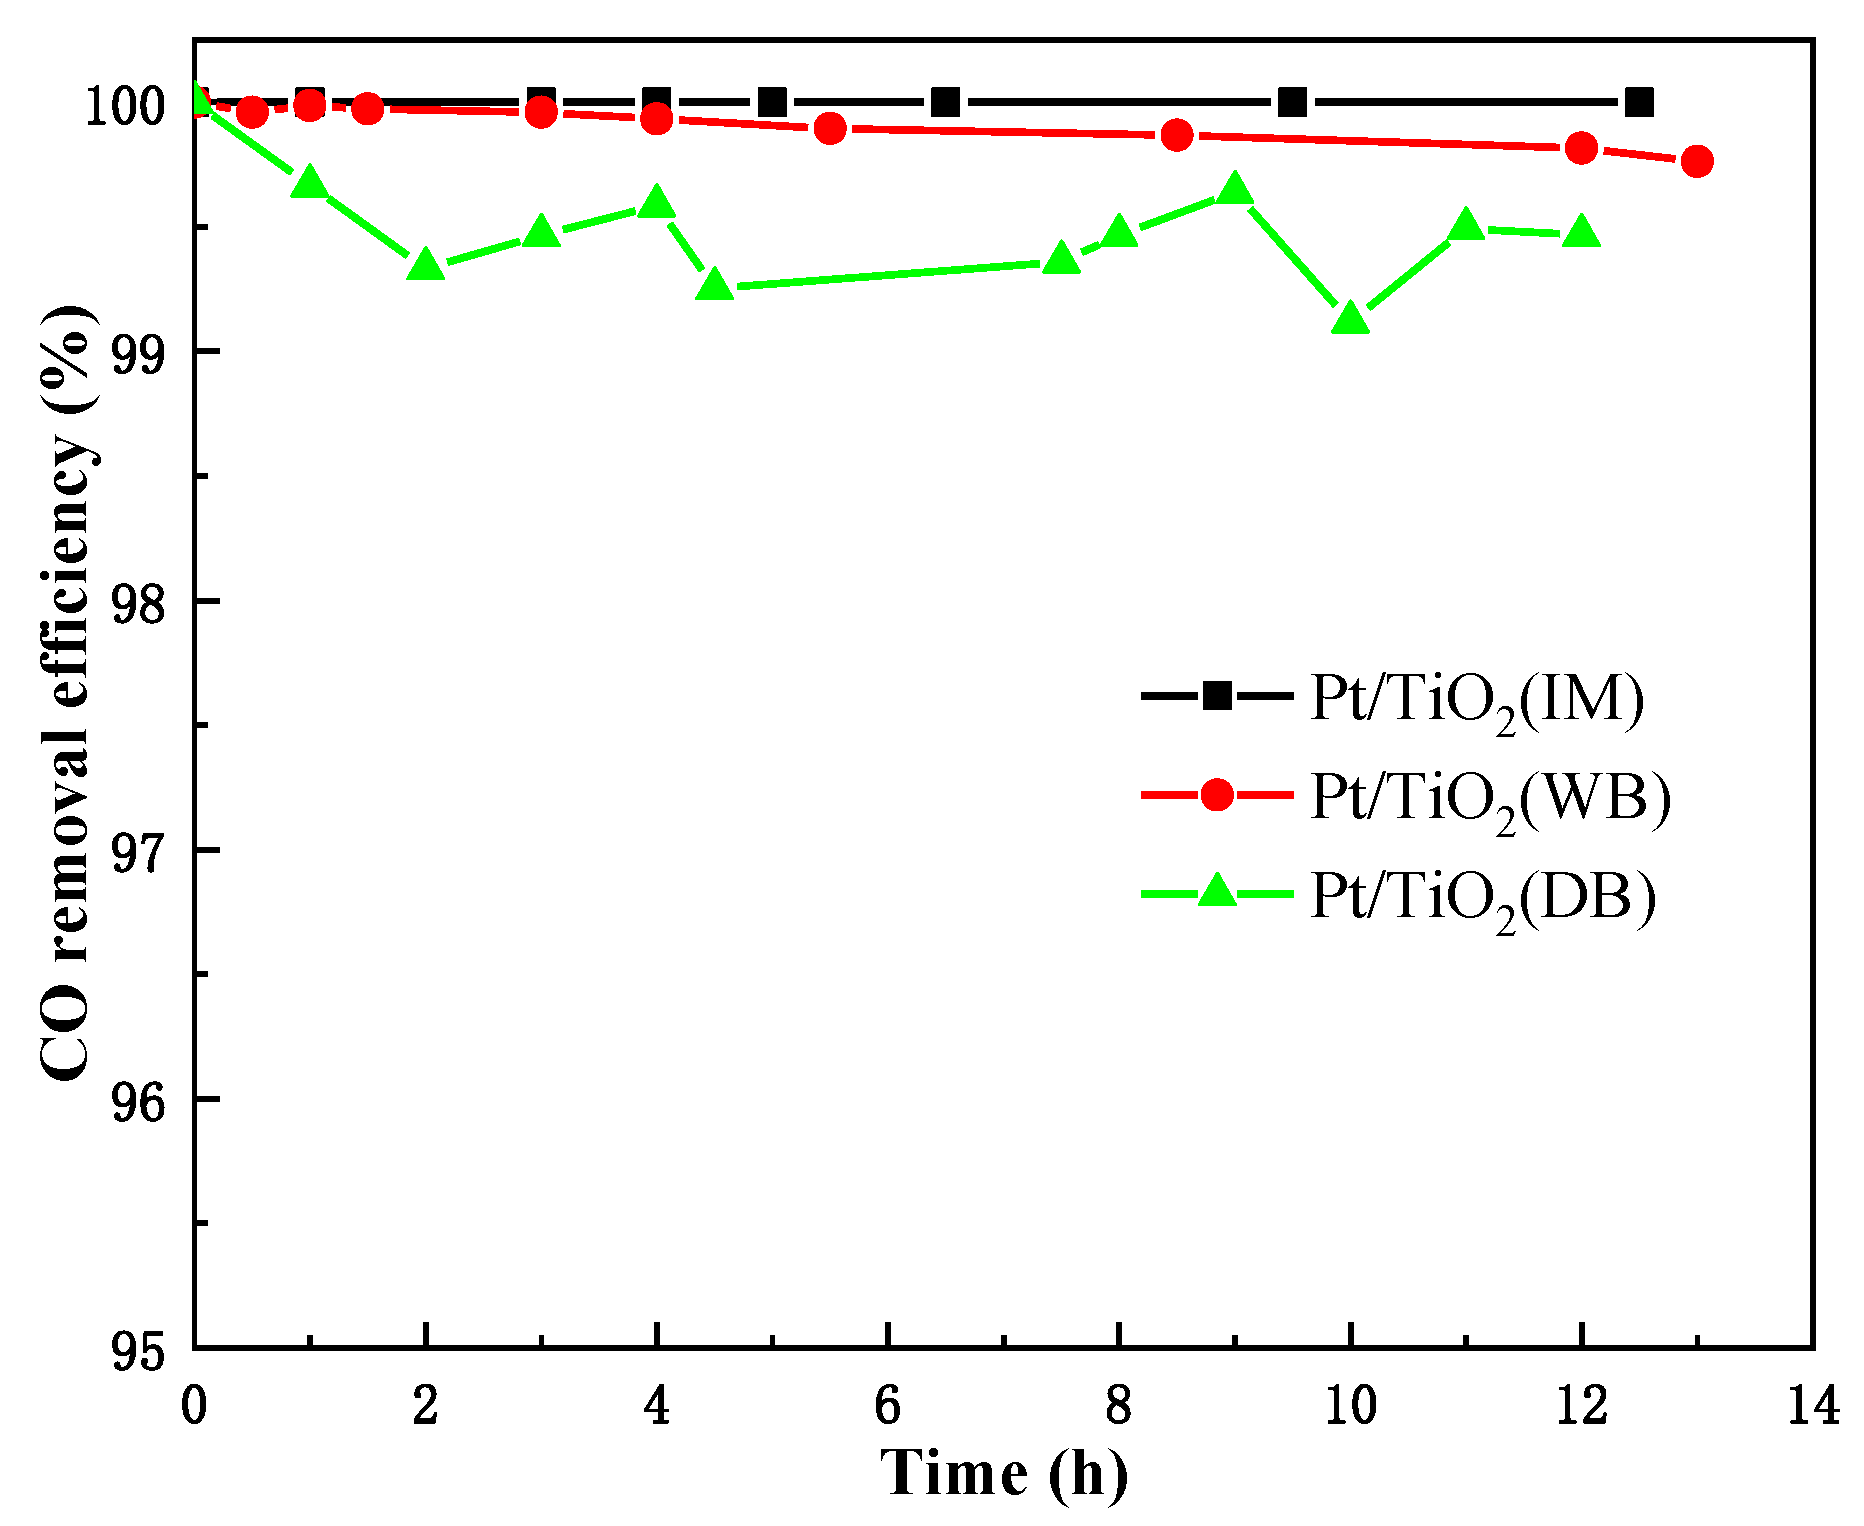
2.1. Catalytic Performance
2.2. Catalyst Characterization
2.2.1. BET
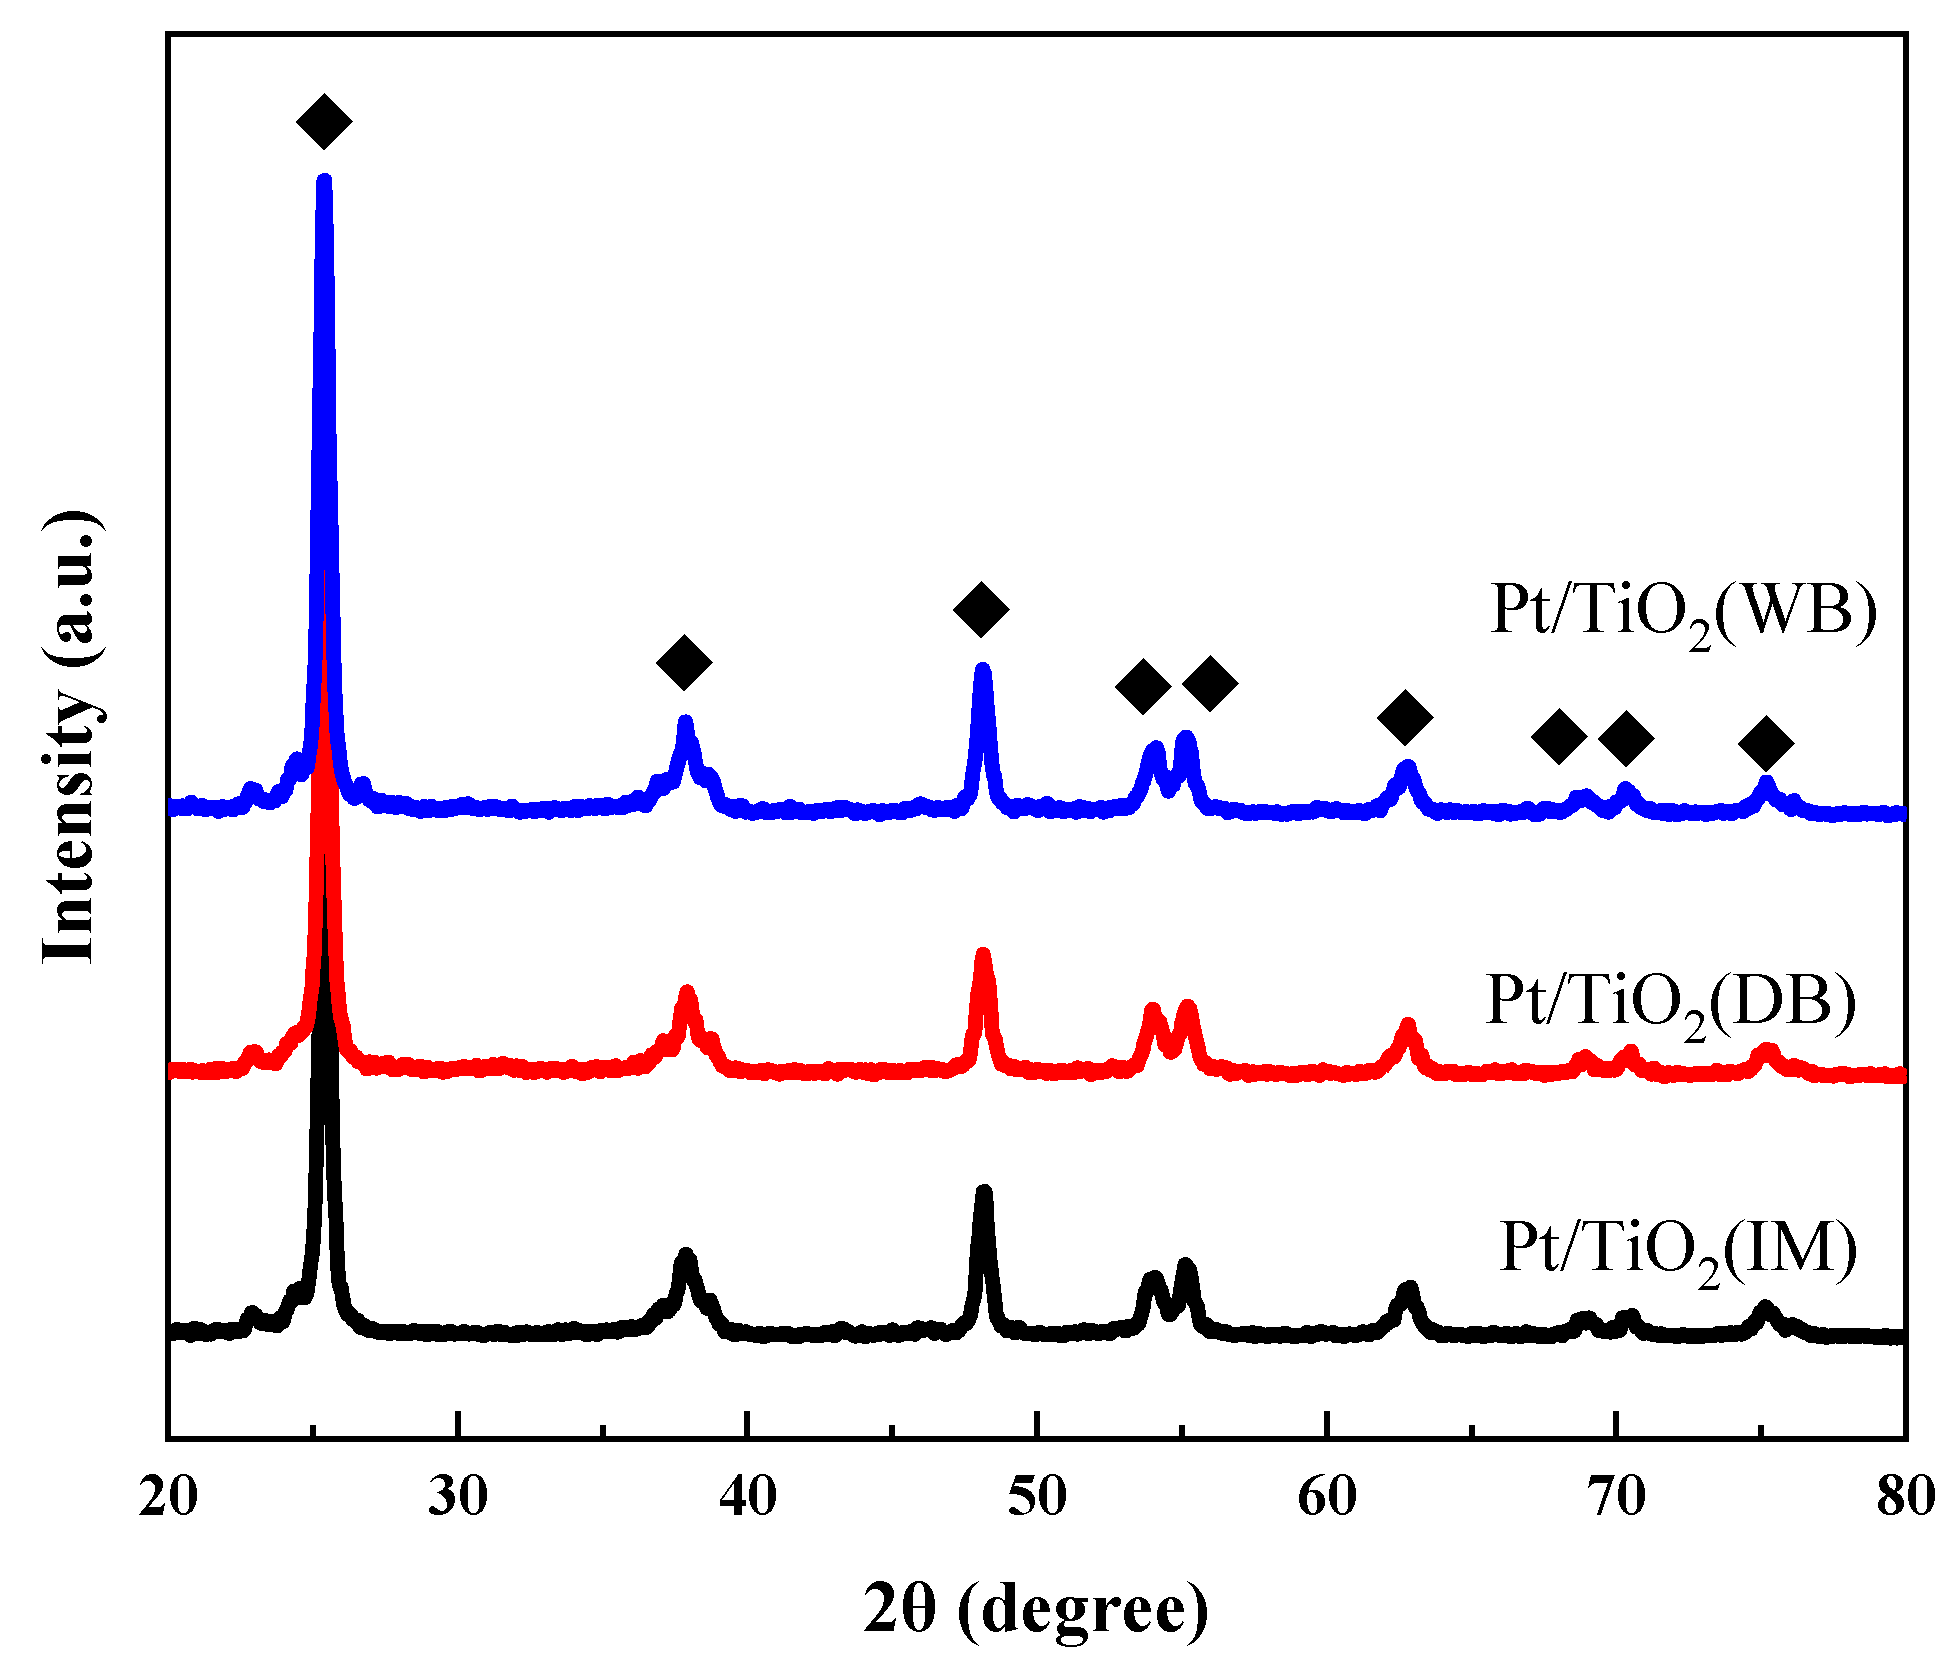
2.2.2. XRD
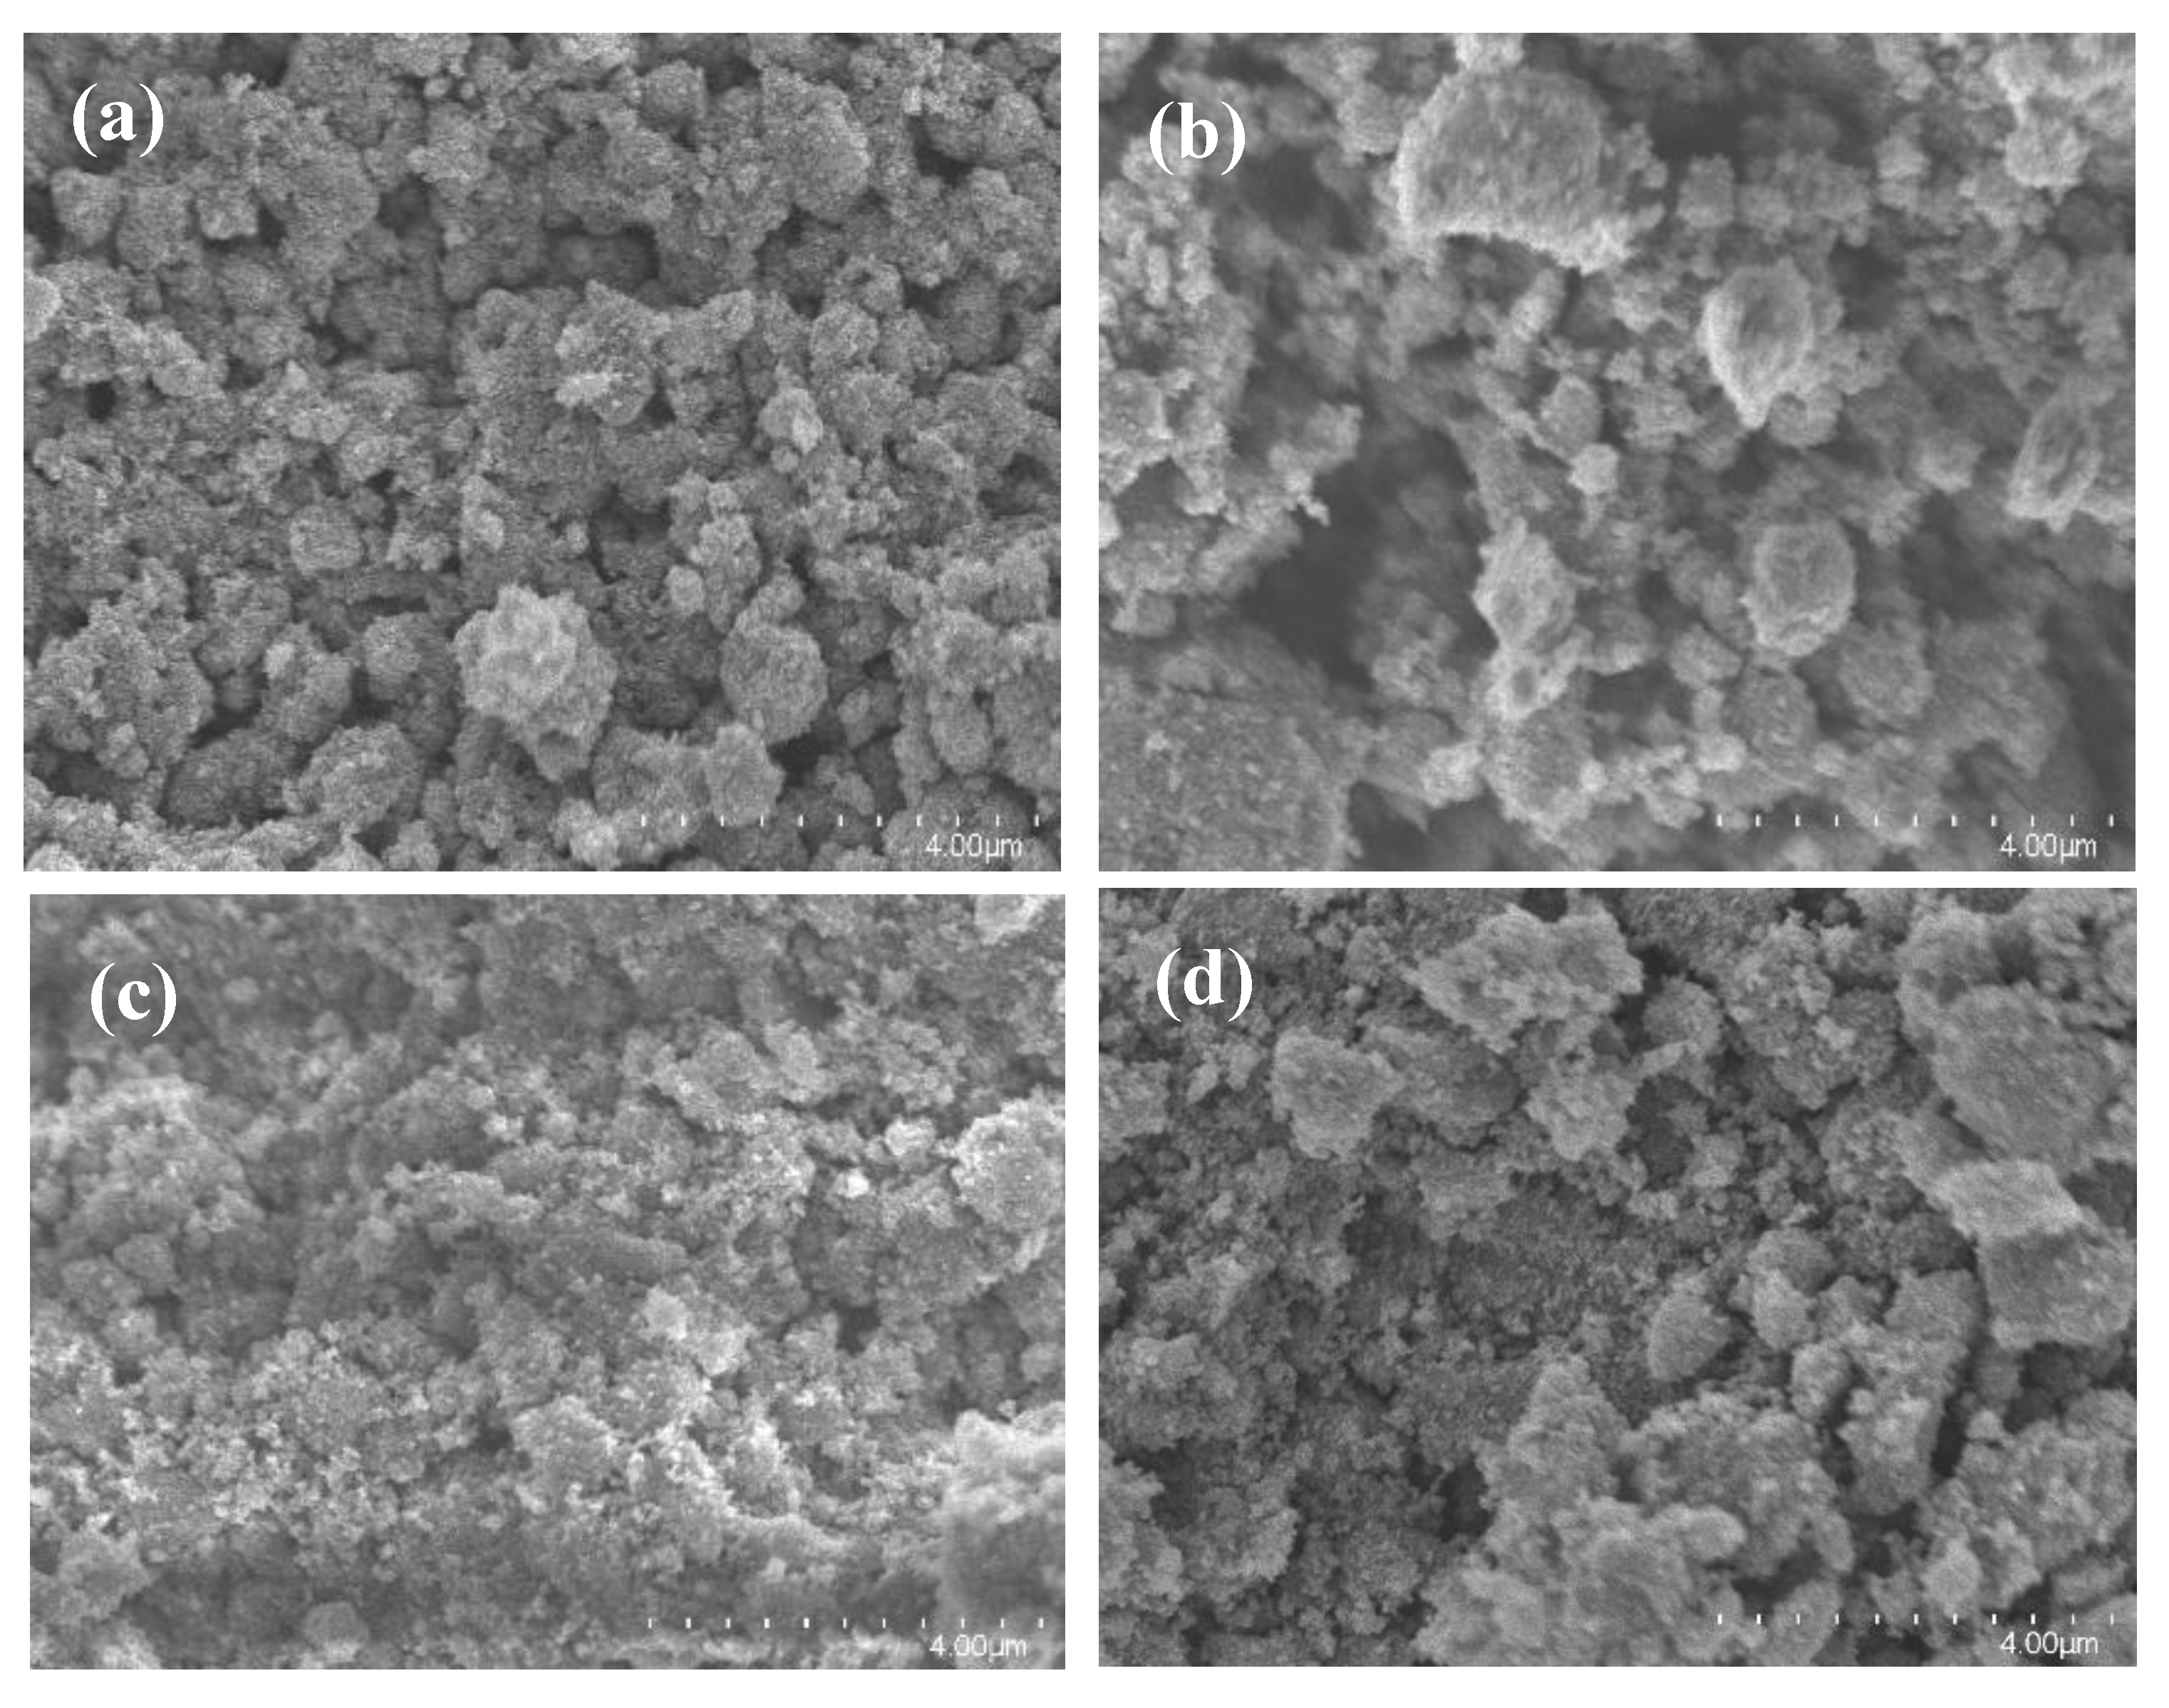
2.2.3. SEM
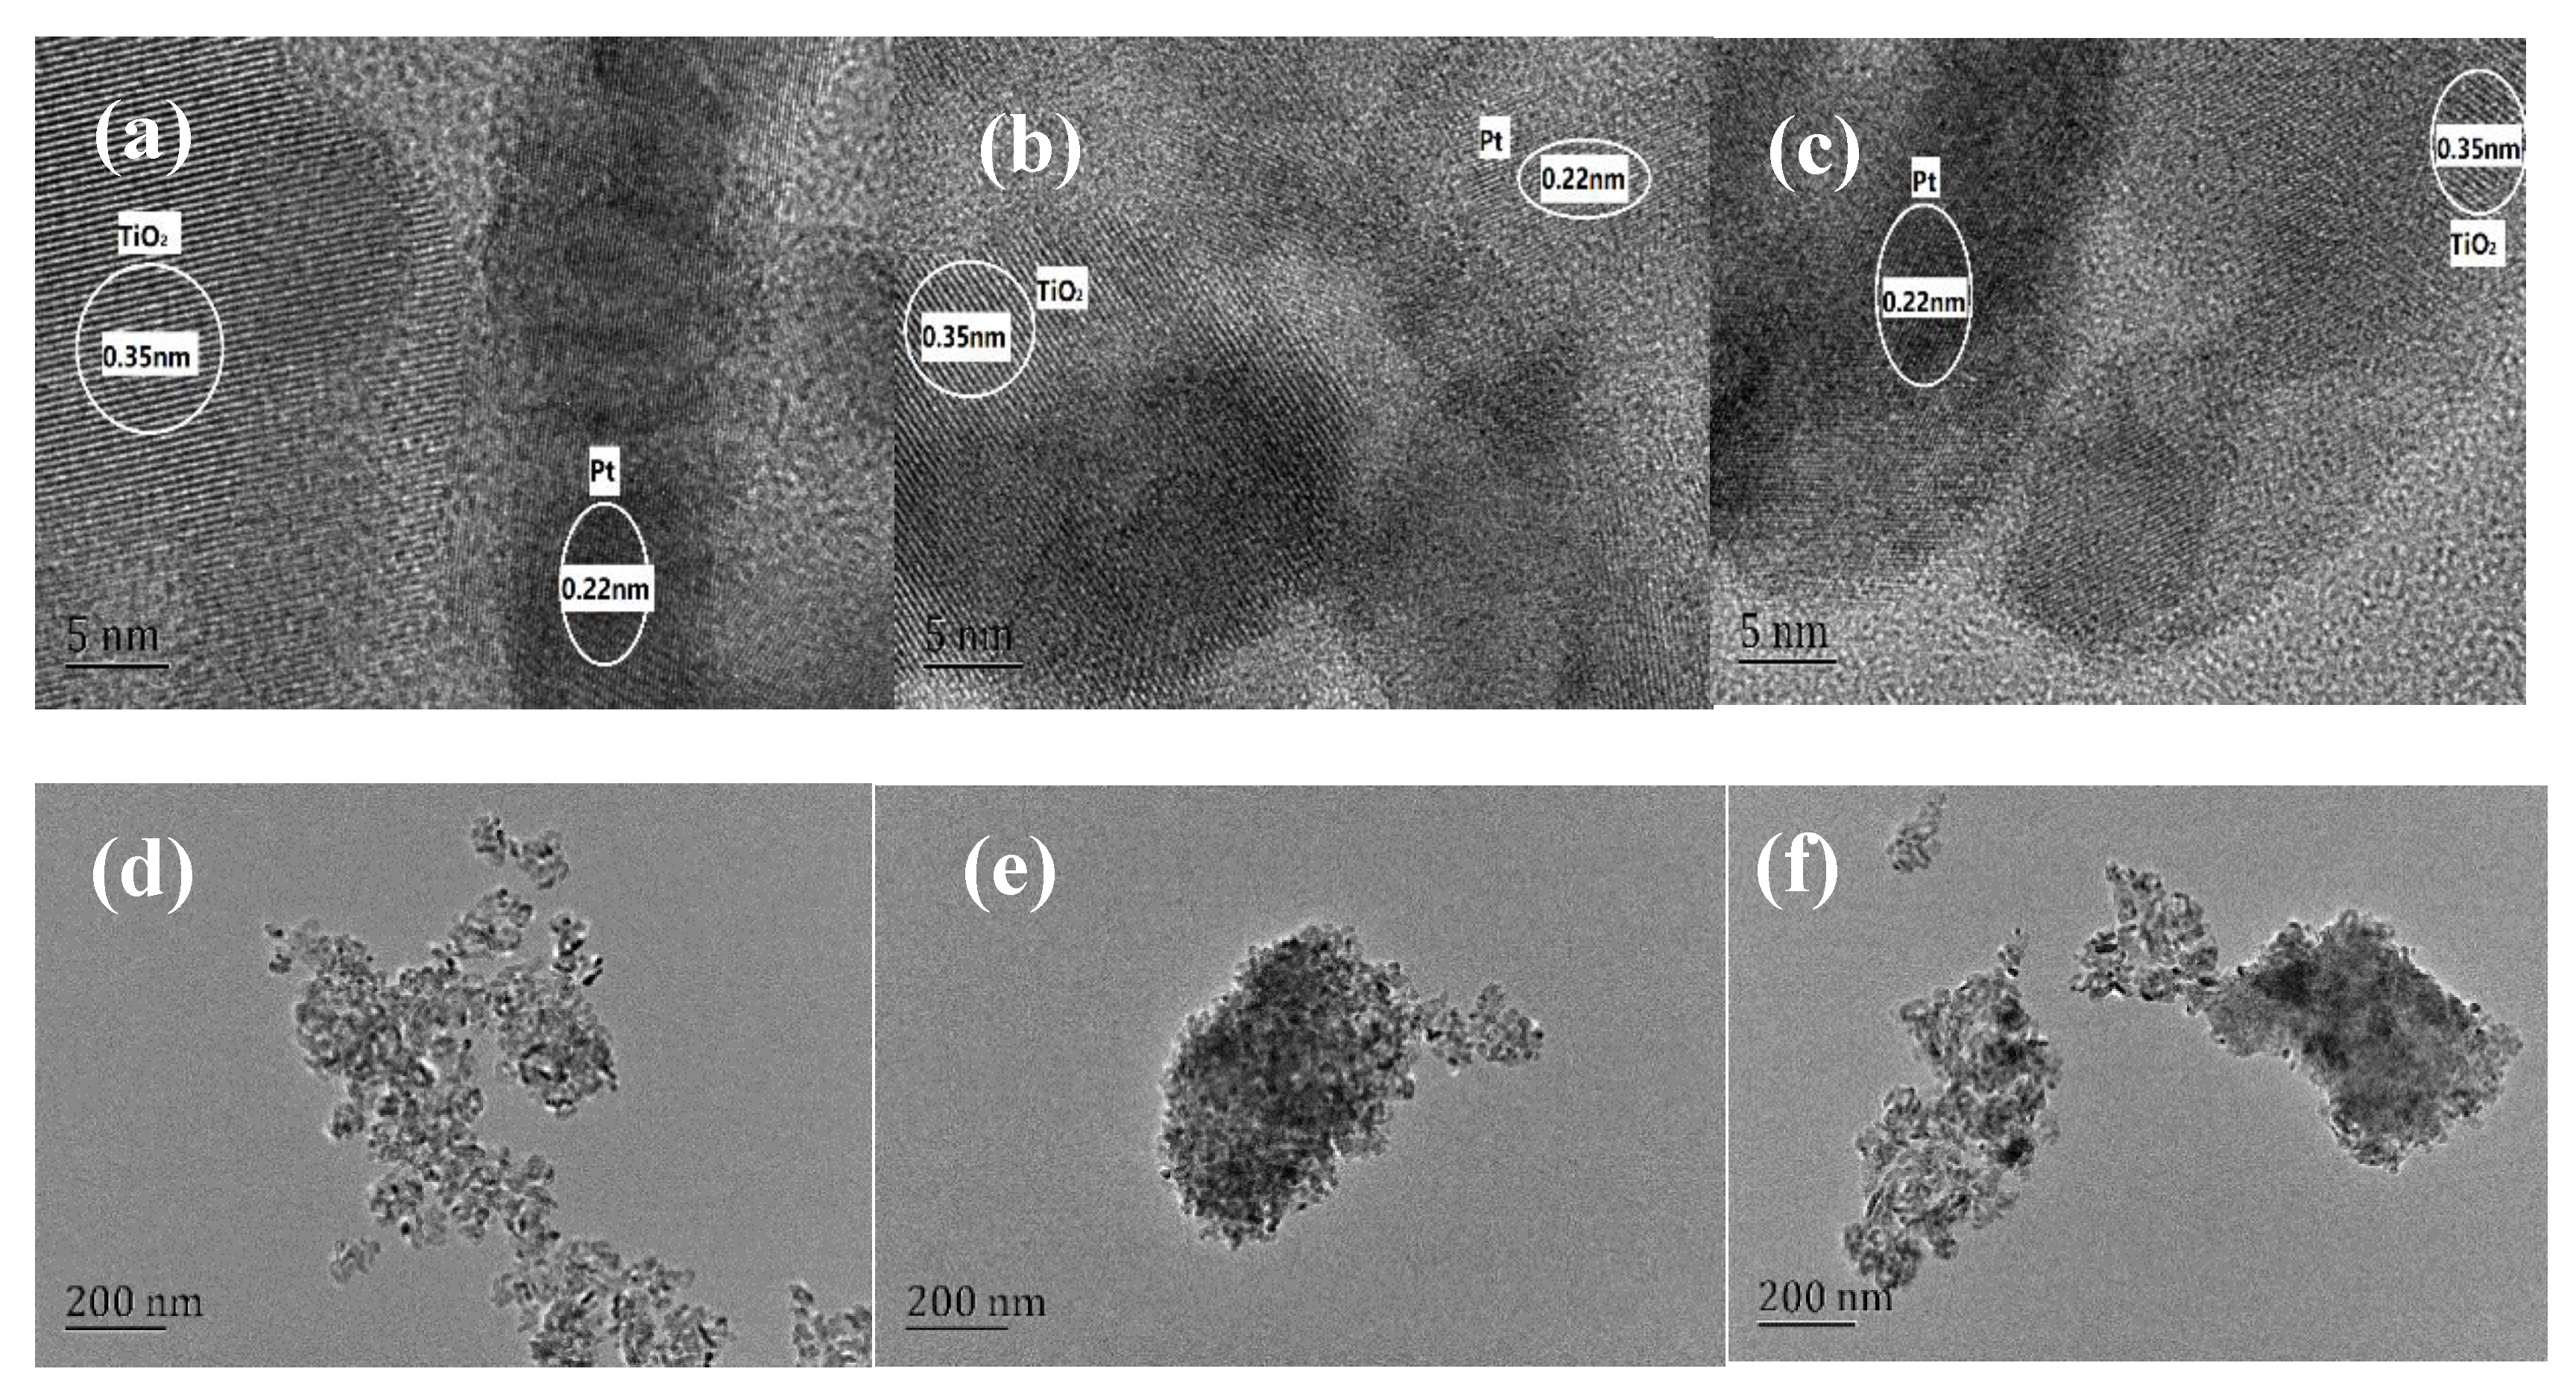
2.2.4. TEM and CO Chemisorption Test
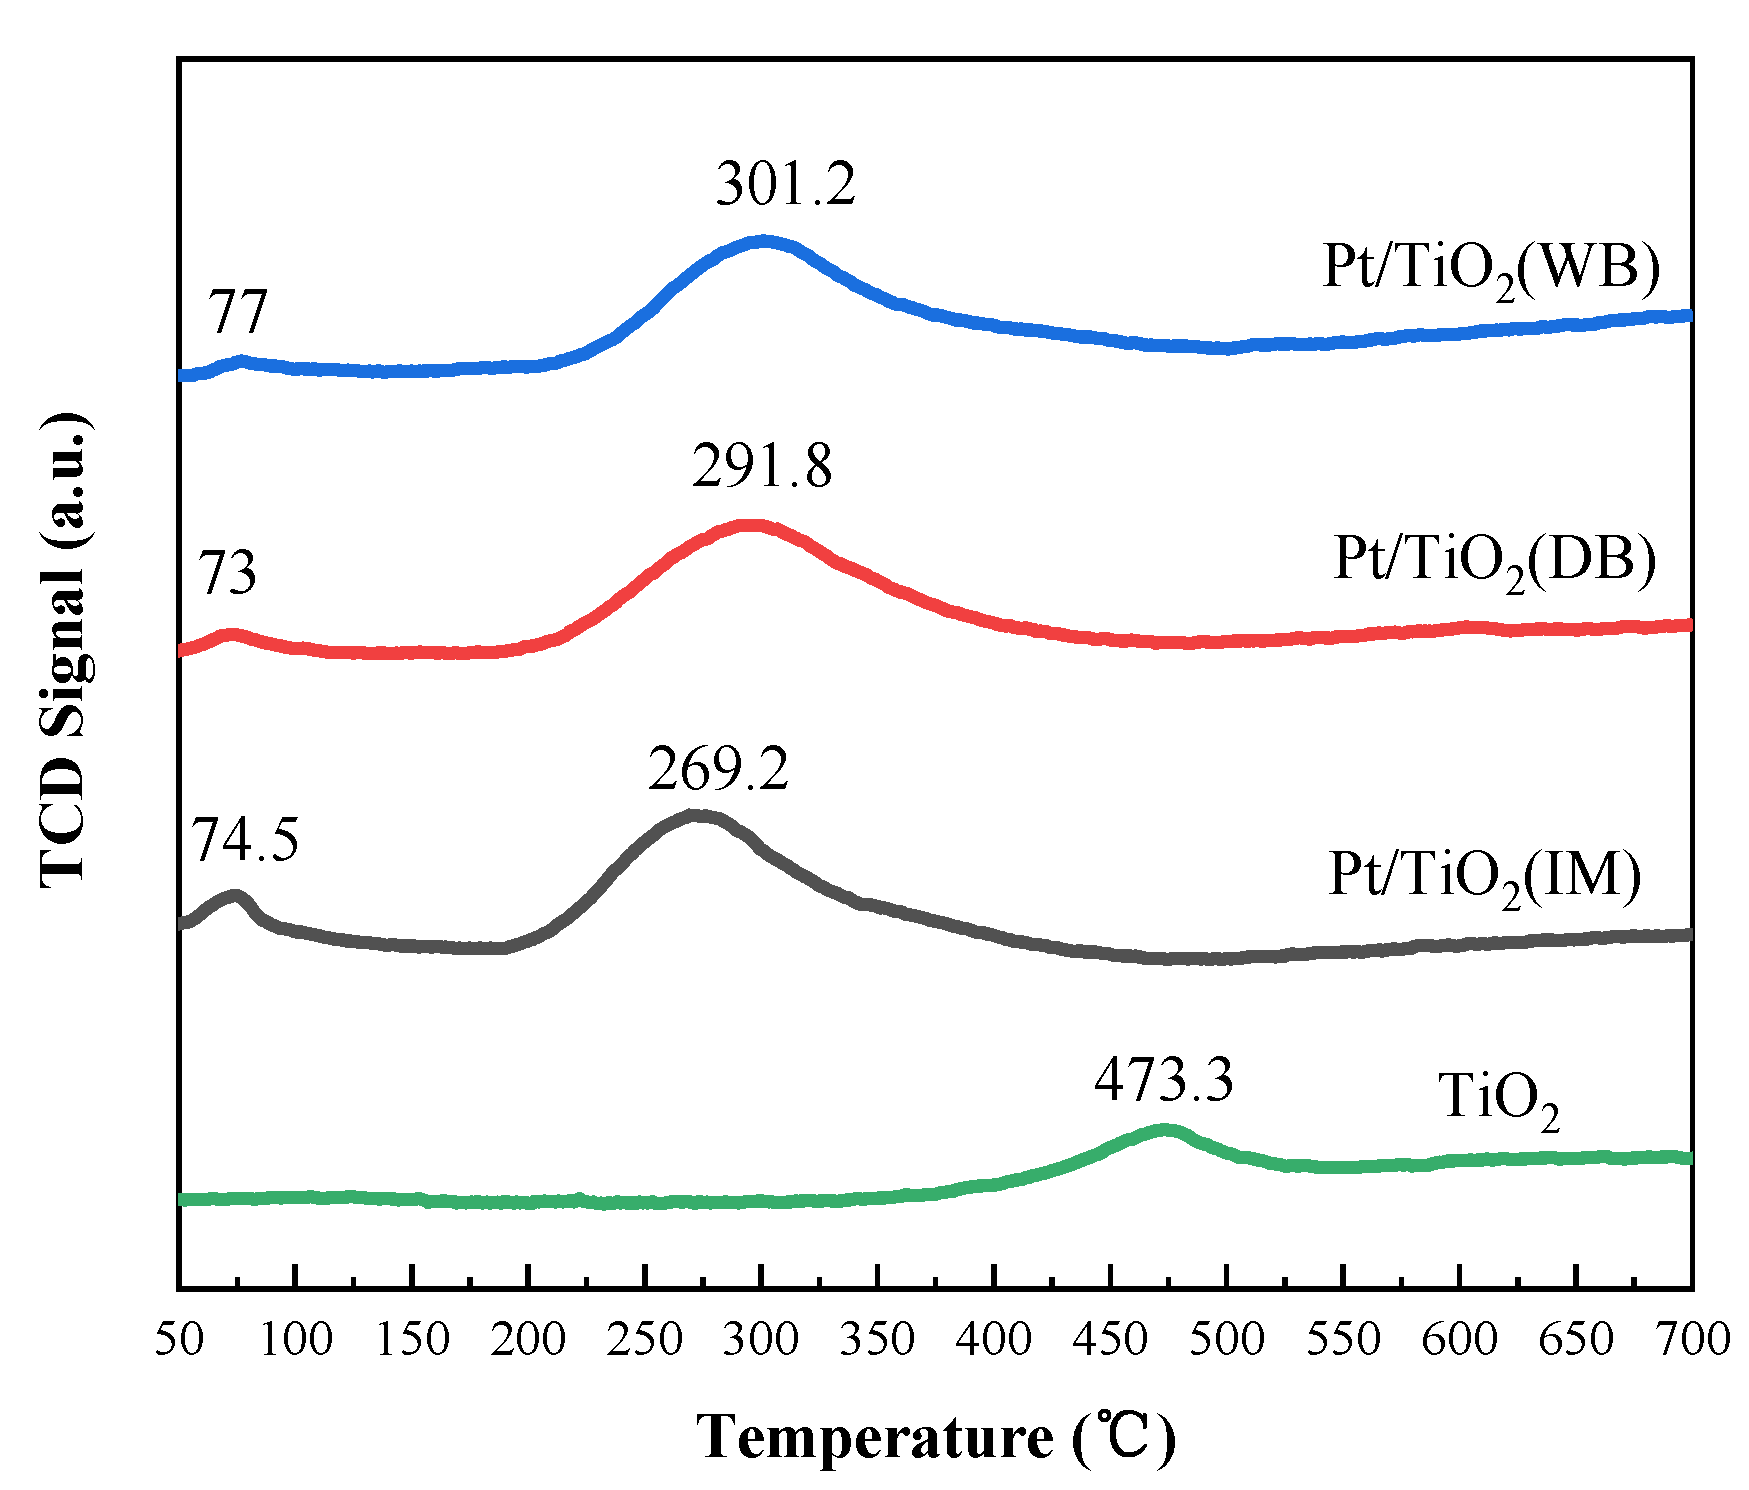
2.2.5. H2-TPR
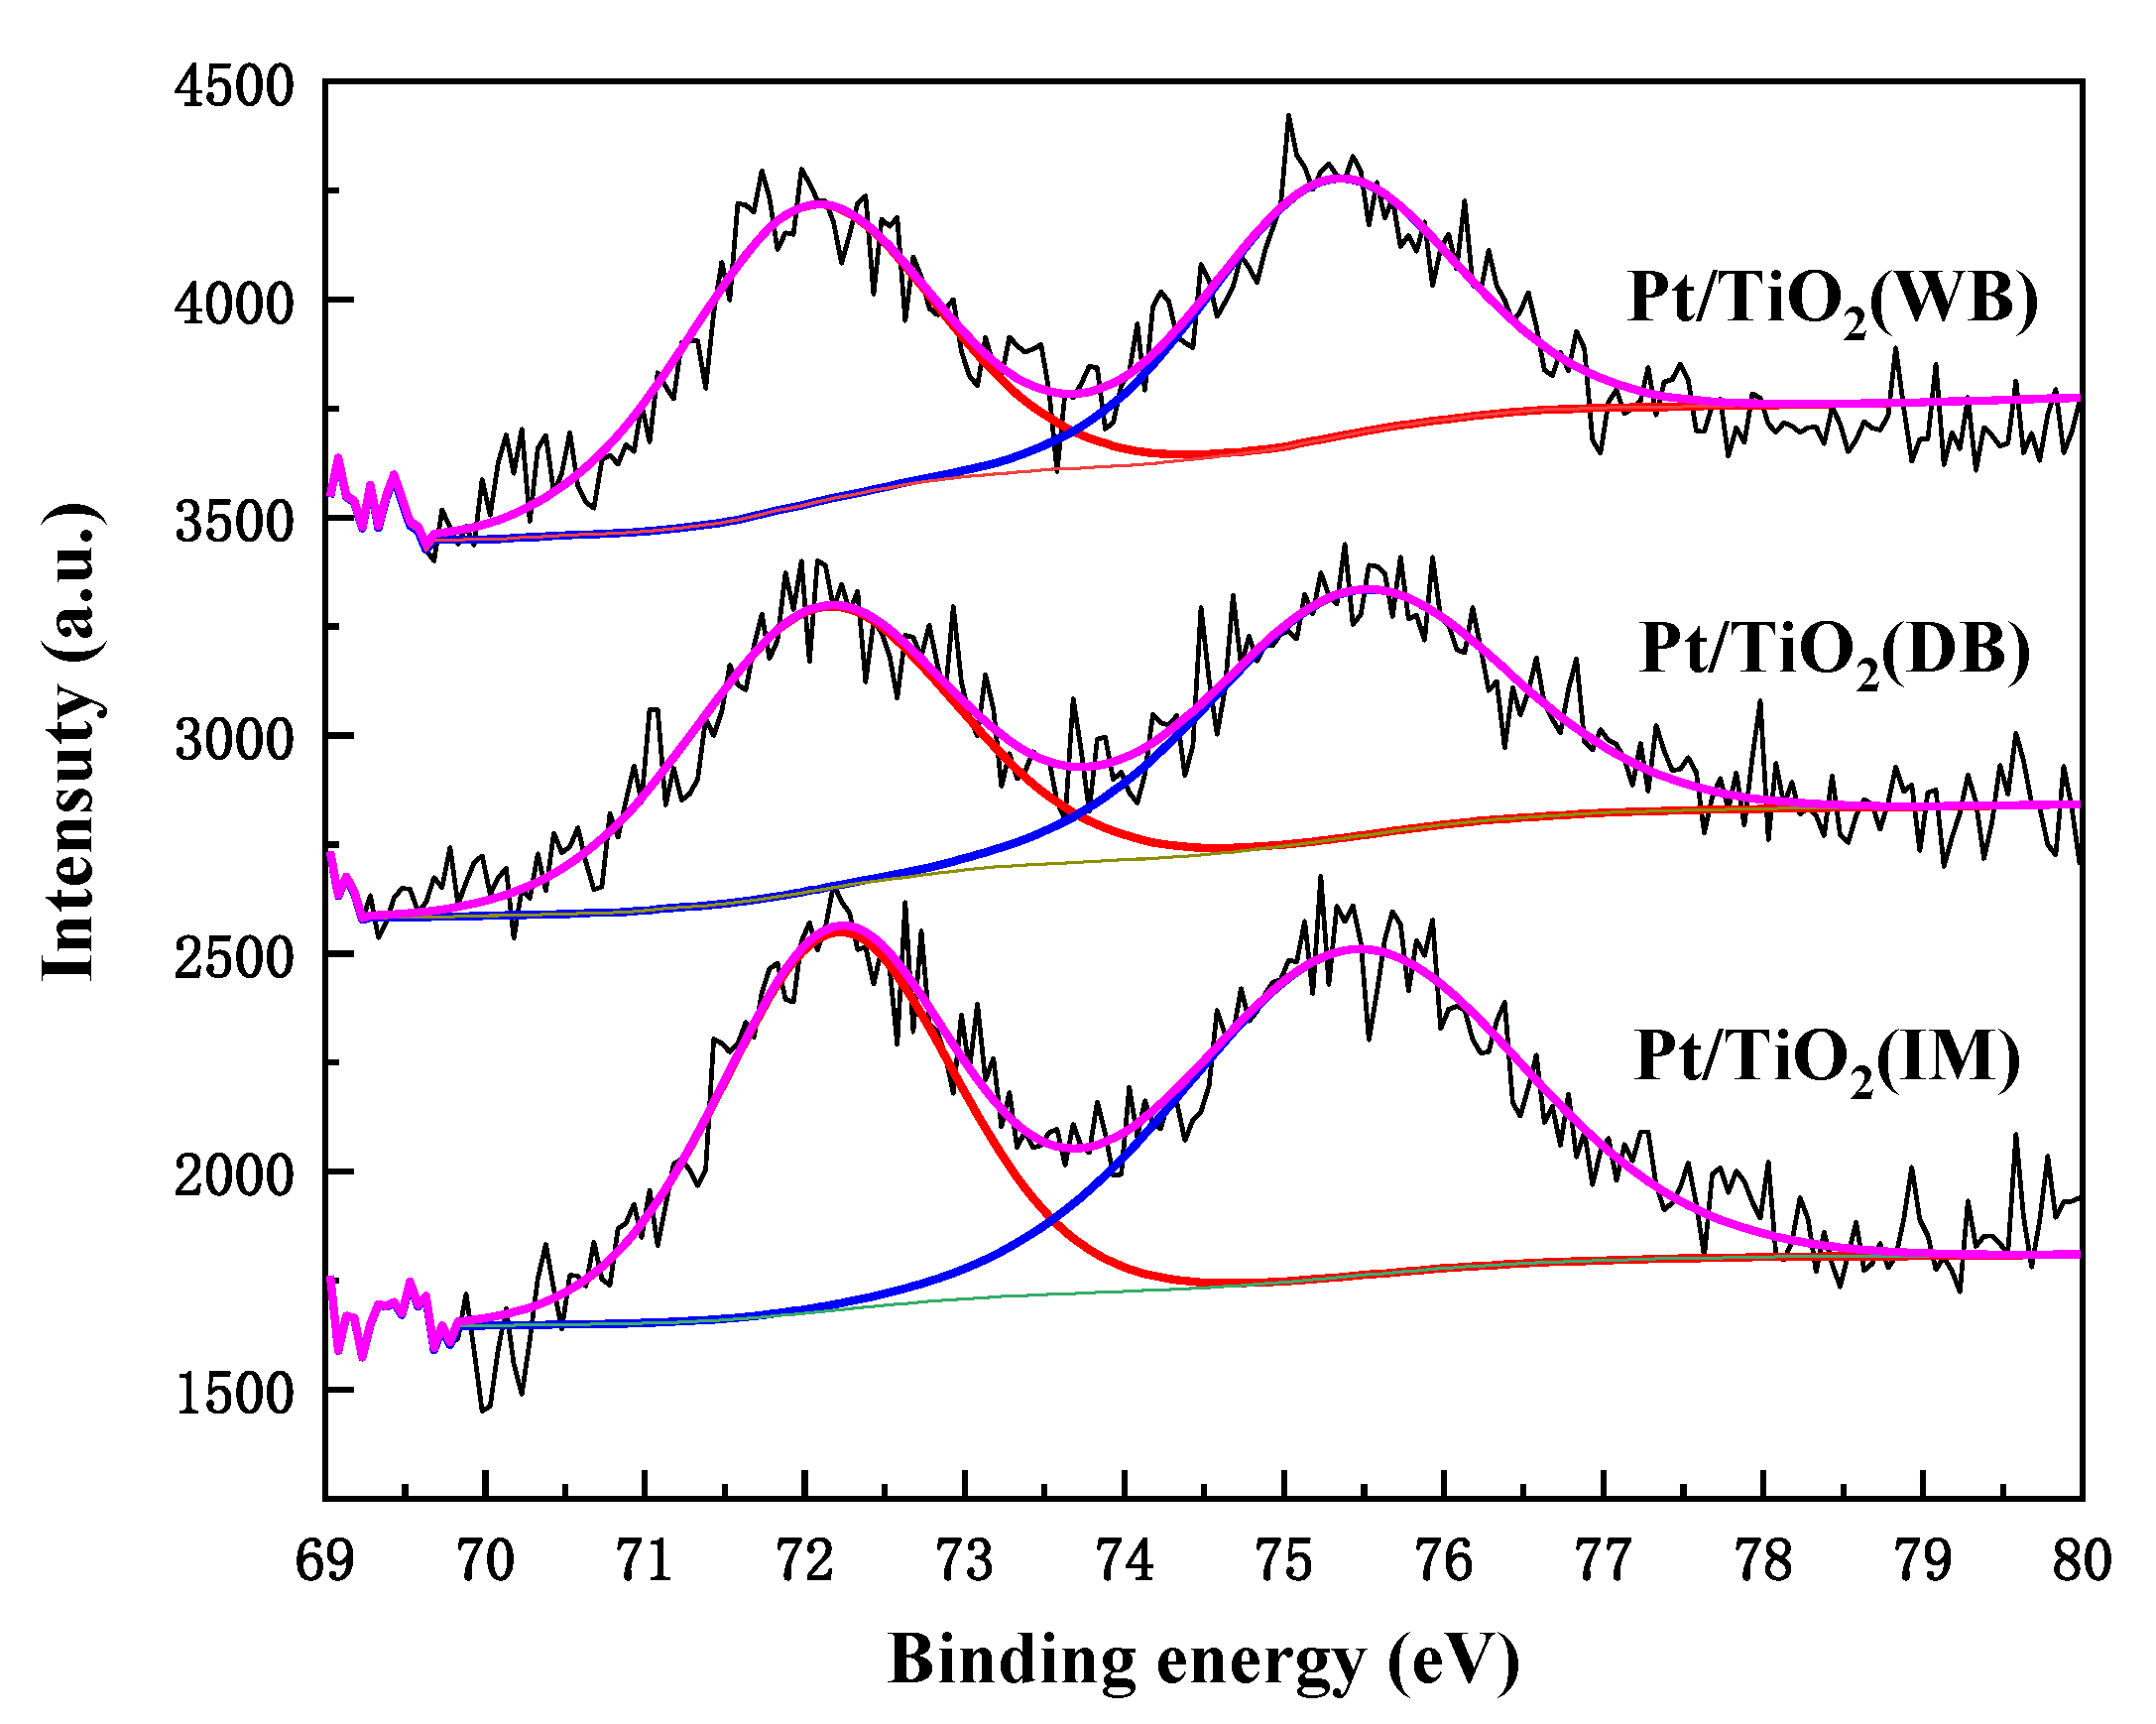
2.2.6. XPS
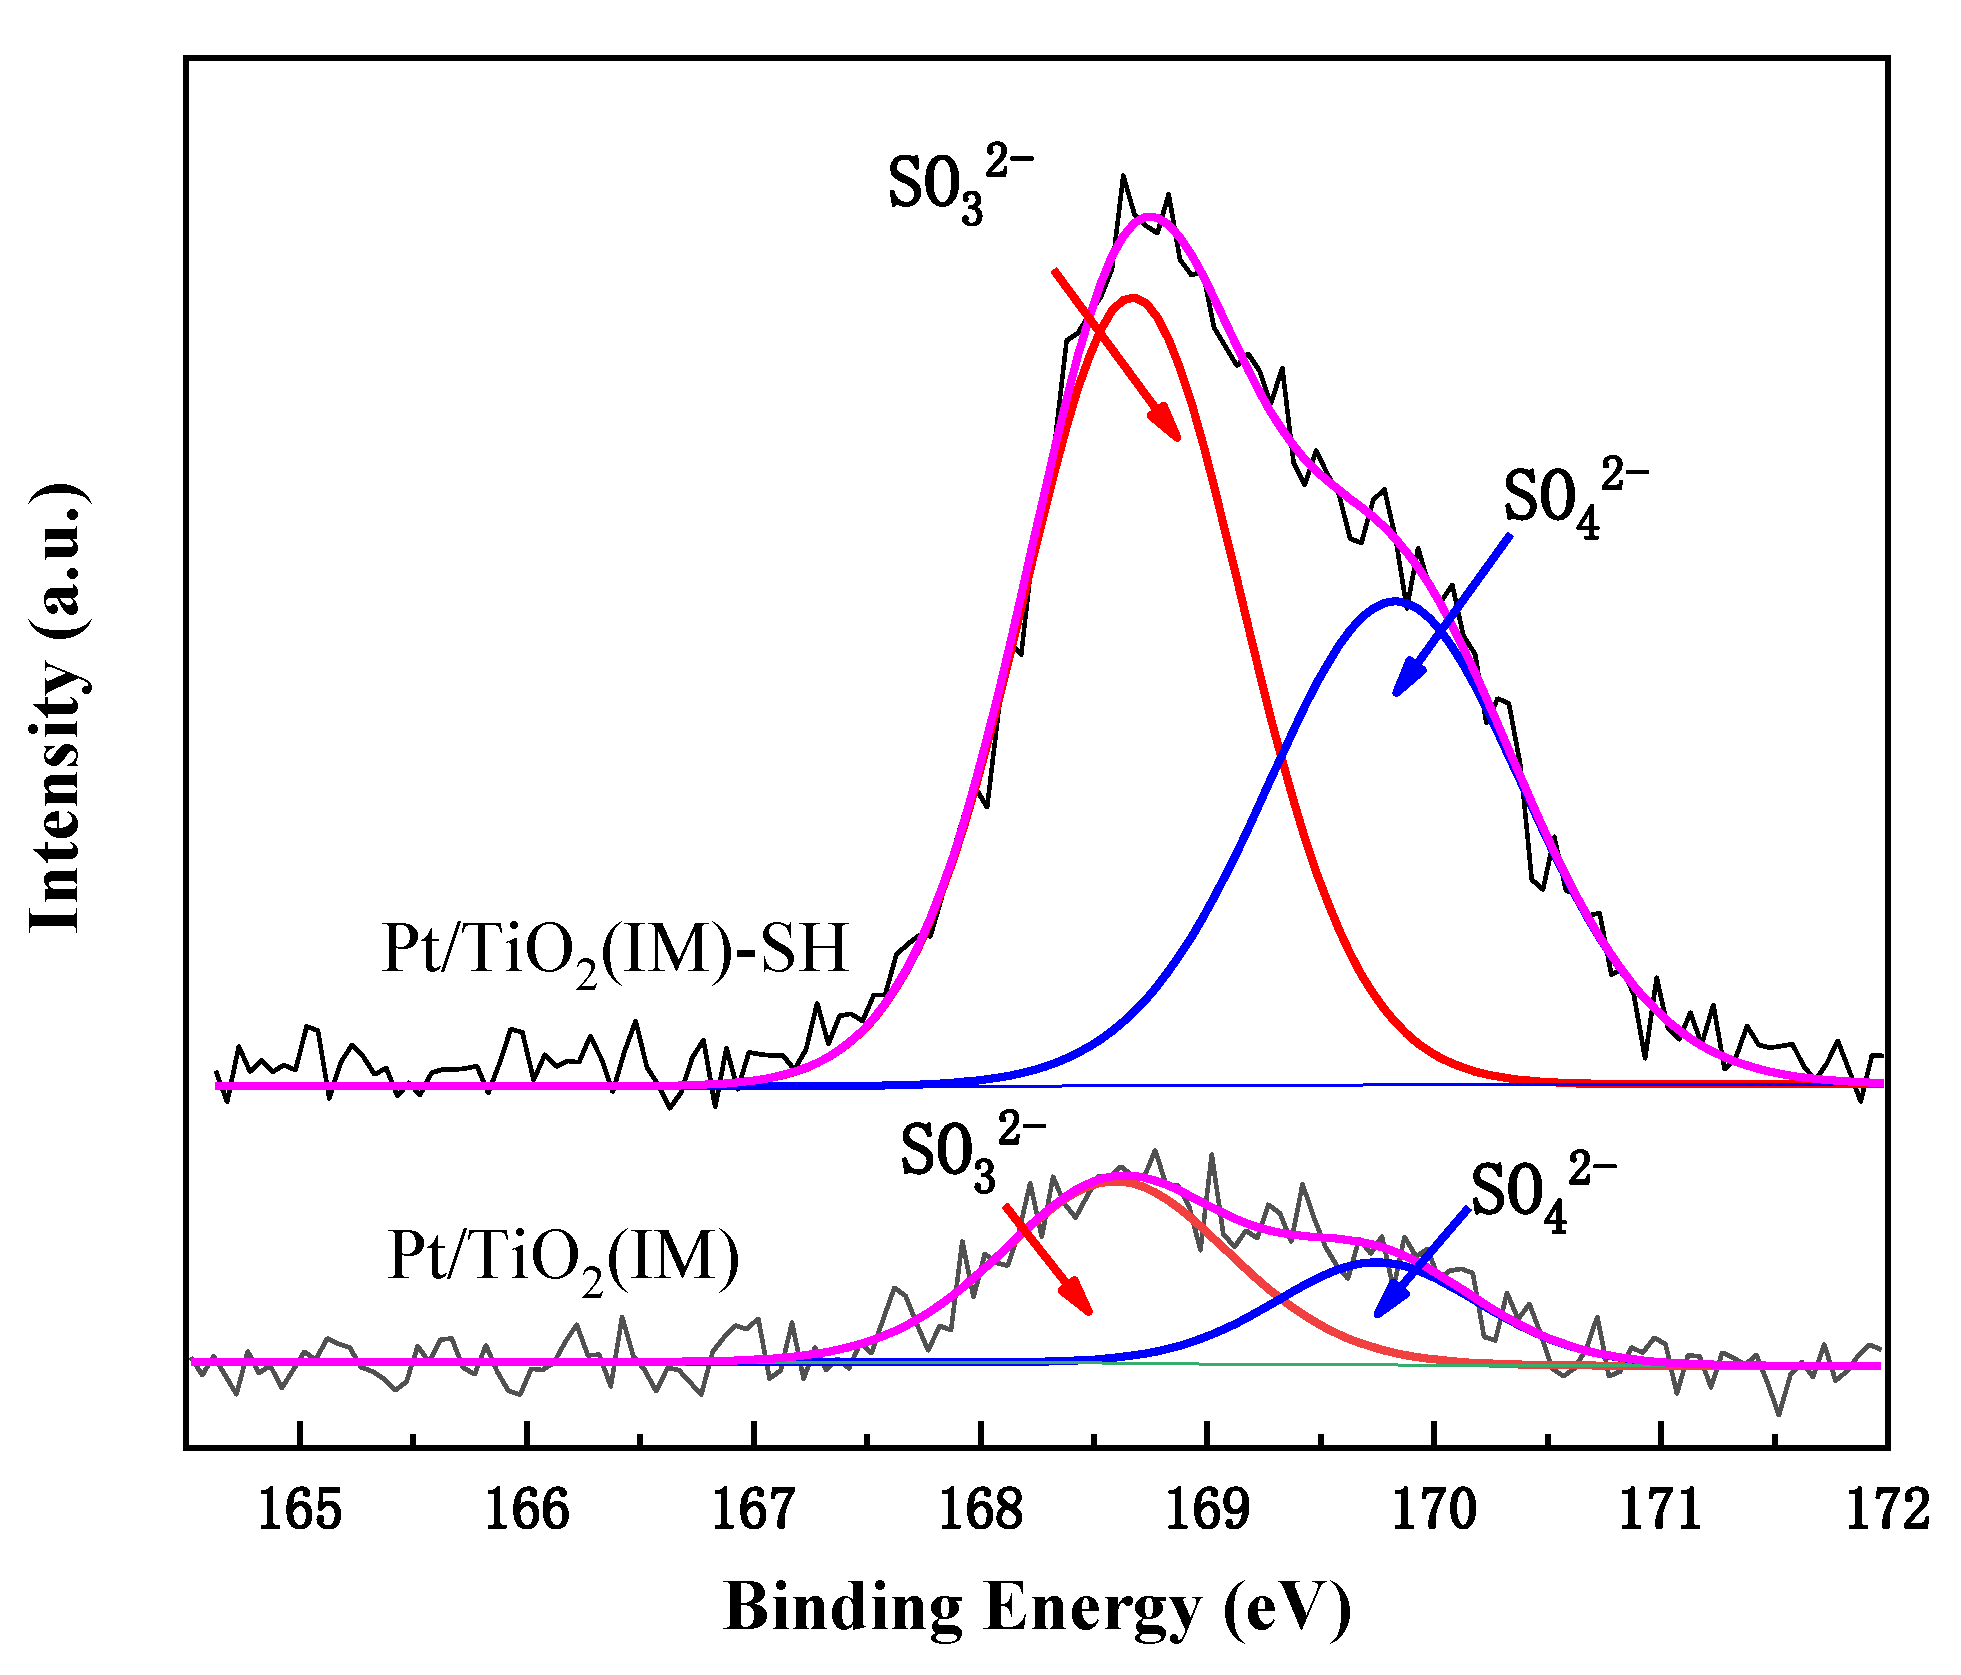
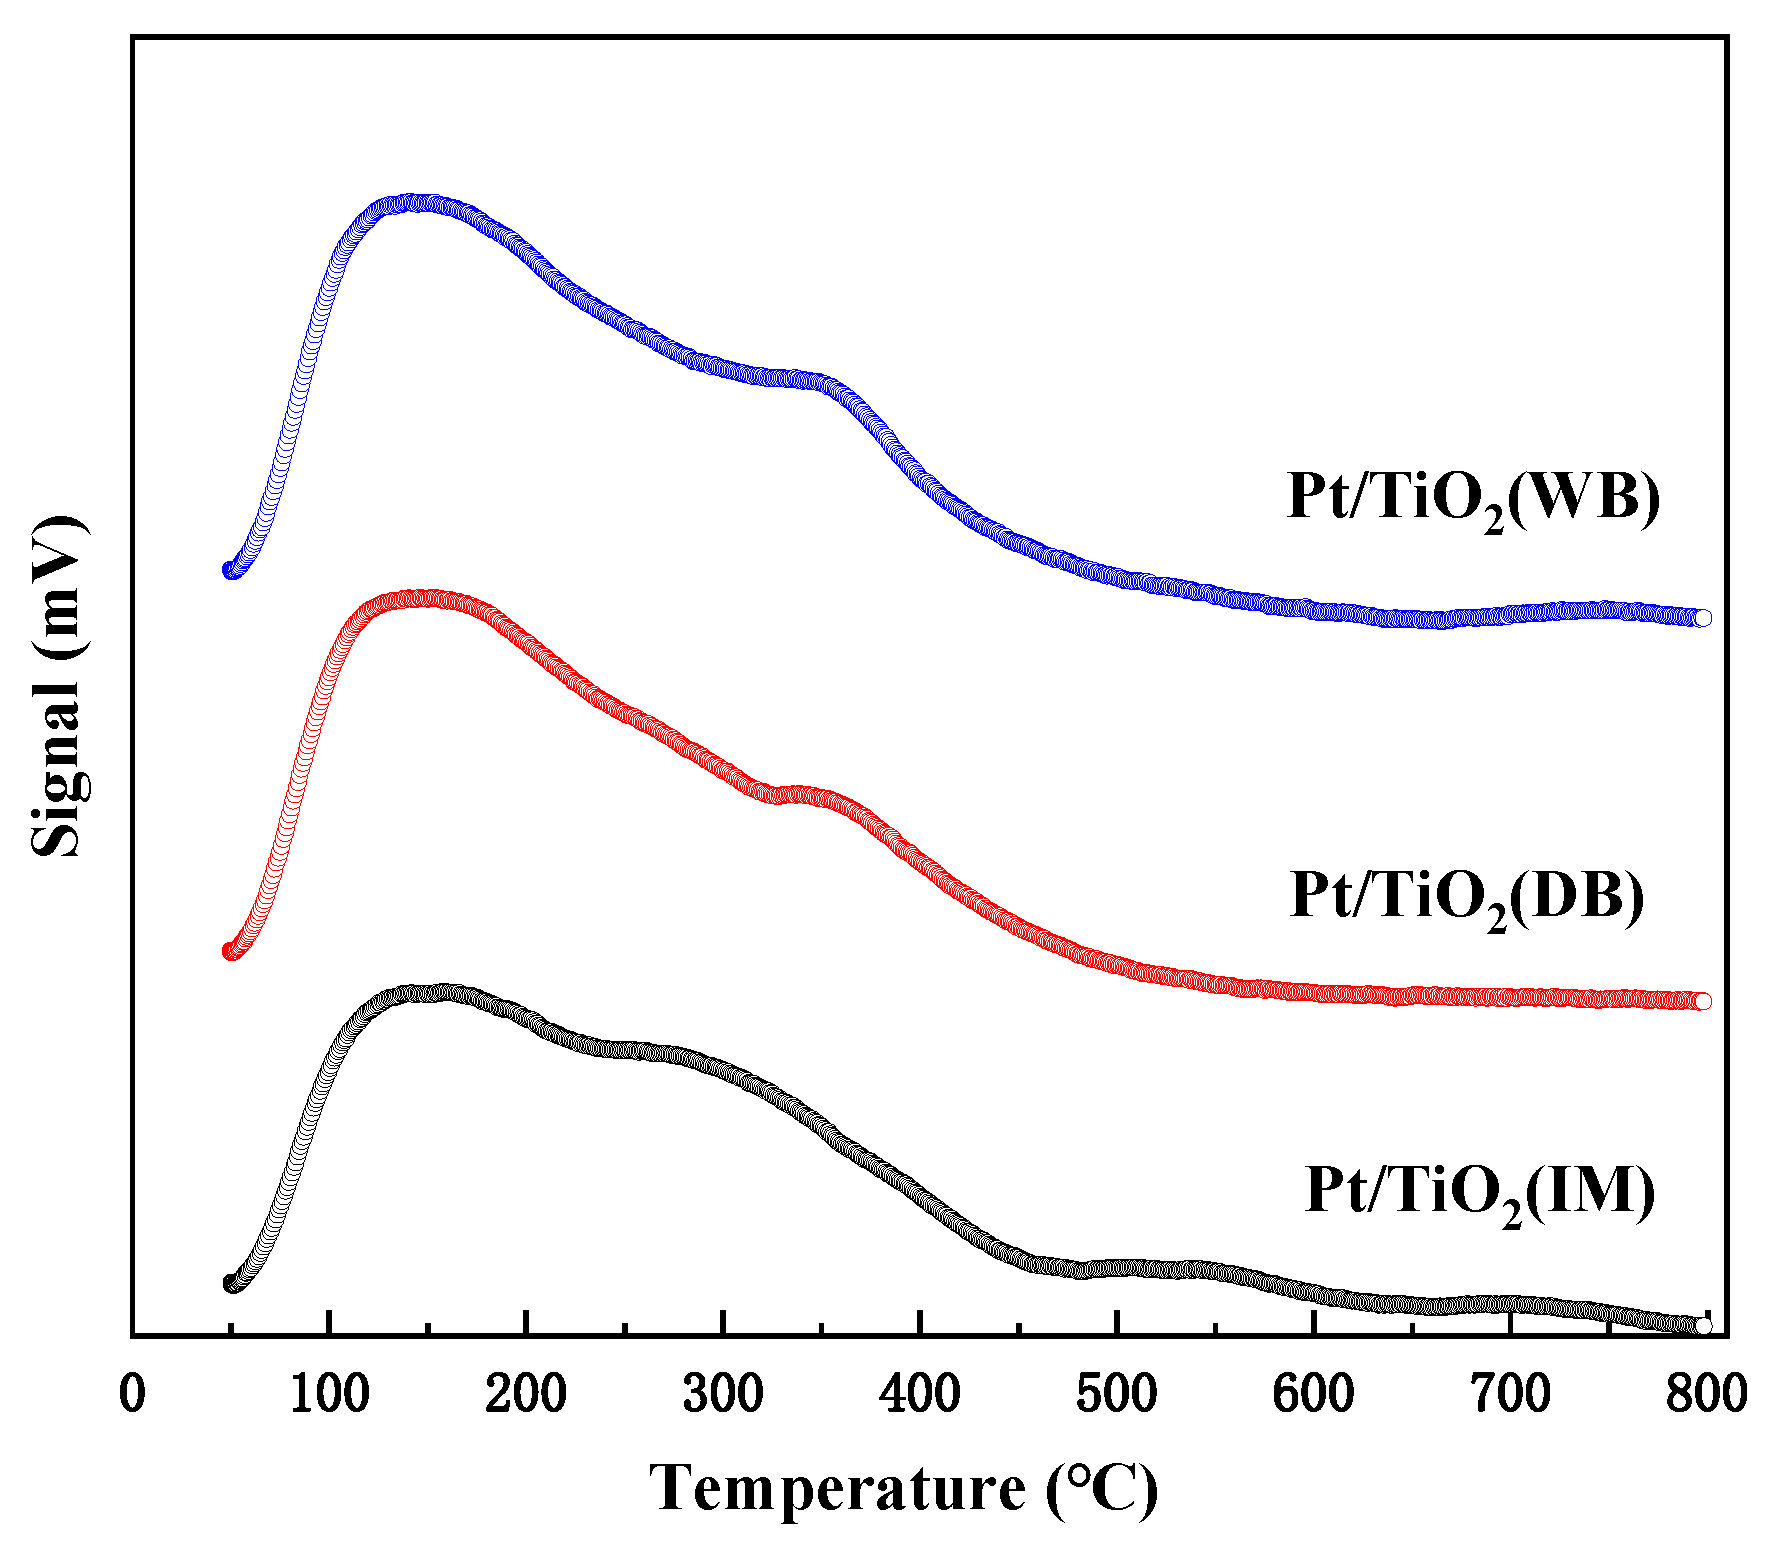
2.2.7. SO2-TPD
3. Materials and Methods
3.1. Catalyst Preparation
3.2. Catalyst Characterization
3.3. Evaluation of Catalytic Performance
4. Conclusions
Author Contributions
Funding
Conflicts of Interest
References
- Lee, H.U.; Choi, J.H.; Yeo, Y.K.; Song, H.G.; Na, B.G. Effect of Evacuation and Rinse Conditions on Performance in PSA Process for CO2 Recovery. Korean Chem. Eng. Res. 2000, 38, 809–816. [Google Scholar]
- Oommen, L.P.; Narayanappa, K.G. Assimilative Capacity approach for air pollution control in automotive engines through magnetic field-assisted combustion of hydrocarbons. Environ. Sci. Pollut. Res. 2021. [Google Scholar] [CrossRef]
- Dey, S.; Chandra, D.G. Controlling carbon monoxide emissions from automobile vehicle exhaust using copper oxide catalysts in a catalytic converter. Mater. Today Chem. 2020, 17. [Google Scholar] [CrossRef]
- Nguyen, V.; Salama, M.; Fernandez, D.; Sperling, J.D.; Regina, A.; Rivera, R.; Wang, J.; Friedman, B.W.; Smith, S.W. Comparison between carbon monoxide poisoning from hookah smoking versus other sources. Clin. Toxicol. 2020, 58, 1320–1325. [Google Scholar] [CrossRef] [PubMed]
- Yang, C.; Zhao, Z.Z.; Liu, Q.J. Theoretical study of CO oxidation on Au-1/Co3O4 (110) single atom catalyst using density functional theory calculations. Mater. Sci. Semicond. Process. 2020, 123. [Google Scholar] [CrossRef]
- Gao, F.Y.; Yan, H.; Tang, X.L.; Yi, H.H.; Zhao, S.Z.; Yu, Q.J.; Ni, S.Q. Simultaneous removal of gaseous CO and elemental mercury over Cu-Co modified activated coke at low temperature. J. Environ. Sci. 2021, 101, 36–48. [Google Scholar] [CrossRef] [PubMed]
- Li, J.; Ma, Z.F.; Liu, X.Q.; Yao, H.Q. Density functional theory calculations of carbon monoxide adsorption on activated carbon loaded with cuprous salt. Acta Chim. Sin. 2005, 63, 903–908. [Google Scholar]
- Huang, S. Optimization and improvement of carbon monoxide cryogenic separation process. Mod. Chem. Ind. 2019, 39, 185–188. [Google Scholar]
- Hogendoorn, J.A.; Swaaij, W.P.M.V.; Versteeg, G.F. The absorption of carbon monoxide in COSORB solutions: Absorption rate and capacity. Chem. Eng. J. Biochem. Eng. J. 1995, 59, 243–252. [Google Scholar] [CrossRef] [Green Version]
- Khan, F.I.; Ghoshal, A.K. Volatile organic compounds control: Best possible techniques. Chem. Eng. World 1999, 34, 103–124. [Google Scholar]
- Saavedra, J.; Whittaker, T.; Chen, Z.F.; Pursell, C.J.; Rioux, R.M.; Chandler, B.D. Controlling activity and selectivity using water in the Au-catalysed preferential oxidation of CO in H2. Nat. Chem. 2016, 8, 584–589. [Google Scholar] [CrossRef]
- Guan, H.L.; Lin, J.; Li, L.; Wang, X.D.; Zhang, T. Highly active subnano Rh/Fe(OH)x catalyst for preferential oxidation of CO in H2-rich stream. Appl. Catal. B Environ. 2016, 184, 299–308. [Google Scholar] [CrossRef]
- Wang, C.; Gu, X.K.; Yan, H.; Yue, L.; Liu, J. Water-mediated Mars-Van Krevelen mechanism for CO oxidation on Ceria supported single-atom Pt1 Catalyst. Acs Catal. 2017, 7, 887–891. [Google Scholar] [CrossRef]
- Lou, Y.; Liu, J.Y. A highly active Pt-Fe/γ-Al2O3 catalyst for preferential oxidation of CO in excess of H2 with a wide operation temperature window. Chem. Commun. 2017, 53, 9020–9023. [Google Scholar] [CrossRef] [PubMed] [Green Version]
- Chen, Y.; Lin, J.; Pan, X.; Zhang, T. Local structure of Pt species dictates remarkable performance on Pt/Al2O3 for preferential oxidation of CO in H2. Appl. Catal. B Environ. 2021, 282. [Google Scholar] [CrossRef]
- Kim, H.J.; Jang, M.G.; Shin, D.; Han, J.W. Design of Ceria Catalysts for Low-Temperature CO Oxidation. ChemCatChem 2020, 12, 11–26. [Google Scholar] [CrossRef] [Green Version]
- Ince, T.; Uysal, G.; Akin, A.N.; Ldirim, R.Y. Selective low temperature CO oxidation over Pt-Co-Ce/Al2O3 in hydrogen rich stream. Appl. Catal. Gen. 2005, 292, 171–176. [Google Scholar] [CrossRef]
- Son, I.H.; Lane, A.M.; Johnson, D.T. The study of the deactivation of water-pretreated Pt/g-Al2O3 for low-temperature selective CO oxidation in hydrogen. J. Power Sources 2003, 124, 415–419. [Google Scholar] [CrossRef]
- Boubnov, A.; Dahl, S.; Johnson, E.; Molina, A.P.; Simonsen, S.B.; Cano, A.; Helveg, F.M.; Lemus-Yegres, L.J.; Grunwaldt, J. Structure activity relationships of Pt/Al2O3 catalysts for CO and NO oxidation at diesel exhaust conditions. Appl. Catal. B Environ. 2012, 126, 315–325. [Google Scholar] [CrossRef]
- Liu, H.; Zhou, Y.; Zhang, Y.; Bai, L.; Tang, M. Effect of Preparation Processes on Catalytic Performance of PtSnNa/ZSM-5 for Propane Dehydrogenation. Ind. Eng. Chem. Res. 2009, 48, 5598–5603. [Google Scholar] [CrossRef]
- Abdelsayed, V.; Saoud, K.M.; El-Shall, M.S. Vapor phase synthesis and characterization of bimetallic alloy and supported nanoparticle catalysts. J. Nanopart. Res. 2006, 8, 519–531. [Google Scholar] [CrossRef]
- Min, B.K.; Friend, C.M. Heterogeneous Gold-Based Catalysis for Green Chemistry: Low Temperature CO Oxidation and Propene Oxidation. Chem. Rev. 2007, 107, 2709–2724. [Google Scholar] [CrossRef]
- Dey, S.; Dhal, G.C. Property and structure of various platinum catalysts for low-temperature carbon monoxide oxidations. Mater. Today Chem. 2020, 16. [Google Scholar] [CrossRef]
- Hong, X.W.; Sun, Y. Effect of Preparation Methods on the Performance of Pt/CeO2 Catalysts for the Catalytic Oxidation of Carbon Monoxide. Catal. Lett. 2016, 146, 2001–2008. [Google Scholar] [CrossRef]
- Smirnov, M.Y.; Kalinkin, A.V.; Pashis, A.V.; Prosvirin, I.P.; Bukhtiyarov, V.I. Interaction of SO2 with Pt Model Supported Catalysts Studied by XPS. J. Phys. Chem. C. 2014, 118, 22120–22135. [Google Scholar] [CrossRef]
- Taira, K.; Einaga, H. The Effect of SO2 and H2O on the Interaction Between Pt and TiO2(P-25) During Catalytic CO Oxidation. Catal. Lett. 2019, 149, 965–973. [Google Scholar] [CrossRef]
- Qi, L.F.; Cheng, B.; Yu, J.G.; Ho, W.K. High-surface area mesoporous Pt/TiO2 hollow chains for efficient formaldehyde decomposition at ambient temperature. J. Hazard. Mater. 2016, 301, 522–530. [Google Scholar] [CrossRef] [PubMed]
- Su, Y.; Ji, K.M.; Xun, J.Y.; Zhang, K.; Li, P.; Zhao, L. Catalytic oxidation of low concentration formaldehyde over Pt/TiO2 catalyst. Chin. J. Chem. Eng. 2021, 29, 190–195. [Google Scholar] [CrossRef]
- Qi, L.F.; Yu, J.G.; Mietek, J. Preparation and enhanced visible-light photocatalytic H2-production activity of CdS-sensitized Pt/TiO2 nanosheets with exposed (001) facets. Phys. Chem. Chem. Phys. 2011, 13, 8915–8923. [Google Scholar] [CrossRef] [PubMed]
- Qiao, B.; Wang, A.; Yang, X.; Allard, L.F.; Jiang, Z.; Cui, Y.; Liu, J.; Li, J.; Tao, Z. Single-atom catalysis of CO oxidation using Pt1/FeOx. Nat. Chem. 2011, 3, 634–641. [Google Scholar] [CrossRef] [PubMed]
- Wang, Z.W.; Bi, L.I.; Chen, M.S.; Weng, W.Z.; Wan, H.L. Size and support effects for CO oxidation on supported Pd catalysts. Sci. China Chem. 2010, 53, 2047–2056. [Google Scholar] [CrossRef] [Green Version]
- Corma, A.; Concepción, P.; Boronat, M.; Sabater, M.J.; Navas, J.; Yacaman, M.J.; Larios, E.; Posadas, A.; López-Quintela, M.A.; Buceta, D.; et al. Exceptional oxidation activity with size-controlled supported gold clusters of low atomicity. Nat. Chem. 2013, 5, 775–781. [Google Scholar] [CrossRef] [Green Version]
- Cargnello, M.; Doan-Nguyen, V.V.T.; Gordon, T.R.; Diaz, R.E.; Stach, E.A.; Gorte, R.J.; Fornasiero, P.; Murray, C.B. Control of metal nanocrystal size reveals metal-support interface role for ceria catalysts. Science 2013, 341, 771–773. [Google Scholar] [CrossRef] [Green Version]
- Zhang, C.; He, H.; Tanaka, K.I. Catalytic performance and mechanism of a Pt/TiO2 catalyst for the oxidation of formaldehyde at room temperature. Appl. Catal. B Environ. 2006, 65, 37–43. [Google Scholar] [CrossRef]
- Epling, W.S.; Cheekatamarla, P.K.; Lane, A.M. Reaction and surface characterization studies of titania-supported Co, Pt and Co/Pt catalysts for the selective oxidation of CO in H2-containing streams. Chem. Eng. J. 2003, 93, 61–68. [Google Scholar] [CrossRef]
- Zhu, X.; Shen, M.; Lobban, L.L.; Mallinson, R.G. Structural effects of Na promotion for high water gas shift activity on Pt-Na/TiO2. J. Catal. 2011, 278, 123–132. [Google Scholar] [CrossRef]
- Wang, L.; Sakurai, M.; Kameyama, H. Study of catalytic decomposition of formaldehyde on Pt/TiO2 alumite catalyst at ambient temperature. J. Hazard. Mater. 2009, 167, 399–405. [Google Scholar] [CrossRef] [PubMed]
- Alonso, F.; Riente, P.; Rodríguez-Reinoso, F.; Ruiz-Martínez, J.; Sepúlveda-Escribano, A.; Yus, M. Platinum nanoparticles supported on titania as an efficient hydrogen-transfer catalyst. J. Catal. 2008, 260, 113–118. [Google Scholar] [CrossRef]
- Pels, J.R.; Kapteijin, F.; Moulijn, J.A.; Zhu, Q.; Thomas, K.M. Evolution of nitrogen functionalities in carbonaceous materials during pyrolysis. Carbon 1995, 33, 1641–1653. [Google Scholar] [CrossRef]
- Peng, Y.; Wang, D.; Li, B.; Wang, C.; Li, J.; Crittenden, J.C.; Hao, J. Impacts of Pb and SO2 poisoning on CeO2-WO3/TiO2-SiO2 SCR catalyst. Environ. Sci. Technol. 2017, 51, 11943. [Google Scholar] [CrossRef]
- Chen, L.Q.; Li, R.; Li, Z.B.; Yuan, F.L.; Niu, X.Y.; Zhu, Y.J. Effect of Ni doping in NixMn1-xTi10 (x= 0.1-0.5) on activity and SO2 resistance for NH3-SCR of NO studied with in situ DRIFTS. Catal. Sci. Technol. 2017, 7, 3243–3257. [Google Scholar] [CrossRef]

| Catalyst | BET Surface Area m2·g−1 | Pore Volume cm3·g−1 | Pore Size nm |
|---|---|---|---|
| TiO2 | 83 | 0.513 | 27.2 |
| Pt/TiO2(IM) | 79 | 0.411 | 20.7 |
| Pt/TiO2(DB) | 64 | 0.182 | 11.4 |
| Pt/TiO2(WB) | 78 | 0.330 | 16.7 |
| Pt/TiO2(IM)-SH | 67 | 0.290 | 17.4 |
| Pt/TiO2(DB)-SH | 55 | 0.156 | 11.2 |
| €Pt/TiO2(WB)-SH | 66 | 0.272 | 16.3 |
| Catalyst | Platinum Dispersion % | Platinum Particle Size nm | Platinum Surface Area m2·g−1 |
|---|---|---|---|
| Pt/TiO2(IM) | 85.06 | 8.89 | 0.24 |
| Pt/TiO2(DB) | 78.25 | 9.61 | 0.09 |
| Pt/TiO2(WB) | 73.19 | 10.13 | 0.03 |
Publisher’s Note: MDPI stays neutral with regard to jurisdictional claims in published maps and institutional affiliations. |
© 2021 by the authors. Licensee MDPI, Basel, Switzerland. This article is an open access article distributed under the terms and conditions of the Creative Commons Attribution (CC BY) license (https://creativecommons.org/licenses/by/4.0/).
Share and Cite
Cai, J.; Yu, Z.; Li, J. Effect of Preparation Methods on the Performance of Pt/TiO2 Catalysts for the Catalytic Oxidation of Carbon Monoxide in Simulated Sintering Flue Gas. Catalysts 2021, 11, 804. https://doi.org/10.3390/catal11070804
Cai J, Yu Z, Li J. Effect of Preparation Methods on the Performance of Pt/TiO2 Catalysts for the Catalytic Oxidation of Carbon Monoxide in Simulated Sintering Flue Gas. Catalysts. 2021; 11(7):804. https://doi.org/10.3390/catal11070804
Chicago/Turabian StyleCai, Jianyu, Zehui Yu, and Jian Li. 2021. "Effect of Preparation Methods on the Performance of Pt/TiO2 Catalysts for the Catalytic Oxidation of Carbon Monoxide in Simulated Sintering Flue Gas" Catalysts 11, no. 7: 804. https://doi.org/10.3390/catal11070804