Article

Glycerol Hydrogenolysis to 1,2-Propanediol over Novel Cu/ZrO2 Catalysts

by
Giuseppina Luciani
1,
Giovanna Ruoppolo
2,
Gianluca Landi
2,*,
Valentina Gargiulo
2,
Michela Alfè
2 and
Almerinda Di Benedetto
1
1
Dipartimento di Ingegneria Chimica, dei Materiali e della Produzione Industriale, University of Naples Federico II, P.le V. Tecchio 80, 80125 Naples, Italy
2
Institute of Sciences and Technologies for Sustainable Energy and Mobility-CNR, P.le V. Tecchio 80, 80125 Naples, Italy
*
Author to whom correspondence should be addressed.
Catalysts 2022, 12(1), 72; https://doi.org/10.3390/catal12010072
Submission received: 3 December 2021 / Revised: 29 December 2021 / Accepted: 4 January 2022 / Published: 10 January 2022

Abstract

:
Glycerol is the main by-product of biodiesel production; its upgrading to more valuable products is a demanding issue. Hydrogenolysis to 1,2-propanediol is one of the most interesting processes among the possible upgrading routes. In this study, we propose novel copper/zirconia catalysts prepared by advanced preparation methods, including copper deposition via metal–organic framework (MOF) and support preparation via the sol–gel route. The catalysts were characterized by N2 physisorption, X-ray diffraction, Scanning Electron Microscopy, H2-TPR and NH3-TPD analyses and tested in a commercial batch reactor. The catalyst prepared by copper deposition via MOF decomposition onto commercial zirconia showed the best catalytic performance, reaching 75% yield. The improved catalytic performance was assigned to a proper combination of redox and acid properties. In particular, a non-negligible fraction of cuprous oxide and of weak acid sites seems fundamental to preferentially activate the selective pathway. In particular, these features avoid the overhydrogenolysis of 1,2-propanediol to 1-propanol and enhance glycerol dehydration to hydroxyacetone and the successive hydrogenation of hydroxyacetone to 1,2-propanediol.

1. Introduction

Glycerol is the main by-product of biodiesel production, accounting for about 10 wt% of produced biodiesel [1].
In order to be used for food and/or pharmaceutical applications, crude glycerol should be upgraded and purified to almost 100% purity. However, refining is quite complex due to the presence of methanol [2].
Alternatively, glycerol valorization processes to added-value products have been proposed in order to improve the sustainability of biodiesel production [3,4,5,6,7,8,9].
In this framework, the conversion of glycerol to 1,2-propanediol (1,2-PDO) has been receiving great attention due to the broad use of 1,2-PDO as a chemical platform [10], which is largely employed as a deicing additive, cosmetic solvent, and hydraulic fluid as well as reactant in polymer synthesis including unsaturated polyester resins and polyurethanes [11,12]. 1,2-PDO is currently produced at an industrial scale by the hydrolysis of propylene oxide, which is a building block derived from non-renewable oil resources.
In this context, the conversion of glycerol to 1,2-propanediol enables the valorization of a largely abundant by-product into a high-value substrate for chemical processes, ensuring a promising green and sustainable route to promote a transition toward circular economy [13,14].
The glycerol hydrogenolysis reaction to 1,2-PDO needs a catalyst to enhance both the activity and the selectivity to the desired product. To this purpose, noble (Pt, Ru, Rh) [15,16,17,18,19,20] or transition metals (Cu, Ni, Co) [21,22] have been proposed. The former exhibit high activity but poor selectivity toward 1,2-PDO because of their overactivity causing parallel undesired C-C bond leakage [15,22]. On the other hand, transition metals-based catalysts are less active, but they have a higher selectivity and a lower cost [22,23] than noble metals. In particular, Cu has been raising great interest [24] because of its superior activity toward selective C-O bond breaking, which is required for 1,2-PDO production [24]. Thus, huge efforts have been spent toward the design of copper-based catalysts combining improved stability with significant activity and selectivity toward 1,2-PDO production.
Notably, Guo et al. showed that the catalyst support has a significant role in affecting both the activity and the selectivity of Cu species [25]. Different supports for Cu-active species were investigated, including ZnO [26], Al2O3 [27], SiO2 and some aluminosilicates [28,29,30,31], ZrO2 [32], and MgO [33]. It has been assessed that the support acidity–basicity plays a key role in catalyst activity and selectivity for glycerol hydrogenolysis [34].
Notably, Yuan et al. (2010) showed that basic oxide supports (hydrotalcite and MgO) promoted the catalytic activity of Cu-based catalysts in terms of both activity and selectivity with respect to acid supports (i.e., Al2O3, H-ZSM5) [35].
However, among the investigated compositions, Cu/ZrO2 catalysts combine good stability with relevant performances, which strongly depend on CuO loading. At 10 wt% CuO loading, conversion increased almost linearly, yielding 1,2-PDO as the main product with a selectivity of about 95% [36]. Yet, glycerol conversion is still to be optimized.
Recent studies prove that a uniform and fine dispersion of copper species onto the support [32,37] enhances the catalytic performance, improving both glycerol conversion and selectivity [29]. To this purpose, the metal–organic framework (MOF)-mediated synthesis route (MOFMS) has been emerging as an effective and extremely versatile approach [38,39,40] to produce metal-based functional materials. Following this method, MOFs, a sub-class of coordination polymers [41], are used as a solid precursor and sacrificial template. According to the desired functional material, the MOF organic network is completely or partially burnt away at high temperature and controlled conditions (atmosphere, temperature, heating rate, and holding time), establishing a new metal ions/clusters matrix with finely tuned structural properties such as porosity, particle dimension, and carbon content (in the case of pyrolysis or partial combustion).
At the same time, sol–gel synthesis provides for the chance of making homogeneous high surface area catalytic supports, which strongly contribute to achieve the fine distribution of active species [42].
In this context, this study aims at investigating the effect of Cu/ZrO2 catalyst preparation methods on the 1,2-PDO productivity. To this purpose, Cu/ZrO2 materials were prepared following different approaches. Notably, both commercial and sol–gel produced ZrO2 were selected as supports for Cu species. These were deposited onto the supports following the conventional impregnation route as well as through an unprecedented approach exploiting the performances of MOFMS. To this purpose, a Cu-based MOF—HKUST-1—was used as copper oxide precursor. HKUST-1, characterized by high pore volumes, large surface area, tunable pore size, and surface chemistry upon suitable hybridization [43,44], was allowed to grow directly on the ZrO2 particles, and the corresponding material was further calcined under suitable conditions to Cu species. MOF decomposition is expected to produce metal oxides structures better dispersed on the supported materials (ZrO2), thus limiting metal oxides nanoparticle aggregation.
The as-prepared samples were labeled as Cu(X)-Zr(Y), where X indicates the approach for copper deposition (I: impregnation with copper acetate; M: metal–organic-framework-mediated synthesis route), and Y indicates the type of zirconia (C: commercial; S: prepared by the sol–gel method).
The effect of the most important process parameters (pressure, H2 concentration, temperature) was also investigated. Furthermore, a detailed characterization through X-ray diffraction (XRD), Temperature-Programmed Reduction in hydrogen (H2-TPR) and Desorption of ammonia (NH3-TPD), N2 physisorption, and Scanning Electron Microscopy (SEM) provided key information to assess the influence of the preparation method on the distribution of Cu species as well as on acid properties, thus accounting for the different catalytic behavior.

2. Results

2.1. Physicochemical Characterizations

Physicochemical characterizations were carried out on both fresh and used samples, i.e., before and after catalytic tests. Each catalyst was used for several reaction tests before recovering; the overall working time of the samples was not shorter than 100 h. Accordingly, the used catalyst was stable over a long period.

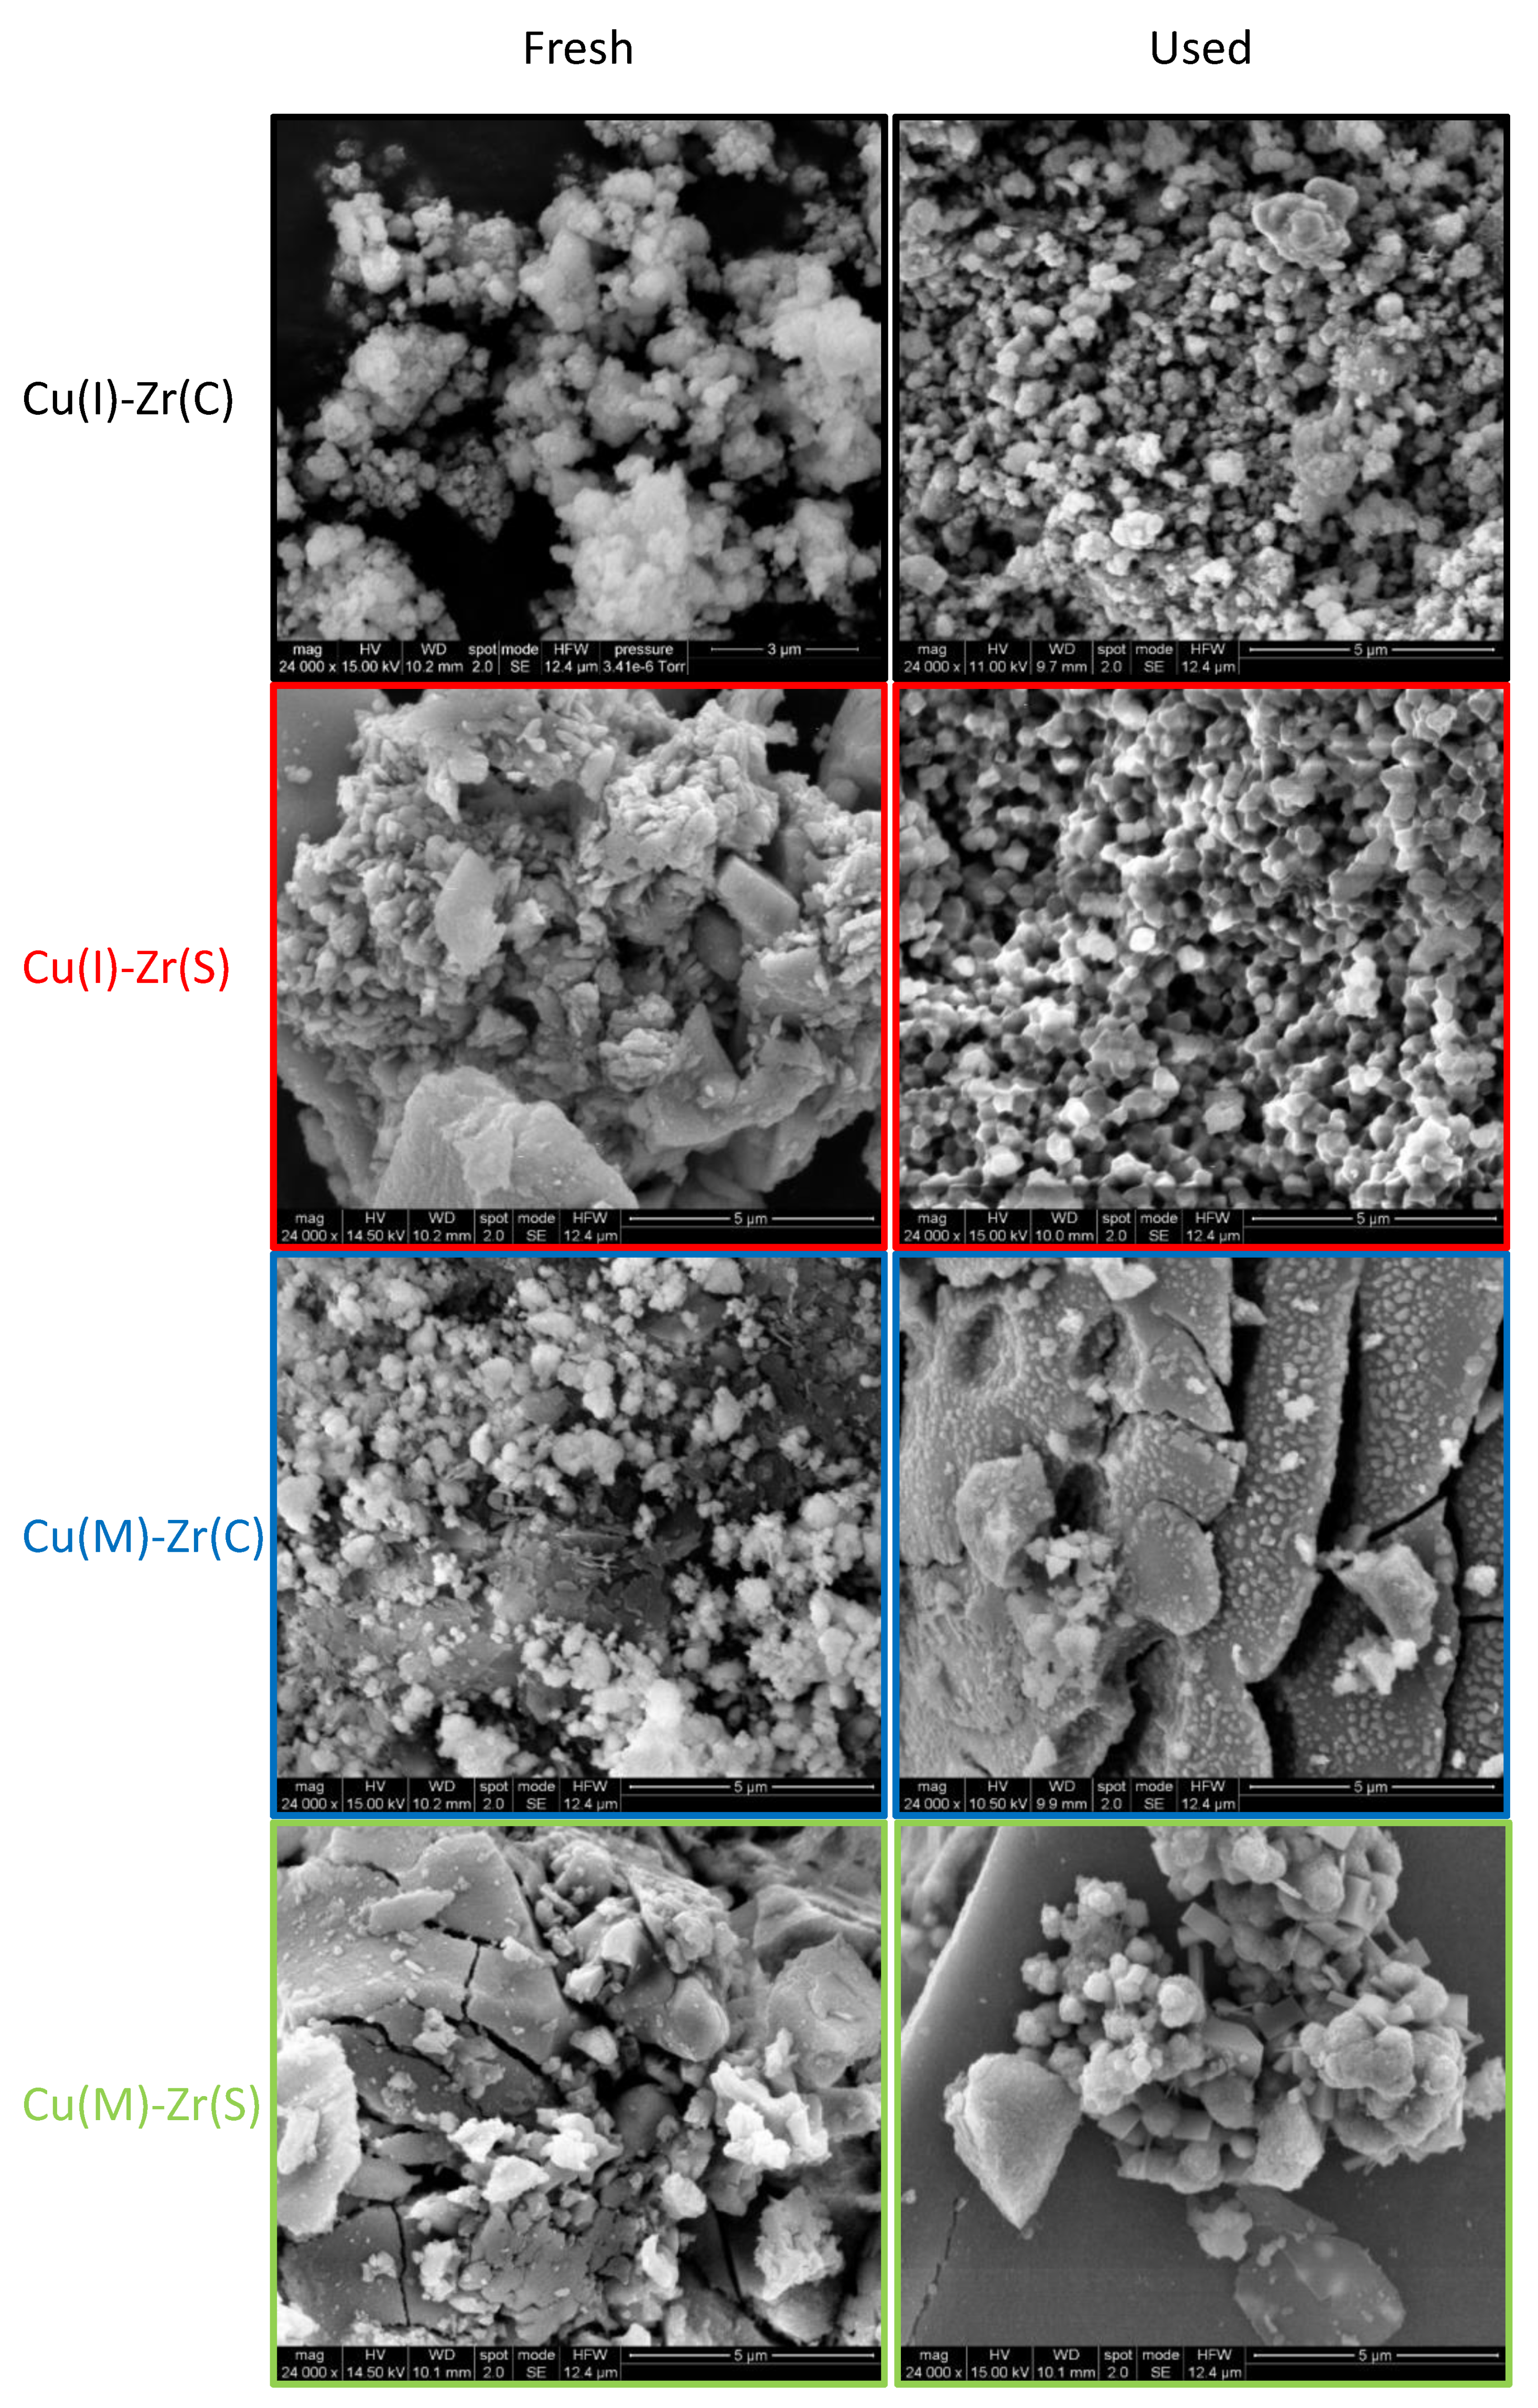
2.1.1. N2 Physisorption, Inductively Coupled Plasma Mass Spectrometry, X-ray Diffraction, and Scanning Electron Microscopy

Table 1 shows the specific surface areas (SSA) of fresh and used samples. Fresh samples prepared with commercial zirconia (Cu(I)-Zr(C) and Cu(M)-Zr(C)) show comparable SSA, which was significantly lower than the bare support (49 m2/g [45]), because of copper oxide deposition. The used samples show a further SSA reduction, which was probably due to the sintering of copper particles [46,47]. As expected, fresh catalysts supported on sol–gel zirconia (Cu(I)-Zr(S) and Cu(M)-Zr(S)) show higher SSA, especially the one produced by impregnation (Cu(I)-Zr(S)). Interestingly, this sample shows the largest SSA reduction after reaction, while the one produced by MOF decomposition (Cu(M)-Zr(S)) shows negligible SSA changes after use.
ICP-MS analysis (Table S1) shows that the actual copper contents of fresh samples correspond to the theoretical one within the experimental error. Slightly more copper is detected in the catalysts prepared by MOFMS, while the Cu(I)-Zr(C) catalyst shows the lowest copper content. The analysis carried out on the used samples reveals that copper leaching under reaction conditions is negligible; Cu(M)-Zr(S) shows the highest Cu loss equal to 3.1%.
Figure 1 shows XRD patterns for the used samples. Only reflections related to zirconia and copper oxide were detected in the XRD profiles of fresh samples (not reported). The XRD patterns of all the used samples show the typical reflections of zirconia lattice with few differences depending on the preparation method. Notably, the commercial ZrO2 employed to make Cu(M)-Zr(C) and Cu(I)-Zr(C) samples exhibits a tetragonal ZrO2 lattice, whereas both tetragonal and monoclinic phases are present in the sol–gel ZrO2 of the Cu(I)-Zr(S) and Cu(M)-Zr(S) samples [48]. Moreover, the XRD reflections of m-ZrO2 are more evident in the XRD pattern of Cu(M)-Zr(S), suggesting a tetragonal–monoclinic phase transition during calcination. Furthermore, CuO and Cu2O diffraction peaks can be observed in all the samples except for Cu(M)-Zr(S), whereas the used Cu(M)-Zr(S) sample shows a significant peak associated to metallic copper.
Figure 2 shows the SEM images of both fresh and used samples, evidencing that commercial-based systems (Cu(x)-Zr(C)) have a more granular/lamellar structure, whereas that of the samples based on sol–gel zirconia (Cu(x)-Zr(S)) looks more compact and homogeneous. In all the cases, it seems that the reaction conditions did not induce any modifications to the sample morphology.

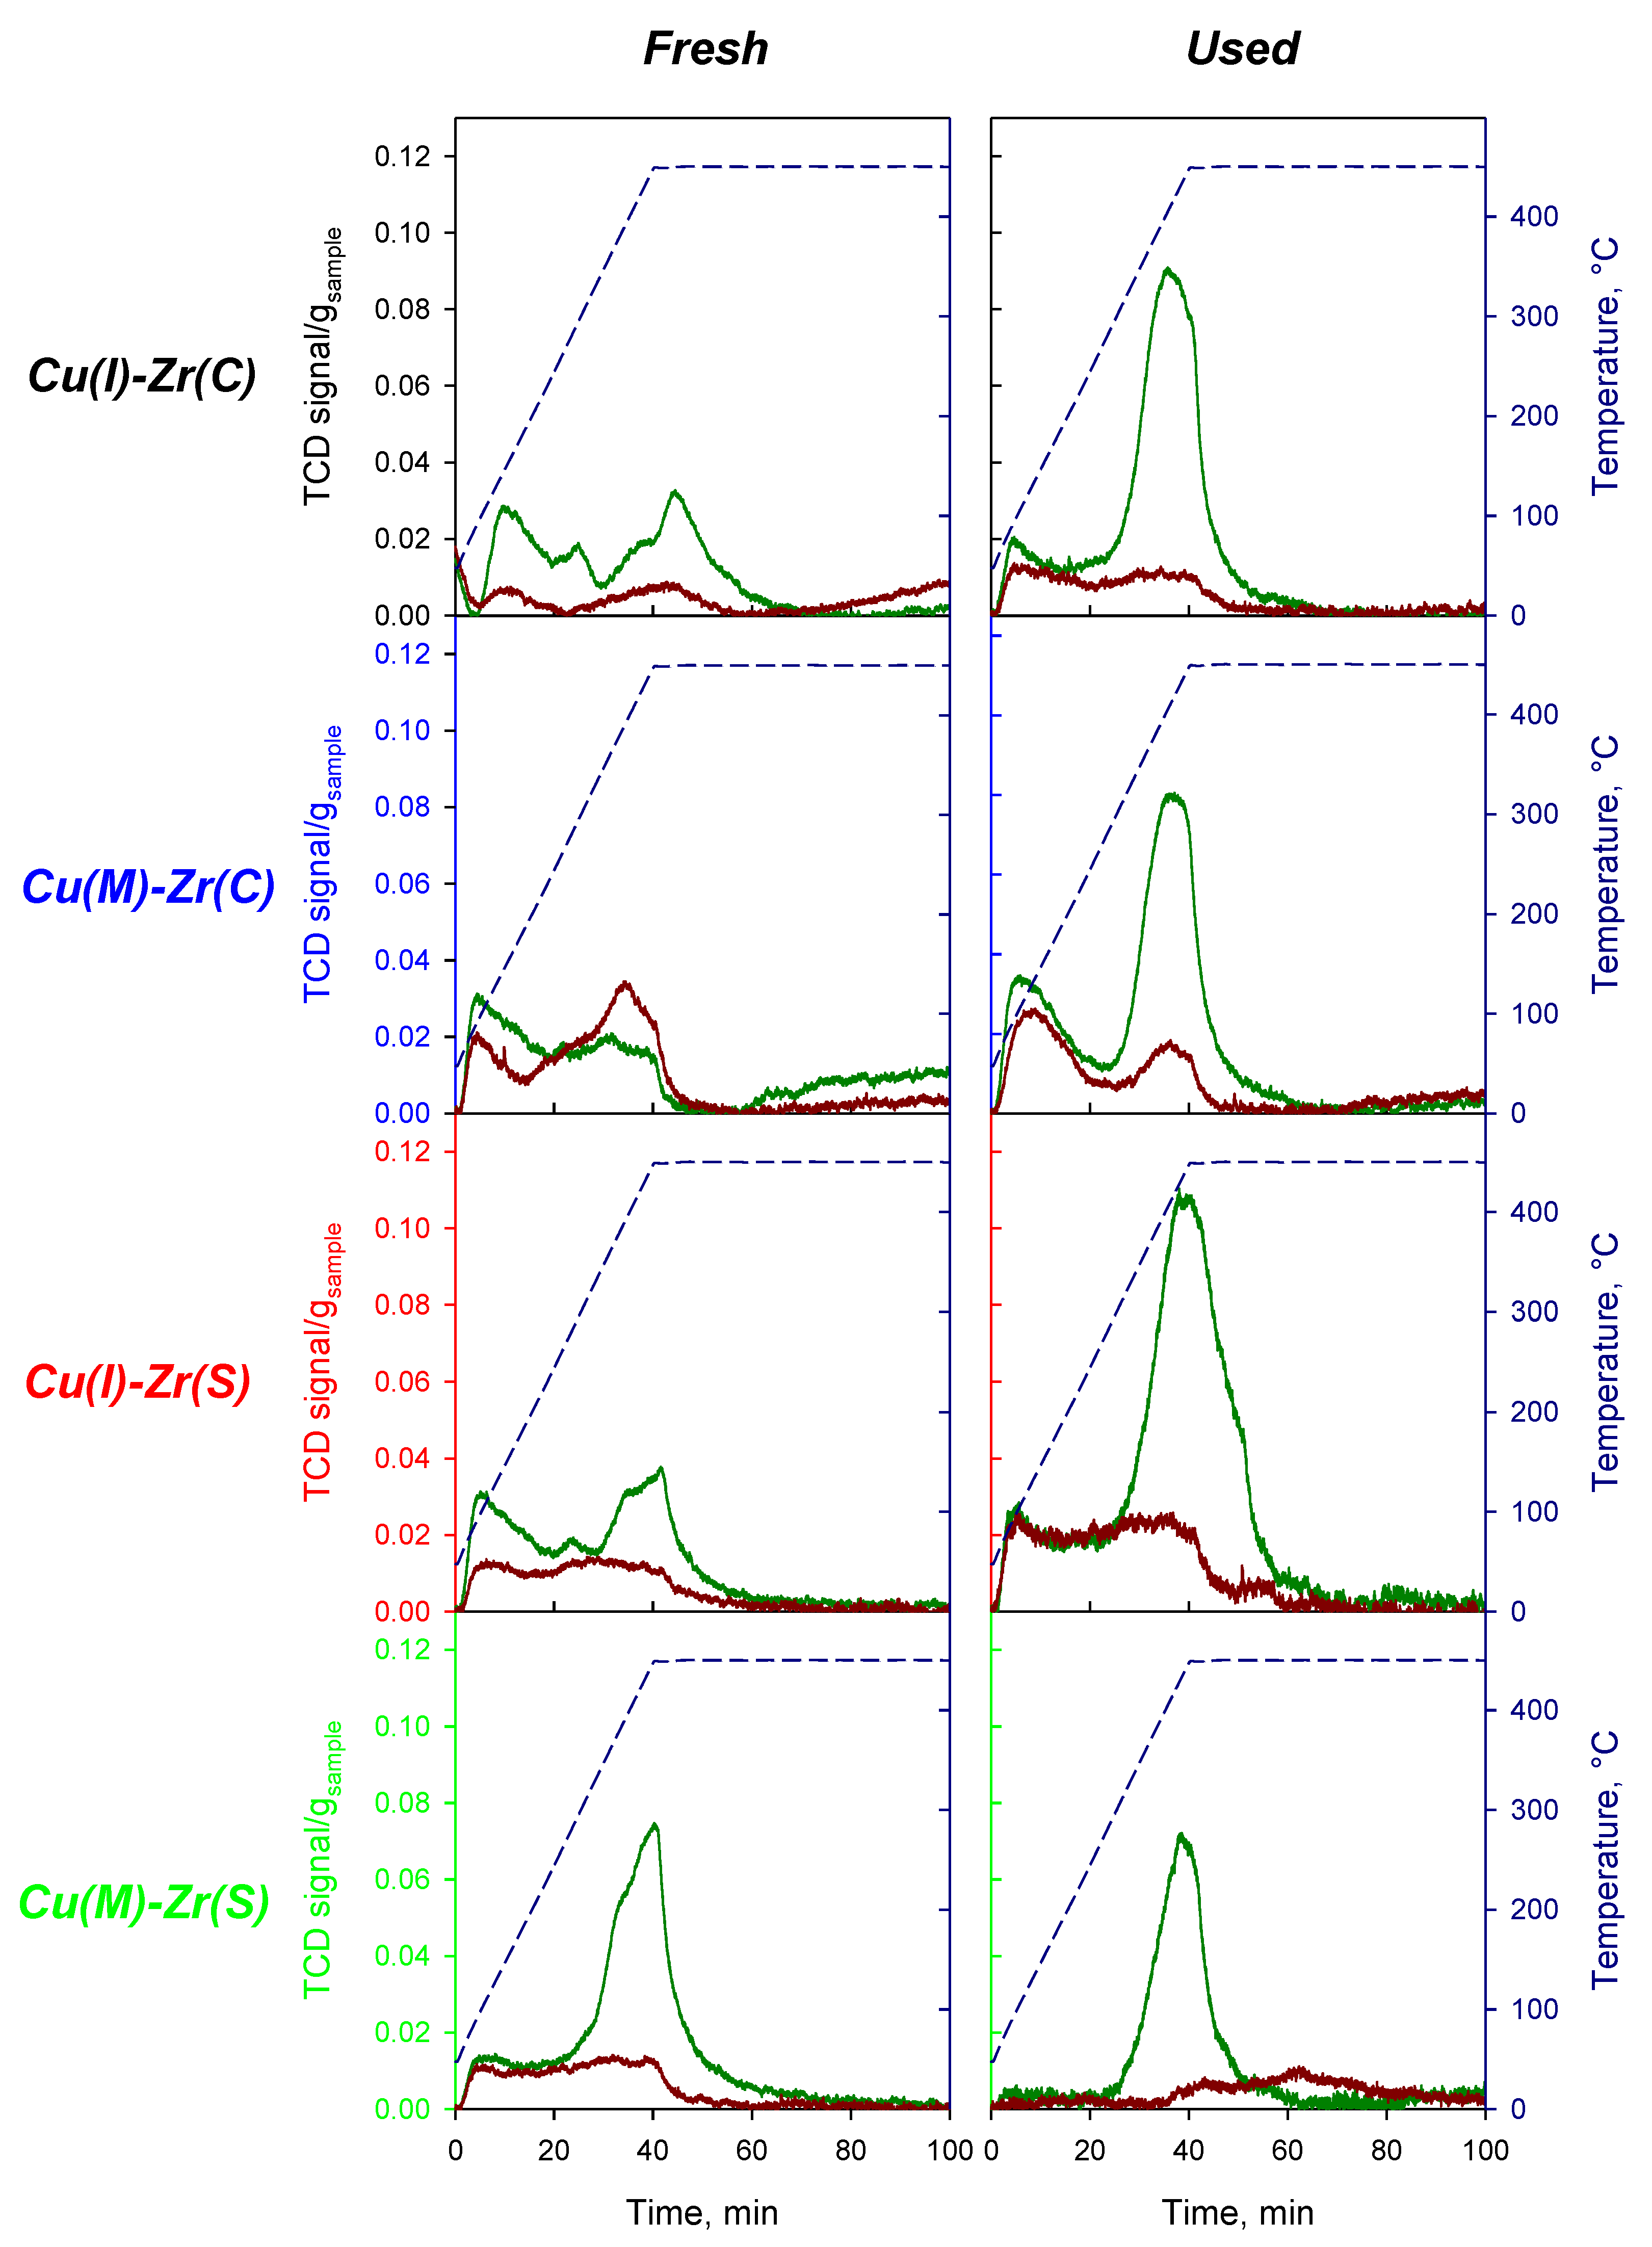
2.1.2. Temperature-Programmed Reduction in Hydrogen (H2-TPR) and Temperature-Programmed Desorption of Ammonia (NH3-TPD)

Since the catalytic activity is strongly influenced by the acidity and the reducibility of the catalyst, H2-TPR and NH3-TPD tests on fresh and used samples were carried out according to the procedure reported in Section 4.2.
Figure 3 shows the profiles of H2-TPR tests performed over the fresh catalysts, whereas Table 2 reports quantitative analysis results. Except for Cu(I)-Zr(C), the consumed H2 amounts correspond to the complete reduction of Cu2+ to metallic copper (within the experimental error); for Cu(I)-Zr(C), only 71% of the copper is reduced, suggesting a lower reducibility and/or accessibility of CuO particles. It is worth noting that unsupported CuO reduction occurs at high temperature (350–400 °C [49]), while both copper dispersion and interaction with the support shift the H2-TPR peak at lower temperatures [46,50,51,52]. Accordingly, peak temperatures can be considered as an index of copper dispersion. Cu(I)-Zr(C) shows a broad reduction peak centered at about 350 °C, suggesting a wide distribution of copper oxide particles. Cu(I)-Zr(S) shows a main reduction peak at about 340 °C and a low peak at about 200 °C; the copper fraction reduced at low temperature corresponds to about 15%. Accordingly, this sample might be characterized by a detectable fraction of highly dispersed copper oxide particles. This fraction increases by using MOF as the copper precursor, being about 18% on Cu(M)-Zr(C) and 100% on Cu(M)-Zr(S). It should be underlined that the use of a Cu-based MOF as the copper precursor improves the overall reducibility on Cu(M)-Zr(C), as suggested by the lower reduction temperatures of both peaks (190 and 300 °C respectively).
Figure 4 shows H2-TPR profiles of used catalysts. It is worth noting that the reduction temperature can be related to copper dispersion [32,53,54], even if H2-TPR does not provide its straight assessment. In particular, the lower the reduction temperature, the smaller the copper particles, and the higher the copper dispersion. It should be noted that all samples were pre-treated in H2 before the reaction. The most reducible sample, i.e., Cu(M)-Zr(S), is fully reduced under reaction conditions, as evidenced by the negligible H2 consumption during TPR treatment. The samples prepared by impregnation show very low but detectable H2 consumptions. Cu(I)-Zr(S) exhibits a peak at about 240 °C with a wide reduction phenomenon even spanning throughout the isotherm step and an H2/Cu ratio equal to 0.04. Conversely, Cu(I)-Zr(C) is mainly reduced during the isotherm at 450 °C, and the H2 consumption corresponds to the reduction of about 6% copper species, which are assumed as CuO. Interestingly, Cu(M)-Zr(C) is the only one showing a significant reduction peak at about 340 °C, corresponding to about 20% of available CuO. This implies that under the reaction conditions, copper is not fully reduced.
From the analysis of TPR results, it may be inferred that the use of MOF as the copper precursor provided the most reducible samples, thus indicating that MOF guarantees a better Cu dispersion. However, copper in the Cu(M)-Zr(C) sample does not undergo a complete reduction under reaction conditions, which is probably due to the interaction with the support.
Figure 5 shows the results of NH3-TPD tests obtained over both the fresh and the used samples, whereas Table 2 reports desorbed NH3 amounts, which were evaluated before and after the H2-TPR tests.
Two types of acid sites are detected on all the samples, the relative distribution mainly depending on the support preparation method. More specifically, the NH3-TPD profiles of all samples, except Cu(M)-Zr(S), exhibit two desorption peaks, the first one at low temperature (about 120 °C) and the second one at 300 °C differing in intensity among the different samples, which suggests, as reported by Garcés et al. [32], the presence of acid sites of weak (120–300 °C) and moderate (300–450 °C) intensity.
The total acidities determined for the samples range from 1.64 to 9.69 mmol/g; these values are higher than those reported for Cu-Zr catalysts [32], alluminosilicate supported heteropolyacids (0.2–0.4 mmol/g [55]) or for H-ZSM-5 (0.2–0.9 mmol/g [56]); the last two catalysts are typically used for glycerol dehydration.
The high-temperature peak significantly decreases after H2 reduction for all the samples, suggesting that either it is related to oxidized copper (Cu2+ and/or Cu+) or acid sites are decomposed at high temperature; on the other hand, the low temperature peak seems quite independent from the reduction degree of the sample, suggesting that it is more related to the support. ZrO2 generally shows Lewis acid properties [57], even if the formation of Brönsted acid sites as ZrOH, showing weak acidity, cannot be excluded [58]. At the same time, copper ions act as Lewis acid centers, whereas OH groups are associated to copper as Brösted acid ones [57]. Indeed, previous studies evidenced that the concentration of Lewis acid sites is far higher than the concentration of Brönsted centers, the former being responsible for catalytic activity [57]. Notably, the strong interaction of finely dispersed copper species onto ZrO2 produces a high abundance of high-strength Lewis acid sites at the interface, which could account for the improved catalytic activity in the investigated systems. Actually, despite the hydrogen treatment, it was assessed that a fraction of copper atoms is still present, as Cu+ and Cu2+ ions. They were stabilized by the ZrO2 matrix and cause the increase in oxygen vacancies and improve the Lewis acid features, as confirmed by the increase in the second peak in NH3-TPD profiles for the used samples.
Moreover, the used Cu(M)-Zr(S) is the only sample that does not show any low-temperature peak and an increase in the high-temperature peak after reaction.
Very interestingly, acidity gets higher under reaction conditions with the formation of a well-defined high-temperature peak, except for the Cu(M)-Zr(S) sample, which exhibits similar profiles, with a depletion of the low-temperature peak. The samples with increased acidity after reaction are those with a measurable oxidized copper fraction. According to the XRD and H2-TPR results, the larger amount of acid sites can be related to the larger Cu+ fraction detected after reaction on all the sample, except on Cu(M)-Zr(S).

2.2. Activity Tests

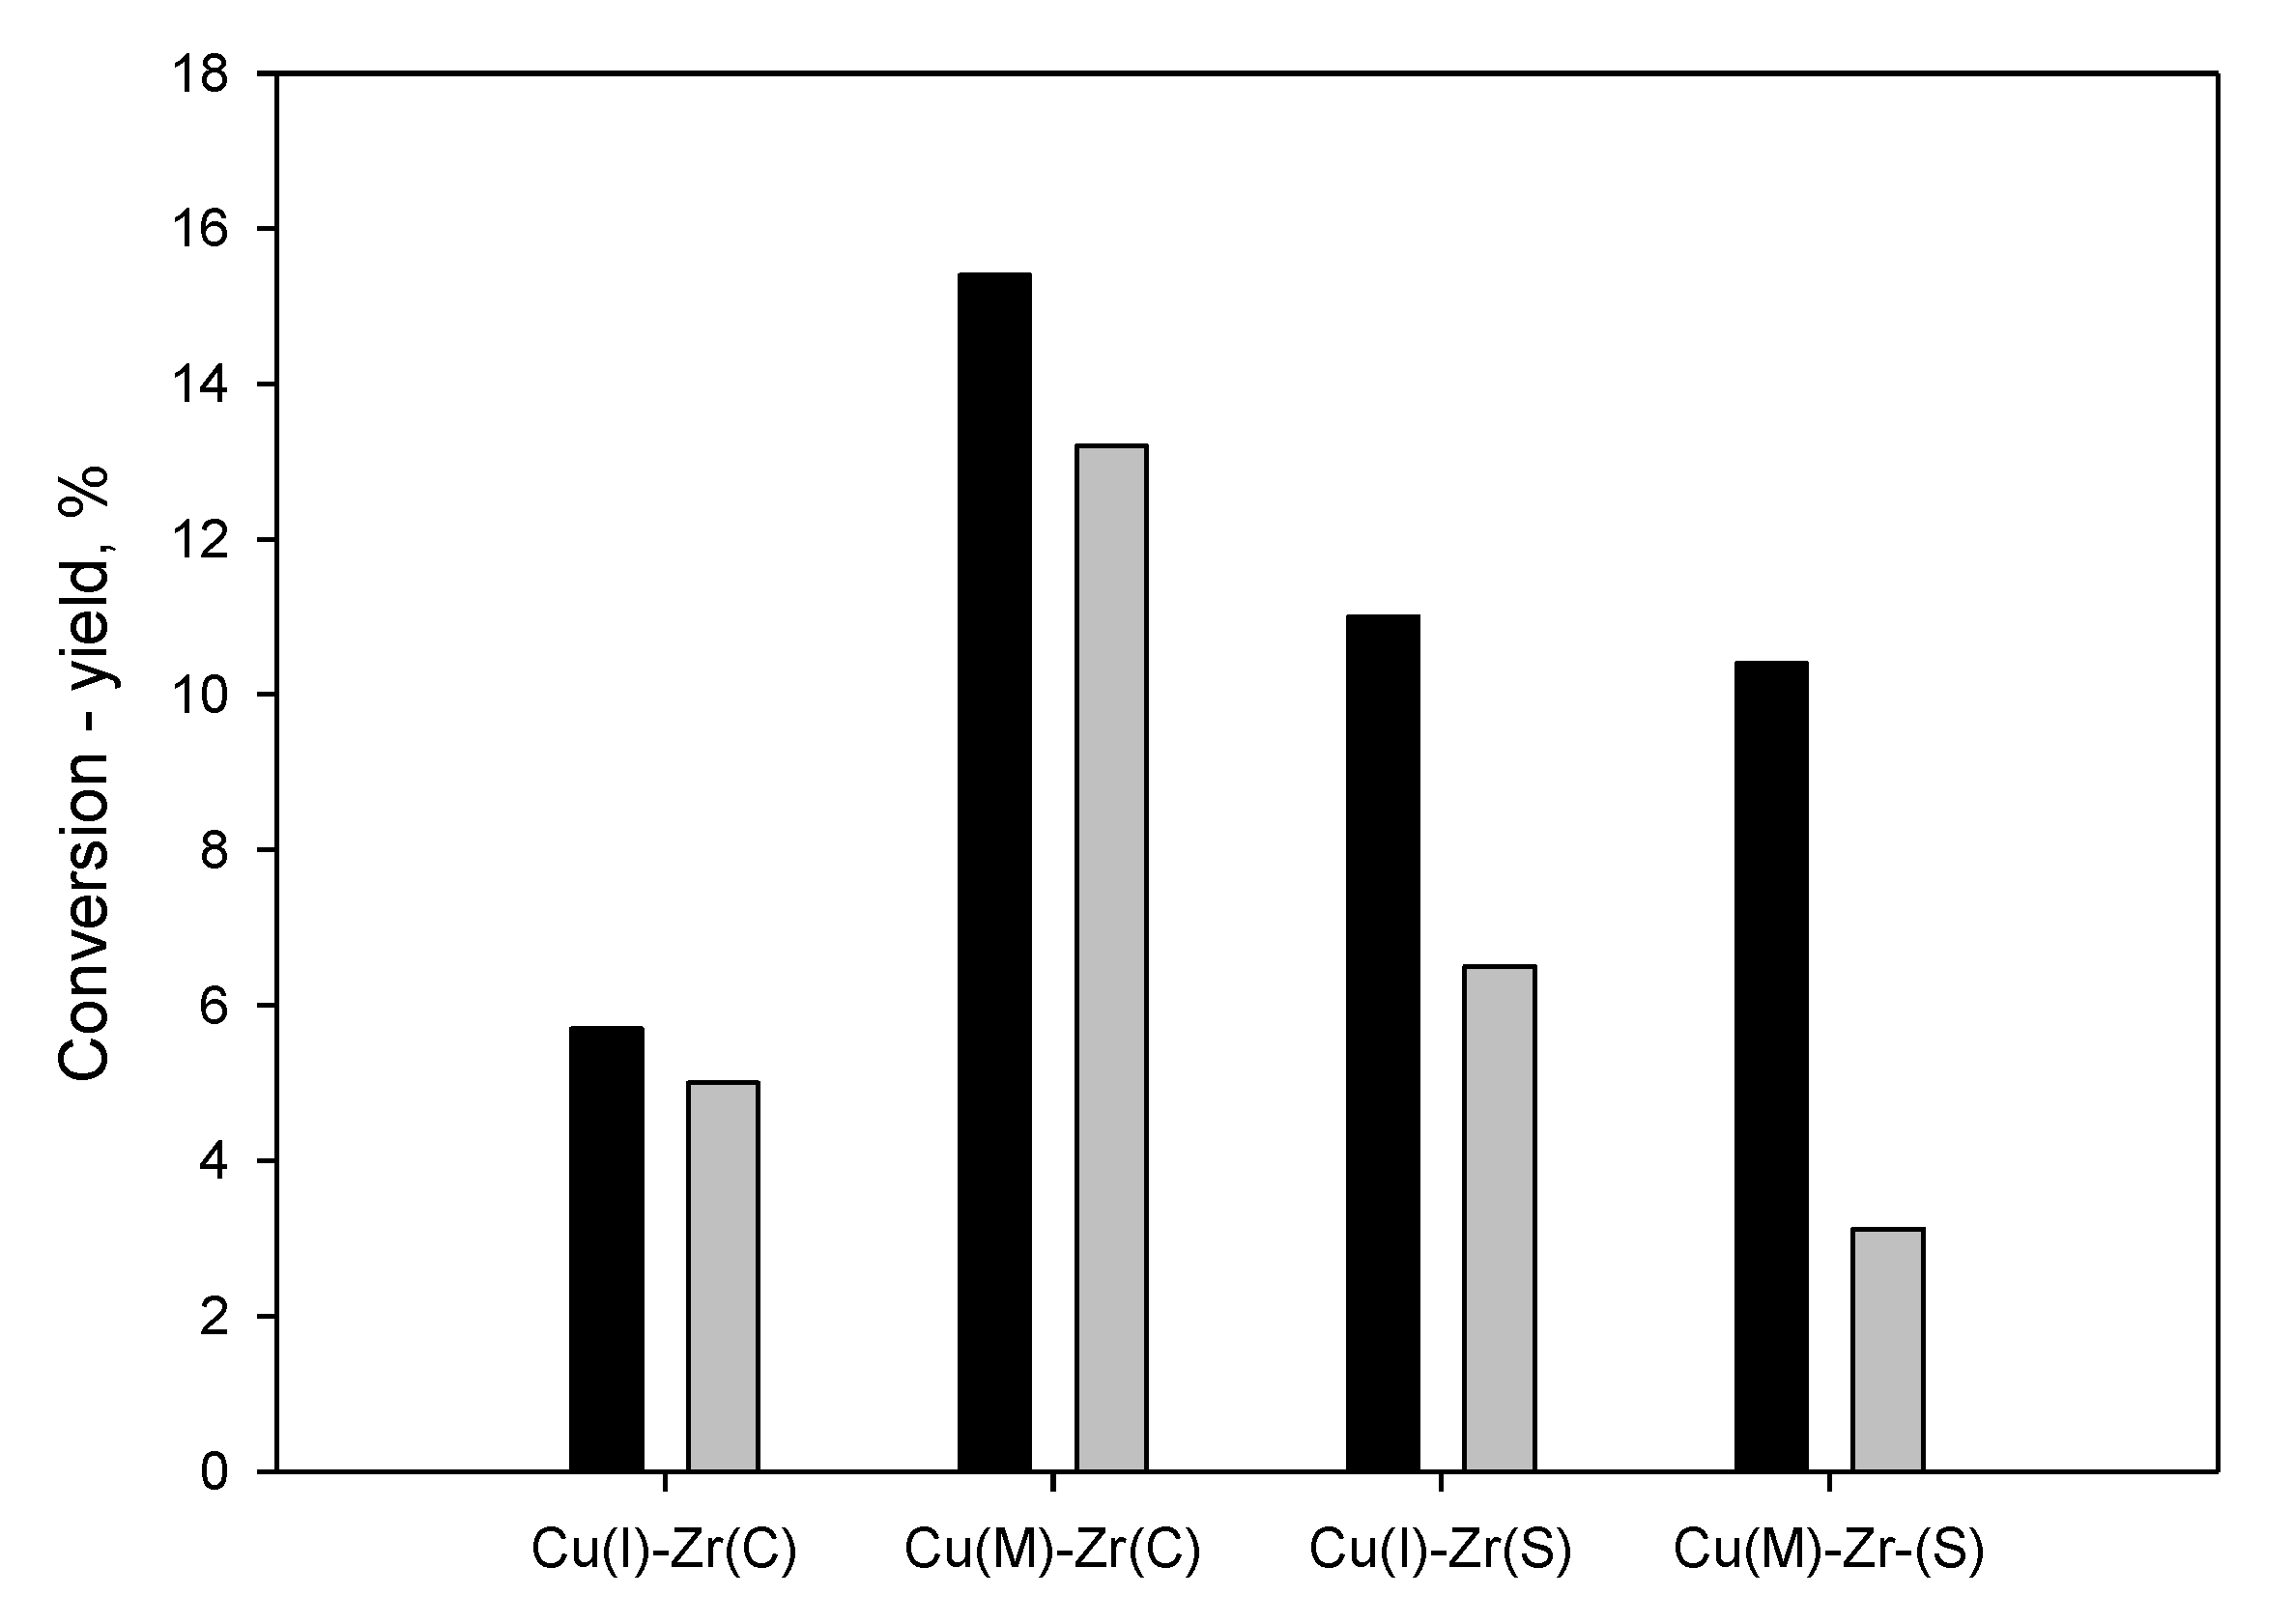
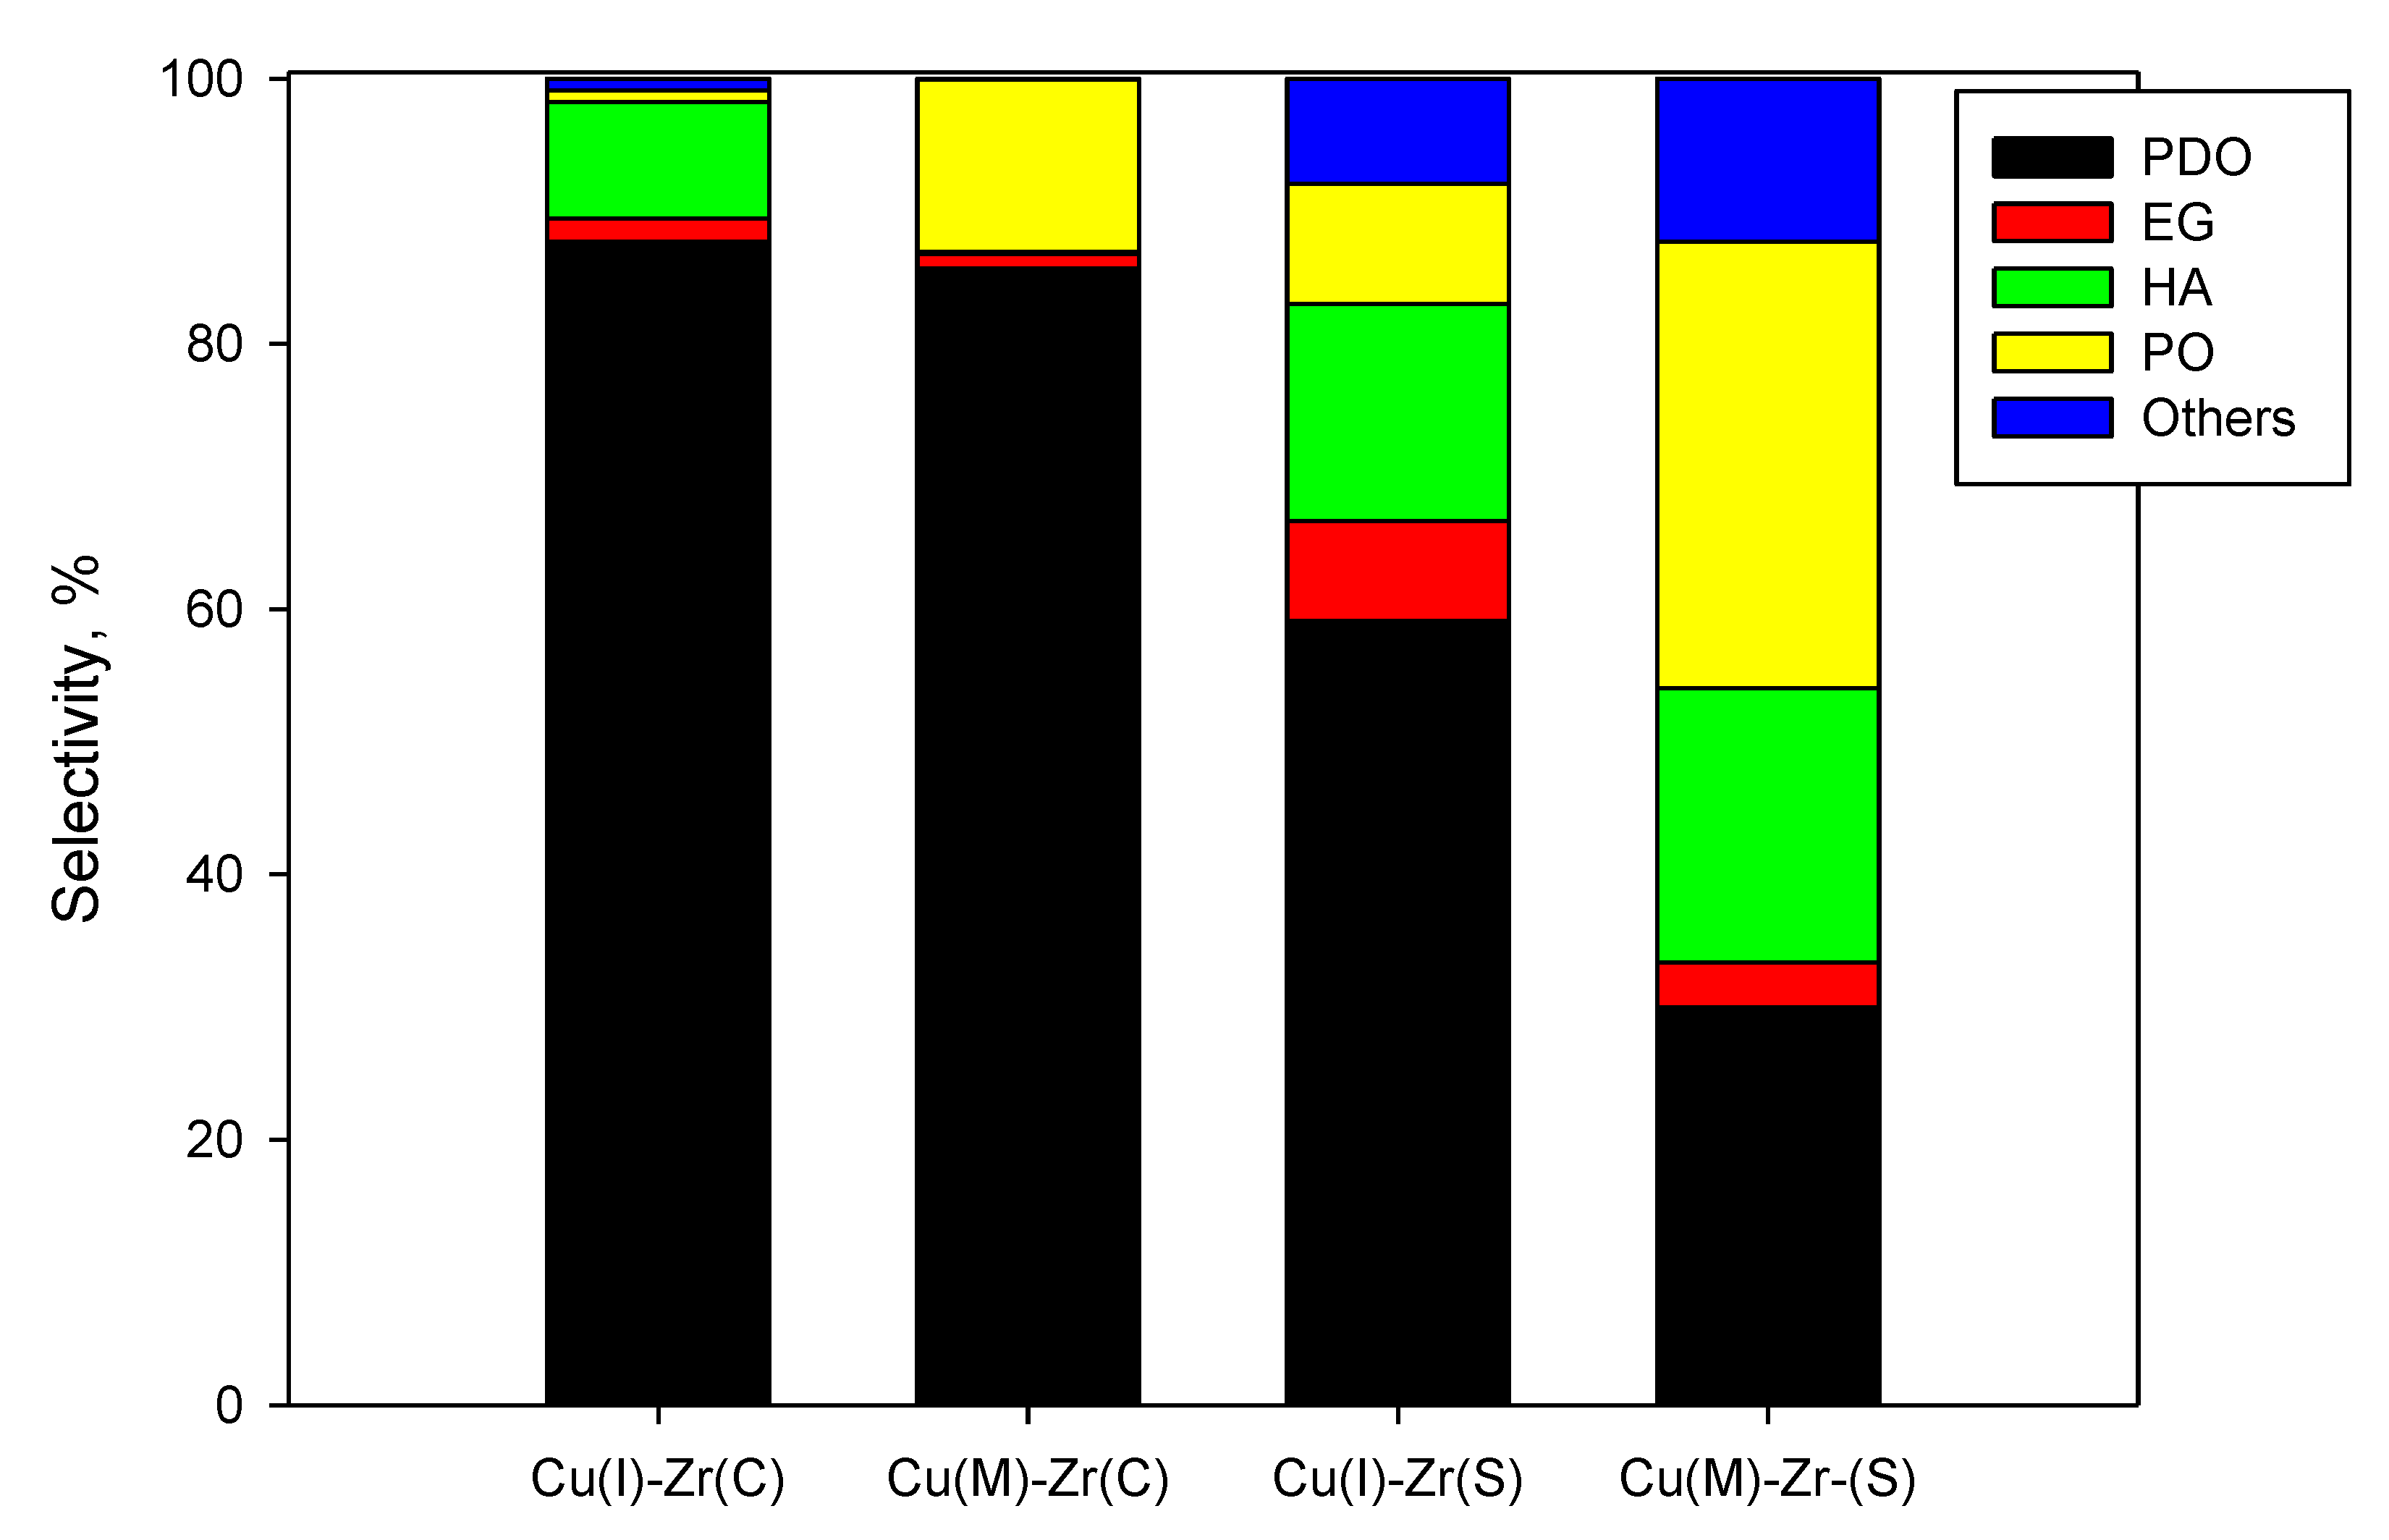
2.2.1. Effect of Support and Preparation Routes

Figure 6 shows glycerol conversion and the yield to 1,2-PDO for the different catalysts as obtained at 240 °C, 20 bar(g) initial pressure, 20% H2 in the gas phase, and 500 rpm after 24 h reaction. The most active catalyst is Cu(M)-Zr(C), exhibiting both the highest conversion and selectivity to 1,2-PDO, while the less active sample is Cu(I)-Zr(C). Thus, the use of MOF as a Cu precursor and/or sol–gel zirconia improves glycerol activation, as suggested by the higher conversions. However, Cu(M)-Zr(S), prepared by Cu MOF deposition onto sol–gel zirconia, shows the lowest yield to the desired product despite the significant conversion.
Figure 7 shows the selectivity to 1,2-PDO and to by-products. Samples prepared with commercial zirconia show the highest selectivity to 1,2-PDO. The main by-product for Cu(I)-Zr(C) is hydroxyacetone (HA), while only traces of 1-propanol (PO) are detected. The selectivity to PO increases as the catalytic activity grows, i.e., at higher conversion, suggesting the occurrence of 1,2-PDO hydrogenolysis to PO. Ethylene glycol (EG) selectivity is generally lower than 5%, except for the Cu(I)-Zr(S), which shows about 8% selectivity to EG. According to the reaction scheme proposed by Gabrysch et al. [46], this result suggests that these catalysts promote the dehydrogenation of glycerol to hydroxyacetone rather than its hydrogenation to ethylene glycol. The detection of a significant fraction of 1-propanol indicates the occurrence of the 1,2-PDO overhydrogenolysis; this reaction seems faster on samples prepared with MOF as a Cu precursor, especially on Cu(M)-Zr(S). The lower conversion on this sample can be due to a faster H2 consumption related to the simultaneous occurrence of both glycerol and 1,2-PDO hydrogenolysis, leading to a low (and limiting) H2 concentration in the liquid phase. A low H2 concentration can also explain the significant selectivity to HA. The product distribution obtained with Cu(I)-Zr(S) appears to be related to a lower activity, to an excessive overhydrogenolysis, and to a lower selectivity toward glycerol dehydration.

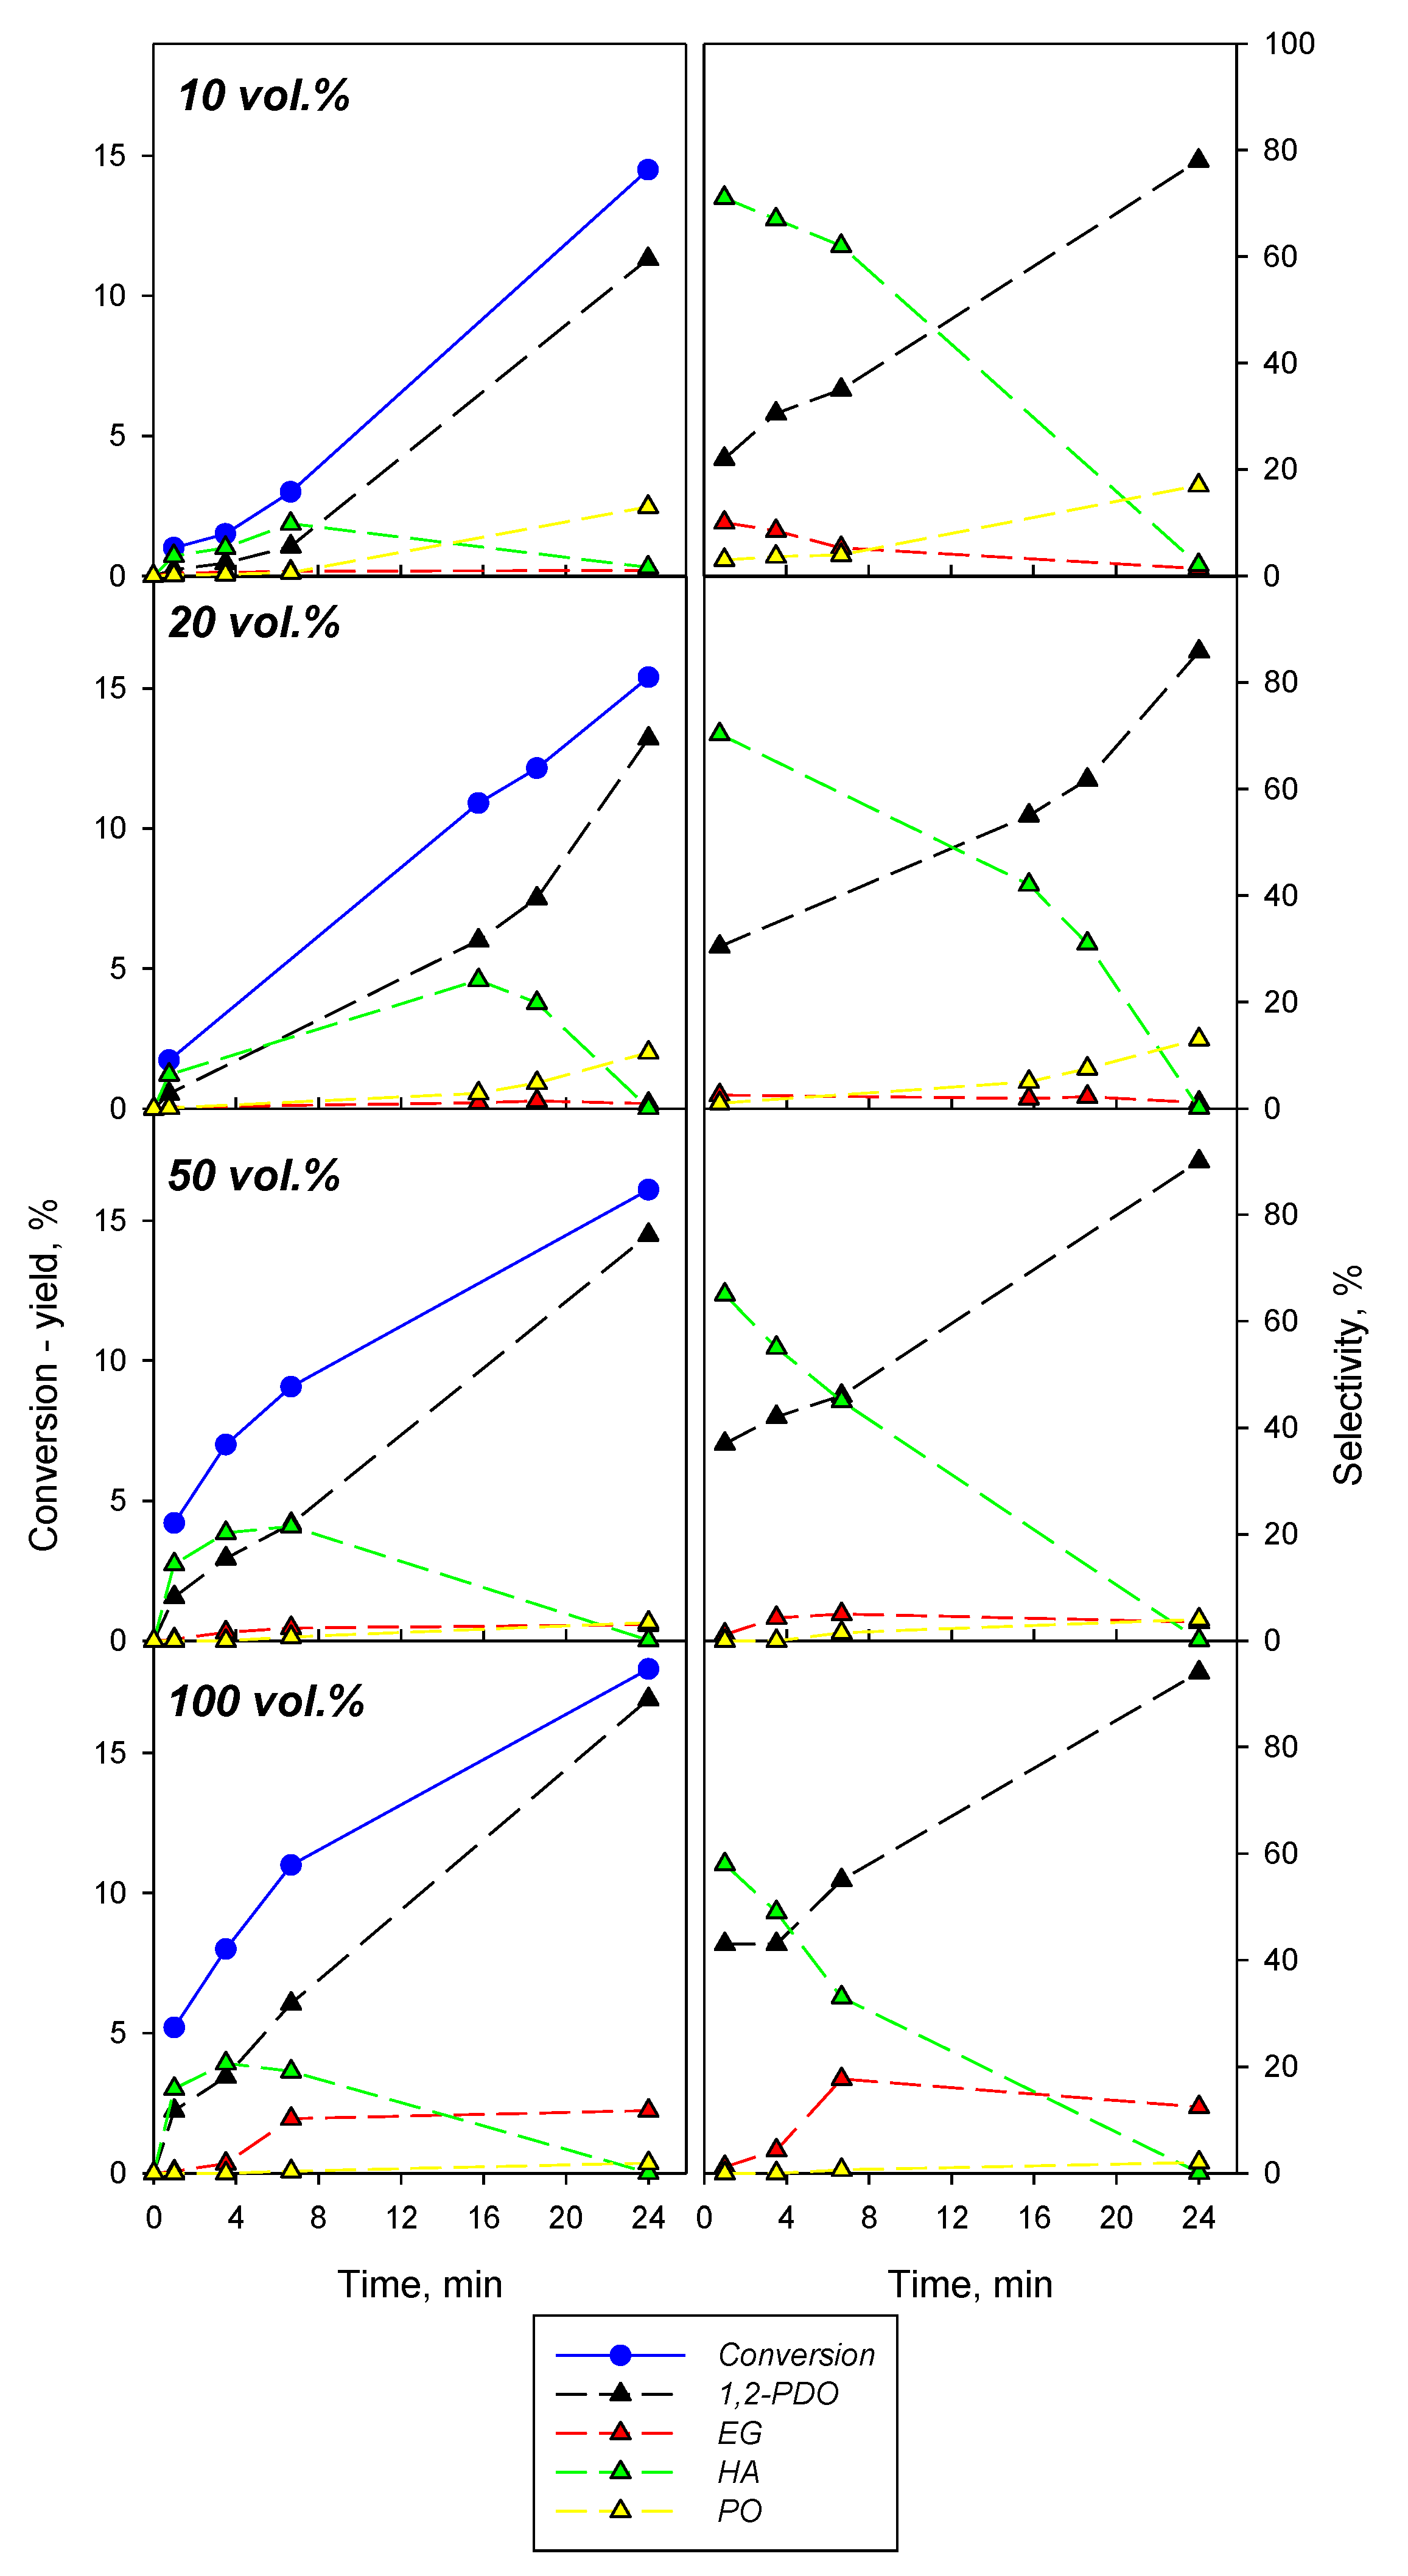
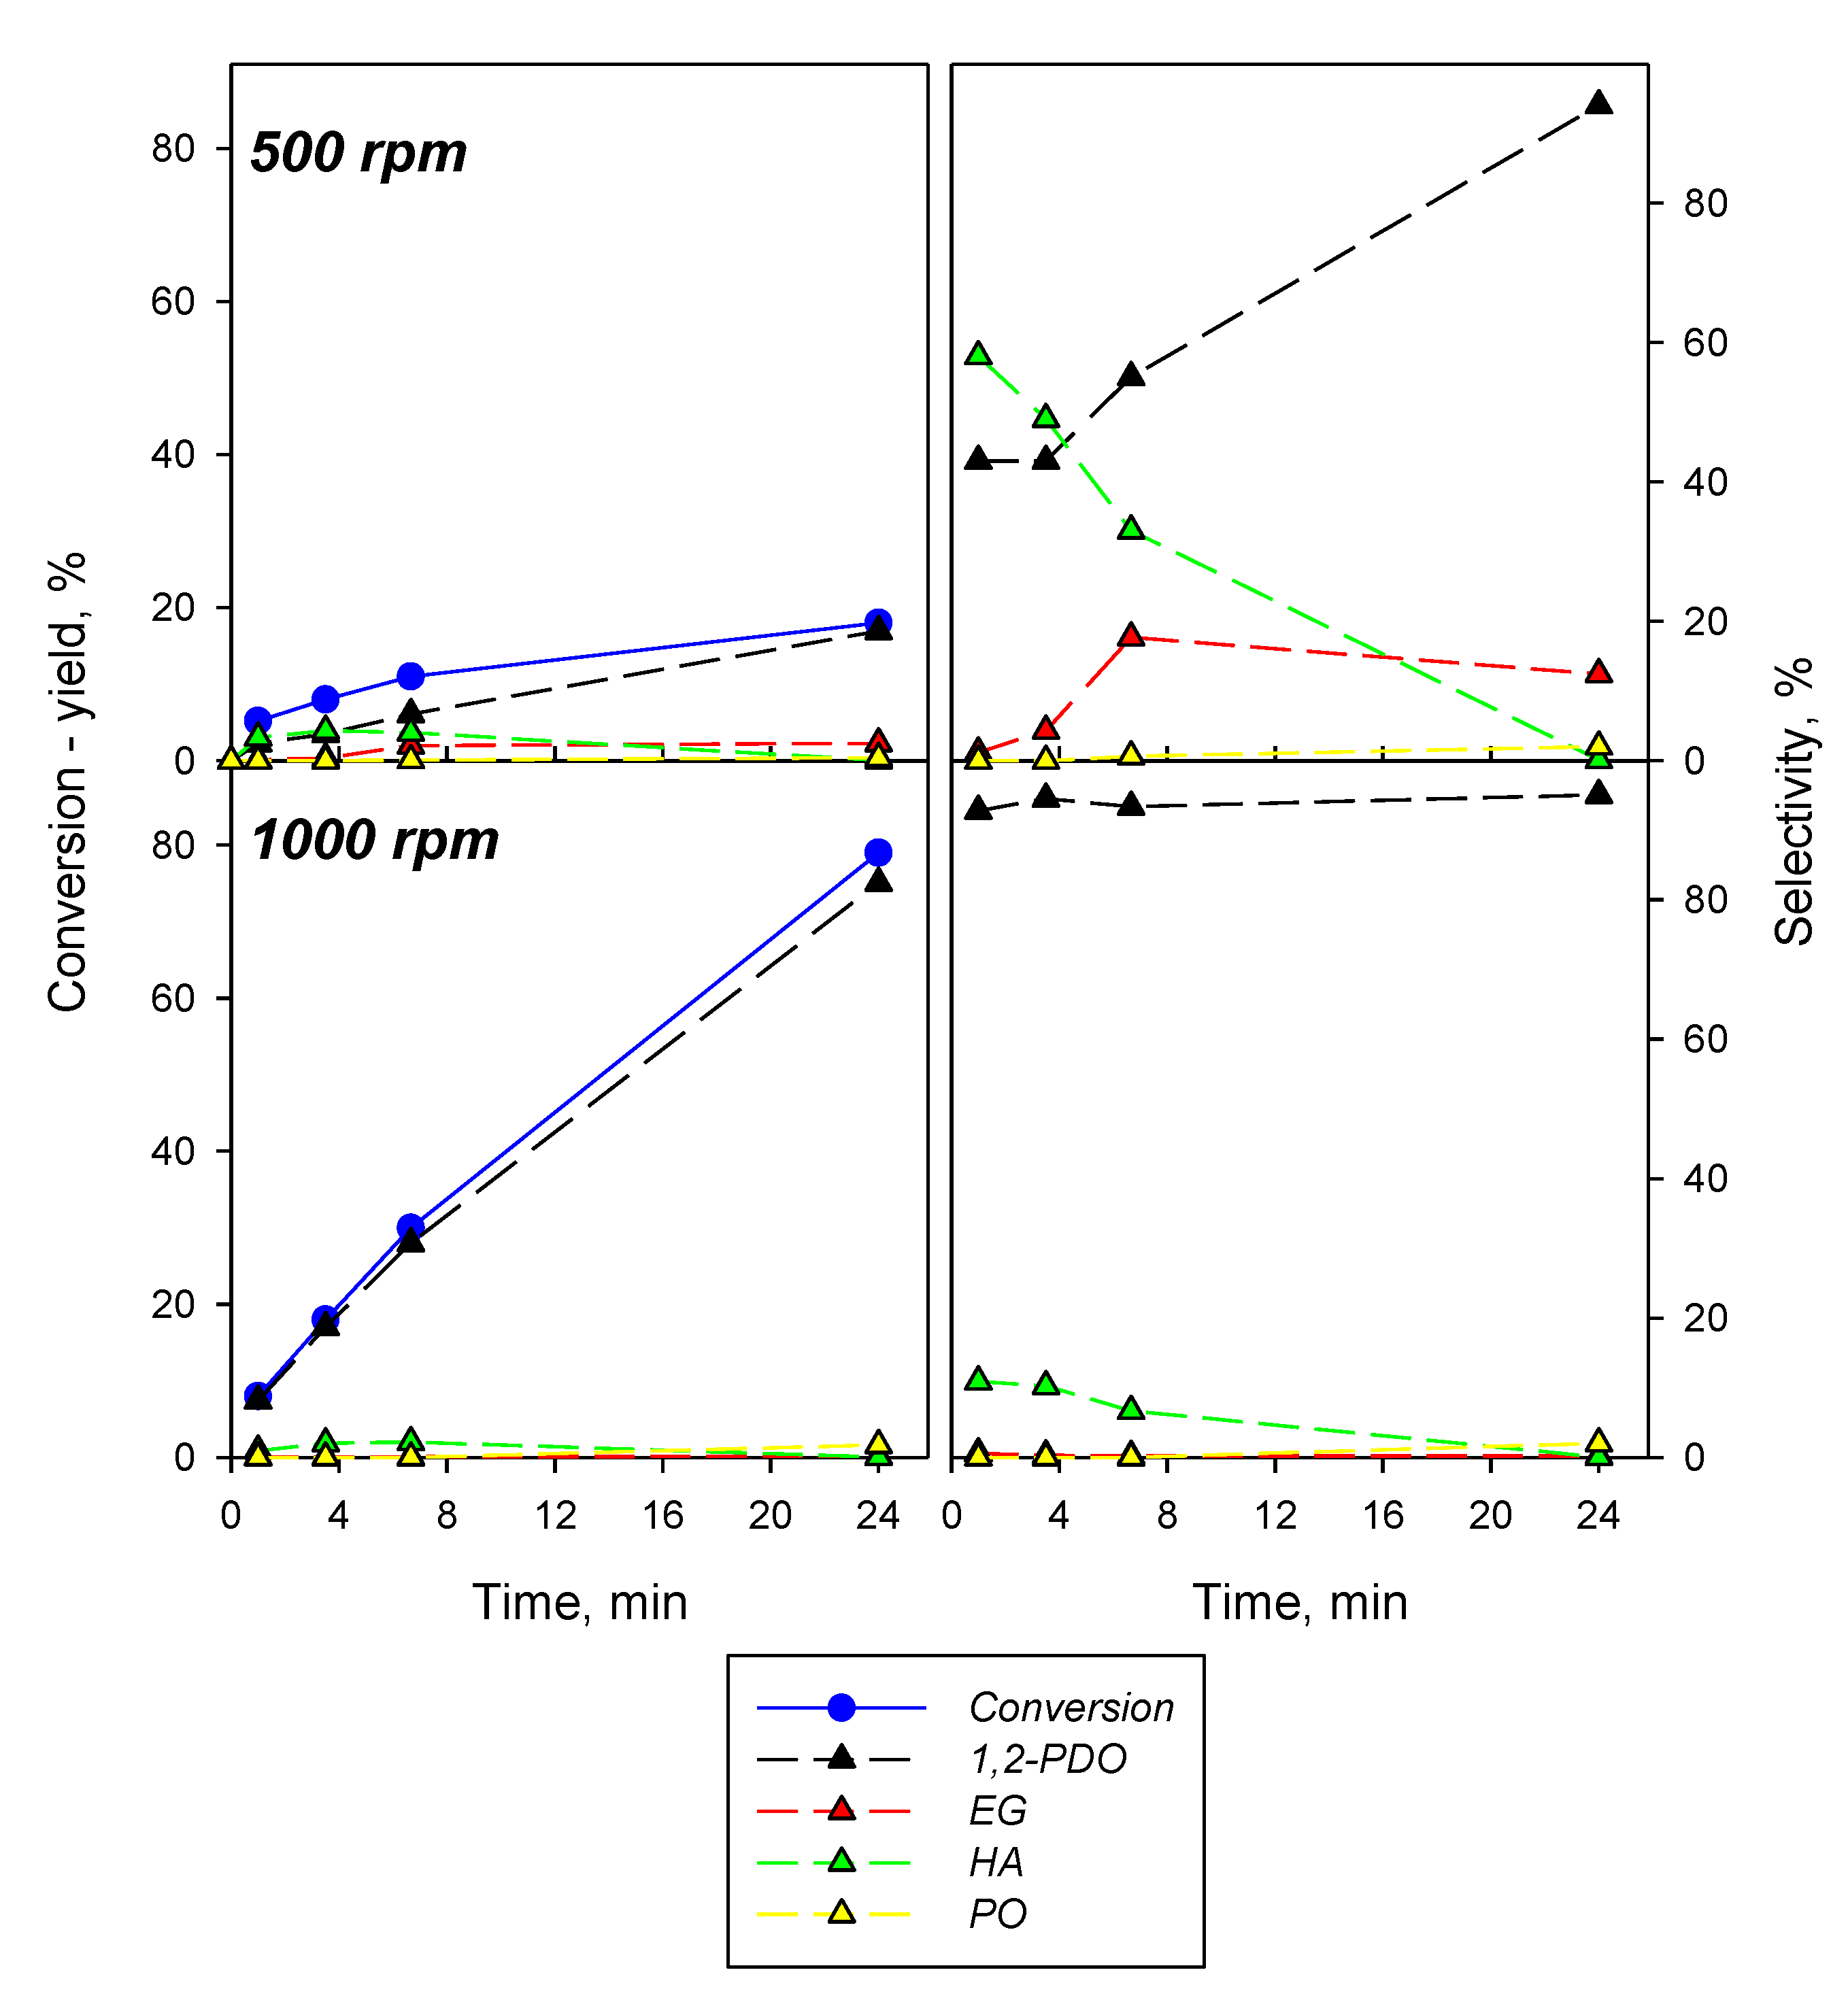
2.2.2. Effect of the Operating Conditions on Cu(M)-Zr(C)
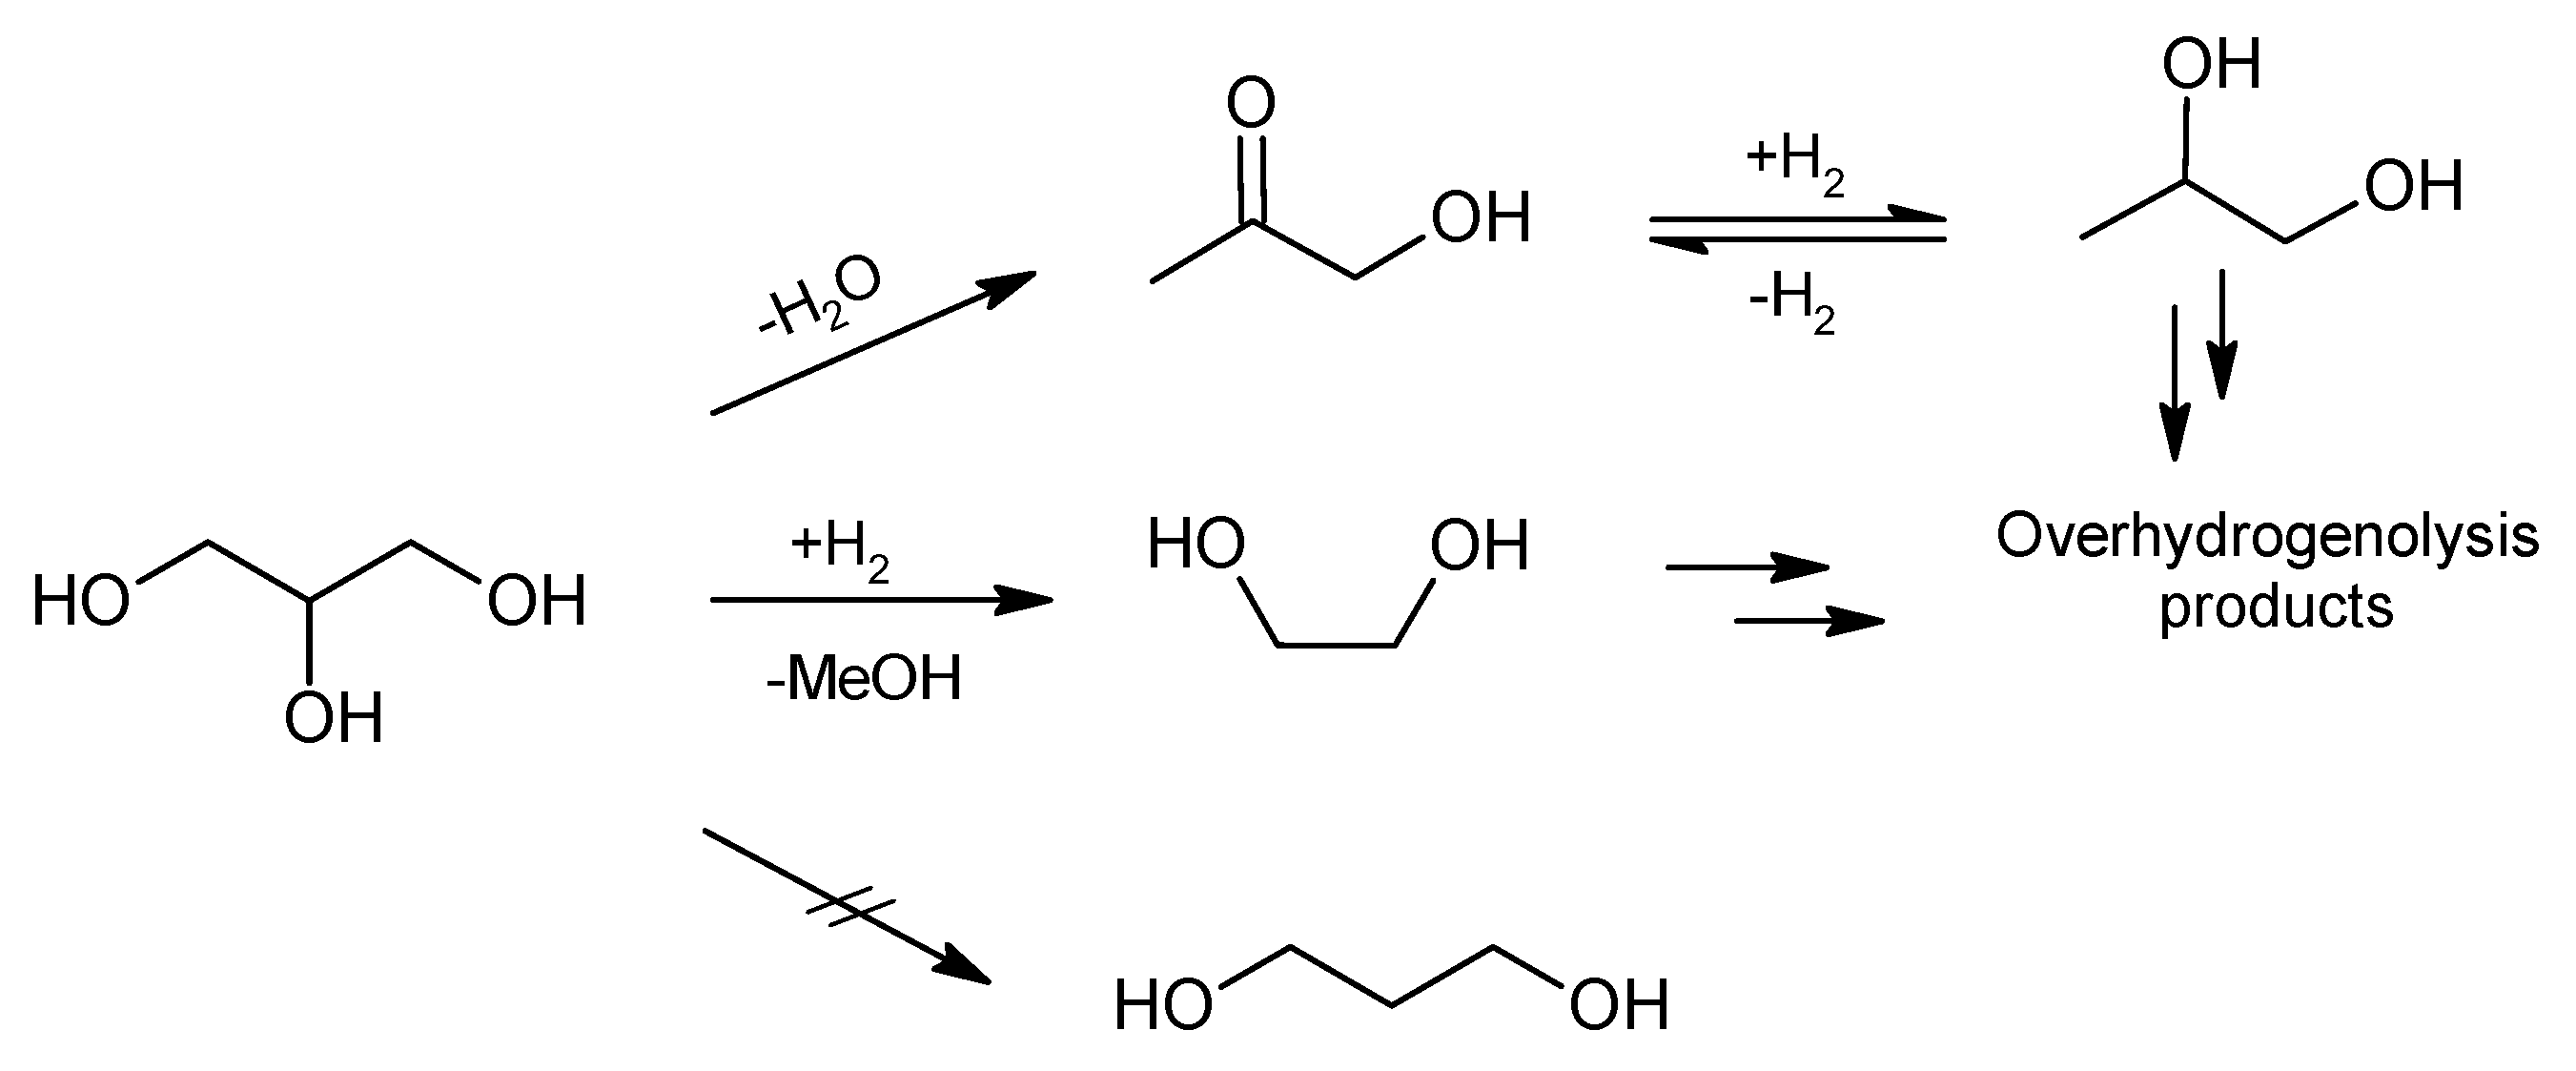
The effect of the operating conditions has been studied on the most interesting sample, i.e., Cu(M)-Zr(C), showing the best performance in terms of both glycerol conversion and selectivity to 1,2-PDO. In the liquid phase, EG and methanol were generally found in a molar ratio equal to about 1, which is in agreement with the stoichiometry of the glycerol hydrogenation. Accordingly, in the following, the yield and the selectivity to EG are intended as the sum of the corresponding values for EG and methanol and, thus, such a sum represents the yield and the selectivity of the glycerol hydrogenation reaction.
Figure 8 shows the effect of reaction temperature as a function of reaction time, operating at 20 vol% H2 concentration in the gas phase (initial pressure = 20 bar(g)). Glycerol conversion steadily increases as the temperature increases and is quite linear with the reaction time. The 1,2-PDO yield grows as well; interestingly, it increases more than linearly with the reaction time as well as its selectivity. The HA yield shows a sublinear growth at 200 °C, while it shows a volcano shape at higher temperatures; its selectivity steadily decreases by increasing both the reaction time and temperature. This behavior is typical of the reaction mechanism involving the formation of intermediate species in a series reaction scheme, as suggested by Gabrysch et al. [46]. The reaction rate of the hydrogenation of HA to 1,2-PDO increases as the temperature grows; this increase is even higher than that of glycerol dehydration to HA, as suggested by the reduction of selectivity at high temperature. EG yield is very low-independent from the temperature and the reaction time, and it increases as conversion increases. Accordingly, EG selectivity is quite constant with reaction time; a slight decrease is detected by increasing the temperature. Thus, it can be inferred that glycerol dehydration is preferred to the direct hydrogenation of glycerol to ethylene glycol and methanol, which occurs at a quite constant rate at a fixed temperature. The reaction rate of glycerol dehydration to HA increases more than that of the direct hydrogenation of glycerol to ethylene glycol and methanol. The overhydrogenolysis to the 1-propanol reaction step follows the trend of series reactions; the corresponding yield and selectivity increase with both the reaction time and the temperature.
Figure 9 shows the effect of the hydrogen concentration in the gas phase at a fixed temperature (240 °C). Glycerol conversion increases as the H2 partial pressure in the gas phase (and, thus, H2 concentration in the liquid phase) increases, as expected. On the other hand, products distribution is not trivially affected by the increasing H2 content. Due to the increased H2 concentration, the reaction rate of HA hydrogenation increases; as a consequence, HA selectivity decreases, and its consumption becomes faster as a function of the reaction time. Even the conversion of glycerol to ethylene glycol by direct hydrogenation increases as the H2 partial pressure increases, especially up to 100 vol% H2. Interestingly, both yield and selectivity to 1-propanol decrease as the H2 partial pressure increases; this behavior is unexpected. On the other hand, the significant improvement in the yield to 1,2-PDO is not only related to higher conversions but also to a higher selectivity. The above results suggest that on Cu(M)-Zr(C), the HA hydrogenation reaction shows a stronger dependence on H2 concentration than glycerol hydrogenation to EG and methanol and, above all, on the overhydrogenolysis of 1,2-PDO to 1-propanol. This behavior is not obvious; for instance, Cu(M)-Zr(S), showing a significant overhydrogenolysis activity (see previous section), shows a reduction of the selectivity to 1,2-PDO and an increase in selectivity to 1-propanol by increasing the H2 partial pressure (not reported). This can be due to the different physicochemical features of the samples and, in particular, to the different amount of metallic copper, which is generally responsible for H2 activation [46].
Figure 10 shows the effect of the rotation speed at the most promising reaction conditions (i.e., T = 240 °C, initial pressure = 20 bar(g), H2 concentration = 100%). Both glycerol conversion and yield to 1,2-PDO significantly increase up to about 80% after 24 h reaction. Selectivity to 1,2-PDO is 92–95% in all experiments. At low reaction times, the main by-product is HA, while at the end of the experiments, PO is detected. Thus, the pathway to EG is suppressed at high recirculation. This behavior could be related to the peculiar configuration of the used reactor (see Section 2). The Supplementary Information (Section S2) shows calculations on the fluid regime and on the mass transfer regime. Accordingly, external mass transfer is not limiting independently from the rotation speed. At low rotation speed, the instant contact time (i.e., catalyst mass divided by flow rate passing through the catalyst) is higher, suggesting a higher conversion per pass. This phenomenon can negatively affect activity and selectivity. Moreover, a significant role could be played by the H2 concentration; in particular, the mean H2 concentration can be affected by mass transfer between the liquid and solid phase (affected by rotation speed), while local H2 concentration at the catalytic bed is affected by the instant contact time due to a larger H2 consumption at low rotation speed. A full explanation of this behavior is under investigation.

3. Discussion

Advanced preparation methods were successfully exploited to make Cu/ZrO2 catalysts. In particular, MOFMS based on MOF HKUST-1 type as a copper precursor allowed obtaining a higher dispersion degree of copper, as suggested by the H2-TPR results, especially on high surface area sol–gel zirconia. Due to the high copper load, crystalline copper species detectable by XRD were formed; copper oxide was identified on the as-prepared catalysts, whereas used samples (pre-reduced in H2 and tested under reaction conditions) evidenced the presence of metallic copper and cuprous oxide, the relative fraction depending on the preparation method. Even the amount and the strength of acid sites were influenced by the preparation method. In particular, our characterization strategy by NH3-TPD highlighted the occurrence of acid sites related to the support and acid sites related to non-metallic copper species.
The obtained catalytic results depicted a similar reaction path to that proposed by Gabrysh et al. [46] (Figure 11). Accordingly, the activity and the selectivity are related to the relative reaction rates of glycerol dehydration to hydroxyacetone, its successive hydrogenation to 1,2-propanediol, C-C cleavage by hydrogenation to ethylene glycol and methanol, and overhydrogenolysis of the above products (hydrogenolysis of 1,2-propanediol leading to 1-propanol).
The different catalytic performance of samples prepared by different strategies can be related to the different physicochemical features and, in particular, to the proper combination of redox and acid properties. According to the XRD and H2-TPR results, the fine copper dispersion, obtained by changing the support and/or the copper source, improved the reducibility of the active phase, thus increasing the activity, as observed by Gabrysch et al. [46]. However, an excessive reducibility, as for Cu(M)-Zr(S), enhanced the overhydrogenolysis reaction, leading to both a lower glycerol conversion and a lower selectivity to 1,2-PDO. In the literature, the key role of metallic copper in both hydrogenation and hydrodeoxygenation reactions is widely reported [46,59,60]. Nevertheless, our results suggest a fundamental role of cuprous oxide. This species seems to promote glycerol dehydration with respect to the hydrogenolysis of 1,2-propanediol, thus improving both the activity and the selectivity.
The role of acid sites in the activation of polyols dehydration has been widely reported [61,62,63,64,65]. On the contrary, Gabrysh et al. [46] suggested that acidity does not play a significant role in the dehydration of glycerol to hydroxyacetone, assigning a dominant influence to metallic copper in both dehydration and the hydrogenation reactions. According to the NH3-TPD results, the presence of weak acid sites can enhance the selective path. By comparing the products distribution as a function of the reaction time on the different catalysts, it can be driven that weak acidity must improve product desorption, while an excess amount of strong acid sites, as for Cu(I)-Zr(S), seems to limit the activation of glycerol.
The catalytic performance of our best catalyst, i.e., Cu(M)-Zr(C), can be improved by the proper choice of the operating conditions. Higher temperature and higher H2 partial pressure increase both glycerol conversion and selectivity to 1,2-PDO, confirming that this catalyst preferentially activates the selective pathway (glycerol dehydration to hydroxyacetone + hydrogenation of hydroxyacetone to 1,2-propanediol). Good conversion and yield were obtained.
Table 3 reports some literature results in order to compare the catalytic performance of Cu(M)-Zr(C). In order to compare results obtained in different reactors, with different catalyst amounts and for different reaction times, a batch contact time (τ) has been defined and calculated as:
τ = W   ·   t V
where W is the catalyst weight, t is the reaction time, and V is the liquid volume. Actually, a straightforward comparison is difficult due to the different experimental conditions (batch contact time, temperature, H2 pressure, glycerol concentration, etc.). However, it clearly appears that Cu(M)-Zr(C) shows interesting performance with respect to the other catalysts proposed in the literature. Other literature results are reviewed in [63], but there is no performance more interesting than those reported in Table 3. Accordingly, Cu(M)-Zr(C) appears to be one of the most interesting catalysts proposed so far.

4. Materials and Methods

All the chemicals and solvents were purchased from Sigma-Aldrich (St. Louis, MO, USA) and used as received.

4.1. Preparation of Catalysts

Copper-based catalysts have good capacity to convert glycerol into 1,2-PDO. In order to achieve good yield in the desired product, four different CuO/ZrO2 catalysts were tested, as reported in Table 1.
The theoretical copper loading was constant and equal to 15 wt% as CuO. As for CuO/ZrO2 prepared by the impregnation method of copper on commercial zirconia, 3 g of ZrO2 were suspended into a copper acetate monohydrate (Cu(CH3COO)2∙H2O) solution containing the required copper amount. The impregnation method was carried out by rotary evaporation (T = 60 °C, 120 rpm, under vacuum at 200 mbar). Thus, the catalyst was calcined at 450 °C for 2 h and was sieved in order to obtain the desired granulometry between 200 and 400 μm, thus ensuring the catalyst holding between the reactor-supporting grids (d = 100 μm).
For the CuO deposition on sol–gel zirconia by impregnation method, the support was first prepared by the sol–gel method, and then, the active phase was deposited according to the procedure reported above. The sol–gel zirconia was prepared according to the following procedure. A yellow-colored gel was obtained by mixing a solution containing 10.0 mL of Zr (IV) propoxide, 1.15 mL of Hacac, and 12.0 mL of 1-propanol with a solution formed by mixing 2.6 mL of distilled water and 18.0 mL of 1-propanol. The solution obtained was vigorously stirred at room temperature until gelation occurred. After one day of aging, the gel was dried at 60 °C in a vacuum stove for an hour and then at 80 °C. Finally, the gel was calcined in air up to 450 °C with a 10 °C min−1 heating rate and held for 2 h at this temperature.
HKUST-1 crystals were allowed to grow on ZrO2 particles (commercial product or sol–gel product) under solvothermal conditions. The desired amounts of MOF precursors have been calculated with the aim of obtaining a catalyst containing a final percentage of CuOx around 15 wt%. To produce the systems MOF(HKUST-1)-ZrO2, the following amount of reactants has been introduced in a round-bottom flask: 2.5 g of ZrO2, 2 g of Cu(NO3)2·2.5 H2O, and 1 g of 1,3,5-benzenetricarboxylic acid (BTC). Then, the mixture of powders was suspended with a mixture of H2O, DMF, and EtOH (1:1:1) by sonication (30 min) and then treated for 21 h at 85 °C under solvothermal conditions. After the reaction time, the suspension was cooled down, and the material was recovered by under-vacuum filtration. The material was washed with pure ethanol and dried under vacuum at 40 °C. To confirm the formation of the expected HKUST-1 framework on ZrO2, XRD analysis of the MOF(HKUST-1)-ZrO2 system produced by using commercial ZrO2 has been carried out and reported in the Supporting Information (Supplementary Materials, Figure S1). The material was calcined in air up to 450 °C at 10 °C min−1 and held for 2 h at this temperature to obtain Cu(M)-Zr(C) or Cu(M)-Zr(S). The copper dispersion on the ZrO2 substrate before and after calcination was probed by elemental using energy-dispersive X-ray (EDX) mapping (Supporting Information, Figures S2 and S3). TG and ultimate analyses performed on the calcined samples demonstrated the complete burn off of the organic fraction at the calcination temperature (the TG plots are reported in the Supporting Information, Figure S4).

4.2. Physicochemical Characterizations

The Cu content in the catalysts was determined by Inductively Coupled Plasma Mass Spectrometry (ICP/MS) using an Agilent 7500CE instrument. The solid samples were dissolved by microwave-assisted acid digestion (US-EPA 3051 and 3052 methods). A solution of 30 analytes at various concentrations (10, 100, and 1000 μg/mL) in diluted HNO3 was used for instrument calibration. The quantitative determination of Cu was achieved extrapolating from a four-point calibration curve.
The catalysts crystal structure was investigated by X-ray diffraction (XRD). X-ray diffraction patterns of the four fresh and used catalysts were recorded using a Philips PW 1100 diffractometer (Philips, Eindhoven, The Netherlands).
Scanning electron microscopy (SEM) was carried out with an FEI Inspect microscope equipped with an EDS Oxford AZtecLiveLite probe and Xplore 30 detector for elemental analysis. Magnifications (24,000×) have been used to better define the typical morphological structures of the samples.
BET-specific surface areas (SSA) of fresh and used materials were measured by N2 adsorption at 77 K with a Quantachrome Autosorb-1C instrument after degassing the samples at 150 °C for 1.5 h.
Thermogravimetric analyses were performed in oxidative (air) environments on a Perkin–Elmer STA6000 thermogravimetric analyzer (gas flux 40 mL min−1, 50–800 °C, heating rate 10 °C min−1).
Temperature-programmed desorption of ammonia (NH3-TPD) was performed by a Micromeritics Autochem II 2020 (Micromeritics, Norcross, GA, USA) equipped with a TC detector (Norcross, GA, USA). For each fresh and used catalyst, NH3-TPD analyses were carried out, which were followed by a H2-TPR (temperature-programmed reduction in hydrogen) and finally a further NH3-TPD. The TPD analysis provides an indication of acidity, while the TPR is used to evaluate the reducibility of samples. The NH3-TPD and H2-TPR profiles were deconvolved using Origin software (OriginPro 2015 version) (OriginLab Corporation, Northampton, MA, USA, 2015).

4.3. Catalytic Tests

Catalytic tests were conducted in a lab-scale test rig, using a batch reactor. A commercial reactor (Parr 4567) was used to carry out the three-phase (solid–liquid–gas) catalytic tests. The reacting system was constituted by a 450 mL stainless-steel vessel and a stainless-steel flow guide with a 12 mL basket for catalyst hosting; two stainless-steel grids (100 µm mesh) guarantee that the catalyst (particle size > 125 µm) is not recirculated inside the vessel (Figure 12). This special configuration allows a continuous vertical flow through the catalyst (Figure 13). The reactor was equipped with two pressure gauges, a propeller, an electric furnace, a gas and a liquid sampling valve, and a control system of characteristic parameters. This system was configured to carry out activity tests in a wide range of operating conditions by controlling and measuring several operating parameters, such as temperature, rotation speed, operating pressure, and composition of gas and liquid phases. The flow guide ensures that the liquid flows upstream through the catalyst basket, reaching the top of the guide, where it enters in contact with the gas phase, and it is then recirculated to the bottom of the vessel flowing in the annulus of the flow guide.
About 1 g of catalyst is used and diluted with quartz powder (particle size 125 < dp < 300 µm); the catalyst is pre-reduced in situ by hydrogen (20% H2/N2) at 200 °C and 20 bar(g) for 10 h. Then, a water–glycerol solution (4 wt% of glycerol; 200 mL) is inserted into the reactor. Gases are loaded at the desired pressure and composition, and the reactor is heated up to the desired temperature. Some withdrawals during tests (1 mL of the reacted liquid mixture) are performed and analyzed off-line by HPLC and GC. Liquid analysis was performed by a high-pressure liquid chromatography (HPLC) system (Agilent1100), which was provided with a refractive index detector (RID) and a diode array type of UV/VIS Detector (DAD) to evaluate 1,2-PDO, hydroxyacetone, ethylene glycol, and 1-propanol, and by a gas chromatography system (Agilent Technologies 6850) to evaluate glycerol. Mass balance was closed within ± 10%.
Catalytic tests were carried out in the temperature range of 200–240 °C, at different rotation speeds (500–1000 rpm), and H2 partial pressures (20–100 vol%); the starting pressure was constant and equal to 20 bar(g).
The same sample of each catalyst was used for all the catalytic tests; accordingly, each sample worked for more than 100 h (the most used samples, as Cu(M)-Zr(C), for more than 200 h). Some of the first tests were repeated at the end of the experimental campaign (i.e., after more than 100 h reaction), and the results were within the experimental error, suggesting no sign of deactivation. Thus, samples can be considered stable and reusable. However, copper sintering with lower activity has been reported under reaction conditions [46,47]. Evidently, copper reorganization on our samples occurs during the first run (lasting 24 h), thus not affecting the successive reaction tests.

5. Conclusions

Copper–zirconia catalysts were successfully prepared by dvanced preparation methods, including copper deposition via metal–organic framework thermal decomposition (MOFMS approach) and support preparation via sol–gel and tested in the hydrogenolysis of glycerol to 1,2-propanediol.
Cu(M)-Zr(C), i.e., the catalyst prepared by copper deposition via metal–organic framework decomposition onto commercial zirconia, showed the best catalytic performance, reaching 75% yield, representing a good performance with respect to those reported in the scientific literature.
The significant catalytic performance is due to a combination of redox and acid properties. The presence on the used sample of a non-negligible fraction of cuprous oxide and of weak acid sites seems fundamental to preferentially activate the selective pathway. In particular, these features avoid the overhydrogenolysis of 1,2-propanediol to 1-propanol and enhance glycerol dehydration to hydroxyacetone and the successive hydrogenation of hydroxyacetone to 1,2-propanediol.

Supplementary Materials

The following are available online at https://www.mdpi.com/article/10.3390/catal12010072/s1, Section S1: Additional characterization of catalysts precursors, as-prepared and used catalysts. (Table S1: Elemental analysis of fresh and used samples; Figure S1: XRD analysis of MOF(HKUST-1)-Zr(C) and Cu(M)-Zr(C) samples; Figure S2: SEM micrograph of MOF(HKUST-1)-Zr(C) (left panel) and its corresponding O, Zn, Cu combined EDS map (right panel); Figure S3: SEM micrograph of Cu(M)-Zr(C) (left panel) and its corresponding O, Zn, Cu combined EDS map (right panel); Figure S4: TG in air environment on MOF(HKUST-1), MOF(HKUST-1)-Zr(C), and Cu(M)-Zr(C) samples), Section S2: Fluid dynamics and mass transfer calculations. (Table S2: values used for calculations; Table S3: results of calculations).

Author Contributions

Conceptualization, G.L. (Gianluca Landi); methodology, G.L. (Giuseppina Luciani), G.L. (Gianluca Landi) and M.A.; validation, G.L. (Giuseppina Luciani), G.R. and M.A.; formal analysis, G.L. (Gianluca Landi) and A.D.B.; investigation, G.L. (Giuseppina Luciani), G.R., G.L. (Gianluca Landi), V.G. and M.A.; resources, G.L. (Giuseppina Luciani), G.R., V.G. and M.A.; data curation, G.R. and V.G.; writing—original draft preparation, G.L. (Giuseppina Luciani), G.L. (Gianluca Landi) and A.D.B.; writing—review and editing, G.R., V.G., M.A. and A.D.B.; visualization, V.G.; supervision, G.L. (Gianluca Landi) and A.D.B.; project administration, G.L. (Gianluca Landi) and A.D.B. All authors have read and agreed to the published version of the manuscript.

Funding

This research received no external funding.

Institutional Review Board Statement

Not applicable.

Acknowledgments

The authors gratefully acknowledge Luciano Cortese (CNR-STEMS) for EDAX survey and Fernando Stanzione (CNR-STEMS) for ICP-MS analyses.

Conflicts of Interest

The authors declare no conflict of interest.

References

  1. Ren, X.; Zhang, F.; Sudhakar, M.; Wang, N.; Dai, J.; Liu, L. Gas-phase dehydration of glycerol to acrolein catalyzed by hybrid acid sites derived from transition metal hydrogen phosphate and meso-HZSM-5. Catal. Today 2019, 332, 20–27. [Google Scholar] [CrossRef]
  2. Pagliaro, M.; Ciriminna, R.; Kimura, H.; Rossi, M.; Pina, C. Della Recent advances in the conversion of bioglycerol into value-added products. Eur. J. Lipid Sci. Technol. 2009, 111, 788–799. [Google Scholar] [CrossRef]
  3. Abreu, T.H.; Meyer, C.I.; Padró, C.; Martins, L. Acidic V-MCM-41 catalysts for the liquid-phase ketalization of glycerol with acetone. Microporous Mesoporous Mater. 2019, 273, 219–225. [Google Scholar] [CrossRef]
  4. Anitha, M.; Kamarudin, S.K.; Kofli, N.T. The potential of glycerol as a value-added commodity. Chem. Eng. J. 2016, 295, 119–130. [Google Scholar] [CrossRef]
  5. Basile, F.; Cavani, F.; Chieregato, A.; Concepción, P.; Liosi, G.; López Nieto, J.M.; Soriano, M.D.; Trevisanut, C. Glycerol oxidehydration into acrolein and acrylic acid over W/V/Nb bronzes with hexagonal structure. DGMK Tag. 2012, 2012, 189–193. [Google Scholar]
  6. Célerier, S.; Morisset, S.; Batonneau-Gener, I.; Belin, T.; Younes, K.; Batiot-Dupeyrat, C. Glycerol dehydration to hydroxyacetone in gas phase over copper supported on magnesium oxide (hydroxide) fluoride catalysts. Appl. Catal. A Gen. 2018, 557, 135–144. [Google Scholar] [CrossRef] [Green Version]
  7. Christy, S.; Noschese, A.; Lomelí-Rodriguez, M.; Greeves, N.; Lopez-Sanchez, J.A. Recent progress in the synthesis and applications of glycerol carbonate. Curr. Opin. Green Sustain. Chem. 2018, 14, 99–107. [Google Scholar] [CrossRef]
  8. Deleplanque, J.; Dubois, J.L.; Devaux, J.F.; Ueda, W. Production of acrolein and acrylic acid through dehydration and oxydehydration of glycerol with mixed oxide catalysts. Catal. Today 2010, 157, 351–358. [Google Scholar] [CrossRef]
  9. Yfanti, V.-L.; Ipsakis, D.; Lemonidou, A.A. Kinetic study of liquid phase glycerol hydrodeoxygenation under inert conditions over a Cu-based catalyst. React. Chem. Eng. 2018, 3, 559–571. [Google Scholar] [CrossRef]
  10. Monteiro, M.R.; Kugelmeier, C.L.; Pinheiro, R.S.; Batalha, M.O.; da Silva César, A. Glycerol from biodiesel production: Technological paths for sustainability. Renew. Sustain. Energy Rev. 2018, 88, 109–122. [Google Scholar] [CrossRef]
  11. Pourmohammadi-Mahunaki, M.; Haddadi-Asl, V.; Roghani-Mamaqani, H.; Koosha, M.; Yazdi, M. Effect of chain extender length and molecular architecture on phase separation and rheological properties of ether-based polyurethanes. Polym. Bull. 2021, 1–16. [Google Scholar] [CrossRef]
  12. Zhang, M.; Ye, W.; Liao, Z. Preparation, Characterization and Properties of Flame Retardant Unsaturated Polyester Resin Based on r-PET. J. Polym. Environ. 2021, 1–11. [Google Scholar] [CrossRef]
  13. Kaur, J.; Sarma, A.K.; Jha, M.K.; Gera, P. Valorisation of crude glycerol to value-added products: Perspectives of process technology, economics and environmental issues. Biotechnol. Rep. 2020, 27, e00487. [Google Scholar] [CrossRef] [PubMed]
  14. Pandhare, N.N.; Pudi, S.M.; Biswas, P.; Sinha, S. Selective hydrogenolysis of glycerol to 1,2-propanediol over highly active and stable Cu/MgO catalyst in the vapor phase. Org. Process Res. Dev. 2016, 20, 1059–1067. [Google Scholar] [CrossRef]
  15. Salgado, A.L.P.; Araújo, F.C.; Soares, A.V.H.; Xing, Y.; Passos, F.B. Glycerol hydrogenolysis over Ru-Cu bimetallic catalysts supported on modified zirconias. Appl. Catal. A Gen. 2021, 626, 118359. [Google Scholar] [CrossRef]
  16. Rodrigues, R.; Isoda, N.; Gonçalves, M.; Figueiredo, F.C.A.; Mandelli, D.; Carvalho, W.A. Effect of niobia and alumina as support for Pt catalysts in the hydrogenolysis of glycerol. Chem. Eng. J. 2012, 198–199, 457–467. [Google Scholar] [CrossRef]
  17. Pendem, C.; Gupta, P.; Chaudhary, N.; Singh, S.; Kumar, J.; Sasaki, T.; Datta, A.; Bal, R. Aqueous phase reforming of glycerol to 1,2-propanediol over Pt-nanoparticles supported on hydrotalcite in the absence of hydrogen. Green Chem. 2012, 14, 3107–3113. [Google Scholar] [CrossRef]
  18. Checa, M.; Marinas, A.; Marinas, J.M.; Urbano, F.J. Deactivation study of supported Pt catalyst on glycerol hydrogenolysis. Appl. Catal. A Gen. 2015, 507, 34–43. [Google Scholar] [CrossRef]
  19. Mane, R.; Patil, S.; Shirai, M.; Rayalu, S.; Rode, C. Influence of carbon based supports on selectivity behavior of diols and propanol in Ru catalyzed glycerol hydrogenolysis. Appl. Catal. B Environ. 2017, 204, 134–146. [Google Scholar] [CrossRef]
  20. Balaraju, M.; Rekha, V.; Devi, B.L.A.P.; Prasad, R.B.N.; Prasad, P.S.S.; Lingaiah, N. Surface and structural properties of titania-supported Ru catalysts for hydrogenolysis of glycerol. Appl. Catal. A Gen. 2010, 384, 107–114. [Google Scholar] [CrossRef]
  21. Meena, M.L.; Pandey, D.K.; Malviya, H.; Biswas, P. Kinetic Model for the Manufacturing of 1,2-Propanediol (1,2-PDO) via Hydrogenolysis of Bio-glycerol Over Layered Double Hydroxide (LDH) Derived Cu0.45Zn0.15Mg5.4Al2O9 Catalyst in an Autoclave Reactor. Catal. Lett. 2021, 1, 1–9. [Google Scholar] [CrossRef]
  22. Azri, N.; Irmawati, R.; Nda-Umar, U.I.; Saiman, M.I.; Taufiq-Yap, Y.H. Promotional effect of transition metals (Cu, Ni, Co, Fe, Zn)–supported on dolomite for hydrogenolysis of glycerol into 1,2-propanediol. Arab. J. Chem. 2021, 14, 103047. [Google Scholar] [CrossRef]
  23. Freitas, I.C.; Manfro, R.L.; Souza, M.M.V.M. Hydrogenolysis of glycerol to propylene glycol in continuous system without hydrogen addition over Cu-Ni catalysts. Appl. Catal. B Environ. 2018, 220, 31–41. [Google Scholar] [CrossRef]
  24. Wang, C.; Jiang, H.; Chen, C.; Chen, R.; Xing, W. Solvent effect on hydrogenolysis of glycerol to 1,2-propanediol over Cu-ZnO catalyst. Chem. Eng. J. 2015, 264, 344–350. [Google Scholar] [CrossRef]
  25. Guo, L.; Zhou, J.; Mao, J.; Guo, X.; Zhang, S. Supported Cu catalysts for the selective hydrogenolysis of glycerol to propanediols. Appl. Catal. A Gen. 2009, 367, 93–98. [Google Scholar] [CrossRef]
  26. Omar, L.; Perret, N.; Daniele, S. Self-assembled hybrid zno nanostructures as supports for copper-based catalysts in the hydrogenolysis of glycerol. Catalysts 2021, 11, 516. [Google Scholar] [CrossRef]
  27. Poddar, M.K.; Pandey, A.; Jha, M.K.; Andola, S.C.; Ali, S.S.; Bhandari, S.; Sahani, G.K.; Bal, R. Aqueous phase hydrogenolysis of renewable glycerol to 1,2-propanediol over bimetallic highly stable and efficient Ni-Cu/Al2O3 catalyst. Mol. Catal. 2021, 515, 111943. [Google Scholar] [CrossRef]
  28. Zhu, S.; Gao, X.; Zhu, Y.; Zhu, Y.; Zheng, H.; Li, Y. Promoting effect of boron oxide on Cu/SiO2 catalyst for glycerol hydrogenolysis to 1,2-propanediol. J. Catal. 2013, 303, 70–79. [Google Scholar] [CrossRef]
  29. Zhu, S.; Gao, X.; Zhu, Y.; Fan, W.; Wang, J.; Li, Y. A highly efficient and robust Cu/SiO2 catalyst prepared by the ammonia evaporation hydrothermal method for glycerol hydrogenolysis to 1,2-propanediol. Catal. Sci. Technol. 2015, 5, 1169–1180. [Google Scholar] [CrossRef]
  30. Wu, Z.; Mao, Y.; Song, M.; Yin, X.; Zhang, M. Cu/boehmite: A highly active catalyst for hydrogenolysis of glycerol to 1,2-propanediol. Catal. Commun. 2013, 32, 52–57. [Google Scholar] [CrossRef]
  31. Huang, Z.; Cui, F.; Xue, J.; Zuo, J.; Chen, J.; Xia, C. Cu/SiO2 catalysts prepared by hom- and heterogeneous deposition-precipitation methods: Texture, structure, and catalytic performance in the hydrogenolysis of glycerol to 1,2-propanediol. Catal. Today 2012, 183, 42–51. [Google Scholar] [CrossRef]
  32. Garcés, J.; Arrué, R.; Novoa, N.; Peixoto, A.F.; Chimentão, R.J. Glycerol valorization over zro2-supported copper nanoparticles catalysts prepared by chemical reduction method. Catalysts 2021, 11, 1040. [Google Scholar] [CrossRef]
  33. Balaraju, M.; Jagadeeswaraiah, K.; Prasad, P.S.S.; Lingaiah, N. Catalytic hydrogenolysis of biodiesel derived glycerol to 1,2-propanediol over Cu-MgO catalysts. Catal. Sci. Technol. 2012, 2, 1967–1976. [Google Scholar] [CrossRef]
  34. Yun, D.; Yun, Y.S.; Kim, T.Y.; Park, H.; Lee, J.M.; Han, J.W.; Yi, J. Mechanistic study of glycerol dehydration on Brønsted acidic amorphous aluminosilicate. J. Catal. 2016, 341, 33–43. [Google Scholar] [CrossRef]
  35. Yuan, Z.; Wang, J.; Wang, L.; Xie, W.; Chen, P.; Hou, Z.; Zheng, X. Biodiesel derived glycerol hydrogenolysis to 1,2-propanediol on Cu/MgO catalysts. Bioresour. Technol. 2010, 101, 7088–7092. [Google Scholar] [CrossRef] [PubMed]
  36. Yuan, J.; Li, S.; Yu, L.; Liu, Y.; Cao, Y. Efficient catalytic hydrogenolysis of glycerol using formic acid as hydrogen source. Cuihua Xuebao/Chin. J. Catal. 2013, 34, 2066–2074. [Google Scholar] [CrossRef]
  37. Vitiello, G.; Clarizia, L.; Abdelraheem, W.; Esposito, S.; Bonelli, B.; Ditaranto, N.; Vergara, A.; Nadagouda, M.; Dionysiou, D.D.; Andreozzi, R.; et al. Near UV-Irradiation of CuOx-Impregnated TiO2 Providing Active Species for H2 Production Through Methanol Photoreforming. ChemCatChem 2019, 11, 4314–4326. [Google Scholar] [CrossRef]
  38. Alfè, M.; Gargiulo, V.; Amati, M.; Maraloiu, V.A.; Maddalena, P.; Lettieri, S. Mesoporous tio2 from metal-organic frameworks for photo-luminescence-based optical sensing of oxygen. Catalysts 2021, 11, 795. [Google Scholar] [CrossRef]
  39. Liu, Y.; Xu, X.; Shao, Z.; Jiang, S.P. Metal-organic frameworks derived porous carbon, metal oxides and metal sulfides-based compounds for supercapacitors application. Energy Storage Mater. 2020, 26, 1–22. [Google Scholar] [CrossRef]
  40. Song, Y.; Li, X.; Sun, L.; Wang, L. Metal/metal oxide nanostructures derived from metal-organic frameworks. RSC Adv. 2015, 5, 7267–7279. [Google Scholar] [CrossRef]
  41. Raptopoulou, C.P. Metal-organic frameworks: Synthetic methods and potential applications. Materials 2021, 14, 310. [Google Scholar] [CrossRef]
  42. Gonzalez, R.D.; Lopez, T.; Gomez, R. Sol-gel preparation of supported metal catalysts. Catal. Today 1997, 35, 293–317. [Google Scholar] [CrossRef]
  43. Alfè, M.; Gargiulo, V.; Lisi, L.; Di Capua, R. Synthesis and characterization of conductive copper-based metal-organic framework/graphene-like composites. Mater. Chem. Phys. 2014, 147, 744–750. [Google Scholar] [CrossRef]
  44. Alfe, M.; Policicchio, A.; Lisi, L.; Gargiulo, V. Solid sorbents for CO2 and CH4 adsorption: The effect of metal organic framework hybridization with graphene-like layers on the gas sorption capacities at high pressure. Renew. Sustain. Energy Rev. 2021, 141, 110816. [Google Scholar] [CrossRef]
  45. Casaletto, M.P.; Landi, G.; Lisi, L.; Patrono, P.; Pinzari, F. Effect of the support on the catalytic properties of vanadyl phosphate in the oxidative dehydrogenation of propane. J. Mol. Catal. A Chem. 2010, 329, 50–56. [Google Scholar] [CrossRef]
  46. Gabrysch, T.; Peng, B.; Bunea, S.; Dyker, G.; Muhler, M. The Role of Metallic Copper in the Selective Hydrodeoxygenation of Glycerol to 1,2-Propanediol over Cu/ZrO2. ChemCatChem 2018, 10, 1344–1350. [Google Scholar] [CrossRef]
  47. Vasiliadou, E.S.; Lemonidou, A.A. Investigating the performance and deactivation behaviour of silica-supported copper catalysts in glycerol hydrogenolysis. Appl. Catal. A Gen. 2011, 396, 177–185. [Google Scholar] [CrossRef]
  48. Sherafat, Z.; Antunes, I.; Almeida, C.; Frade, J.R.; Paydar, M.H.; Mather, G.C.; Fagg, D.P. Enhanced BaZrO3 mechanosynthesis by the use of metastable ZrO2 precursors. Dalt. Trans. 2014, 43, 9324–9333. [Google Scholar] [CrossRef] [PubMed]
  49. Luo, M.F.; Zhong, Y.J.; Yuan, X.X.; Zheng, X.M. TPR and TPD studies of CuO/CeO2 catalysts for low temperature CO oxidation. Appl. Catal. A Gen. 1997, 162, 121–131. [Google Scholar] [CrossRef]
  50. Barbato, P.S.; Colussi, S.; Di Benedetto, A.; Landi, G.; Lisi, L.; Llorca, J.; Trovarelli, A. CO preferential oxidation under H2-rich streams on copper oxide supported on Fe promoted CeO2. Appl. Catal. A Gen. 2015, 506, 268–277. [Google Scholar] [CrossRef]
  51. Barbato, P.S.; Colussi, S.; Di Benedetto, A.; Landi, G.; Lisi, L.; Llorca, J.; Trovarelli, A. Origin of High Activity and Selectivity of CuO/CeO2 Catalysts Prepared by Solution Combustion Synthesis in CO-PROX Reaction. J. Phys. Chem. C 2016, 120, 13039–13048. [Google Scholar] [CrossRef]
  52. Landi, G.; Barbato, P.S.; Di Benedetto, A.; Lisi, L. Optimization of the preparation method of CuO/CeO2 structured catalytic monolith for CO preferential oxidation in H2-rich streams. Appl. Catal. B Environ. 2016, 181, 727–737. [Google Scholar] [CrossRef]
  53. Shimokawabe, M.; Asakawa, H.; Takezawa, N. Characterization of copper/zirconia catalysts prepared by an impregnation method. Appl. Catal. 1990, 59, 45–58. [Google Scholar] [CrossRef]
  54. Chary, K.V.R.; Sagar, G.V.; Srikanth, C.S.; Rao, V.V. Characterization and catalytic functionalities of copper oxide catalysts supported on zirconia. J. Phys. Chem. B 2007, 111, 543–550. [Google Scholar] [CrossRef]
  55. Martin, A.; Armbruster, U.; Atia, H. Recent developments in dehydration of glycerol toward acrolein over heteropolyacids. Eur. J. Lipid Sci. Technol. 2012, 114, 10–23. [Google Scholar] [CrossRef]
  56. Kim, Y.T.; Jung, K.D.; Park, E.D. A comparative study for gas-phase dehydration of glycerol over H-zeolites. Appl. Catal. A Gen. 2011, 393, 275–287. [Google Scholar] [CrossRef]
  57. Samson, K.; Sliwa, M.; Socha, R.P.; Góra-Marek, K.; Mucha, D.; Rutkowska-Zbik, D.; Paul, J.F.; Ruggiero-Mikoajczyk, M.; Grabowski, R.; Soczyński, J. Influence of ZrO2 structure and copper electronic state on activity of Cu/ZrO2 catalysts in methanol synthesis from CO2. ACS Catal. 2014, 4, 3730–3741. [Google Scholar] [CrossRef]
  58. Yu, H.; Fang, H.; Zhang, H.; Li, B.; Deng, F. Acidity of sulfated tin oxide and sulfated zirconia: A view from solid-state NMR spectroscopy. Catal. Commun. 2009, 10, 920–924. [Google Scholar] [CrossRef]
  59. Mane, R.B.; Yamaguchi, A.; Malawadkar, A.; Shirai, M.; Rode, C.V. Active sites in modified copper catalysts for selective liquid phase dehydration of aqueous glycerol to acetol. RSC Adv. 2013, 3, 16499–16508. [Google Scholar] [CrossRef]
  60. Sato, S.; Akiyama, M.; Takahashi, R.; Hara, T.; Inui, K.; Yokota, M. Vapor-phase reaction of polyols over copper catalysts. Appl. Catal. A Gen. 2008, 347, 186–191. [Google Scholar] [CrossRef]
  61. Montassier, C.; Ménézo, J.C.; Hoang, L.C.; Renaud, C.; Barbier, J. Aqueous polyol conversions on ruthenium and on sulfur-modified ruthenium. J. Mol. Catal. 1991, 70, 99–110. [Google Scholar] [CrossRef]
  62. Dasari, M.A.; Kiatsimkul, P.P.; Sutterlin, W.R.; Suppes, G.J. Low-pressure hydrogenolysis of glycerol to propylene glycol. Appl. Catal. A Gen. 2005, 281, 225–231. [Google Scholar] [CrossRef]
  63. Nakagawa, Y.; Tomishige, K. Heterogeneous catalysis of the glycerol hydrogenolysis. Catal. Sci. Technol. 2011, 1, 179–190. [Google Scholar] [CrossRef]
  64. Nakagawa, Y.; Ning, X.; Amada, Y.; Tomishige, K. Solid acid co-catalyst for the hydrogenolysis of glycerol to 1,3-propanediol over Ir-ReOx/SiO2. Appl. Catal. A Gen. 2012, 433–434, 128–134. [Google Scholar] [CrossRef]
  65. Balaraju, M.; Rekha, V.; Sai Prasad, P.S.; Prasad, R.B.N.; Lingaiah, N. Selective hydrogenolysis of glycerol to 1,2-propanediol over Cu-ZnO catalysts. Catal. Lett. 2008, 126, 119–124. [Google Scholar] [CrossRef]
Figure 1. XRD patterns of used samples. *: ZrO2; †: Cu; ‡: Cu2O; ¤: CuO.
Catalysts 12 00072 g001
Figure 2. SEM images of both fresh and used samples.
Catalysts 12 00072 g002
Figure 3. Profiles of H2-TPR tests over fresh samples.
Catalysts 12 00072 g003
Figure 4. Profiles of H2-TPR tests over used samples.
Catalysts 12 00072 g004
Figure 5. Profiles of NH3-TPD tests over fresh and used samples before (dark green lines) and after (dark red lines) H2-TPR tests.
Catalysts 12 00072 g005
Figure 6. Glycerol conversion (black bars) and yield to 1,2-propanediol (gray bars) for the different catalysts. T = 240 °C; initial P = 20 bar(g); H2 = 20 vol%; reaction time = 24 h; rotation speed = 500 rpm.
Catalysts 12 00072 g006
Figure 7. Selectivities to products for the different catalysts. T = 240 °C; initial P = 20 bar(g); H2 = 20 vol%; reaction time = 24 h; rotation speed = 500 rpm. (PDO = 1,2-propanediol, EG = ethylene glycol, HA = hydroxyacetone, PO = 1-propanol).
Catalysts 12 00072 g007
Figure 8. Cu(M)-Zr(C) glycerol conversion, yields, and selectivities to products as a function of the reaction time at different reaction temperatures. Initial P = 20 bar(g); H2 = 20 vol%; rotation speed = 500 rpm (PDO = 1,2-propanediol, EG = ethylene glycol, HA = hydroxyacetone, PO = 1-propanol).
Catalysts 12 00072 g008
Figure 9. Cu(M)-Zr(C) glycerol conversion, yields, and selectivities to products as a function of the reaction time at different H2 partial pressures. Initial P = 20 bar(g); T = 240 °C; rotation speed = 500 rpm (PDO = 1,2-propanediol, EG= ethylene glycol, HA = hydroxyacetone, PO = 1-propanol).
Catalysts 12 00072 g009
Figure 10. Cu(M)-Zr(C) glycerol conversion, yields, and selectivities to products as a function of the reaction time at different rotation speeds. Initial P = 20 bar(g); H2 = 100 vol%; T = 240 °C (PDO = 1,2-propanediol, EG = ethylene glycol, HA = hydroxyacetone, PO = 1-propanol).
Catalysts 12 00072 g010
Figure 11. Reaction pathways of the hydrodeoxygenation of glycerol over Cu/ZrO2 catalysts as proposed by Gabrysh et al. [46] (Copyright © 2022 John Wiley and Sons Reproduced with permission).
Catalysts 12 00072 g011
Figure 12. Pictures of the reactor vessel (a) and of the flow guide (b) with a zoom on the catalyst basket (c).
Catalysts 12 00072 g012
Figure 13. Sketch of the flow pattern through the reactor.
Catalysts 12 00072 g013
Table 1. Sample names, copper sources, approach for copper deposition, type of support, and specific surface areas (m2/g) of fresh and used samples.
SampleCu Source ApproachZrO2 SourceSSA (Fresh)SSA (Used)
Cu(I)-Zr(C)Cu(CH3COO)2ImpregnationCommercial18.18.4
Cu(I)-Zr(S)Cu(CH3COO)2ImpregnationSol–Gel91.411.5
Cu(M)-Zr(C)HKUST-1MOFMSCommercial15.66.4
Cu(M)-Zr(S)HKUST-1MOFMSSol–Gel25.823.2
Table 2. NH3 and H2 amounts (mmol/g) and H2/Cu ratios measured during NH3-TPD and H2-TPR tests over fresh and used samples.
SampleNH3—First TPDH2H2/CuNH3—Second TPD
Fresh
Cu(I)-Zr(C)1.641.3380.740.37
Cu(M)-Zr(C)1.791.7770.921.91
Cu(I)-Zr(S)2.021.9011.020.99
Cu(M)-Zr(S)2.381.9801.020.86
Used
Cu(I)-Zr(C)3.830.1130.061.02
Cu(M)-Zr(C)3.330.3790.191.23
Cu(I)-Zr(S)9.690.0650.043.89
Cu(M)-Zr(S)2.800.0050.0030.63
Table 3. Catalytic performance of different catalysts proposed for glycerol hydrogenolysis to 1,2-propanediol. τ: batch contact time (g∙h∙L−1); x: conversion (%); s: selectivity to 1,2-PDO (%); T: operating temperature (°C); xgly: glycerol concentration in the reacting liquid (wt%); ref.: reference. Values of conversion and selectivity can be indicative in some cases because they are extracted from graphs and correspond to the best yield to 1,2-propanediol.
CatalystτxsTxglyRef.
18%Cu/ZrO216080922004[46]
Cu:Zn 50:50192379220020[65]
5%(Cu-Ru)/SiO237.539.285.9240100[47]
Pt/Nb2O5/Al2O360758514020[16]
Cu(M)-Zr(C)12079952404This work
Publisher’s Note: MDPI stays neutral with regard to jurisdictional claims in published maps and institutional affiliations.

