2.1. Characterizing the Electrocatalyst
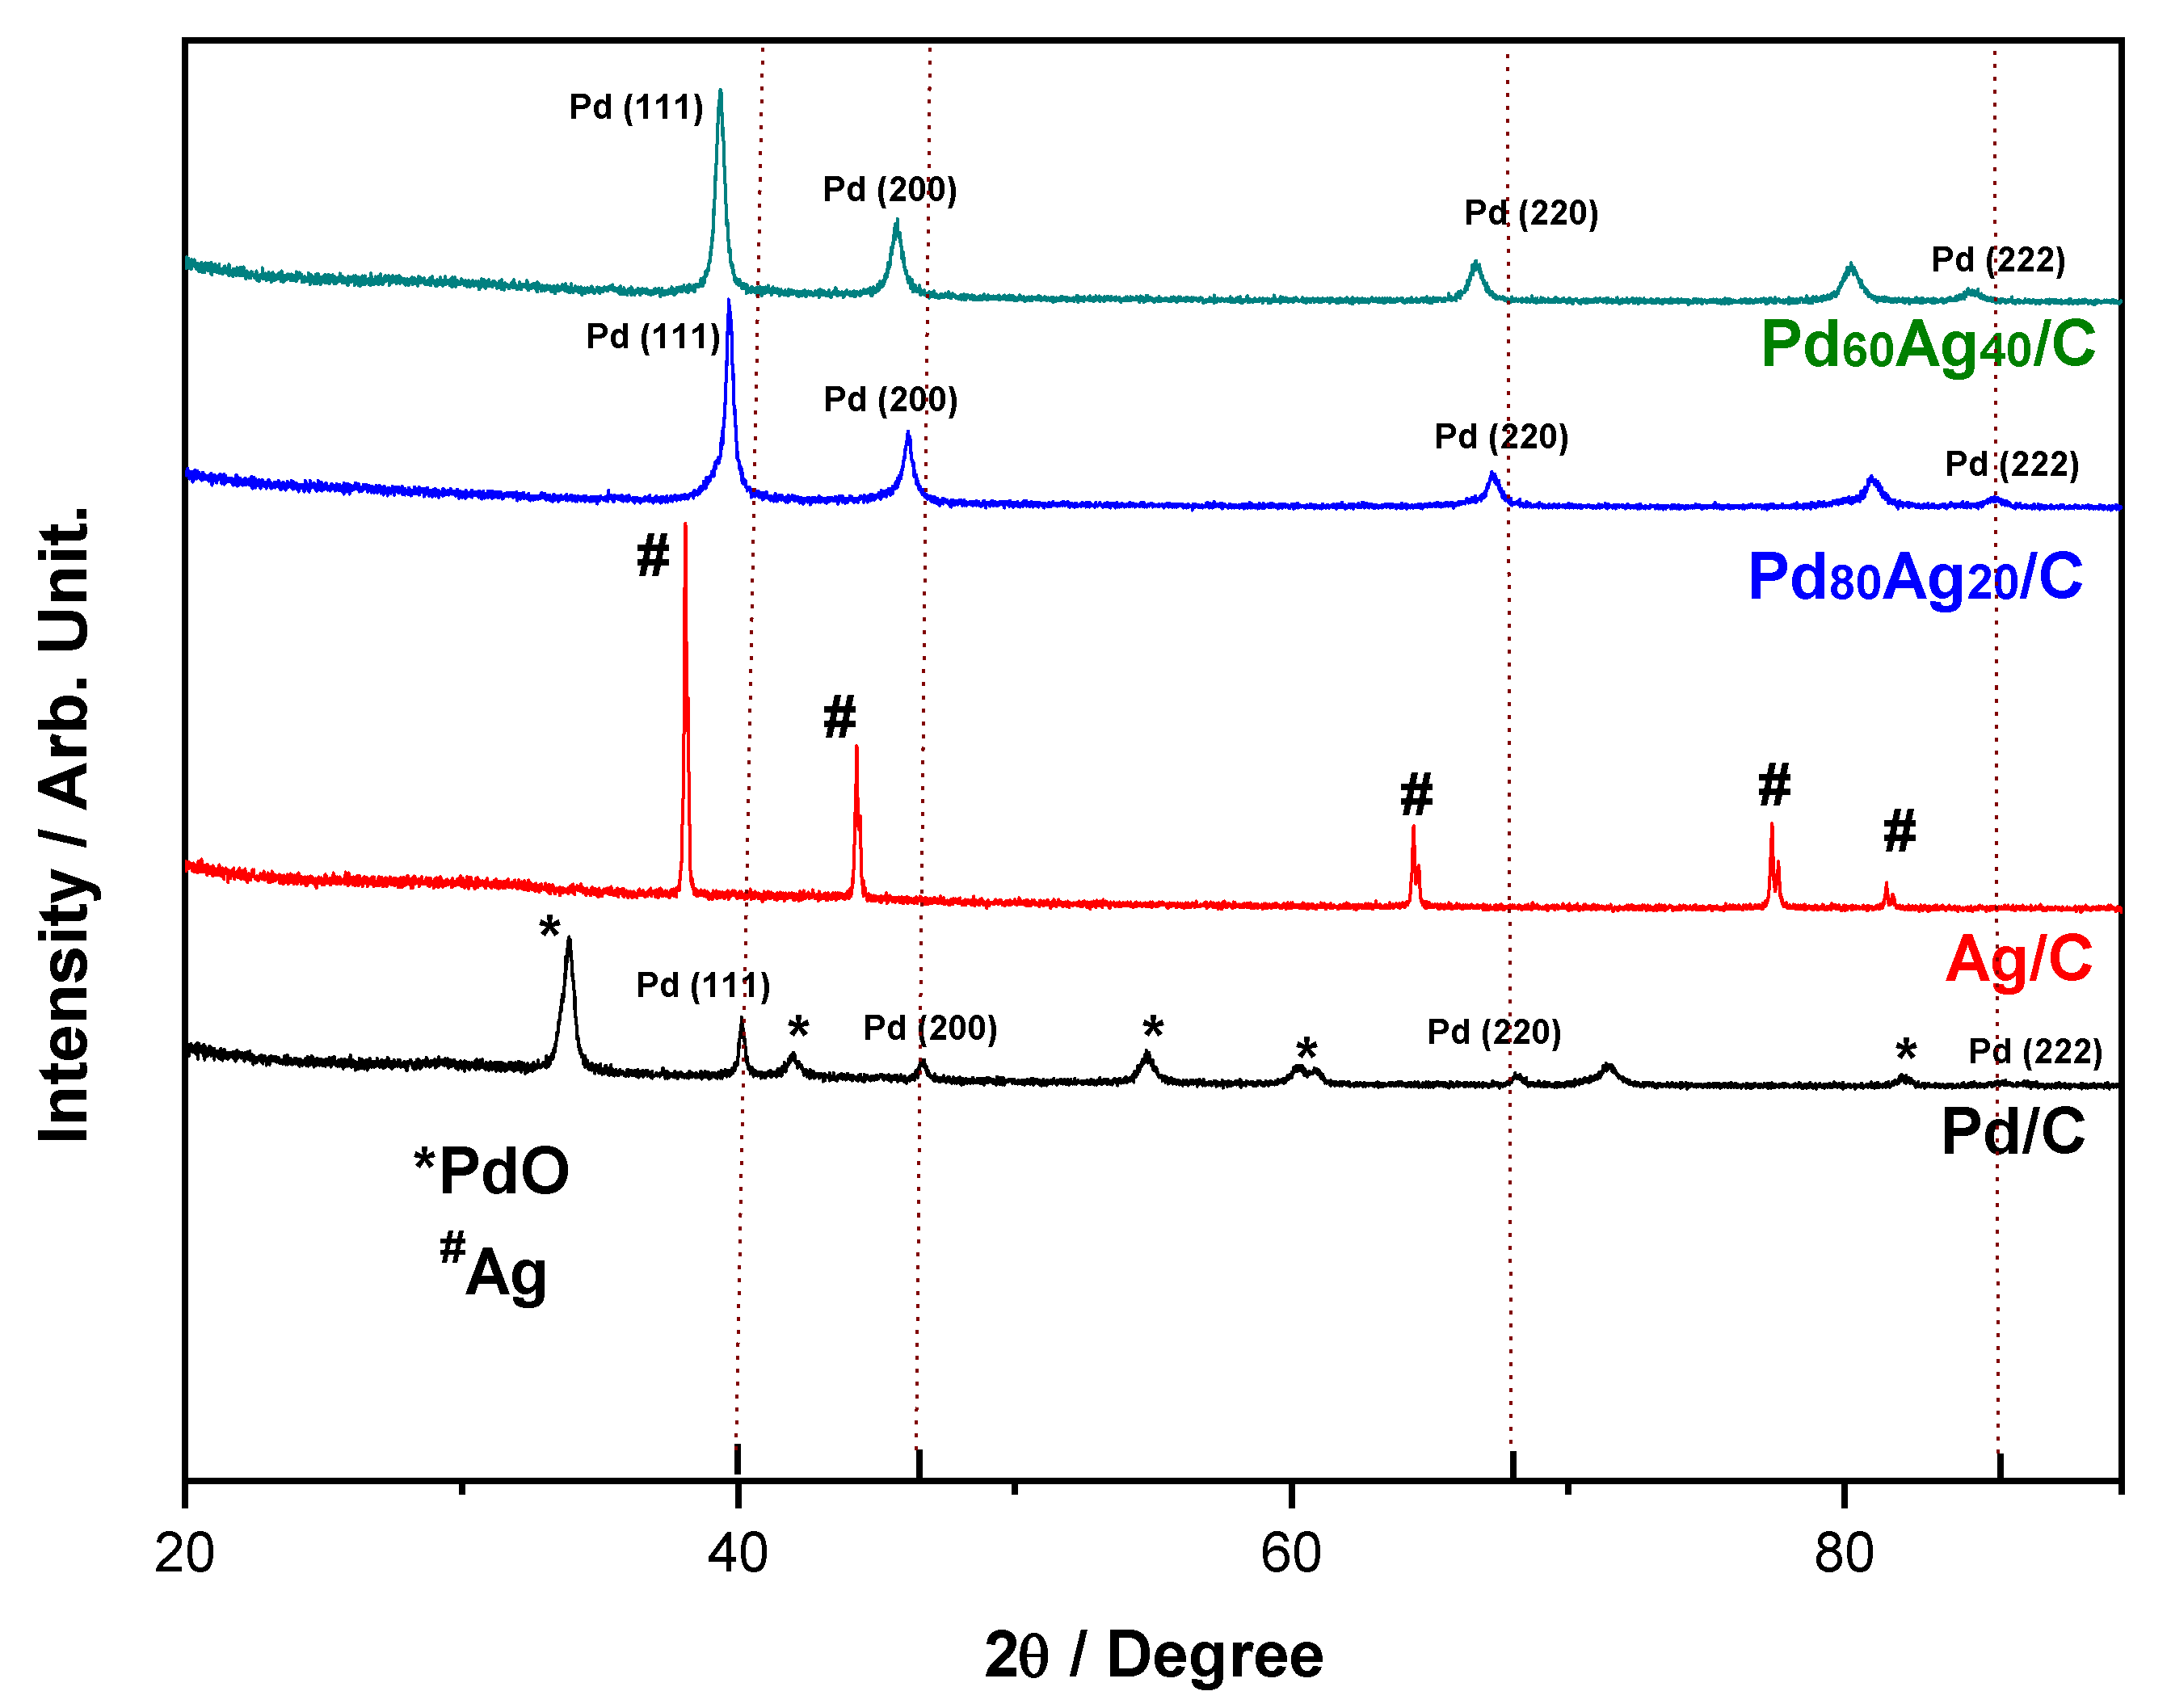
Figure 1 presents the XRD patterns of the synthesized Pd/C, PdAg/C, and Ag/C electrocatalysts. The diffractogram of Pd/C showed characteristic peaks at 2θ of 40.0°, 46.3°, 67.9°, and 85.6° that correspond to the Miller index planes (111), (200), (220), and (222), respectively (JCPDS 05-0681) [
10,
16]. Interestingly, the pristine Pd electrocatalyst also presented peaks associated with the tetragonal structure of PdO that allowed the inference of a partial Pd oxidation calcination process at 573 K. The characteristic peaks of PdO observed at 2θ of 33.5°, 41.5°, 54.3°, 59.9°, 60.5°, and 81.8° correspond to the planes (101), (110), (112), (103), (220), and (222), respectively (JCPDS 41-1107) [
23], presenting 60% peaks of this oxide and consequently a relative proportion of 1.5 in relation to the Pd peaks.
Conversely, the pristine Ag/C electrocatalyst only showed peaks associated with the fcc structure of silver domains with the absence of silver oxide structures. The characteristic peaks of Ag at 37.9°, 43.9°, 63.8°, 76.8°, and 81.1° were associated with the Miller index planes (111), (200), (220), (311), and (222), respectively.
The bimetallic electrocatalysts did not show peaks associated with PdO which indicates a stabilizing effect of Ag. The composition Pd
80Ag
20/C showed diffraction peaks at 39.9, 46.4, 67.6, and 86.1° corresponding to the Pd planes in fcc structure at (111), (200), (220), and (222) (JCPDS 87-0643), whereas the higher Ag substitution resulted in peak shifting towards low diffraction angles as the Ag atom is smaller than the Pd atom. In consequence, Pd
60Ag
40/C showed diffraction peaks at 39.4, 45.8, 67.1, and 84.9° corresponding to Pd planes in fcc structure at (111), (200), (220), and (222), respectively (JCPDS 87-0641) [
30]. It is important to note that the diffraction peaks observed showed a shift in relation to pristine Pd/C and Ag/C. These results imply the formation of an alloy solution with fcc crystalline structure, as has been previously reported in the literature for PdAg electrocatalysts [
20]. Similar behavior has been observed for other bimetallic Pd-based catalysts with other metals, such as Sn, Ni, and Mo [
10,
17].
Table 2 presents the lattice parameters a, b, and c, volume (V), and the estimated crystallite sizes (D) for the electrocatalysts. It is important to note that PdAg electrocatalysts present intermediate values for all parameters between those of pristine Pd and Ag. These results corroborate the hypothesis of the formation of a solid solution instead of the defined crystallographic domains of Ag and Pd. The addition of metals with an atomic radius greater than Pd (1.28 Å) to its structure, as for Ag (1.34 Å), increases the values of the lattice parameters, indicating an expansion of the crystalline lattice of Pd. Similar results are observed for other alloyed metals to Pd, such as Mo (1.29 Å), Au (1.34 Å), and Sn (1.40 Å) [
23,
33], whereas, the crystallite size decreases with the addition of alloyed metal atoms of larger atomic radii. This behavior is consistent with previous reports in the literature [
10,
16,
17,
23]. Yin et al. evaluated the influence of Ag concentration on the particle size and particle size distribution of Pd and observed decreasing crystallite size with increasing content of Ag [
34] (see
Table S1 in the Supplementary Materials), an observation in agreement with our results.
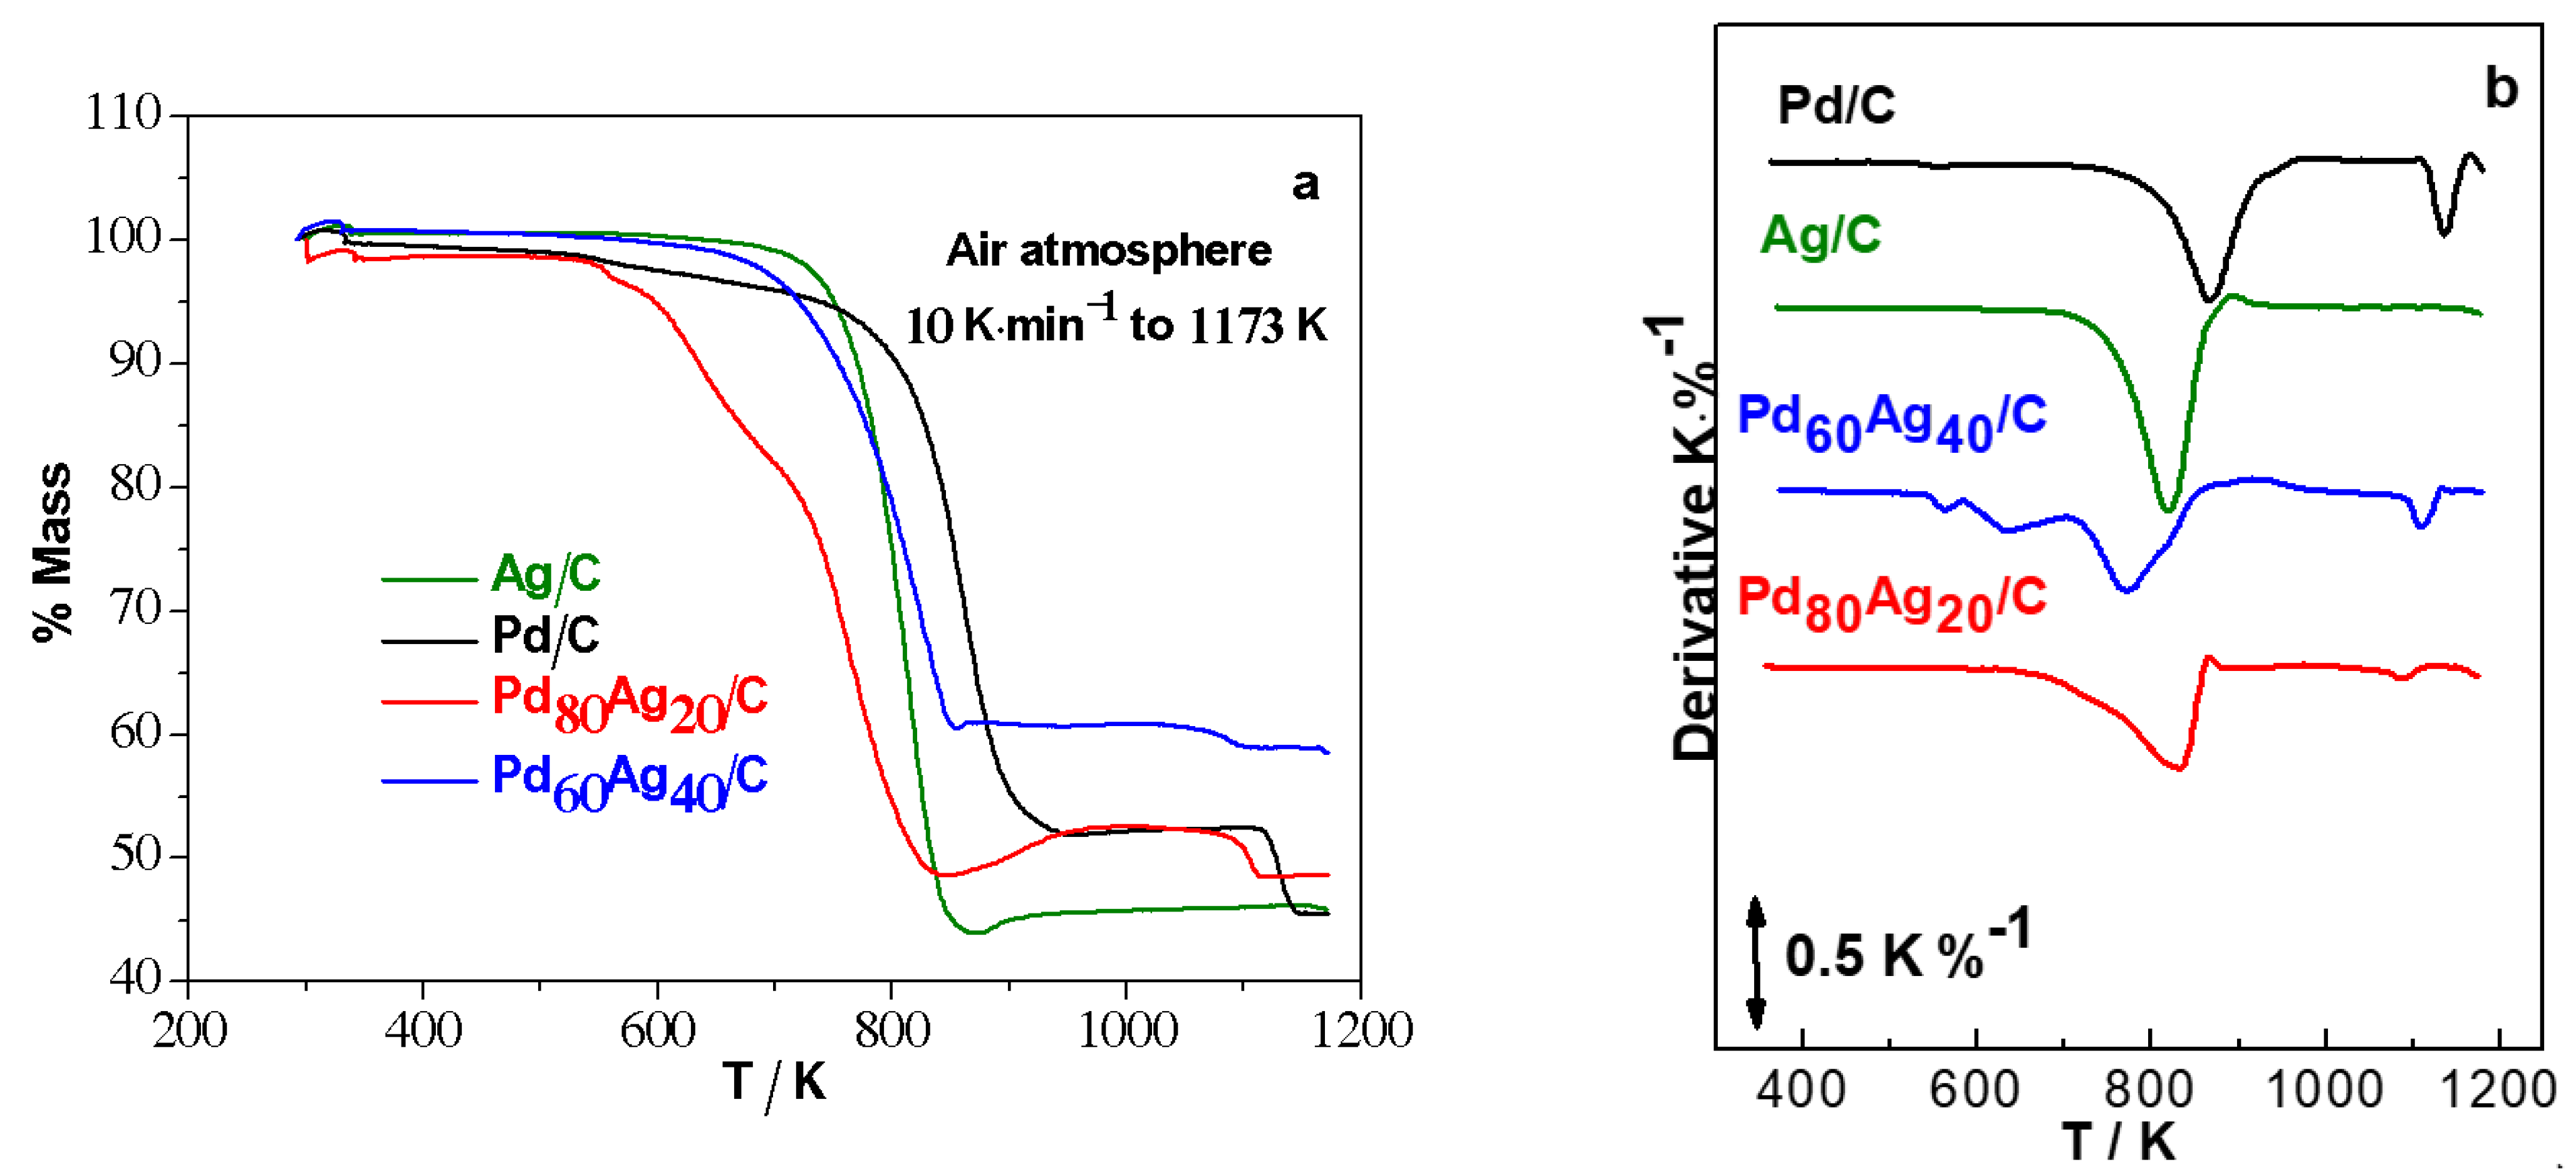
The TG/DTG analyses of
Figure 2 were performed in the temperature range 273–1200 K. The loss of mass observed is associated with the oxidation of carbon that occurs in the temperature range 600–900 K, which then allows estimation of the amount of metal, based on the remaining mass of the samples [
10,
23,
35]. The mass percentage, in combination with the EDX results, provides an accurate value of the content of Pd and Ag mass that will be used in the discussion of electrochemical properties [
23]. The peaks observed in the inflections of the DTG curves identify the temperature at which the total degradation of the carbon support occurs. It is observed that the electrocatalyst Pd
60Ag
40/C presented a lower value of temperature in the inflection peak (~770 K) in relation to the other studied electrocatalysts (i.e., above 800 K). The TG curves of the Pd/C, Pd
80Ag
20/C, and Ag/C electrocatalysts presented profiles similar to those reported by Holade et al. [
35]. The estimated C and metal values are summarized in
Table 3. It is important to note the good agreement between the theoretical compositions and experimental observations from the EDX analyses.
2.2. Benchmarking the Electrocatalytic Behavior of Bimetallic Catalysts
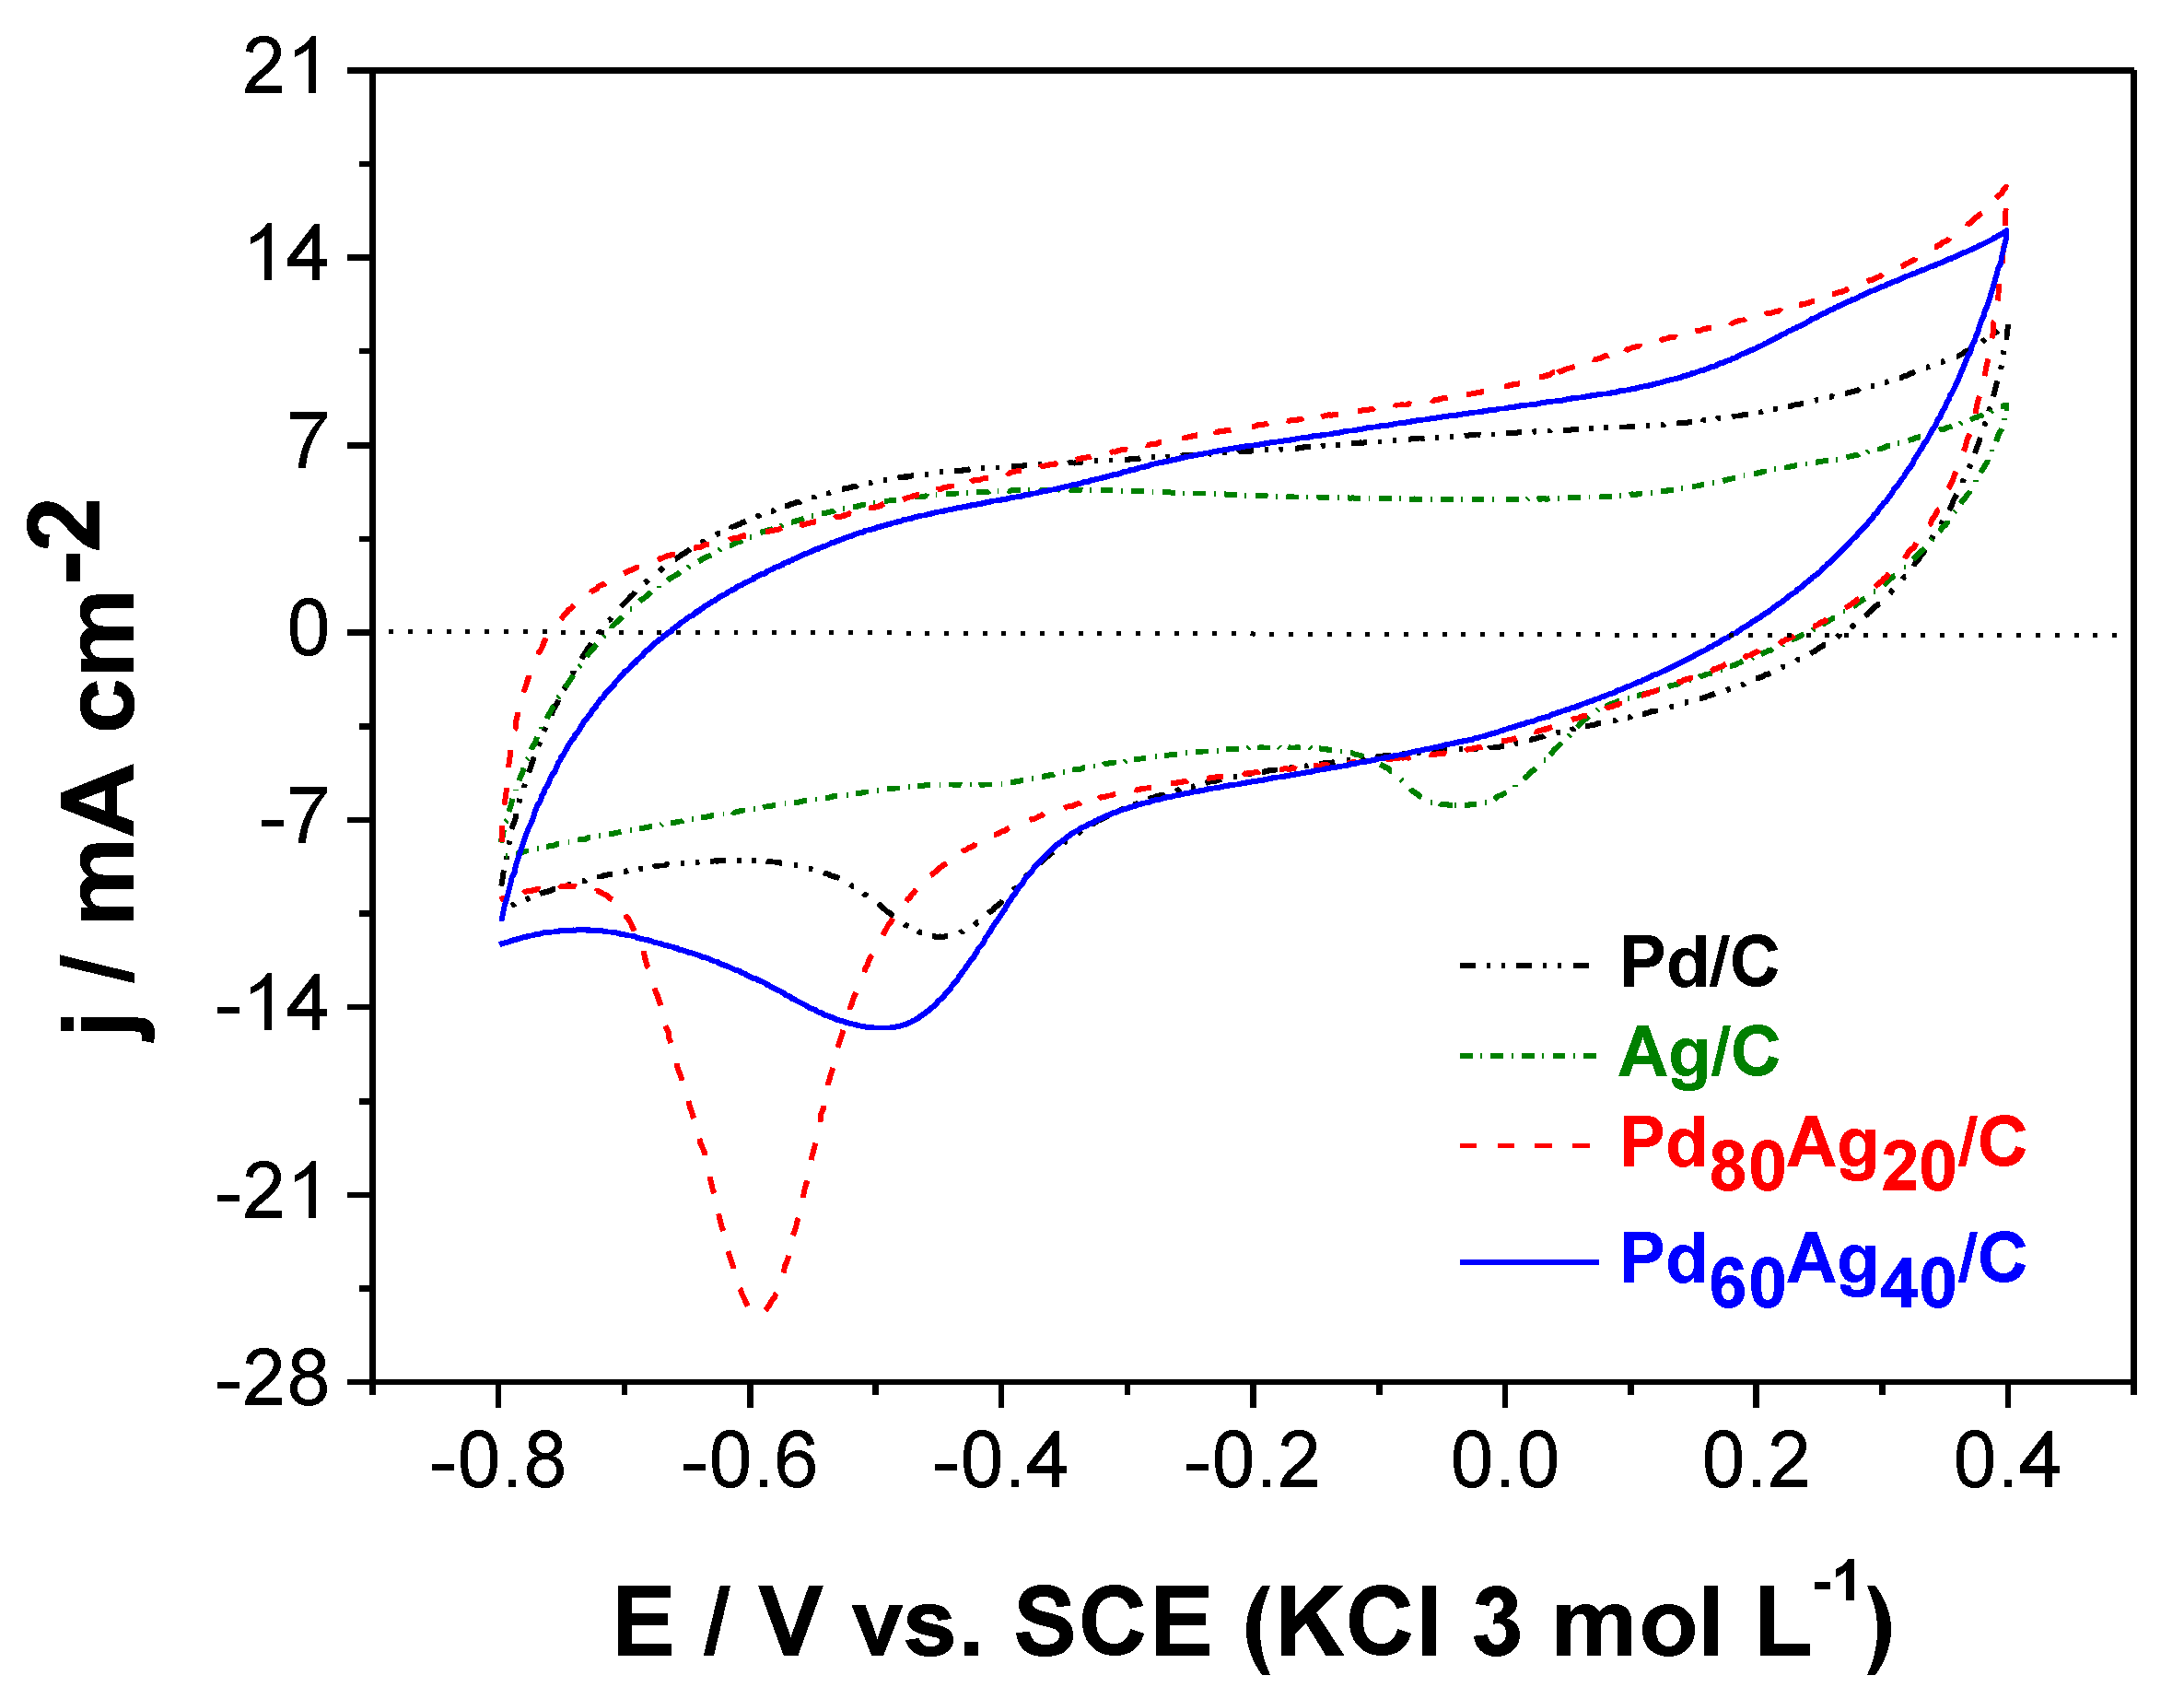
The electrocatalytic response was analyzed by cyclic voltammetry.
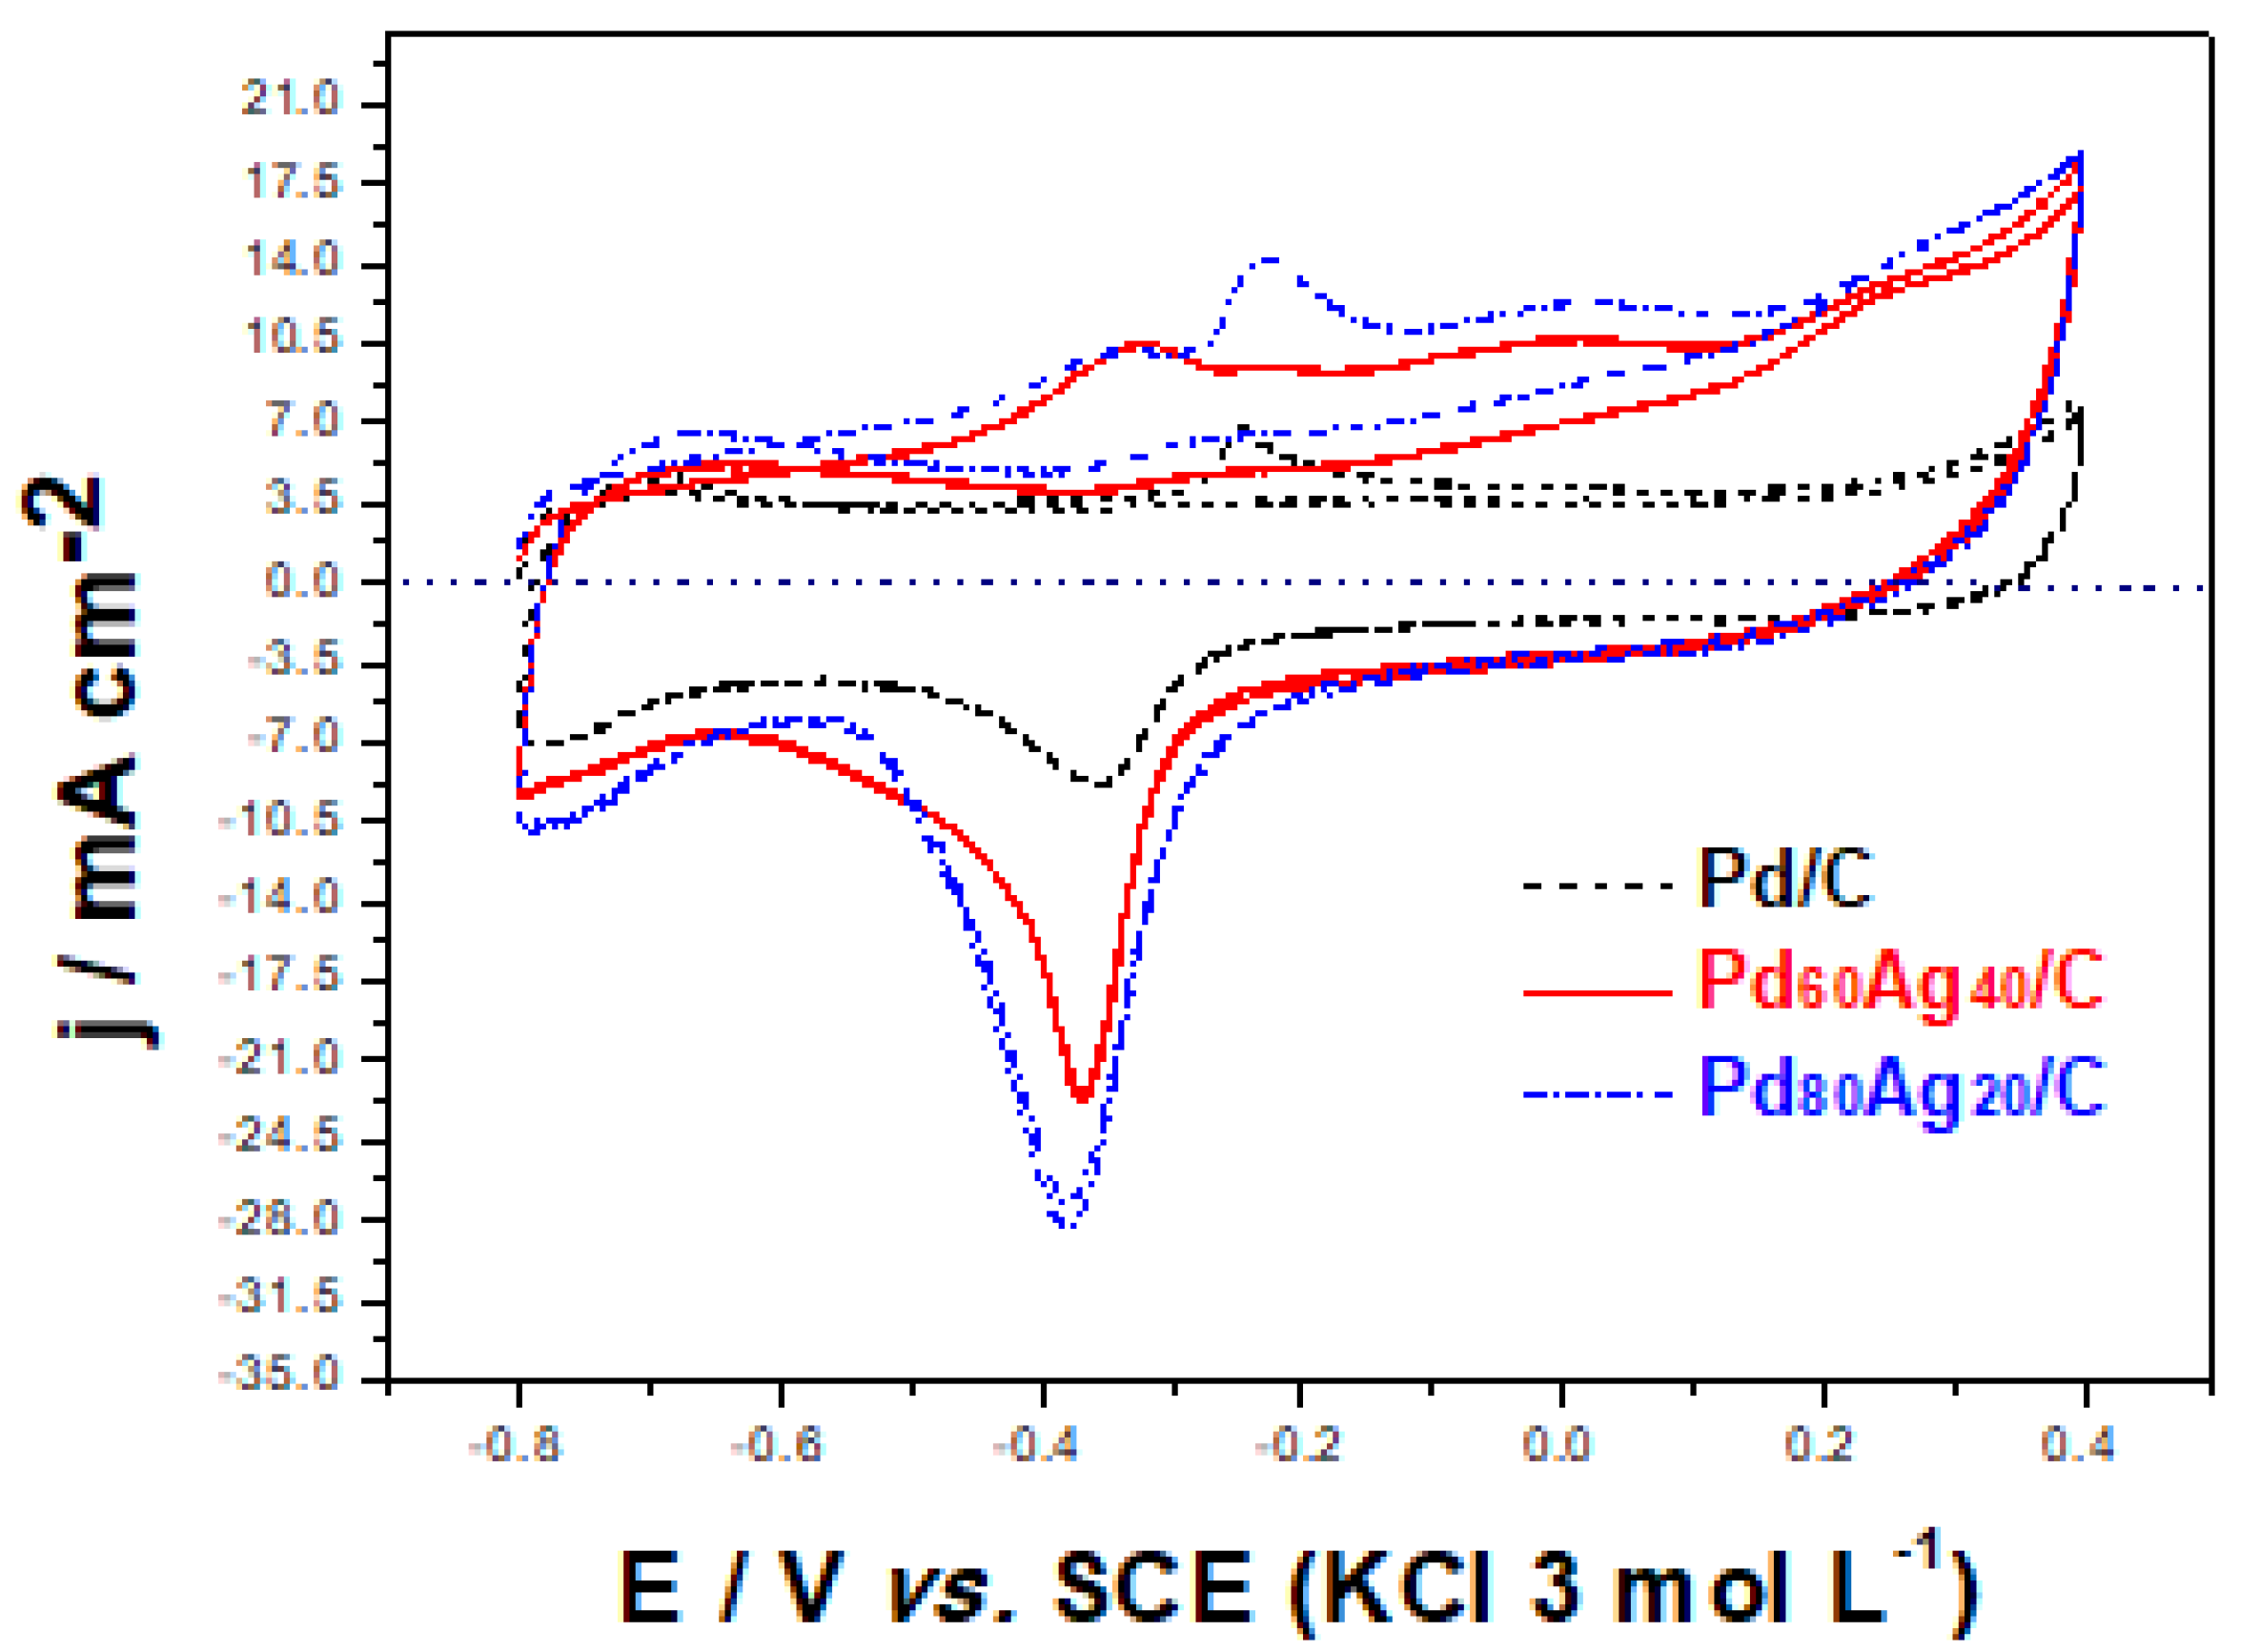
Figure 3 presents the voltammetric profile of the electrocatalysts in an alkaline medium with similar anodic and cathodic current densities in the potential range between −0.8 and 0.4 V vs. SCE. This potential range was adopted since the voltammetric curve of compounds containing Pd generally presents three distinct regions during the scan (direct and/or reverse): the so-called hydrogen region, observed between −0.8 and −0.4 V vs. SCE, the oxidation region of Pd/PdO, observed in the potential range between −0.4 and 0.4 V vs. SCE (Equations (1) and (2)) [
35] and the reduction of PdO, observed between −0.6 and −0.4 V vs. SCE (Equation (3)) [
10,
16].
The pristine Pd/C clear cathodic peak (E
cat) observed at ca.−0.42 V vs. SCE is associated with the reduction of PdO described by reaction (3). Meanwhile, the pristine Ag/C showed a cathodic peak at approximately −0.030 V vs. SCE related to the Ag
2O reduction described by Equation (4). [
35].
In contrast, the bimetallic Pd
80Ag
20/C and Pd
60Ag
40/C electrocatalysts showed slight differences. It can be observed in
Figure 3 that E
cat for PdO was displaced to more negative values when compared to the Pd/C.
Table 4 collects characteristic electrochemical figures of merit for easier comparison between pristine monometallic and bimetallic electrocatalysts. The observed displacement of the peak suggests an improvement of catalytic activity in the alkaline medium for both electrocatalysts. The formation of alloys and intermetallic phases have been demonstrated to enhance electrocatalytic responses. This improvement may be related to alloy formation in both bimetallic electrocatalysts, which would facilitate the electronic effect mechanism (an intrinsic mechanism) in which the presence of a second metal modifies the electronic structure of Pd, weakening its adsorption of oxygen-containing species [
36,
37,
38].
The bimetallic electrocatalysts could even lead to a rate-determining step with lower activation energy, which would translate into faster electrokinetics [
10,
36]. The decrease in activation energy has been recently assessed through density functional theory (DFT) calculations [
39]. The DFT results corroborated a strong PdAg interaction that would favor the formation of PdAg alloys with approximately equal concentrations of Pd and Ag as the energetically stable and favorable structure. The replacement of Pd by Ag leads to weaker intermetallic bonds that decrease CO adsorption and favor reactivity, according to DFT calculations [
39]. Our research provides experimental support for these theoretical considerations. In
Figure 3 it is possible to observe a lower E
cat value for the catalyst Pd
60Ag
40/C in relation to Pd
80Ag
20/C (
Table 4), suggesting that the decrease in the amount of Pd favored the improvement of catalytic activity. The ECSA values (calculated according to Equation (15)) observed in
Table 4 are related to several factors, including the crystallite size [
40]. The PdAg/C electrocatalysts present higher ECSA, favoring accessibility to electrocatalytic sites on the surface, which would be in good agreement with the smaller crystallite sizes observed in the previous XRD analyses (see
Table 3).
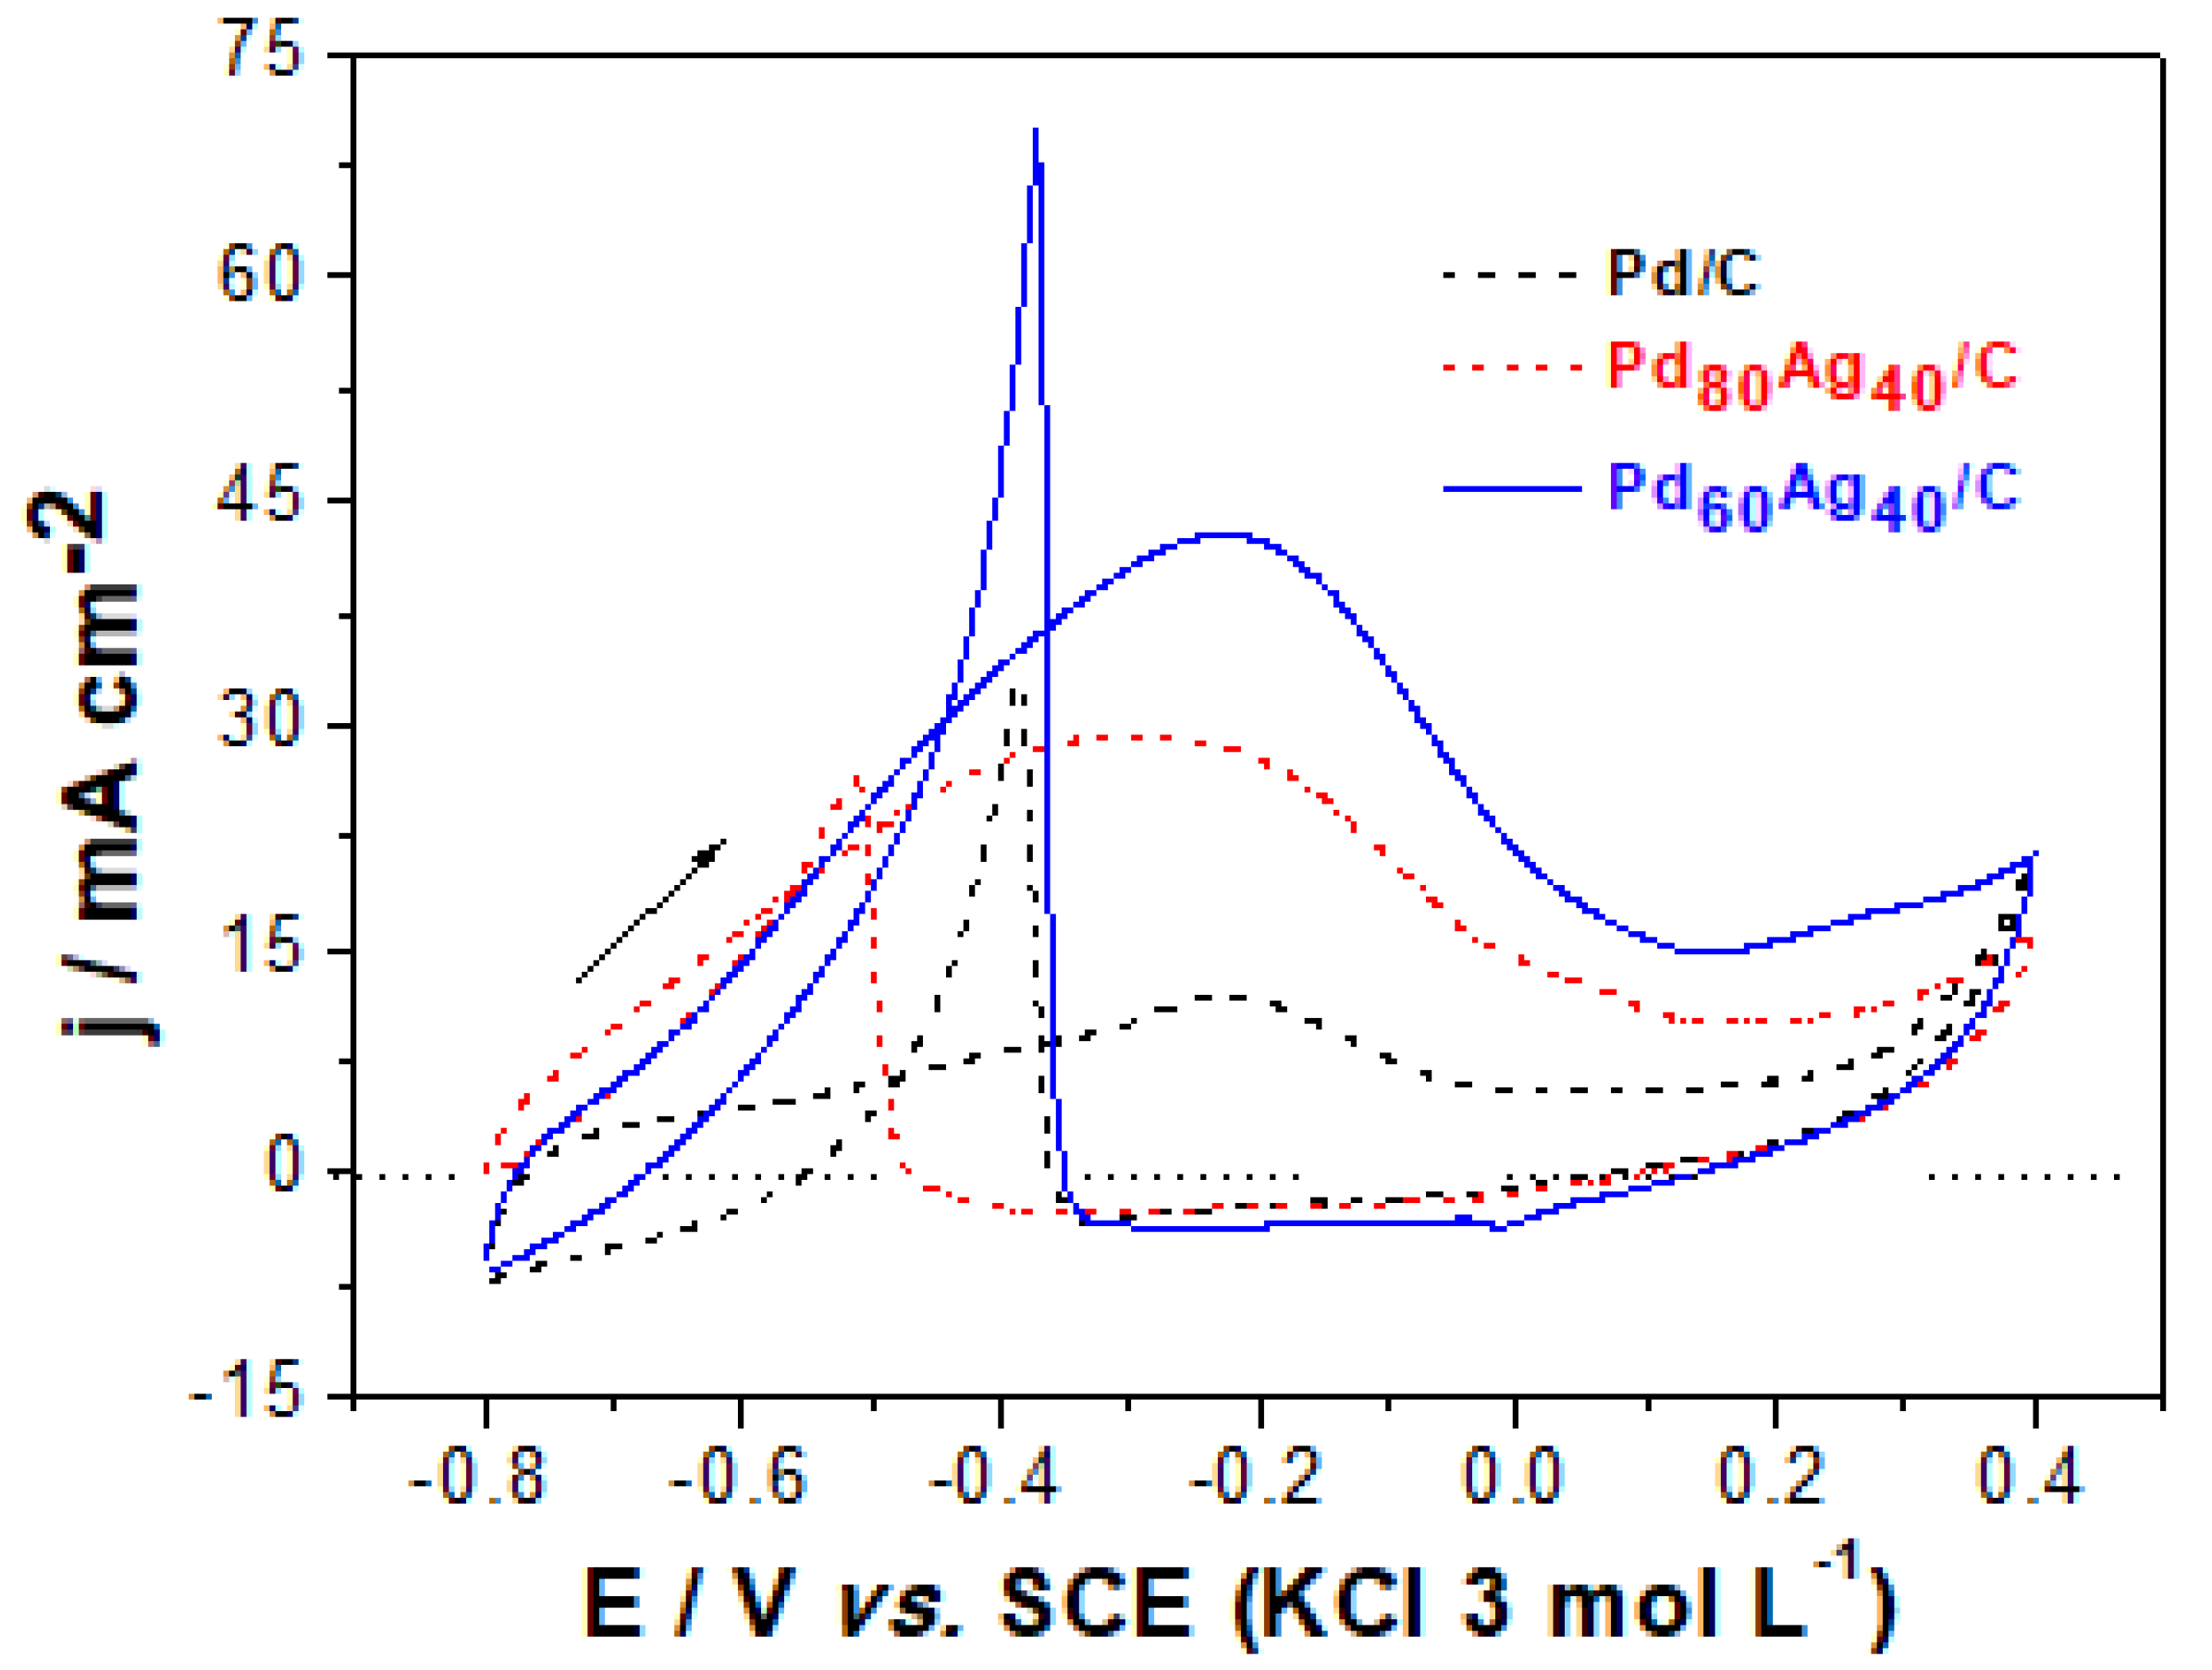
The relevant aspect of these novel bimetallic electrocatalysts is their enhanced ethanol oxidation capabilities.
Figure 4 presents the electrochemical response of the electrocatalysts in alkaline solution in the presence of ethanol as fuel (Ag/C did not show electrochemical activity for EOR). Comparing the voltammograms obtained in the presence and absence of ethanol (
Figure 3), the profiles of the curves have, as a differential element, the peak of ethanol oxidation as the main trait. Two peaks are observed in the voltammograms of EOR, related to ethanol oxidation. In the anodic scan, the peak observed corresponds to the oxidation of adsorbed species from the dissociative adsorption of ethanol. However, during the cathodic scan, the peak is associated with the removal of carbonaceous species that were not completely oxidized on the anodic scan [
37]. According to Fornazier Filho et al. [
23] and Hammed [
41] the ethanol oxidation reaction on the Pd electrocatalyst results from the adsorption of ethanol on the electrocatalytic surface, where it is not completely oxidized in an alkaline medium and can be represented by Equations (5)–(8).
The values of the EOR initiation potentials (E
onset) collected in
Table 4 indicate which are the best electrocatalysts for this process. The addition of Ag to Pd shifts the E
onset values towards desired, more negative, values [
40]. It can be inferred from
Table 4 that more negative E
onset values can be achieved as the amount of Ag increases. This result suggested a higher facility to initiate the ethanol oxidation [
10] due to the Pd structure modification by Ag occurring in the bimetallic compositions. The values of the maximum peaks of current densities are also presented in
Table 4. It can be observed that the addition of Ag promotes an increase in the values of
j, demonstrating a higher catalytic activity for PdAg/C.
It was also observed that the decrease in Pd mass favored an increase in current (
Table 4 and
Figure S2 Supplementary Materials). Regarding the Pd
80Ag
20/C electrocatalyst, there was a decrease of approximately 15% in mass and an observed increase in current of approximately 65%. Regarding the Pd
60Ag
40/C electrocatalyst, there was a decrease in mass by approximately 36% and an observed increase in current of approximately 80%. These results confirm the improvement in the catalytic activity of the electrocatalysts with decrease in Pd mass.
The values observed in
Figure 4 and
Table 4 also show that the presence of PdO in the electrocatalyst structure (
Figure 1) did not exert an influence or enhance the catalytic activity of the electrocatalyst, as has been reported for other oxides, such as NiO
2 [
10] and RuO
2 [
16,
23]. The tolerance of the electrocatalysts (
µ) by accumulated carbonaceous species can be described by Equation (9) [
20].
where
If is the current density peak in the anodic direction and
Ib is the current density peak in the reverse direction. The higher the values of
µ, the more effective is the removal of carbonaceous intermediates that poison the catalyst surface [
20].
Table 4 presents the values of
µ for Pd/C and PdAg/C. According to the data presented in
Table 4, the value of
µ for the PdAg/C is higher than Pd/C, suggesting that bimetallic electrocatalysts have greater effectiveness in removing carbonaceous intermediates that promote poisoning. This resistance to CO poisoning is of great relevance when considering the long-term application of electrocatalysts in commercial settings after technology translation.
Chronoamperometric studies can provide information to estimate the poisoning rate in ROE by calculating the slope of the straight line when the reaction stabilizes, calculate the charge involved in ROE by integrating the curve obtained in the chronoamperometry measurements, and determine which catalyst has the highest catalytic activity by comparing current density values observed for alcohol fuel cell systems [
17,
20,
23].
As illustrated in
Figure 4, the peak of ethanol oxidation in alkaline medium is characteristically wide [
16,
23]. The potential region between −0.6 to −0.2 V vs. SCE defines the range between the onset potential to the maximum current of the peak. Thus, −0.4 V vs. SCE defines an intermediate potential for effective benchmarking of electrocatalytic ethanol oxidation under chronoamperometric conditions.
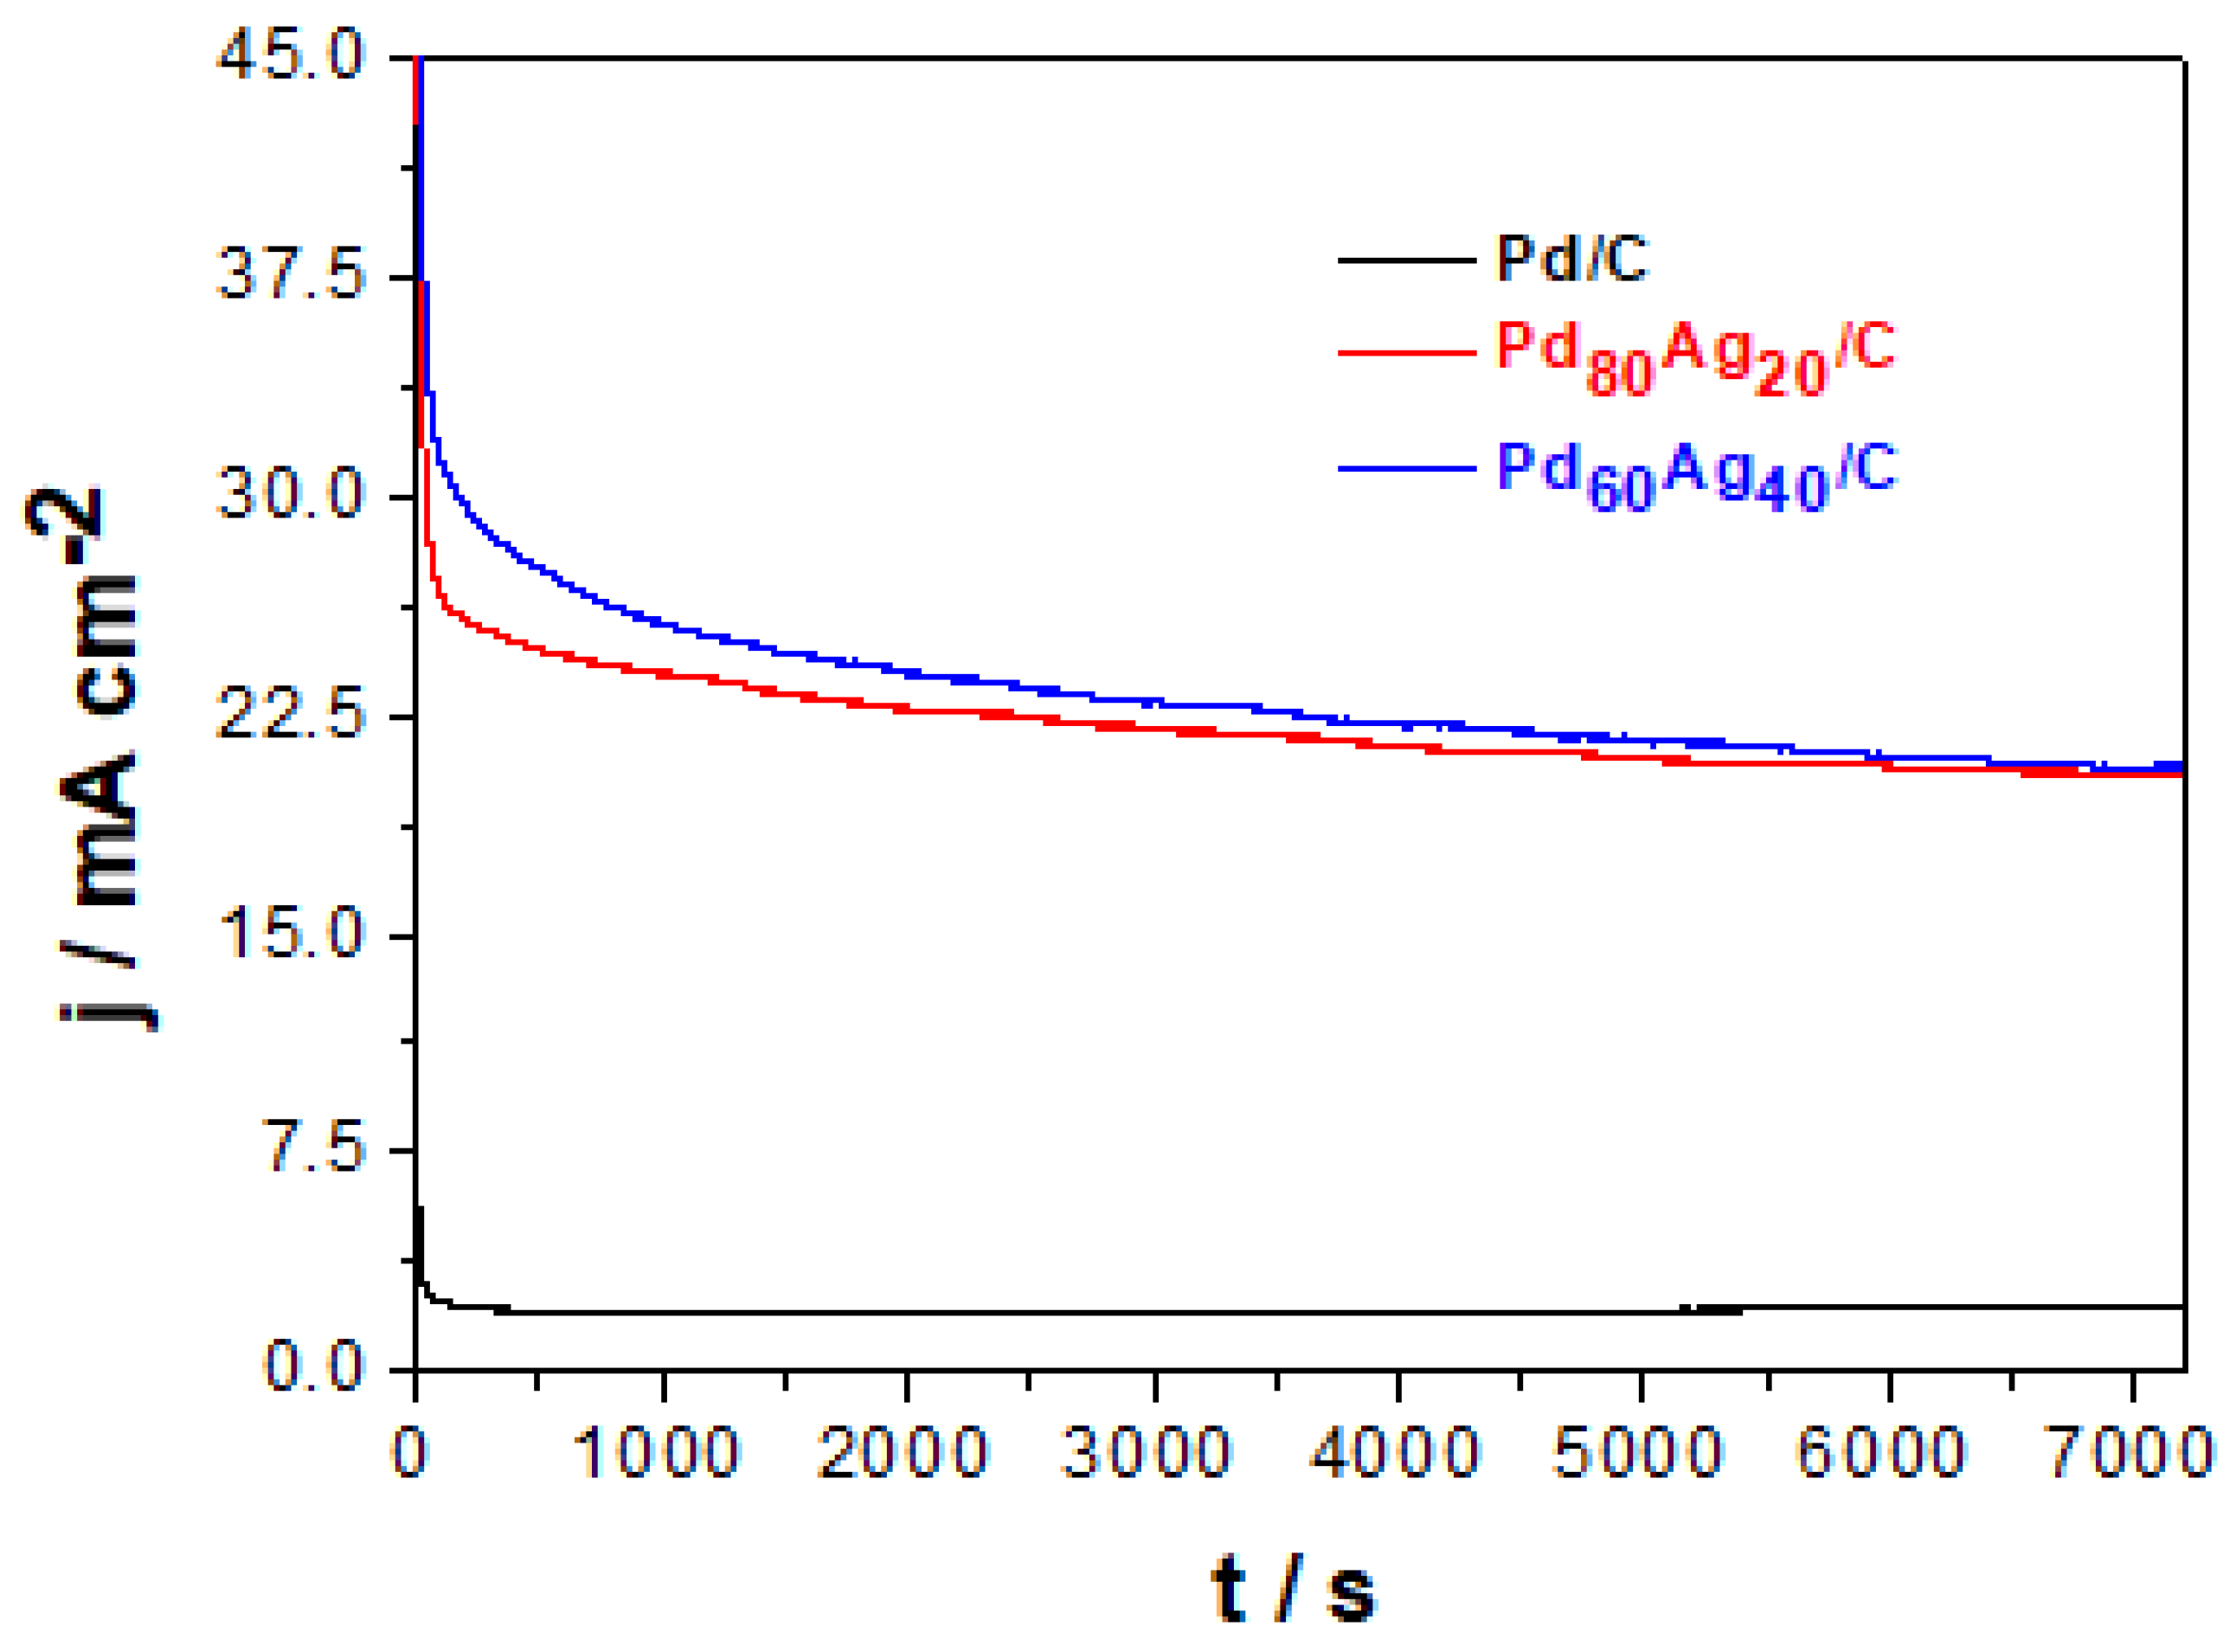
Figure 5 illustrates that Pd/C has a notably lower current response than bimetallic PdAg/C electrocatalysts, demonstrating the higher activity of PdAg/C for ethanol oxidation. It can be observed that all electrocatalysts show an accentuated decrease in current density after the first minutes of electrolysis, followed by a slight drift until the end of the analysis (
t = 7200 s). This behavior can be ascribed to the electrocatalytic sites being blocked by smaller organic molecules resulting from ethanol oxidation (e.g., CH
3CH
2OH, CH
3CO, and CH
3COOH) [
23]. The higher initial response of electrodes shows high activity given the clean surface where only ethanol is adsorbed without significant competitiveness of other molecules. However, after the initial stage, the blocking of active sites by shorter molecules (i.e., ethanol oxidation by-products) would result in a decreased rate of adsorption of new ethanol molecules. The slower adsorption rate of ethanol and ethanol availability on the electrocatalyst surface will consequently result in a lower ratio of EOR charge transfer events, with consequent decrease in the current response. Further analysis of
Figure 5 shows that stabilization occurs in approximately 250, 700, and 850 s for Pd/C, Pd
80Ag
20/C, and Pd
60Ag
40/C, respectively. From these stabilization times, the variation in the surface poisoning rate (δ) can be estimated from Equation (10) in units of % change s
−1 [
16,
23]:
where Δ
j/Δ
t is the rate of change in the slope of the linear portion of the current density decline, and
j is the current density at −0.4 V vs. SCE (
Figure 5). The δ values collected in
Table 4 demonstrate that the addition of Ag shifts the poisoning rate values to more negative values, suggesting that there is an Ag contribution to decreasing the poisoning of PdAg/C in relation to Pd/C. The synergistic role of Ag in the allowed structure of bimetallic PdAg/C electrocatalysts can be explained by the modification of the electronic structure of Pd, decreasing both the poisoning of the active sites and the activation energy of EOR [
29,
30,
40]. These results are consistent with the CV results, where PdAg showed higher catalytic activity (
Figure 4 and
Table 4).
The charge
Q involved in EOR can be calculated by integrating the area under the curve on the chronoamperometry experiment from Equation (11):
The analysis of Q corroborates the enhanced performance of bimetallic catalysts that present an over 10-fold higher charge circulation associated with ethanol oxidation through EOR.
2.3. Understanding Poisoning Resistance through CO Stripping
Carbon monoxide (CO) is an intermediate of the incomplete oxidation on the EOR in fuel cells at low temperatures, being responsible for the poisoning of the electrocatalyst surface. In this context, the study of CO tolerance on Pd/C, Pd
80Ag
20/C, and Pd
60Ag
40/C was performed to evaluate the behavior of these electrocatalysts when contaminated with CO. Evaluation of CO tolerance is conventionally evaluated in terms of the initial potential of ethanol oxidation to CO-species. The more negative the initial potential of oxidation of CO adsorbed on the electrocatalyst, the better is its performance for EOR [
42].
Figure 6 presents the CO stripping curves of Pd/C, Pd
80Ag
20/C, and Pd
60Ag
40/C electrocatalysts. The peak observed in the first cycle is related to CO adsorption on the electrocatalyst surface. The onset potential of CO adsorption is displaced to a more negative potential when increasing the silver content in the electrocatalysts. The onset potentials of CO adsorption at −0.286, −0.419, and −0.484 V are shown for Pd/C, Pd
80Ag
20/C, and Pd
60Ag
40/C, respectively. The lower value of the onset potential of Pd
60Ag
40/C indicates that this electrocatalyst had a greater ability to remove the CO intermediate from the Pd active sites, facilitating the EOR. These results agree with the chronoamperometric results (
Figure 5 and
Table 4), in which Pd
60Ag
40/C was found to be less susceptible to CO poisoning. Overall, the benefits of eased CO removal from the surface and lower CO poisoning align to enhance the electrocatalytic performance and the sustained response over time. The experimental results suggest that Pd
60Ag
40/C is more effective for EOR given the alloyed Pd-Ag phases.
The results observed in this study suggest that the electrocatalyst Pd
60Ag
40/C presented a better catalytic performance for EOR. As proposed by Mostashari et al. [
40], the improvement in the catalytic performance of PdAg/C electrocatalysts can be explained by the following factors: better dispersion of the particles in the support material, formation of PdAg solid solution, and increased ECSA. From the results presented by XRD (
Figure 1), the diffraction angles of the bimetallic electrocatalysts are shifted to lower values. This shift demonstrates the alteration of the crystalline structure and hints at the formation of alloys (solid solutions). Solid solutions of metals at the interface can favor the adsorption of OH
− on the Pd surface and facilitate the removal of CO-type intermediate species, releasing the active sites on the surface of the electrocatalyst surface [
40]. It is also reported that the excellent catalytic activity is related to the alloy composition and electronic structure modulation by d-band electronic effects, with strong synergistic effects observed for the PdAg binary alloy. It can be concluded that the addition of Ag to Pd favors the intrinsic mechanism [
43,
44,
45], a catalysis mechanism that results in a modification of the electronic properties of Pd by a second or third metal. In this mechanism, the 5d bands are emptied or filled, and this effect causes a decrease in the binding strength of CO on the catalyst surface, weakening its adsorption of oxygen-containing species. This is a theoretical result predicted by DFT calculations [
39] where the favoring of an energetically stable and favorable structure was observed for PdAg alloys with approximately equal concentrations of Pd and Ag. It was also reported that higher ECSA values expose the electrocatalyst surface to numerous active sites and EOR is facilitated [
43]. Therefore, the better catalytic performance of Pd
60Ag
40/C may be related to several factors: the smaller crystallite size [
10] (
Table 2), solid solution formation, intrinsic mechanism, and higher ECSA (
Table 4).
2.4. Feasibility and Economy
The results presented and discussed in
Table 4,
Figure 3,
Figure 4 and
Figure 5 showed that, as predicted by theoretical calculations [
39], by decreasing the amount of Pd and increasing Ag, it was possible to obtain better electrochemical results for EOR. With a view to understanding the Pd salt economy,
Table 5 presents an estimate of the expected economics for the electrocatalysts studied in this study, in which
$ is the average value of the amount of Pd in the respective catalyst, assuming a value of USD 150.00/g of Pd salt (Pd(NO
3)
2·2H
2O) [
45], and Δ
$ is the percentage of the cost of PdAg/C catalysts in relation to Pd/C.
Relating the values observed in
Table 4 and
Table 5,
Figure 3,
Figure 4 and
Figure 5, it can be suggested that the catalyst Pd
60Ag
40/C presented the most promising results. This implies that the synthesis method studied in this study has been shown to be feasible for the synthesis of PdAg catalysts combining Pd salt, which has a high market value, with Ag salt, a cheaper material. Therefore, the technique of thermal decomposition of polymeric precursors is confirmed to be efficient for the reduction of the amount of palladium salt in the synthesis, both economically and in terms of electrochemical activity. For comparison purposes,
Table 6 presents a brief summary of results observed in the literature for PdAg catalysts and the Pd
60Ag
40/C evaluated in this study.
Observing the results presented in
Table 5 and
Table 6, it is possible to conclude that Pd
60Ag
40/C produced by the technique of thermal decomposition of polymeric precursors has been shown to be a viable alternative for anodes in fuel cells in EOR [
27,
29,
40,
46,
47,
48,
49], because it requires lower amounts of Pd with good catalytic activities and consequent economy in the cost of the Pd salt.


 ,
, 


