
Cathodic Activation of Titania-Fly Ash Cenospheres for Efficient Electrochemical Hydrogen Production: A Proposed Solution to Treat Fly Ash Waste

 , , , ,
  , and
, and
Abstract
:
1. Introduction
2. Experimental Procedure
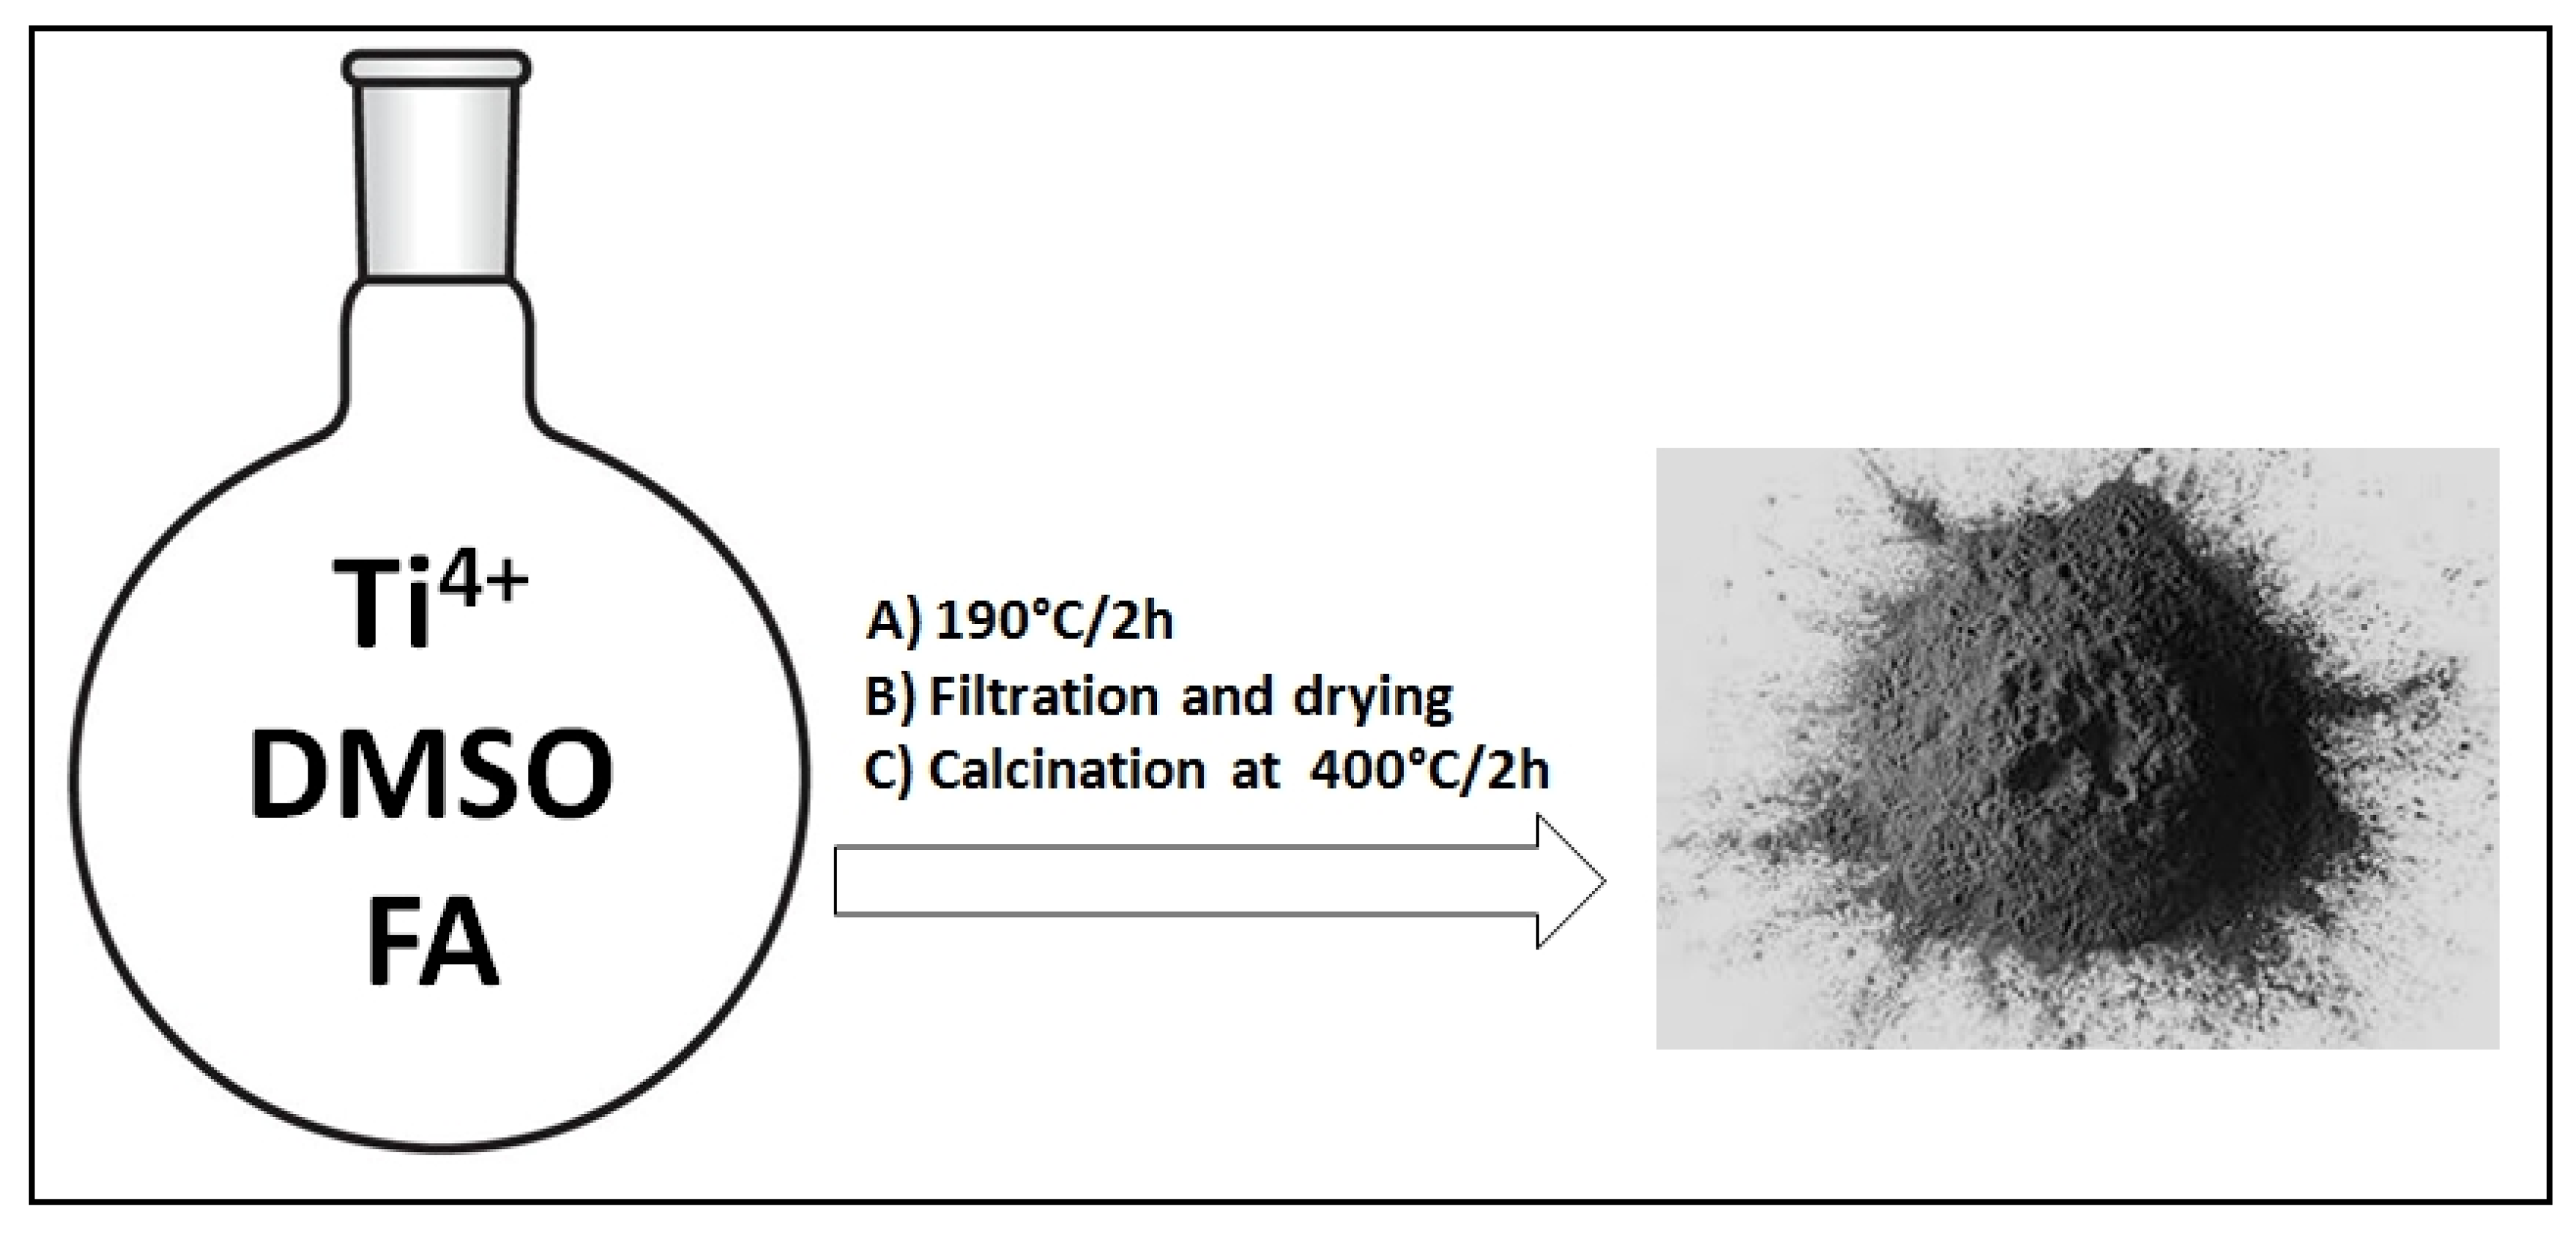
2.1. Synthesis of FA-TiO2 Hybrid Nanocomposites
2.2. Electrochemical Measurements
3. Results and Discussion
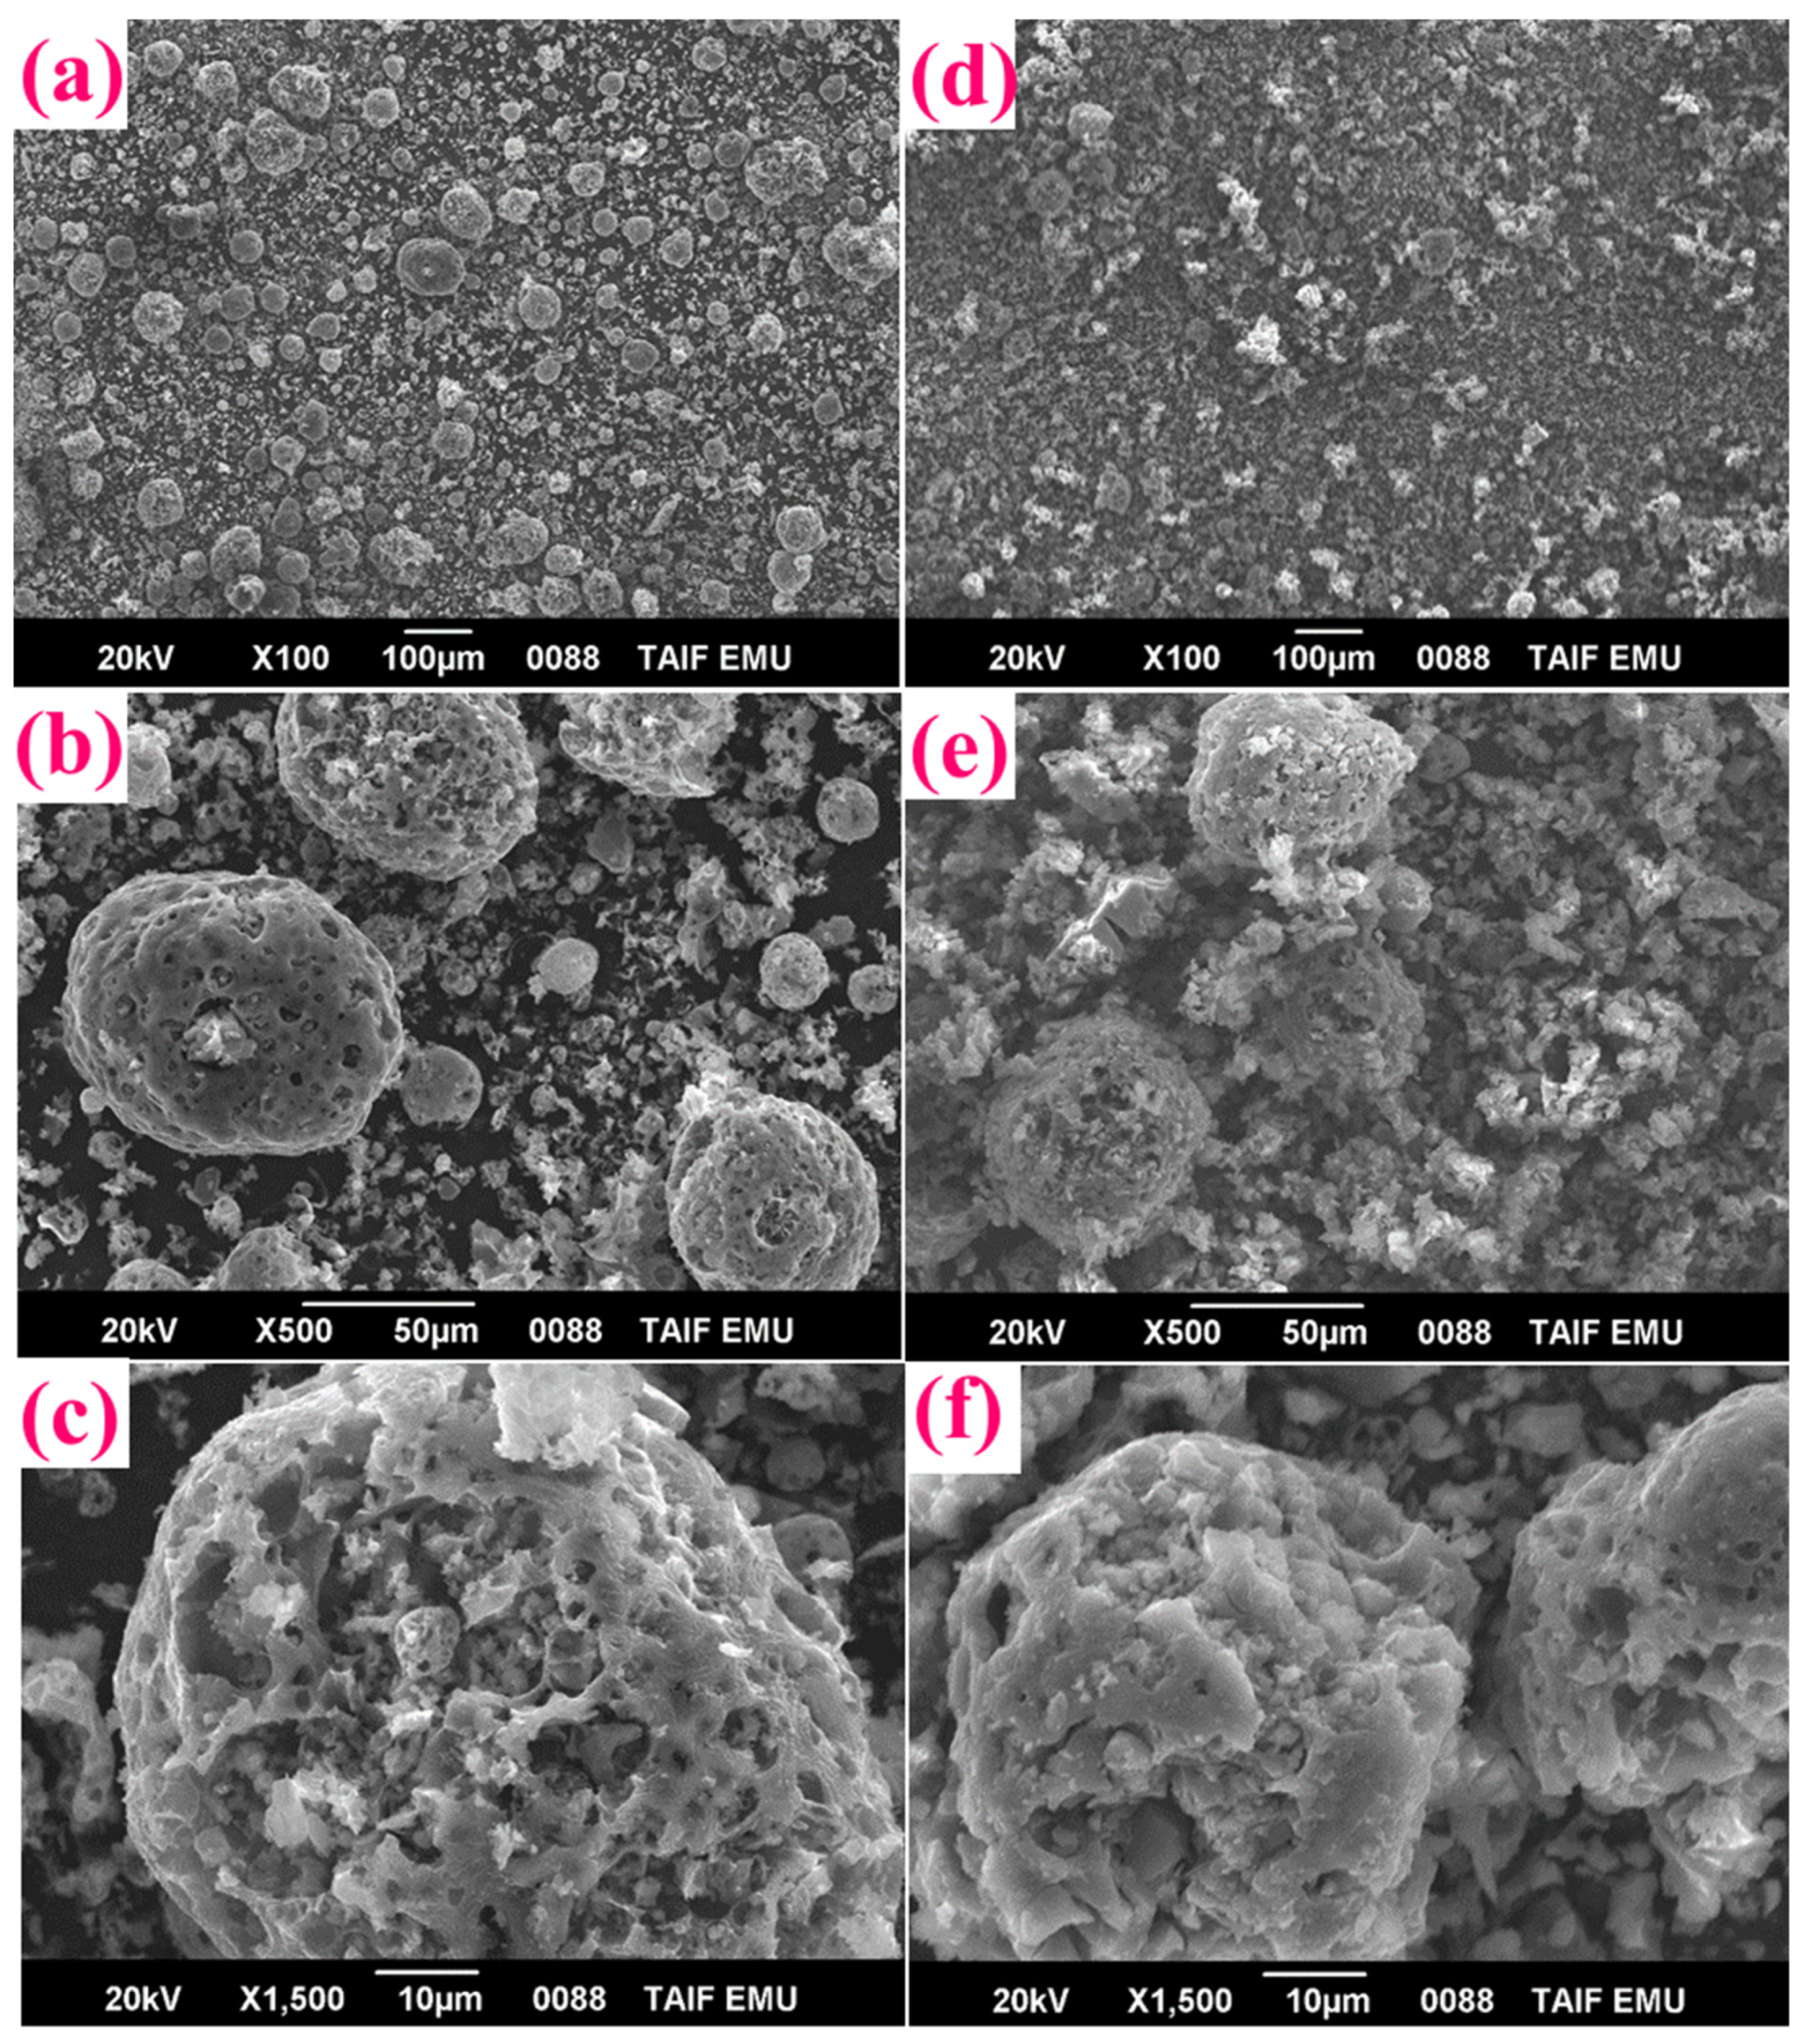
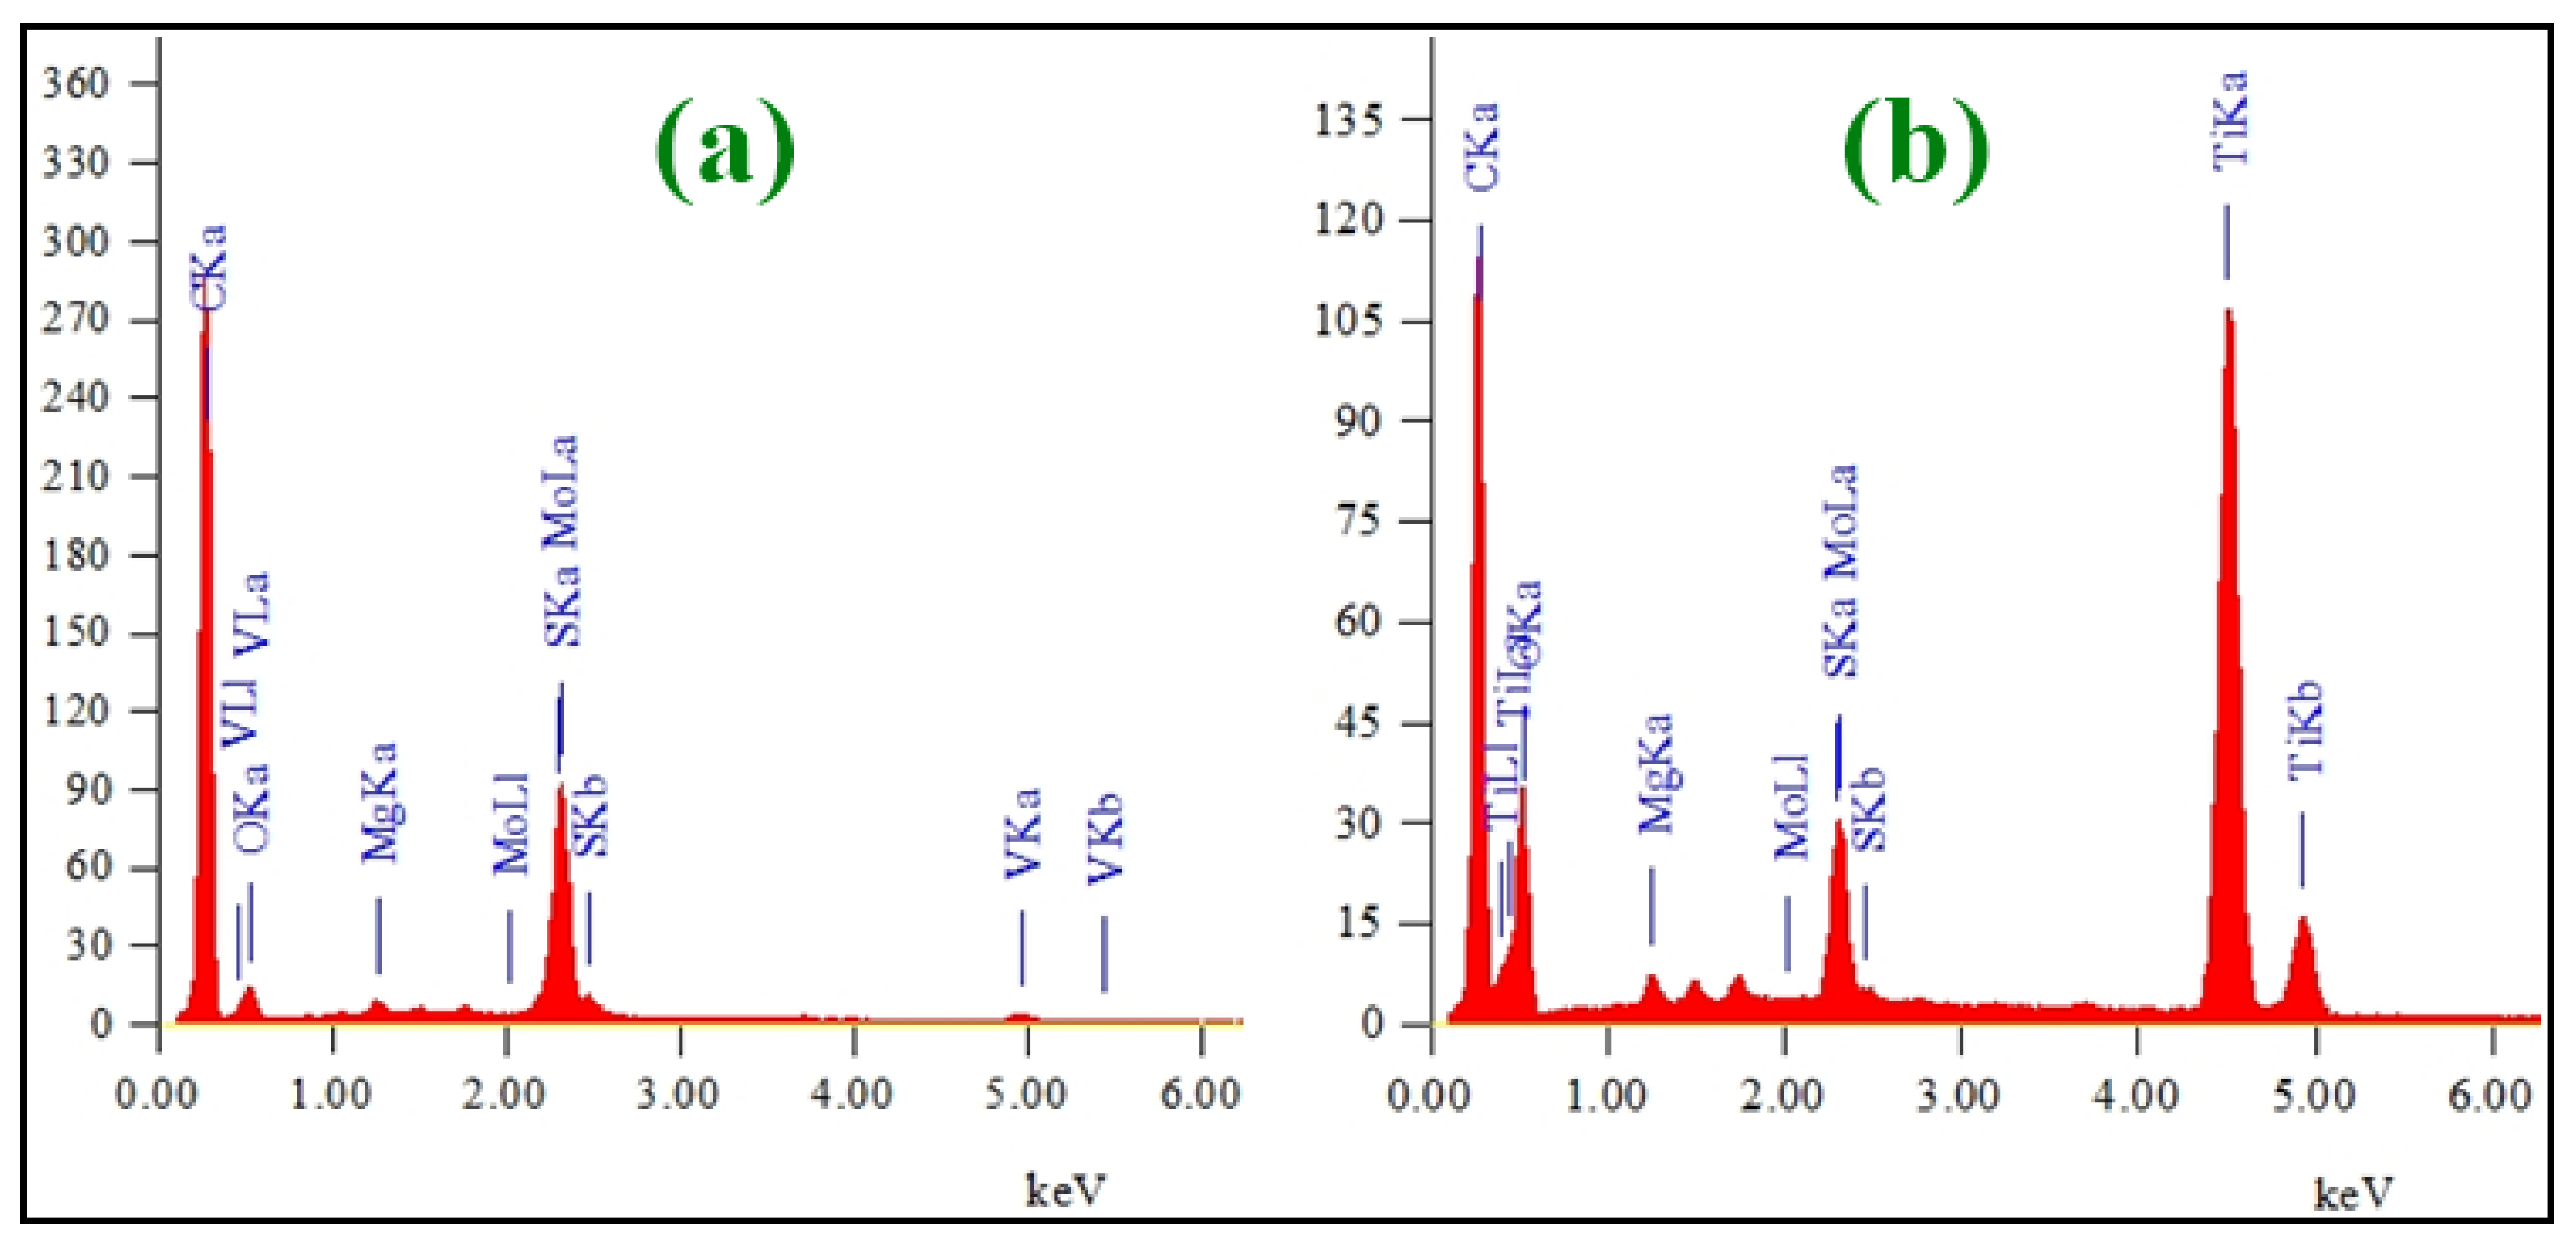
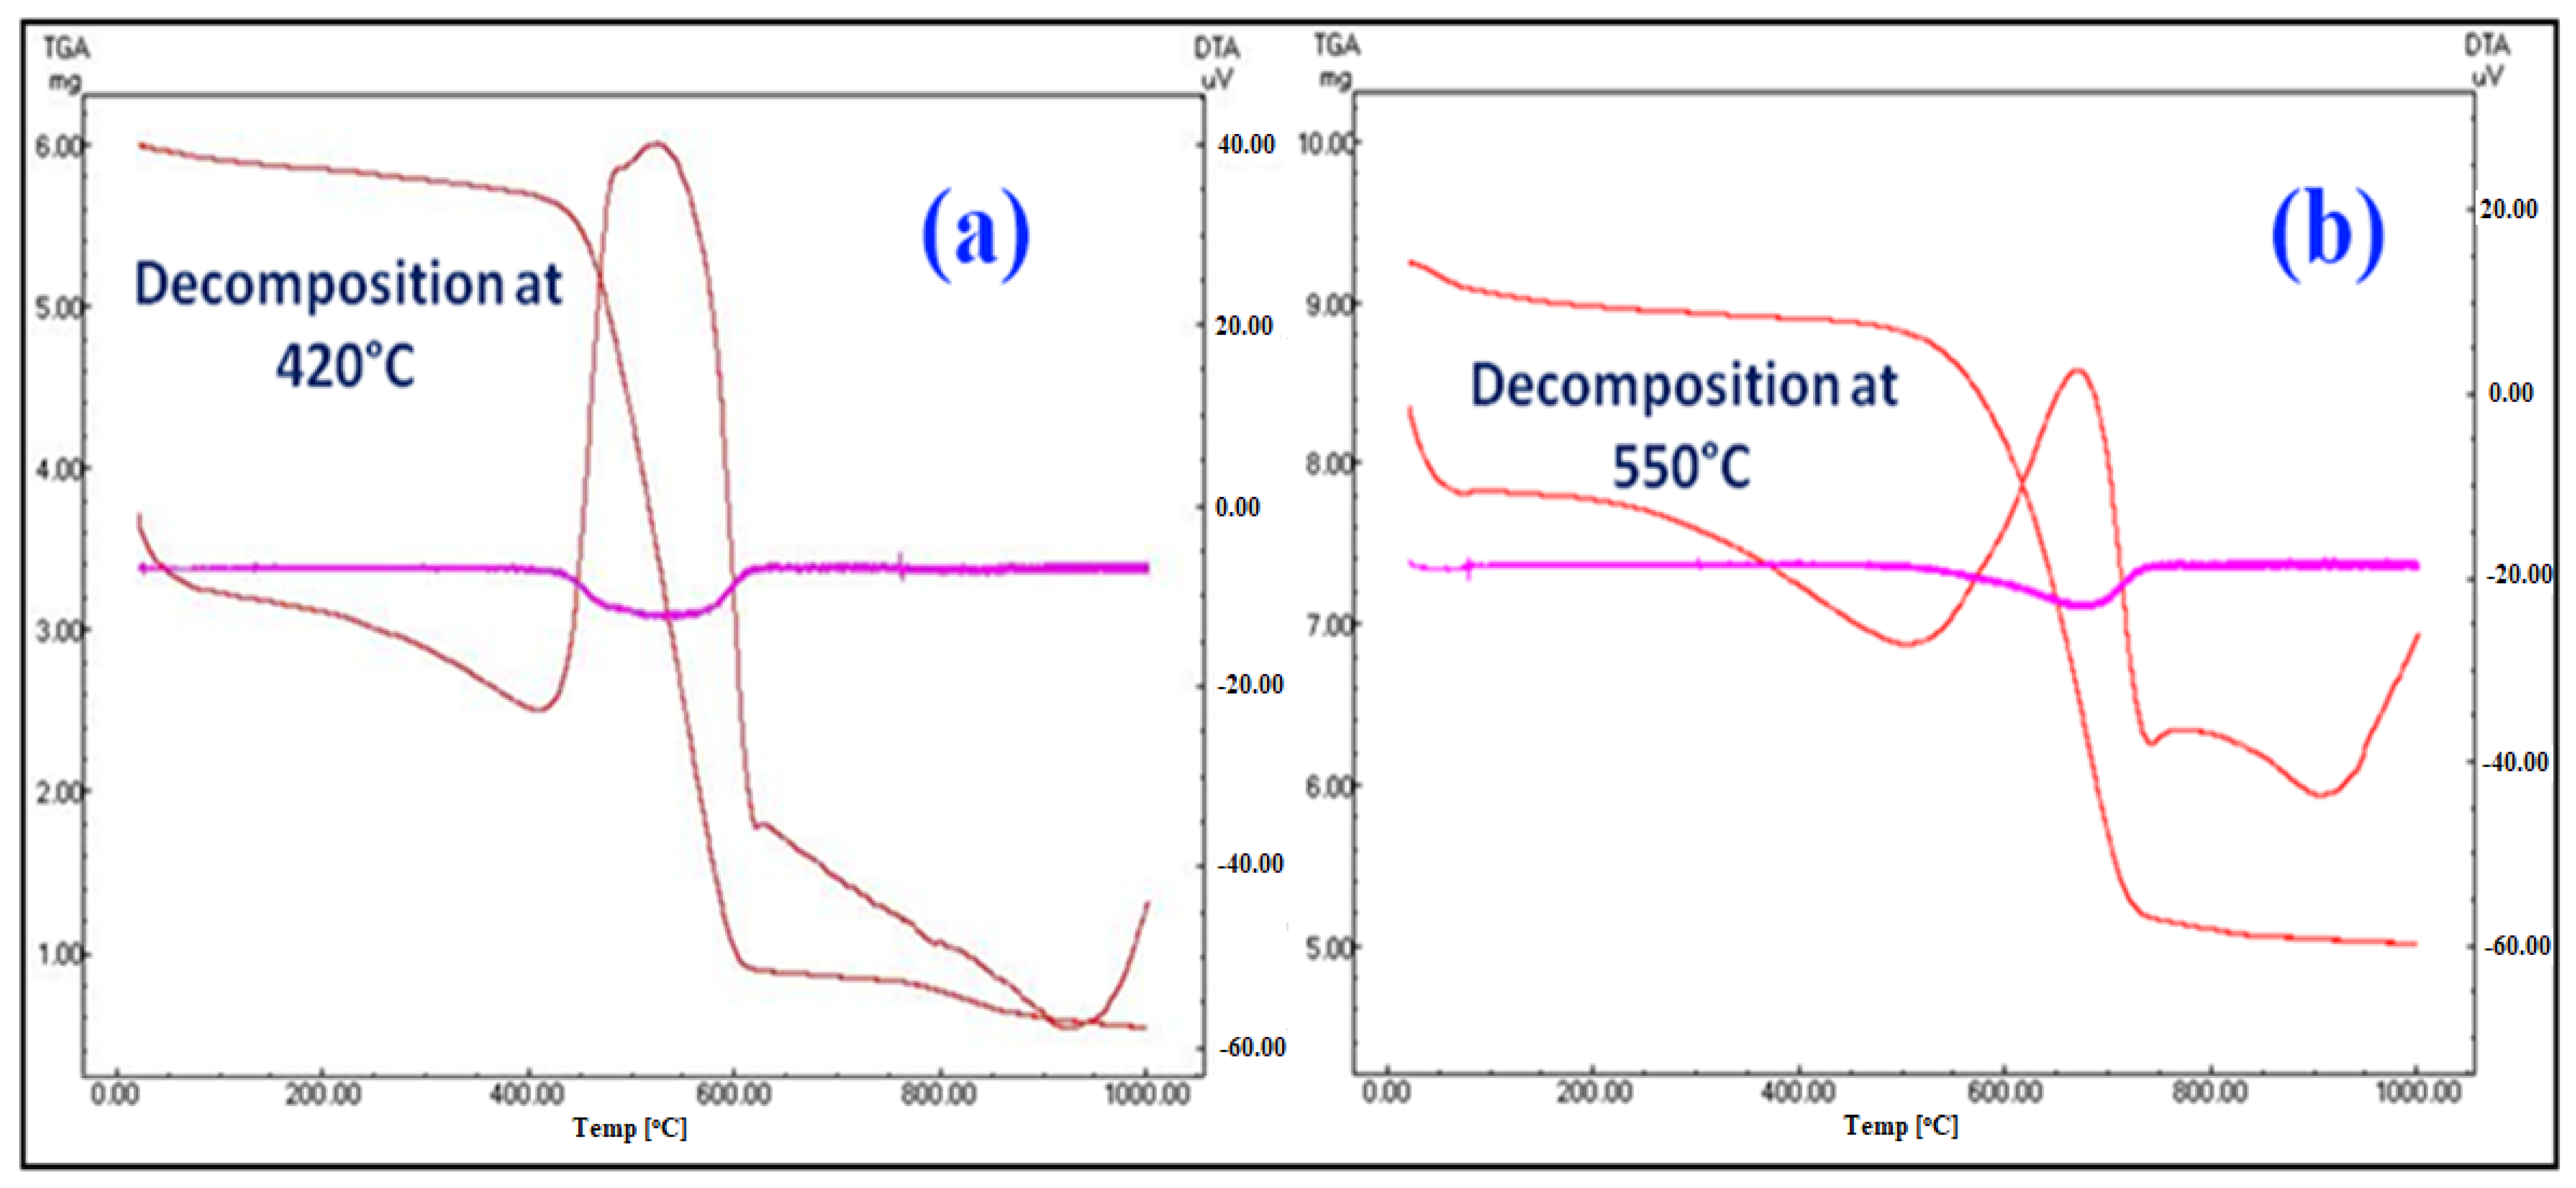
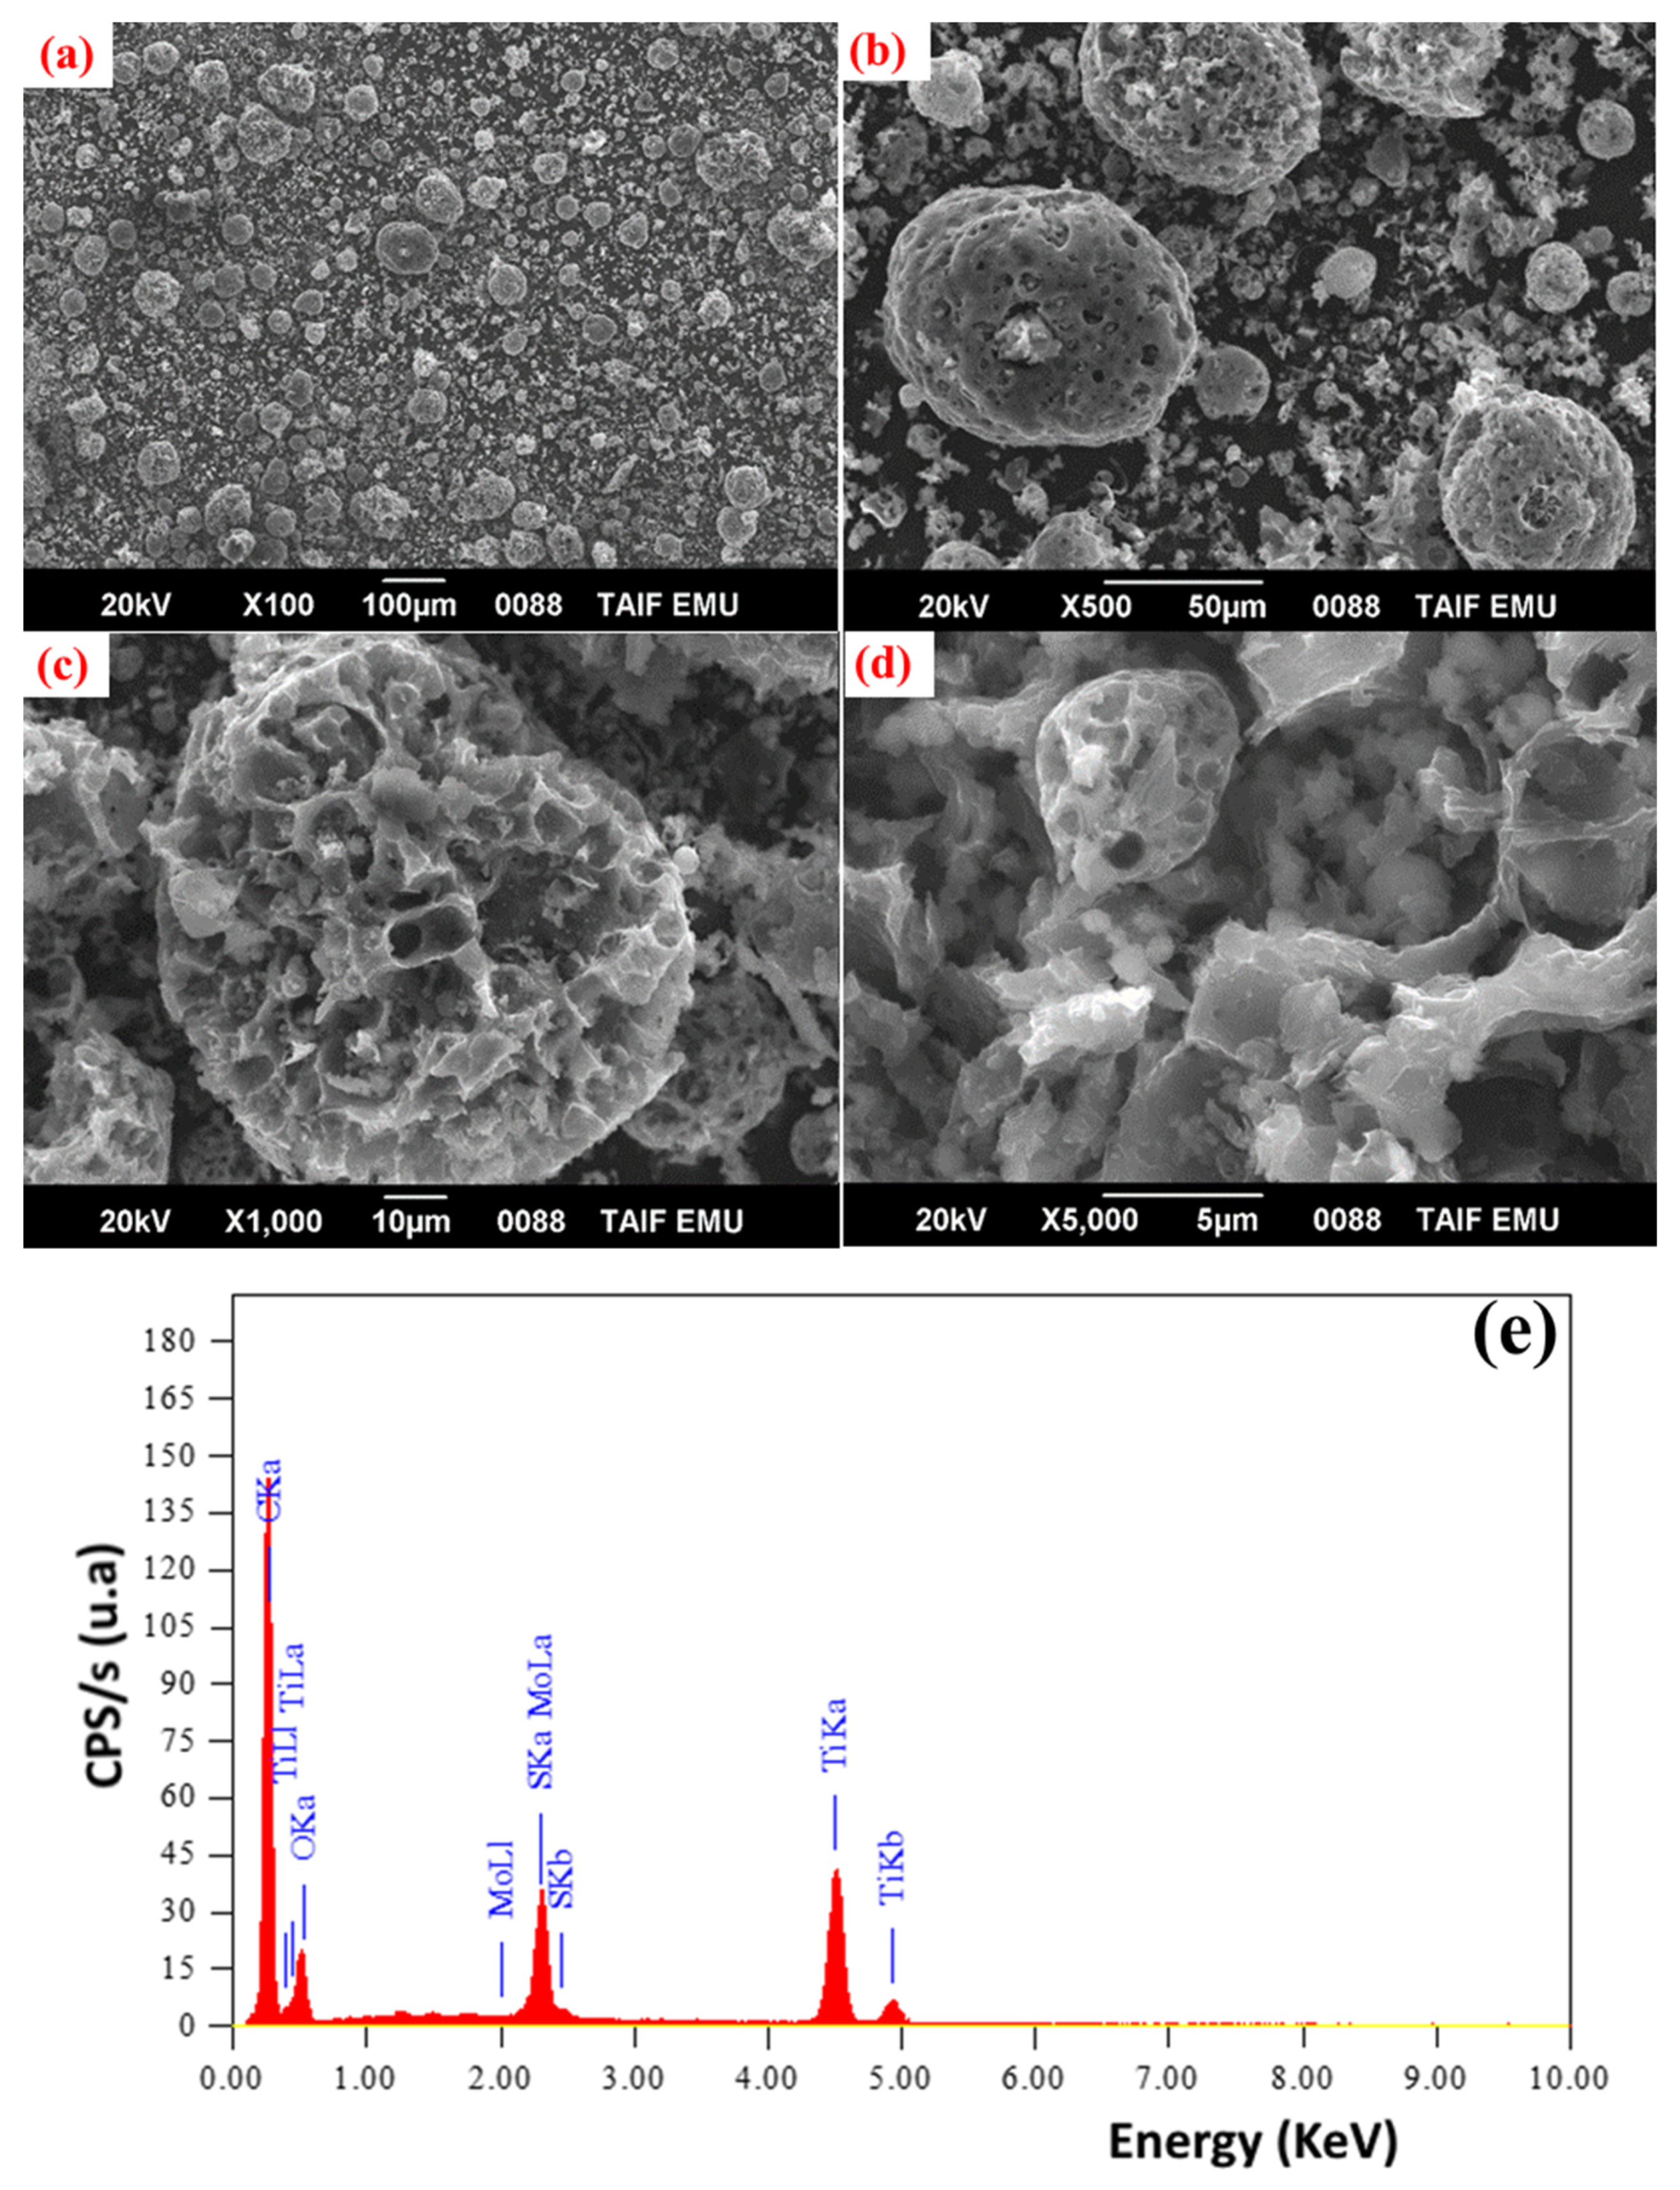
3.1. Structural and Morphological Features of FA-TiO2 Nanocomposite
3.2. Electrochemical Measurements
3.2.1. Chronoamperometry Measurements (Catalyst Cathodic Activation)
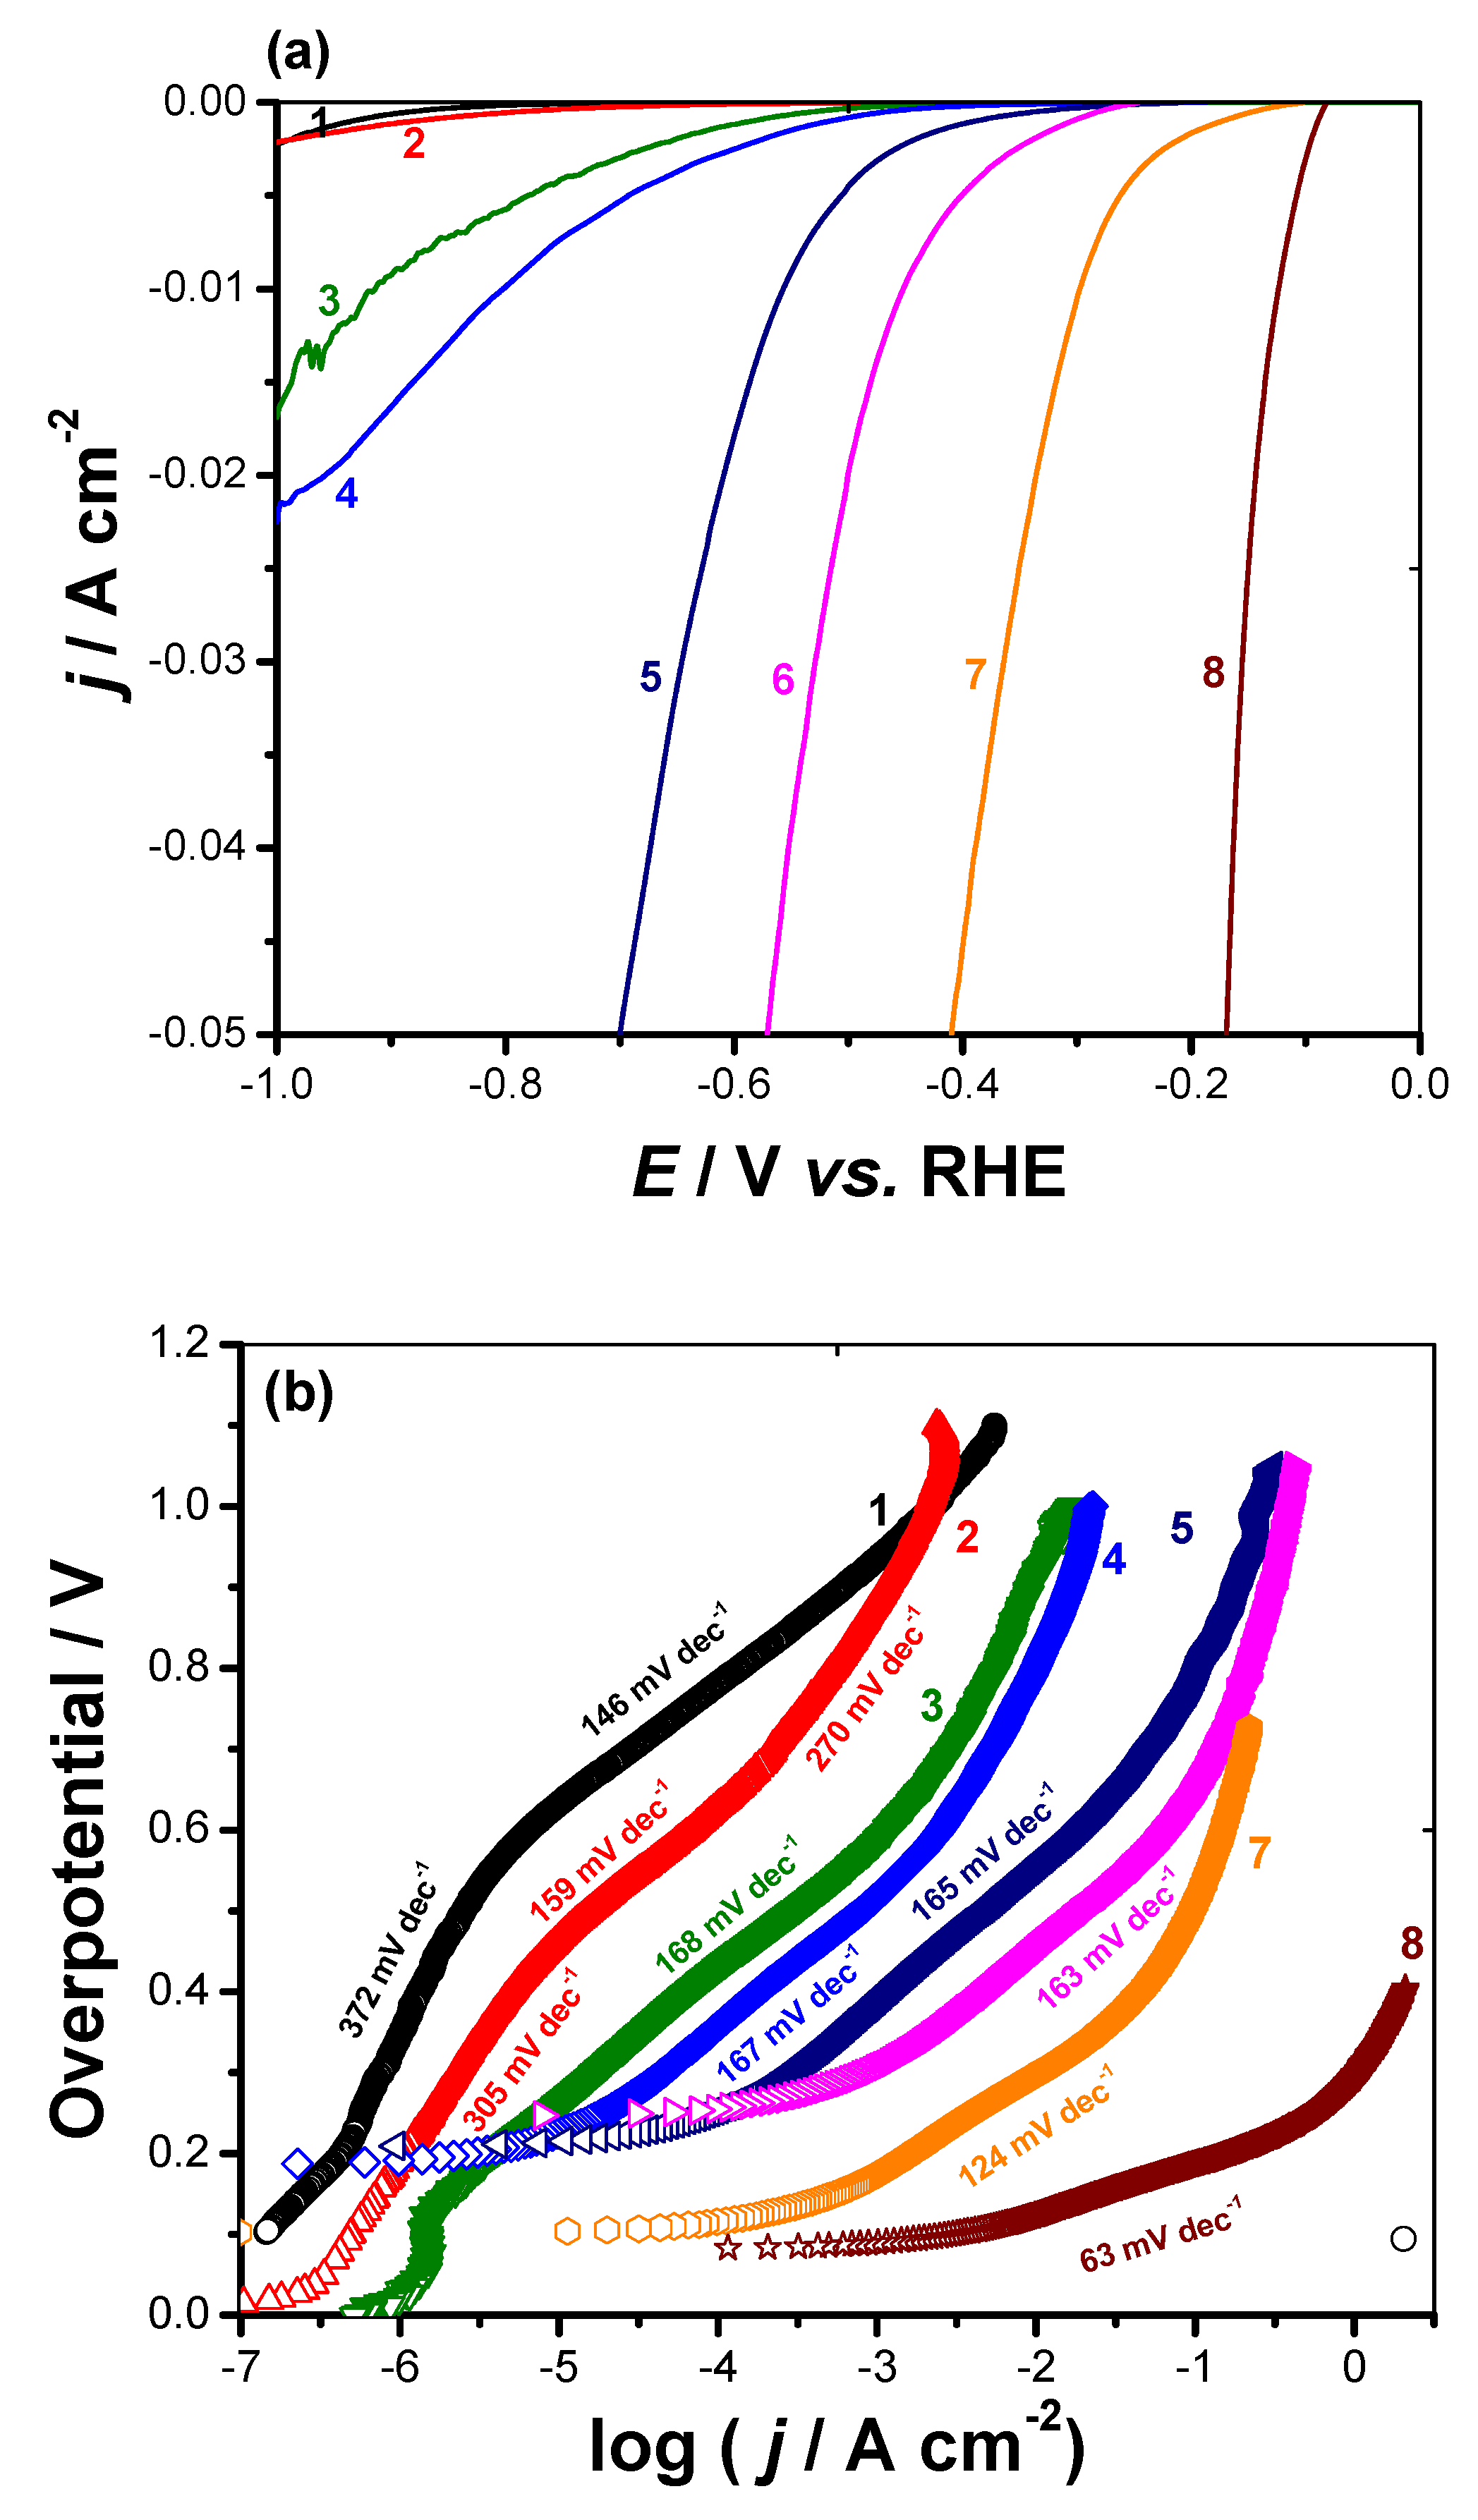
3.2.2. Cathodic Polarization Measurements
3.3. Long-Term Stability Test and Origin of Catalytic Activity
3.4. The Surface Morphology and Composition of FA-TiO2 after Cathodic Activation
4. Conclusions
Supplementary Materials
Author Contributions
Funding
Acknowledgments
Conflicts of Interest
References
- Ghenciu, A.F. Review of fuel processing catalysts for hydrogen production in PEM fuel cell systems. Curr. Opin. Solid State Mater. Sci. 2002, 6, 389–399. [Google Scholar] [CrossRef]
- Kirubakaran, A.; Jain, S.; Nema, R.K. A review on fuel cell technologies and power electronic interface. Renew. Sustain. Energy Rev. 2009, 13, 2430–2440. [Google Scholar] [CrossRef]
- Turner, J.A. Sustainable hydrogen production. Science 2004, 305, 972–974. [Google Scholar] [CrossRef] [PubMed]
- Bhavsar, S.; Najera, M.; Solunke, R.; Veser, G. Chemical looping: To combustion and beyond. Catal. Today 2014, 228, 96–105. [Google Scholar] [CrossRef]
- Yan, W.; Hoekman, S.K. Production of CO2-free hydrogen from methane dissociation: A review. Environ. Prog. Sustain. Energy 2014, 33, 213–219. [Google Scholar] [CrossRef]
- Kumar, S.S.; Himabindu, V. Hydrogen production by PEM water electrolysis—A review. Mater. Sci. Energy Technol. 2019, 2, 442–454. [Google Scholar]
- Yan, Y.; Xia, B.; Xu, Z.; Wang, X. Recent development of molybdenum sulfides as advanced electrocatalysts for hydrogen evolution reaction. ACS Catal. 2014, 4, 1693–1705. [Google Scholar] [CrossRef]
- Faber, M.S.; Jin, S. Earth-abundant inorganic electrocatalysts and their nanostructures for energy conversion applications. Energy Environ. Sci. 2014, 7, 3519–3542. [Google Scholar] [CrossRef]
- Do, H.H.; Nguyen, D.L.; Nguyen, X.C.; Le, T.H.; Nguyen, T.P.; Trinh, Q.T.; Ahn, S.H.; Vo, D.N.; Kim, S.Y.; Le, Q.V. Recent progress in TiO2-based photocatalysts for hydrogen evolution reaction: A review. Arab. J. Chem. 2020, 13, 3653–3671. [Google Scholar] [CrossRef]
- Feng, H.; Xu, Z.; Ren, L.; Liu, C.; Zhuang, J.; Hu, Z.; Xu, X.; Chen, J.; Wang, J.; Hao, W.; et al. Activating Titania for Efficient Electrocatalysis by Vacancy Engineering. ACS Catal. 2018, 8, 4288–4293. [Google Scholar] [CrossRef] [Green Version]
- Swaminathan, J.; Subbiah, R.; Singaram, V. Defect-Rich Metallic Titania (TiO1.23)—An Efficient Hydrogen Evolution Catalyst for Electrochemical Water Splitting. ACS Catal. 2016, 6, 2222–2229. [Google Scholar] [CrossRef]
- Prosini, P.P.; Pozio, A.; Botti, S.; Ciardi, R. Electrochemical studies of hydrogen evolution, storage and oxidation on carbon nanotube electrodes. J. Power Sources 2003, 118, 265–269. [Google Scholar] [CrossRef]
- Cui, W.; Liu, Q.; Cheng, N.; Asiri, A.M.; Sun, X. Activated carbon nanotubes: A highly-active metal-free electrocatalyst for hydrogen evolution reaction. Chem. Commun. 2014, 50, 9340–9342. [Google Scholar] [CrossRef] [PubMed]
- Wei, L.; Karahan, H.E.; Goh, K.; Jiang, W.; Yu, D.; Chen, Y. A high-performance metal-free hydrogen-evolution reaction electrocatalyst from bacterium derived carbon. J. Mater. Chem. A 2015, 3, 7210–7214. [Google Scholar] [CrossRef] [Green Version]
- Darabdhara, G.; Amin, M.A.; Mersal, G.A.; Ahmed, E.M.; Das, M.R.; Zakaria, M.B.; Malgras, V.; Alshehri, S.M.; Yamauchi, Y.; Szunerits, S.; et al. Reduced graphene oxide nanosheets decorated with Au, Pd and Au–Pd bimetallic nanoparticles as highly efficient catalysts for electrochemical hydrogen generation. J. Mater. Chem. A 2015, 3, 20254–20266. [Google Scholar] [CrossRef]
- Amin, M.; Fadlallah, S.A.; Alosaimi, G.S.; Kandemirli, F.; Saracoglu, M.; Szunerits, S.; Boukherroub, R. Cathodic Activation of Titanium-Supported Gold Nanoparticles: An Efficient and Stable Electrocatalyst for the Hydrogen Evolution Reaction. Int. J. Hydrogen Energy 2016, 41, 6326–6341. [Google Scholar] [CrossRef]
- Darabdhara, G.; Das, M.R.; Amin, M.A.; Mersal, G.A.; Mostafa, N.Y.; El-Rehim, S.S.; Szunerits, S.; Boukherroub, R. Au-Ni Alloy Nanoparticles Supported on Reduced Graphene Oxide as Highly Efficient Electrocatalysts for Hydrogen Evolution and Oxygen Reduction Reactions. Int. J. Hydrogen Energy 2018, 43, 1424–1438. [Google Scholar] [CrossRef]
- Mezni, A.; Ibrahim, M.M.; El-Kemary, M.; Shaltout, A.A.; Mostafa, N.Y.; Ryl, J.; Kumiera, T.; Altalhi, T.; Amin, M.A. Cathodically activated Au/TiO2 Nanocomposite Synthesized by a New Facile Solvothermal Method: An Efficient Electrocatalyst With Pt-like Activity for Hydrogen Generation. Electrochim. Acta 2018, 290, 404. [Google Scholar] [CrossRef]
- Mostafa, N.Y.; Qhtani, M.M.; Alotaibi, S.H.; Zaki, S.; Alharthi, Z.I.; Cieslik, M.; Gornicka, K.; Ryl, J.; Boukherroub, R.; Amin, M.A. Cathodic Activation of Synthesized Highly Defective Monoclinic Hydroxyl-Functionalized ZrO2 Nanoparticles for Efficient Electrochemical Production of Hydrogen in Alkaline Media. Int. J. Energy Res. 2020, 44, 10695–10709. [Google Scholar] [CrossRef]
- Ifires, M.; Addad, A.; Barras, A.; Hadjersi, T.; Chegroune, R.; Szunerits, S.; Boukherroub, R.; Amin, M.A. Cathodic pre-polarization studies on the carbon felt/KOH interface: An efficient metal-free electrocatalyst for hydrogen generation. Electrochim. Acta 2021, 375, 137981. [Google Scholar] [CrossRef]
- Visa, M.; Duta, A. TiO2/fly Ash Novel Substrate for Simultaneous Removal of Heavy Metals and Surfactants. Chem. Eng. J. 2013, 223, 860–868. [Google Scholar] [CrossRef]
- Lu, Z.; Zhou, W.; Huo, P.; Luo, Y.; He, M.; Pan, J.; Li, C.; Yan, Y. Performance of a Novel TiO2 Photocatalyst Based on the Magnetic Floating Fly-ash Cenospheres for the Purpose of Treating Waste by Waste. Chem. Eng. J. 2013, 225, 34–42. [Google Scholar] [CrossRef]
- Visa, M.; Andronic, L.; Duta, A. Fly ash-TiO2 Nanocomposite Material for Multi-pollutants Wastewater Treatment. J. Environ. Manag. 2015, 150, 336–343. [Google Scholar] [CrossRef] [PubMed]
- Visa, M.; Isac, L.; Duta, A. New fly ash TiO2 Composite for the Sustainable Treatment of Wastewater with Complex Pollutants Load Maria. Appl. Surf. Sci. 2015, 339, 62–68. [Google Scholar] [CrossRef]
- Saud, P.S.; Pant, B.; Park, M.; Chae, S.; Park, S.J.; EI-Newehy, M.; Al-Deyab, S.S.; Kim, H.Y. Preparation and Photocatalytic Activity of Fly ash Incorporated TiO2 Nanofibers for Effective Removal of Organic Pollutants. Ceram. Int. 2015, 41, 1771–1777. [Google Scholar] [CrossRef]
- Sharma, R.; Shaw, R.; Tiwari, S.; Tiwar, S. Nano-Titania Decorated Fly Ash as Self-Cleaning Antibacterial Cool Pigment. ACS Sustain. Chem. Eng. 2015, 11, 2796–2803. [Google Scholar] [CrossRef]
- Yang, L.; Wang, F.; Hakki, A.; Macphee, D.E.; Hu, P. The Influence of Zeolites Fly Ash bead/TiO2 Composite Material Surface Morphologies on their Adsorption and Photocatalytic Performance. Appl. Surf. Sci. 2017, 392, 687–696. [Google Scholar] [CrossRef]
- Kanakaraju, D.; Hazimbin, M.; Lim, Y.C.; Pace, A. Combined Adsorption/Photocatalytic Dye Removal by Copper-Titania-fly Ash Composite. Surf. Interfaces 2020, 19, 100534. [Google Scholar] [CrossRef]
- Chen, J.-W.; Yuan, B.; Shi, J.-W.; Yang, J.-C.; Fu, M.L. Reduced Graphene Oxide and Titania Nanosheet Cowrapped Coal Fly ash Microspheres Alternately as a Novel Photocatalyst for Water Treatment. Catal. Today 2018, 315, 247–254. [Google Scholar] [CrossRef]
- Donga, Y.; Hampshirea, S.; Zhoub, J.; Lin, B.; Jia, J.; Meng, M. Recycling of Fly Ash for Preparing Porous Mullite Membrane Supports With Titania Addition. J. Hazard. Mater. 2010, 180, 173–180. [Google Scholar] [CrossRef]
- Mushtaqa, F.; Zahid, M.; Bhatti, I.A.; Nasir, S.; Hussain, T. Possible Applications of Coal Fly Ash in Wastewater Treatment. J. Environ. Manag. 2019, 240, 27–46. [Google Scholar] [CrossRef] [PubMed]
- Zhang, L.; Tu, L.; Liang, Y.; Chen, Q.; Li, Z.; Li, C.; Li, W. Coconut-Based Activated Carbon Fibers for Efficient Adsorption of Various Organic Dyes. RSC Adv. 2018, 8, 42280–42291. [Google Scholar] [CrossRef] [Green Version]
- Sankaran, K.; Ficek, M.; Panda, K.; Yeh, C.J.; Sawczak, M.; Ryl, J.; Leou, K.C.; Park, J.Y.; Lin, I.N.; Bogdanowicz, R.; et al. Boron-Doped Nanocrystalline Diamond–Carbon Nanospike Hybrid Electron Emission Source. ACS Appl. Mater. Interfaces 2019, 11, 48612–48623. [Google Scholar] [CrossRef] [PubMed]
- Park, H.; Lee, S.H.; Kim, F.S.; Choi, H.H.; Cheong, I.W.; Kim, J.H. Enhanced Thermoelectric Properties of PEDOT:PSS Nanofilms by a Chemical Dedoping Process. J. Mater. Chem. A 2014, 2, 6532–6539. [Google Scholar] [CrossRef]
- Sobaszek, M.; Siuzdak, K.; Sawczak, M.; Ryl, J.; Bogdanowicz, R. Fabrication and Characterization of Composite TiO2 Nanotubes/boron-doped Diamond Electrodes Towards Enhanced Supercapacitors. Thin Solid Films 2016, 601, 35–40. [Google Scholar] [CrossRef]
- Fu, B.; Hower, J.C.; Dai, S.; Mardon, S.M.; Liu, G. Determination of Chemical Speciation of Arsenic and Selenium in High-As Coal Combustion Ash by X-ray Photoelectron Spectroscopy: Examples from a Kentucky Stoker Ash. ACS Omega 2018, 3, 17637–17645. [Google Scholar] [CrossRef]
- Wu, H.; Zhu, Y.; Bian, S.; Ko, J.H.; Li, S.Y.; Xu, Q. H2S Adsorption by Municipal Solid Waste Incineration (MSWI) Fly Ash with Heavy Metals Immobilization. Chemosphere 2018, 195, 40–47. [Google Scholar] [CrossRef]
- Li, D.; Jing, P.; Sun, L.; An, Y.; Shan, X.; Lu, X.; Zhou, D.; Han, D.; Shen, D.; Zhai, Y.; et al. Near-Infrared Excitation/Emission and Multiphoton-Induced Fluorescence of Carbon Dots. Adv. Mater. 2018, 30, 1705913. [Google Scholar] [CrossRef]
- Grochowska, K.; Molenda, Z.; Karczewski, J.; Bachmann, J.; Darowicki, K.; Ryl, J.; Siuzdak, K. Laser Induced Formation of Copper Species over TiO2 Nanotubes Towards Enhanced Water Splitting Performance. Int. J. Hydrogen Energy 2020, 45, 19192–19205. [Google Scholar] [CrossRef]
- Dubouis, N.; Grimaud, A. The Hydrogen Evolution Reaction: From Material to Interfacial Descriptors. Chem. Sci. 2019, 10, 9165–9181. [Google Scholar] [CrossRef] [Green Version]
- Vilekar, S.A.; Fishtik, I.; Dattaz, R. Kinetics of the Hydrogen Electrode Reaction. J. Electrochem. Soc. 2010, 157, 1040–1050. [Google Scholar] [CrossRef] [Green Version]
- Conway, B.E.; Tilak, B.V. Interfacial Processes Involving Electrocatalytic Evolution and Oxidation of H2, and the Role of Chemisorbed H. Electrochim. Acta 2002, 47, 3571–3594. [Google Scholar] [CrossRef]
- Skulason, E.; Tripkovic, V.; Bjorketun, M.E.; Gudmundsdottir, S.; Karlberg, G.; Rossmeisl, J.; Bligaard, T.; Jonsson, H.; Nørskov, J.K. Modeling the Electrochemical Hydrogen Oxidation and Evolution Reactions on the Basis of Density Functional Theory Calculations. J. Phys. Chem. C 2010, 11, 18182–18197. [Google Scholar] [CrossRef]
- Nolan, H.; McEvoy, N.; O’Brien, M.; Berner, N.C.; Im, C.; Hallam, T.; McDonald, A.R.; Duesberg, G.S. Molybdenum Disulfide/pyrolytic Carbon Hybrid Electrodes for Scalable Hydrogen Evolution. Nanoscale 2014, 6, 8185–8191. [Google Scholar] [CrossRef] [PubMed]
- Chen, W.F.; Muckerman, J.T.; Fujita, E. Recent Developments in Transition Metal Carbides and Nitrides as Hydrogen Evolution Electrocatalysts. Chem. Commun. 2013, 49, 8896–8909. [Google Scholar] [CrossRef]
- Benck, J.D.; Hellstern, T.R.; Kibsgaard, J.; Chakthranont, P.; Jaramillo, T.F. Catalyzing the Hydrogen Evolution Reaction (HER) with Molybdenum Sulfide Nanomaterials. ACS Catal. 2014, 4, 3957–3971. [Google Scholar] [CrossRef]
- Liu, N.; Guo, Y.; Yang, X.; Lin, H.; Yang, L.; Shi, Z.; Zhong, Z.; Wang, S.; Tang, Y.; Gao, Q. Microwave-Assisted Reactant-Protecting Strategy toward Efficient MoS2 Electrocatalysts in Hydrogen Evolution Reaction. ACS Appl. Mater. Interfaces 2015, 7, 23741–23749. [Google Scholar] [CrossRef]
- Xie, J.; Zhang, J.; Li, S.; Grote, F.; Zhang, X.; Zhang, H.; Wang, R.; Lei, Y.; Pan, B.; Xie, Y. Controllable Disorder Engineering in Oxygen-Incorporated MoS2 Ultrathin Nanosheets for Efficient Hydrogen Evolution. J. Am. Chem. Soc. 2013, 135, 17881–17888. [Google Scholar] [CrossRef]
- Tang, T.; Jiang, W.J.; Niu, S.; Liu, N.; Luo, H.; Chen, Y.Y.; Jin, S.F.; Gao, F.; Wan, L.J.; Hu, J.S. Electronic and Morphological Dual Modulation of Cobalt Carbonate Hydroxides by Mn Doping toward Highly Efficient and Stable Bifunctional Electrocatalysts for Overall Water Splitting. J. Am. Chem. Soc. 2017, 139, 8320–8328. [Google Scholar] [CrossRef]
- Kibsgaard, J.; Jaramillo, T.F. Molybdenum Phosphosulfide: An Active, Acid-Stable, Earth-Abundant Catalyst for the Hydrogen Evolution Reaction. Angew. Chem. Int. Ed. 2014, 53, 14433–14437. [Google Scholar] [CrossRef]
- Cha, H.G.; Song, J.; Kim, H.S.; Shin, W.; Yoon, K.B.; Kang, Y.S. Facile Preparation of Fe2O3 Thin Film with Photoelectrochemical Properties. Chem. Commun. 2011, 47, 2441–2443. [Google Scholar] [CrossRef] [PubMed] [Green Version]
- Cao, Y.; Wu, Y.; Badie, C.; Cadot, S.; Camp, C.; Quadrelli, E.A.; Bachmann, J. Electrocatalytic Performance of Titania Nanotube Arrays Coated with MoS2 by ALD toward the Hydrogen Evolution Reaction. ACS Omega 2019, 4, 8816–8823. [Google Scholar] [CrossRef] [PubMed] [Green Version]
- Danilov, F.I.; Tsurkan, A.; Vasil’Eva, E.; Protsenko, V. Electrocatalytic activity of composite Fe/TiO2 electrodeposits for hydrogen evolution reaction in alkaline solutions. Int. J. Hydrog. Energy 2016, 41, 7363–7372. [Google Scholar] [CrossRef]
- Singh, K.P.; Shin, C.H.; Lee, H.Y.; Razmjooei, F.; Sinhamahapatra, A.; Kang, J.; Yu, J.S. TiO2/ZrO2 Nanoparticle Composites for Electrochemical Hydrogen Evolution. ACS Appl. Nano Mater. 2020, 3, 3634–3645. [Google Scholar] [CrossRef]
- Tahira, A.; Ibupoto, Z.H.; Mazzaro, R.; You, S.; Morandi, V.; Natile, M.M.; Vagin, M.; Vomiero, A. Advanced Electrocatalysts for Hydrogen Evolution Reaction Based on Core-Shell MoS2/TiO2 Nanostructures in Acidic and Alkaline Media. ACS Appl. Energy Mater. 2019, 2, 2053–2062. [Google Scholar] [CrossRef]
- Yu, J.; Zhou, W.; Xiong, T.; Wang, A.; Chen, S.; Chu, B. Enhanced Electrocatalytic Activity of Co@N-doped Carbon Nanotubes by Ultra Small Defect-rich TiO2 Nanoparticles for Hydrogen Evolution Reaction. Nano Res. 2017, 10, 2599–2609. [Google Scholar] [CrossRef]
- Yuan, M.; Zhu, Y.; Deng, L.; Ming, R.; Zhang, A.; Li, W.; Chai, B.; Ren, Z. IrO2-TiO2 Electrocatalyst for the Hydrogen Evolution Reaction in Acidic Water Electrolysis Without Activation. New J. Chem. 2017, 41, 6152–6159. [Google Scholar] [CrossRef]
- Kumar, M.P.; Murugadoss, G.; Mangalaraja, R.V.; Arunachalam, P.; Kumar, M.R.; Hartley, U.W.; Salla, S.; Rajabathar, J.; ALOthman, Z.A.; ALTalhi, T. Design and Development of Defect Rich Titania Nanostructure for Efficient Electrocatalyst for Hydrogen Evolution Reaction in an Acidic Electrolyte. J. Mater. Res. Technol. 2021, 14, 2739–2750. [Google Scholar] [CrossRef]
- Rüdiger, C.; Maglia, F.; Leonardi, S.; Sachsenhauser, M.; Sharp, I.D.; Paschos, O.; Kunze, J. Surface Analytical Study of Carbothermally Reduced Titania Films for Electrocatalysis Application. Electrochim. Acta 2012, 71, 1–9. [Google Scholar] [CrossRef]
- Ren, B.; Jin, Q.; Li, Y.; Li, Y.; Cui, H.; Wang, C. Activating Titanium Dioxide as a New Efficient Electrocatalyst: From Theory to Experiment. ACS Appl. Mater. Interfaces 2020, 12, 11607–11615. [Google Scholar] [CrossRef]
- Ibrahim, M.M.; Mezni, A.; Alsawat, M.; Kumeria, T.; Das, M.R.; Alzahly, S.; Aldalbahi, A.; Gornicka, K.; Ryl, J.; Amin, M.A.; et al. Enhanced Hydrogen Evolution Reaction on Highly Stable Titania-Supported PdO and Eu2O3 Nanocomposites in a Strong Alkaline Solution. Int. J. Energy Res. 2019, 43, 5367–5383. [Google Scholar] [CrossRef]
- Ibrahim, M.M.; Mezni, A.; Alsawat, M.; Kumeria, T.; Alrooqi, A.; Shaltout, M.R.; Ahmed, S.I.; Boukherroub, R.; Amin, M.A.; Altalhi, T. Crystalline ZnO and ZnO/TiO2 Nanoparticles Derived from Tert-butyl N-(2 mercaptoethyl)carbamatozinc(II) Chelate: Electrocatalytic Studies for H2 Generation in Alkaline Electrolytes. Int. J. Energy Res. 2020, 44, 6725–6744. [Google Scholar] [CrossRef]


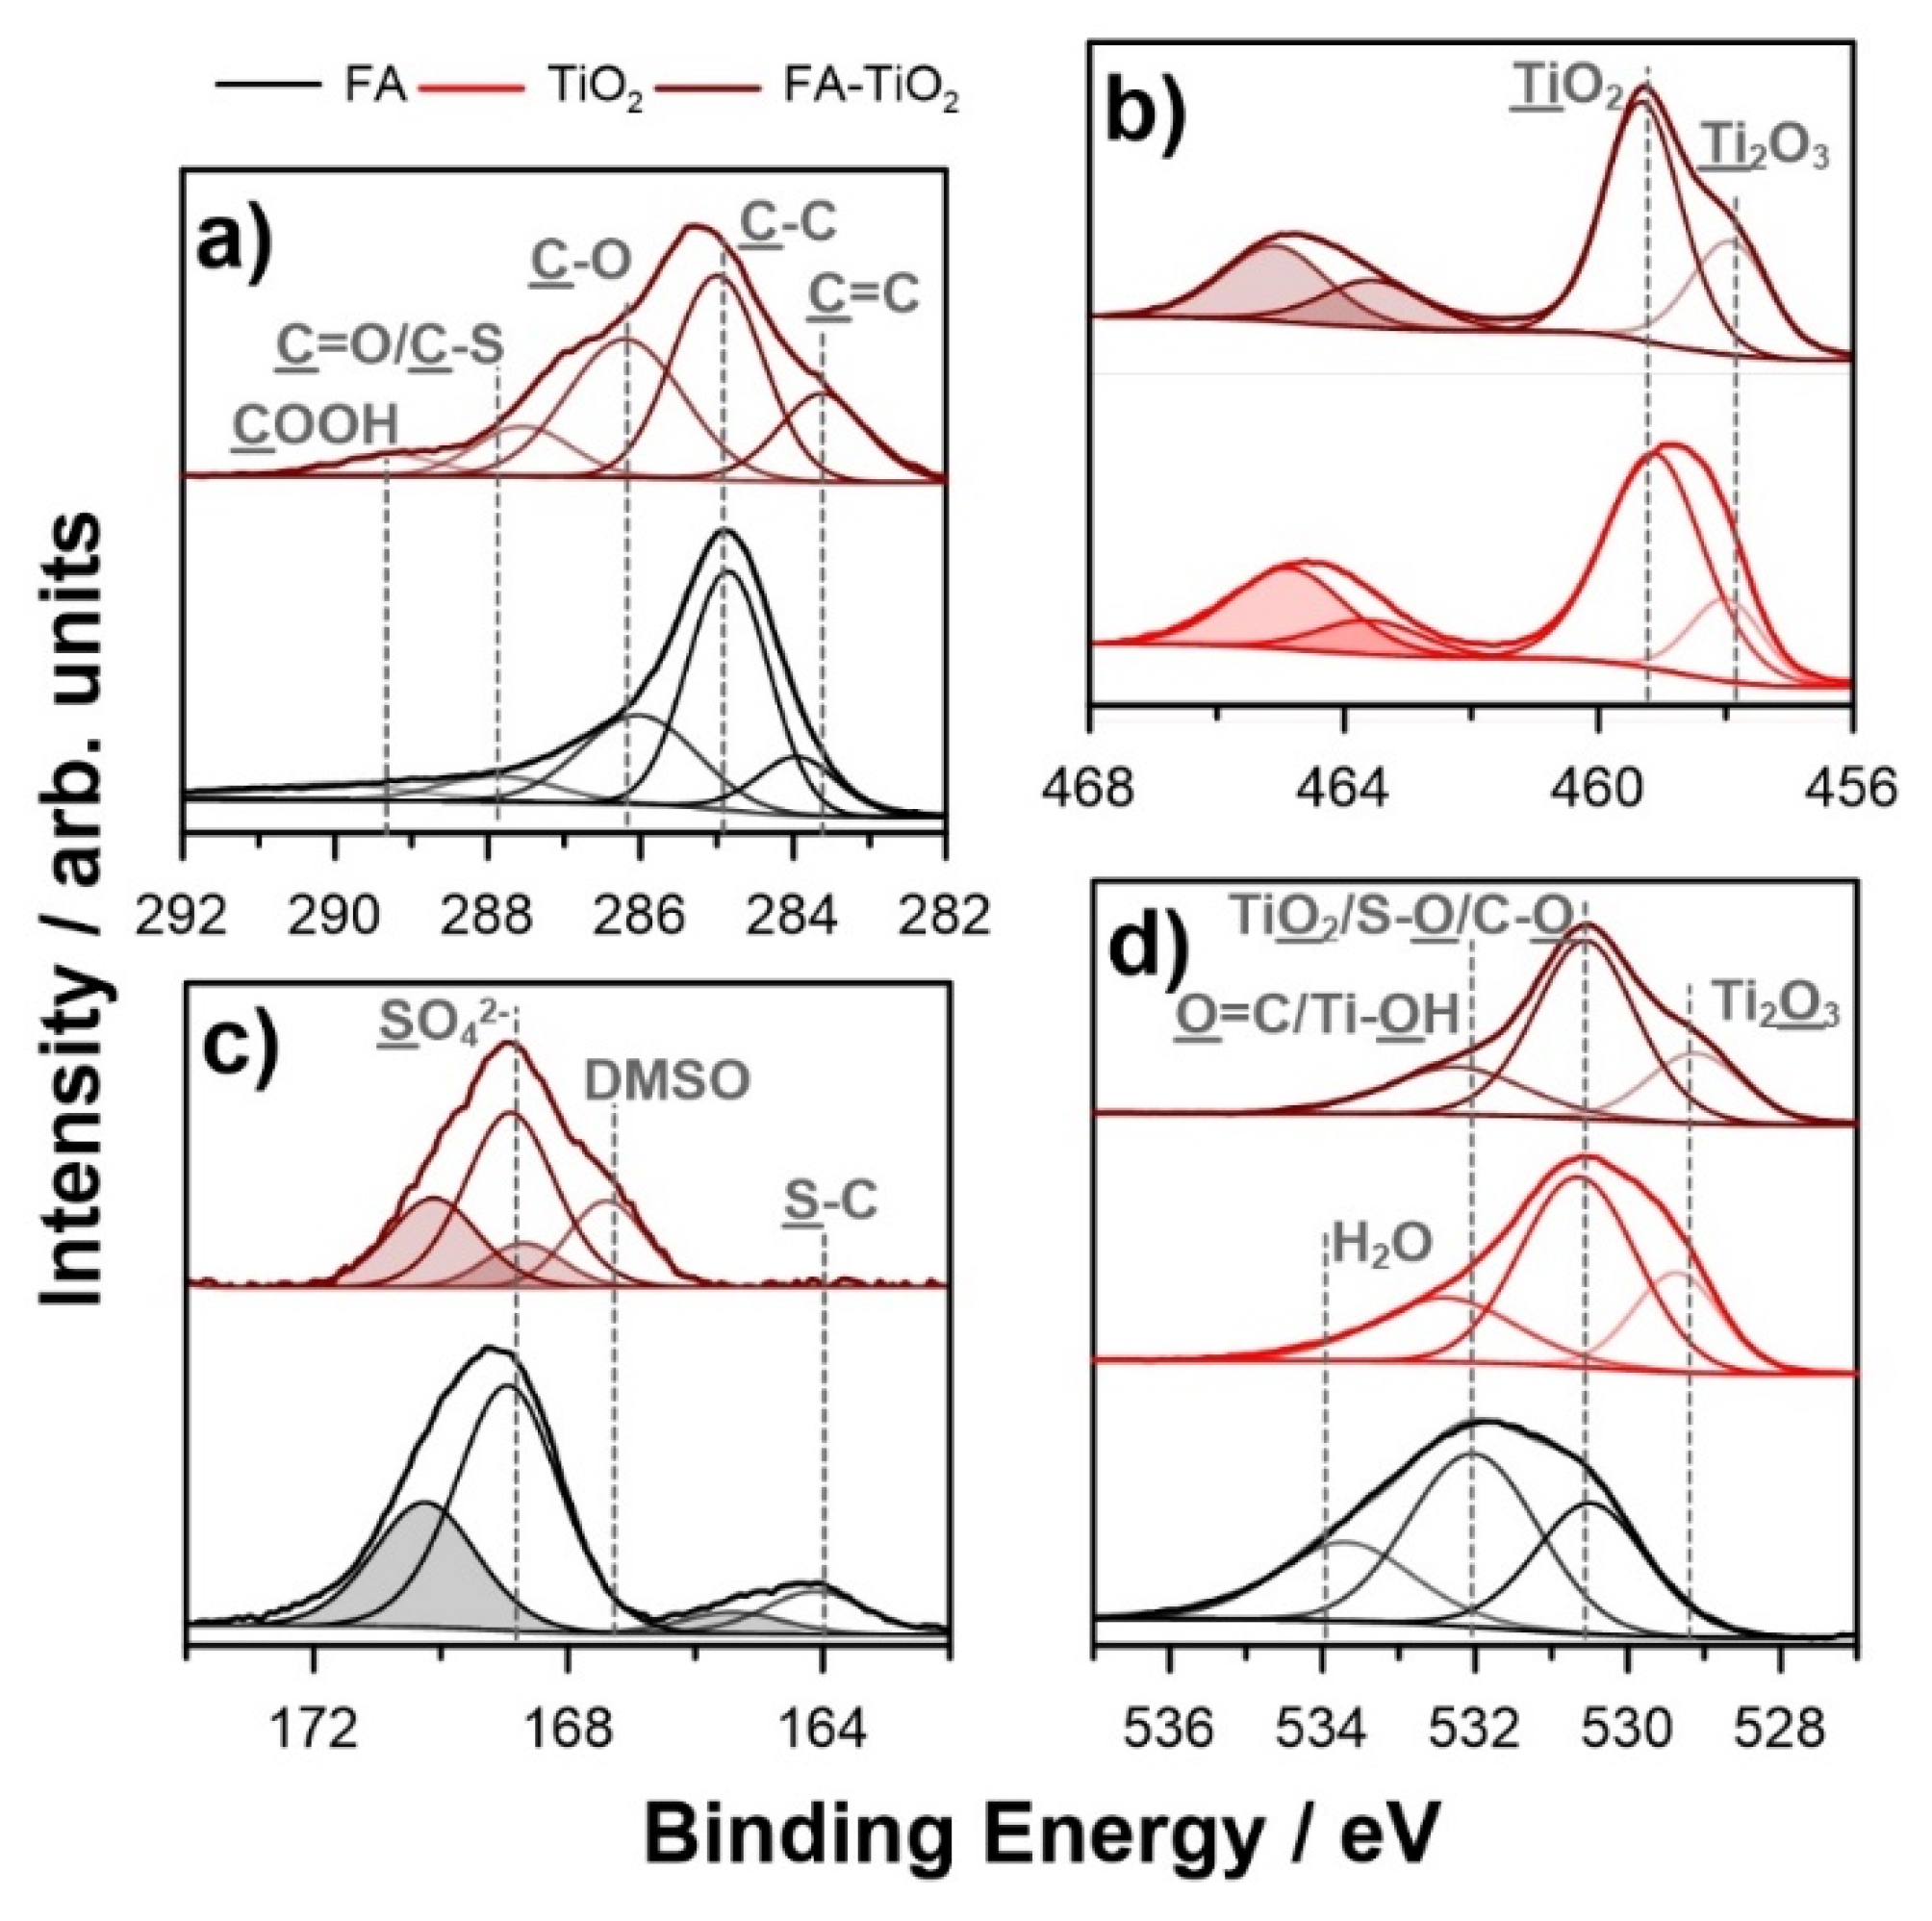
| Ti 2p3/2 | C 1s | O 1s | S 2p3/2 | |||||||||||
|---|---|---|---|---|---|---|---|---|---|---|---|---|---|---|
| TiO2 | Ti2O3 | C=C | C–C | C–O | C=O/C–S | COOH | TiO2/S–O/C=O | Ti2O3 | C–O/Ti–OH | H2O | SO42- | DMSO | S–C | |
| BE/eV | 459.1 | 457.8 | 283.8 | 284.8 | 285.9 | 287.8 | 289.3 | 530.5 | 529.2 | 532.1 | 533.9 | 168.9 | 167.2 | 164.0 |
| FA | -- | -- | 7.6 | 30.3 | 16.0 | 4.6 | 3.9 | 10.3 | -- | 15.2 | 7.6 | 3.8 | -- | 0.7 |
| TiO2 | 24.9 | 7.0 | -- | -- | -- | -- | -- | 48.5 | 10.6 | 9.0 | -- | -- | -- | -- |
| FA-TiO2 | 13.5 | 6.7 | 2.7 | 6.3 | 5.4 | 1.6 | 0.7 | 29.1 | 11.0 | 21.1 | -- | 1.3 | 0.6 | -- |
| Tested Cathode | Onset Potential (EHER)/mV vs. RHE) | Tafel Slope (−βc, mV dec−1) | Exchange Current Density (jo, mA cm−2) | Cathodic Potential at j = 10 mA cm−2 (η10, mV vs. RHE) |
|---|---|---|---|---|
| bare GC (unactivated) | −886 (10.4) | --- | --- | --- |
| bare GC (activated) | −793 (9.2) | --- | --- | --- |
| GC-FA (unactivated) | −534 (6.0) | 168 (1.9) | 2.14 (0.04) × 10−4 | 737 (8) |
| GC-FA (activated) | −468 (5.2) | 167 (2.1) | 5.9 (0.1) × 10−4 | 677 (7.4) |
| GC-TiO2 (unactivated) | −338 (3.8) | 165 (1.8) | 4.0 (0.07) × 10−3 | 554 (6.2) |
| GC-TiO2 (activated) | −282 (3.1) | 163 (1.7) | 1.8 (0.04) × 10−2 | 443 (5.0) |
| GC-(FA-TiO2) (unactivated) | −144 (1.8) | 124 (1.7) | 6.8 (0.1) × 10−2 | 160 (3.3) |
| GC-(FA-TiO2) (activated) | −28 (0.5) | 115 (1.4) | 65 (1.3) × 10−2 | 125 (1.6) |
| Pt/C | 10 (0.2) | 113 (1.2) | 88 (1.2) × 10−2 | 110 (1.4) |
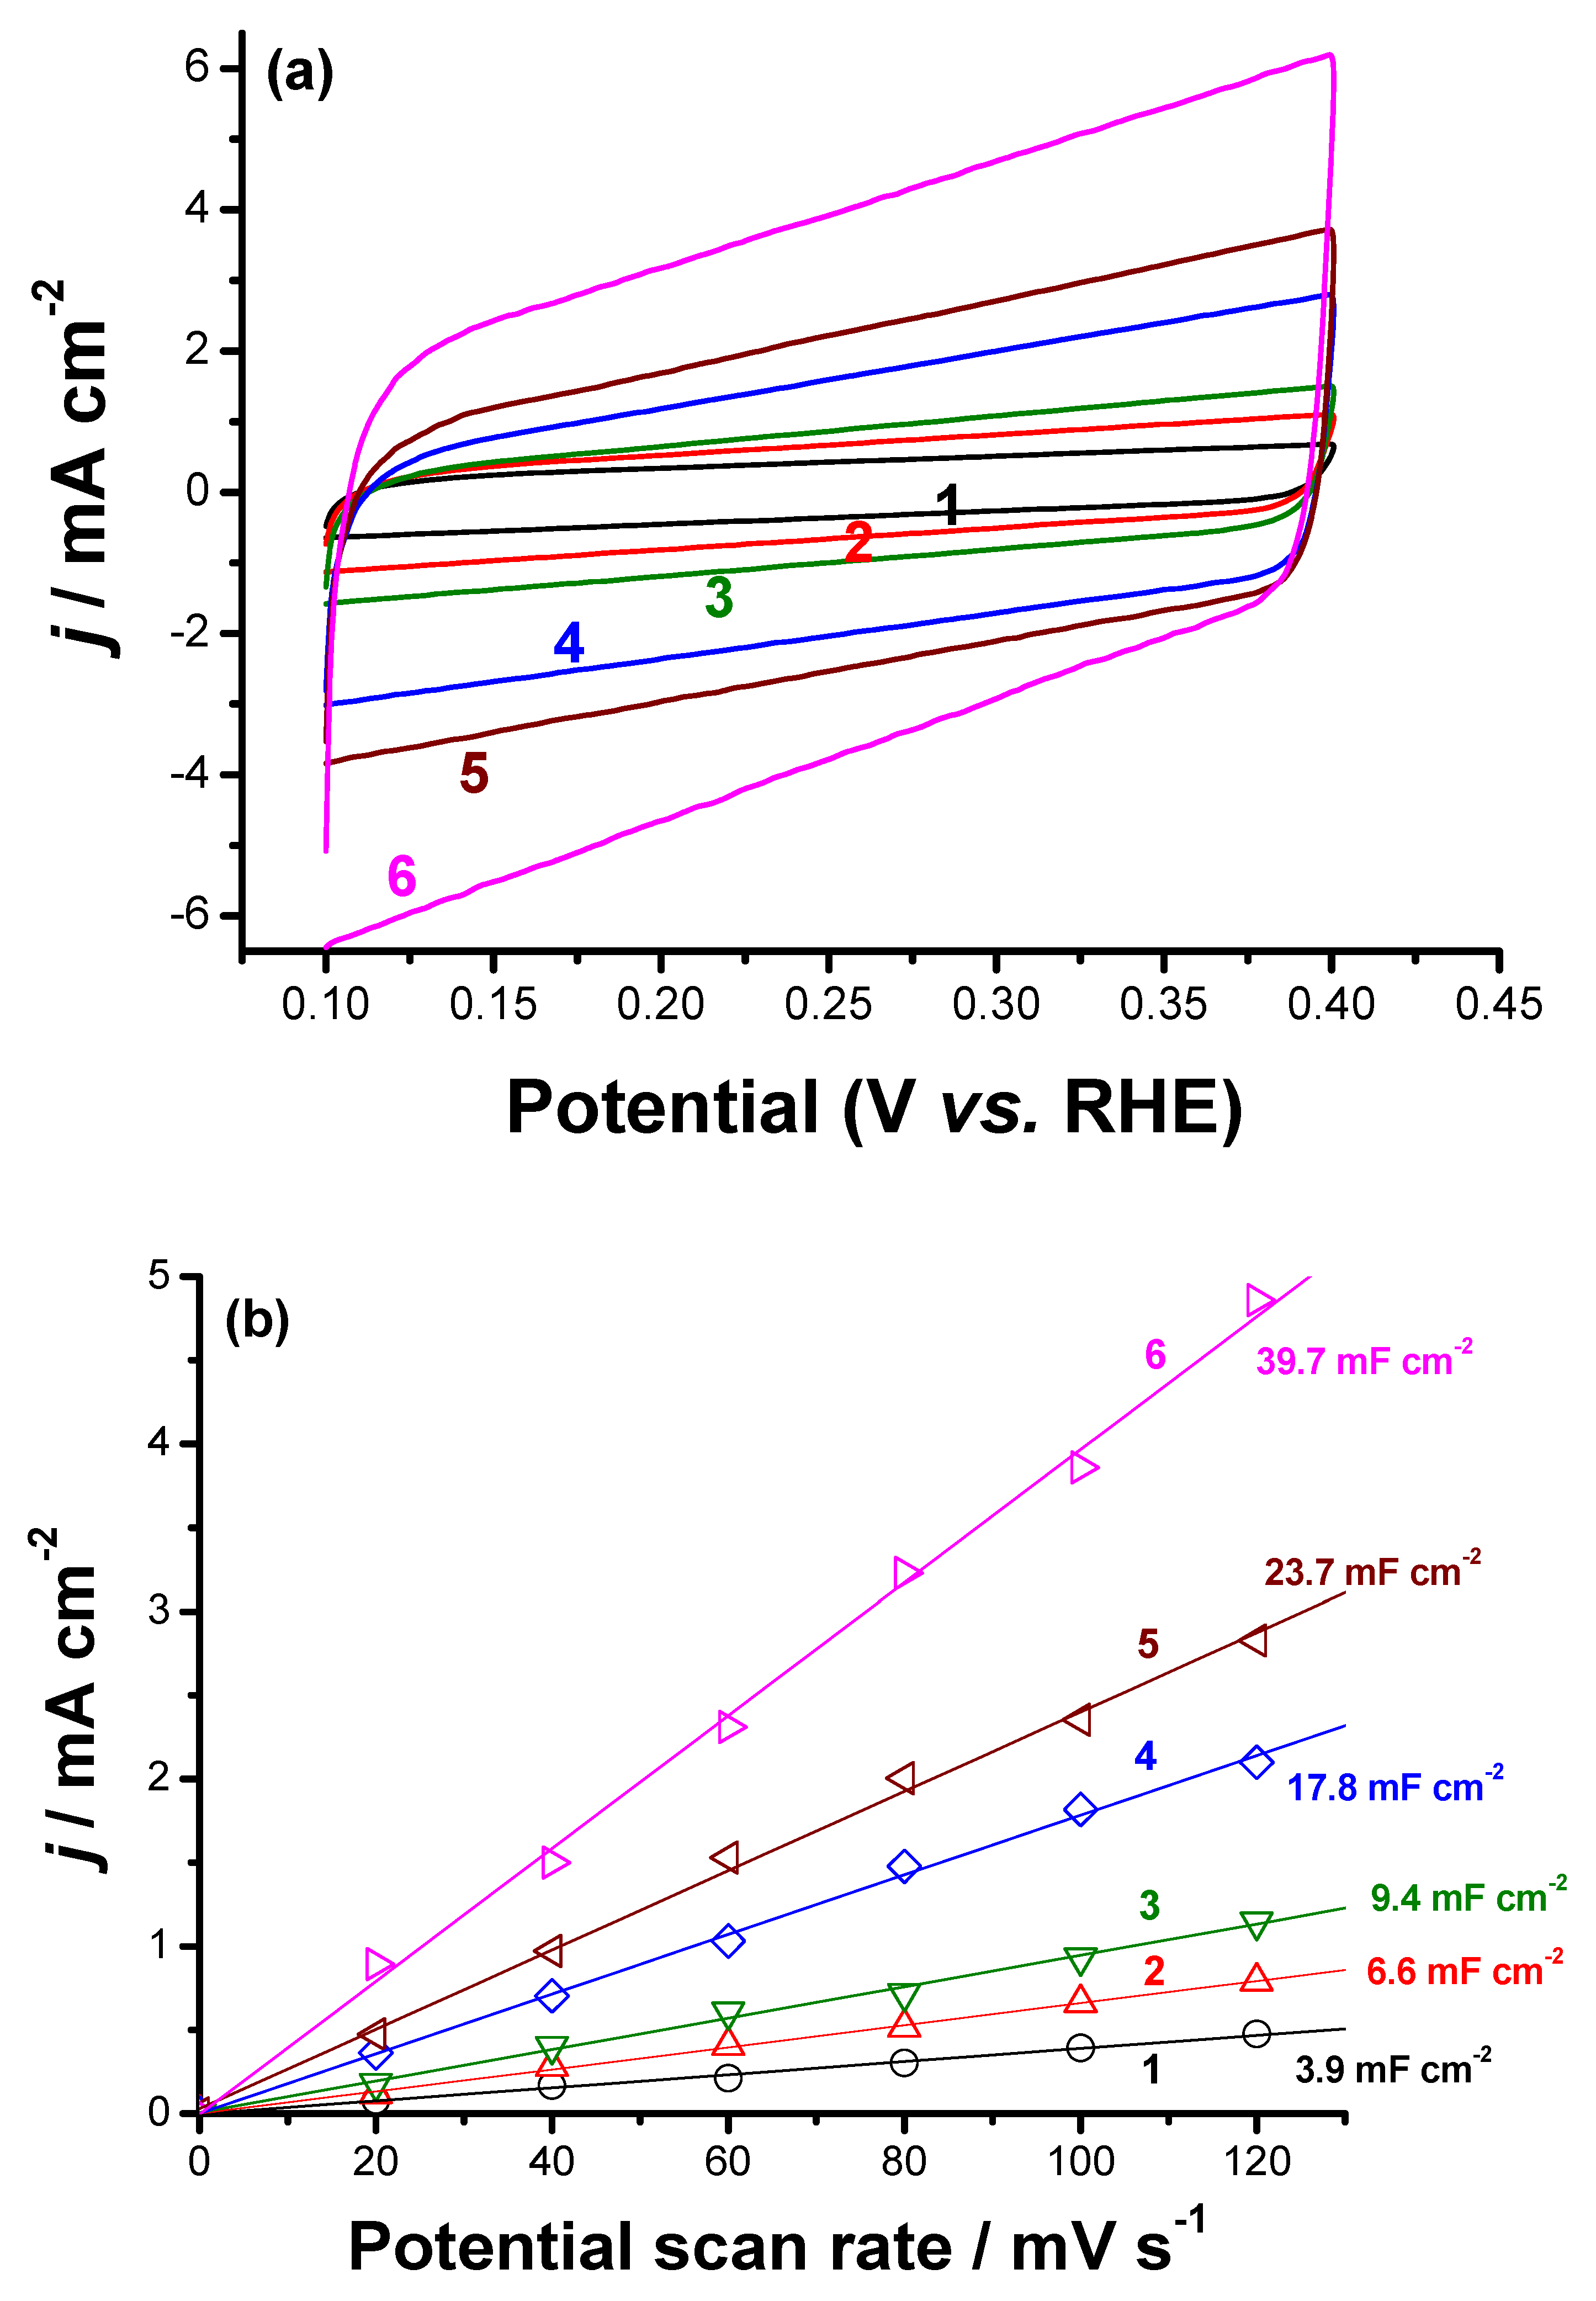
| Tested Cathode | Cdl/mF cm−2 | EASA/cm2 | Qnet × 103/C @100 mV s−1 | n × 108/mol |
|---|---|---|---|---|
| GC-FA (unactivated) | 3.9 | 130 | 9.4 | 4.87 |
| GC-FA (activated) | 6.6 | 220 | 21.2 | 10.99 |
| GC-TiO2 (unactivated) | 9.4 | 313 | 24.9 | 12.9 |
| GC-TiO2 (activated) | 17.8 | 593 | 28.5 | 14.77 |
| GC-(FA-TiO2) (unactivated) | 23.7 | 790 | 33.9 | 17.58 |
| GC-(FA-TiO2) (activated) | 39.7 | 1323 | 96.8 | 50.16 |
| Tested Electrocatalysts | Calculated H2 Based on the Charge Passed during Electrolysis | H2 Measured by GC (H2/μmol h−1) | FE(%) | |
|---|---|---|---|---|
| Charge Passed/C | H2/μmol h−1 | |||
| GC-FA (unactivated) | 2.4(0.03) | 12.44 | 6.02(0.08) | 48.4(0.6) |
| GC-FA (activated) | 3.2(0.04) | 16.58 | 11.24(0.15) | 67.8(0.7) |
| GC-TiO2 (unactivated) | 3.4(0.05) | 17.62 | 13.46(0.22) | 76.4(0.9) |
| GC-TiO2 (activated) | 4.7(0.06) | 24.36 | 21.66(0.36) | 88.9(1.1) |
| GC-(FA-TiO2) (unactivated) | 4.9(0.07) | 25.40 | 23.55(0.32) | 92.7(1.3) |
| GC-(FA-TiO2) (activated) | 6.1(0.08) | 31.61 | 31.17(0.42) | 98.6(1.5) |
Publisher’s Note: MDPI stays neutral with regard to jurisdictional claims in published maps and institutional affiliations. |
© 2022 by the authors. Licensee MDPI, Basel, Switzerland. This article is an open access article distributed under the terms and conditions of the Creative Commons Attribution (CC BY) license (https://creativecommons.org/licenses/by/4.0/).
Share and Cite
Altalhi, T.; Mezni, A.; Ibrahim, M.M.; Refat, M.S.; Gobouri, A.A.; Safklou, A.M.; Mousli, A.M.; Attia, M.S.; Boruah, P.K.; Das, M.R.; et al. Cathodic Activation of Titania-Fly Ash Cenospheres for Efficient Electrochemical Hydrogen Production: A Proposed Solution to Treat Fly Ash Waste. Catalysts 2022, 12, 466. https://doi.org/10.3390/catal12050466
Altalhi T, Mezni A, Ibrahim MM, Refat MS, Gobouri AA, Safklou AM, Mousli AM, Attia MS, Boruah PK, Das MR, et al. Cathodic Activation of Titania-Fly Ash Cenospheres for Efficient Electrochemical Hydrogen Production: A Proposed Solution to Treat Fly Ash Waste. Catalysts. 2022; 12(5):466. https://doi.org/10.3390/catal12050466
Chicago/Turabian StyleAltalhi, Tariq, Amine Mezni, Mohamed M. Ibrahim, Moamen S. Refat, Adil A. Gobouri, Ayham M. Safklou, Adel M. Mousli, Mohamed S. Attia, Purna K. Boruah, Manash R. Das, and et al. 2022. "Cathodic Activation of Titania-Fly Ash Cenospheres for Efficient Electrochemical Hydrogen Production: A Proposed Solution to Treat Fly Ash Waste" Catalysts 12, no. 5: 466. https://doi.org/10.3390/catal12050466