Abstract
Carbon dots (CDs) are interesting carbon nanomaterials that exhibit great photoluminescent features, low cytotoxicity, and excellent water stability and solubility. For these reasons, many fields are starting to integrate their use for a variety of purposes. The catalytic performance of VOPO4 has been evaluated in the synthesis of nitrogen-doped carbon dots (N-CDs). The synthesis reaction was carried out at 180 °C using VOPO4 as a heterogeneous catalyst for 2 to 4 h of reaction time. After reaction, the N-CDs were purified using a novel method for the protection of the functional groups over the surfaces of the N-CDs. The morphological, superficial, and photoelectronic properties of the N-CDs were thoroughly studied by means of TEM, HRTEM, XPS, and photoluminescence measurements. The conversion of the carbon precursor was followed by HPLC. After three catalytic runs, the catalyst was still active while ensuring the quality of the N-CDs obtained. After the third cycle, the catalyst was regenerated, and it recovered its full activity. The obtained N-CDs showed a great degree of oxidized groups in their surfaces that translated into high photoluminescence when irradiated under different lasers. Due to the observed photoelectronic properties, they were then assayed in the photocatalytic degradation of methyl orange.
1. Introduction
Carbon dots (CDs) are zero-dimensional particles normally smaller than 10 nm in diameter [1]. Their morphology is quasi-spherical and comprises a graphite-like core composed mainly of carbon, which can present inclusions of different adatoms such as N and S, and of a surface decorated by different organic functional groups. This superficial functionalization allows CDs to develop different surface trap states, lowering the energy band gap [2]. This is coupled with the fact that graphitic sp2 structures favor the projection of the recombination of electrons and hole [3], thus promoting a possible transition HOMO-LUMO and explaining their outstanding electronic properties. As for their optical properties, these nanoparticles are widely recognized as highly photoluminescent systems, with tunable and up-conversion photoluminescence properties [3]. CDs’ optical properties show enormous variation with size. An increment in size directly translates into a decrease in the energy gap between HOMO and LUMO. Therefore, a bathochromic shift to higher-wavelength emissions is observed. However, sp2 clusters can act as auxochromes, decreasing the energy gaps and exhibiting a completely opposite effect to the formerly described size-gap relation [4]. As CDs are functionalized by a great variety of groups, they exhibit surface state photoluminescence, considering that the functional groups on their surface have multiple energy levels that can interact and result in emissive traps, thus dominating the emissions. The surface state is a synergetic contribution of all groups conforming to the surface of the carbon dot that hybridize with the outer graphitic core [5]. The presence of different functional groups on the surfaces of the CDs not only control their electronic properties, but are the cause of their water stability and solubility. Since they are carbon-based materials, their cytotoxicity has been proven to be very low and more environmentally friendly than their analogues, metallic quantum dots. Due to this phenomenon, known as quantum confinement, along with their low cytotoxicity and excellent optical properties, CDs have numerous practical applications: bioimaging [6], light-harvesting [7], photocatalysts [8] and photosensitizers [9], bio- and chemosensors [10], and drug delivery [11].
Their outstanding optical features are very sensitive to minimal structural changes, including heteroatomic inclusions [12]. For that reason, one of the main methods of tuning the photoluminescent properties of CDs consists of doping the CDs with either one kind of element, such as N, P, or S, in different concentrations, or combining them to synthesize codoped CDs [13]. The nature and quantity of the dopant are key parameters for the improvement of the photophysical properties of CDs, as their electronic structure is modified by the presence of adatoms originating from n or p carriers [14]. Nitrogen is frequently used for doping CDs, as the variety of precursors that can be used is wide, from organic to inorganic compounds. These dopants can be added during synthesis or post-synthesis, and its presence can highly impact the quantum yield (QY) of CDs [15], increasing it to values as high as 26% when it acts as a codopant along with sulfur atoms [16] in water, and up to nearly 100% depending on the emission wavelength when using solvents different from water [17]. Doping [18], along with surface functionalization [19] and size [20,21], are the three main factors controlling the emission wavelengths of CDs. A high amount of N as the dopant [22] reduces the bandgap between valence and conduction bans, causing a bathochromic shift. The presence of several organic groups on the surfaces of CDs can be observed, as different contributions appear in the photoluminescence spectra. Each emission can be assigned to a different group [23,24]. CDs energy gaps are also strongly affected by size. As size increases, the bandgap decreases, red-shifting the emission [25].
Generally, for the synthesis of CDs, whether the carbon precursor is a green precursor [26] or a commercial one and whether the dopant is added during the synthesis or post-synthesis, the preferred method is hydrothermal synthesis. Although hydrothermal synthesis is, in general terms, a green synthetic process, many authors still rely on strong mineral acids for the production of CDs [27,28]. These mineral acids are corrosive, contaminant, and cannot be recovered or reused after reaction, generating streams that must be neutralized before disposal. This is why greener alternatives based on the use of solid catalysts are starting to be considered [26,29]. However, heterogeneous catalysis also faces a major issue. In terms of acidity, they present much lower values of Brønsted acidity, which is necessary for the major transformation of the precursors into CDs. In this sense, catalysts based on V, Nb, Sn, and Zr are widely used in processes that require strong Brønsted acidity [30,31,32].
The aim of this work is to synthesize CDs doped with N adatoms by means of heterogeneous catalysis. Thus, in this work, vanadyl phosphate (VOPO4) is proposed as a bifunctional catalyst that will promote the dehydration and aggregation of the carbon precursor while oxidizing the functional groups on the surfaces of N-CDs. With this approach to CD synthesis, we present a mineral acid-free hydrothermal alternative that replicates the conditions of real biomass-derived monosaccharides without compromising the purification, quality, or quantity of N-CDs, nor their photophysical or catalytic properties, and ensuring the recyclability of the catalyst.
2. Results and Discussion
2.1. Characterization of the CDs
2.1.1. Morphological and Superficial Study
The synthesis of CDs was carried out following a bottom-up approach, using xylose as a model biomass molecule, VOPO4 as a catalyst, and nitrogen as the doping adatom of the surface. Moreover, considering that the fractionation of lignocellulosic biomass yields a liquor of hemicellulosic sugars with an acidic pH, basically originating from acetic acid, this acid was added to the xylose solution.
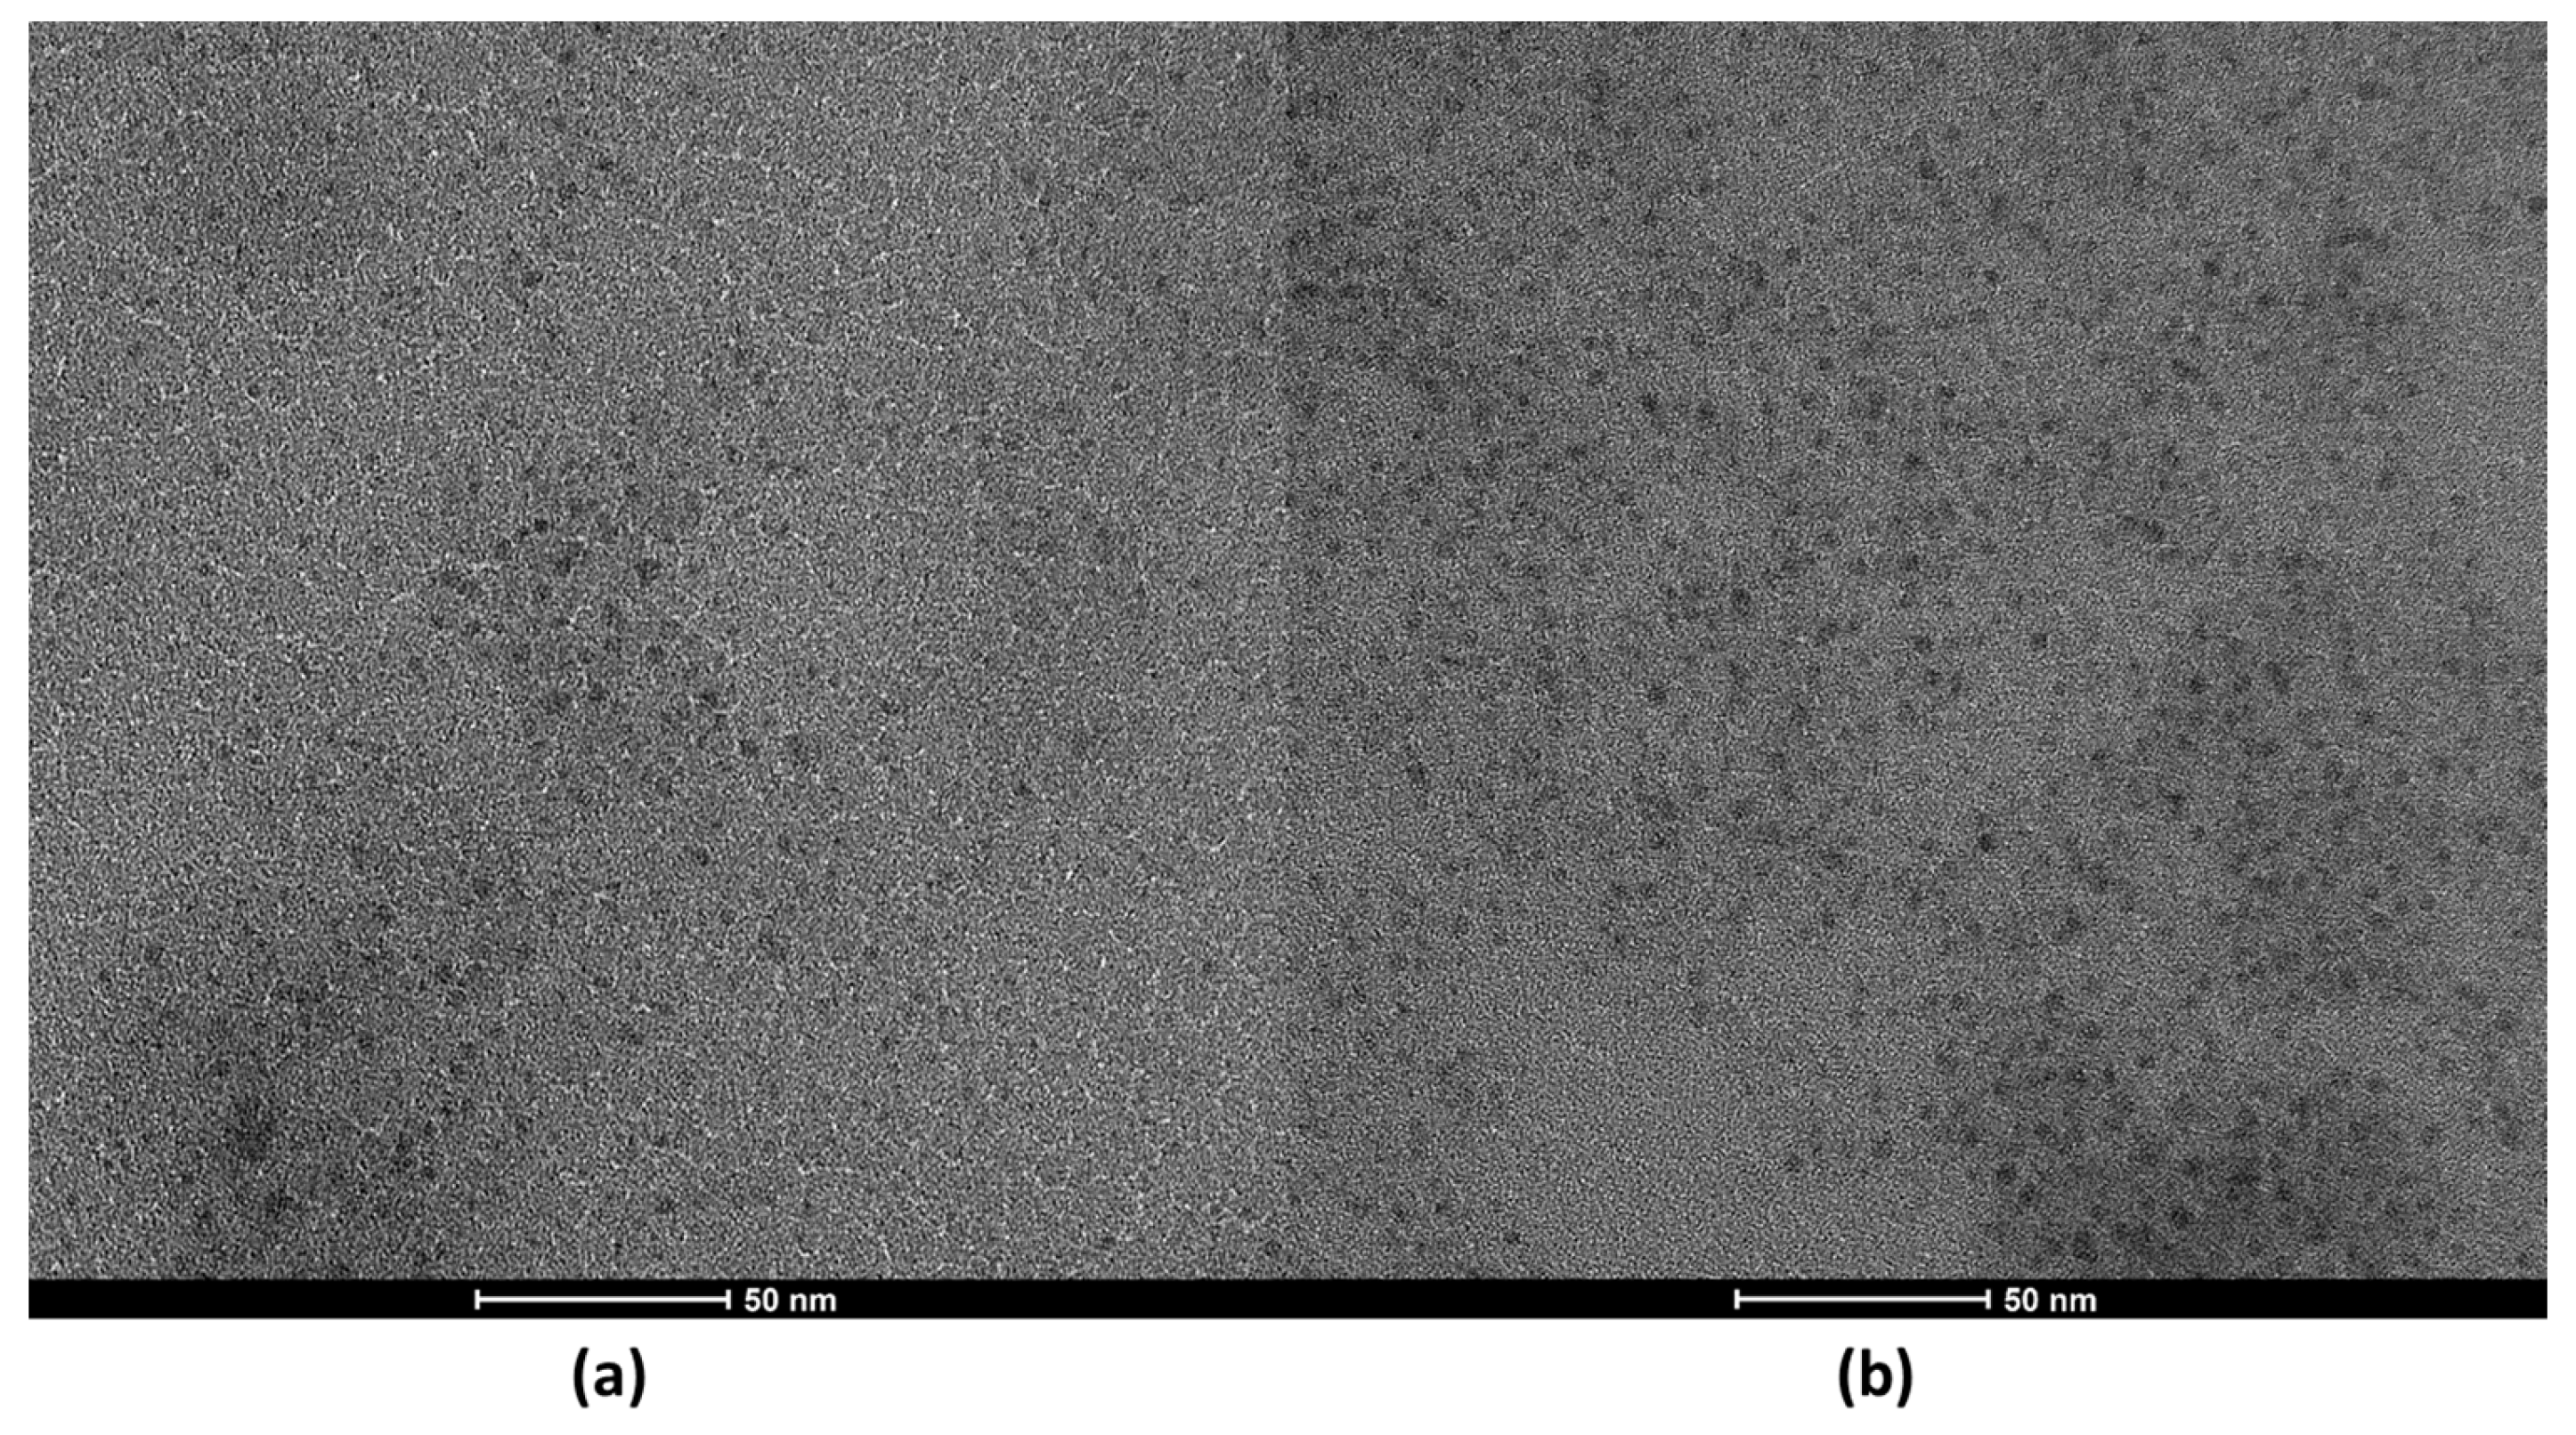
It is important to note that the acetic acid was not sufficient to produce the CDs; therefore, the catalytic activity was only due to the presence of the solid catalyst. The morphology and size distribution (Figure S1) were studied by TEM (Figure 1) and HRTEM (Figure S2). The resulting images show that the N-CDs were effectively obtaining using VOPO4 as the catalyst. There was a substantial difference in the yield of CDs when reaction time was doubled, as in Figure 1a, the reaction was stopped after 2 h, and in Figure 1b, it was kept for 4 h. The reaction time did not affect the quality of the nanoparticles in any way, as the shape remained quasi-spherical after 4 h and the average size ranged between 3.5 and 4 nm in diameter for both reaction times (Figure 1), meaning that a great degree of size homogeneity was achieved. It was thus decided to carry out the synthesis of CDs for 4 h. For further confirmation of the presence of N-CDs in the solution after reaction, the graphite spacing was identified by means of HRTEM and is presented in the Supplementary Materials (Figure S2). When measured, the spacing value was 0.287 nm on average. The obtained XRD pattern is also presented as further confirmation of the graphitic nature of the cores of N-CDs (Figure S3), as a broad peak at 21° was detected, corresponding to the (111) plane of graphite [33].
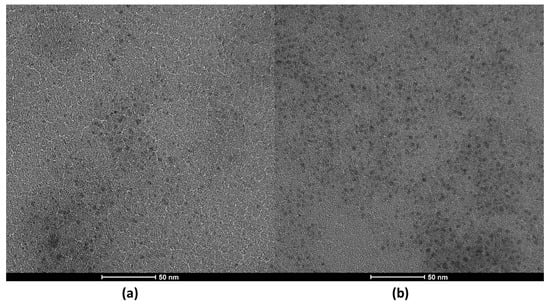
Figure 1.
TEM images of N-CDs solutions synthesized using 100 mg VOPO4 as the catalyst, 0.75 M of xylose as the C precursor, NH4Cl as the dopant, and 17 g/L of CH3COOH at 180 °C after (a) 2 h of reaction and (b) 4 h of reaction. Both samples were dialyzed prior to the analysis.
The acid properties of the catalyst were evaluated by means of the adsorption of pyridine coupled with FTIR spectroscopy (Figure S4). The TEM images confirm that the acidic properties of the catalyst are strong enough for the synthesis of the nanoparticles to be carried out. Due to the noise of the spectra and the fact that the catalyst was diluted in KBr, since its yellow coloration was blocking the IR beam, the concentrations of both the Brønsted and Lewis acid sites were not calculated. Thus, the spectra are provided as a qualitative approach to understand the nature of the acid sites of VOPO4, due to its importance regarding the acidity of the medium needed to carry out the synthesis of the CDs. Despite the noise that hindered the interpretation of the spectra of VOPO4, a band attributed to a strong Brønsted acidity site could be identified. A main band regarding the adsorption of pyridine on the catalyst was located at 1677 cm−1. This band was ascribed to the presence of strong Brønsted acid sites [34] and corresponded to the ν8a vibration mode of pyridinium species [35].
As the temperature rose, the band maintained a similar value of absorbance until, drastically, it almost disappeared at 125 °C. The Lewis acid sites were not detected, indicating that this catalyst can be considered as a Brønsted solid. Additional characterization for the VOPO4 catalyst (XRD pattern and Raman spectrum) is presented in the Supplementary Materials of this publication (Figures S5 and S6).
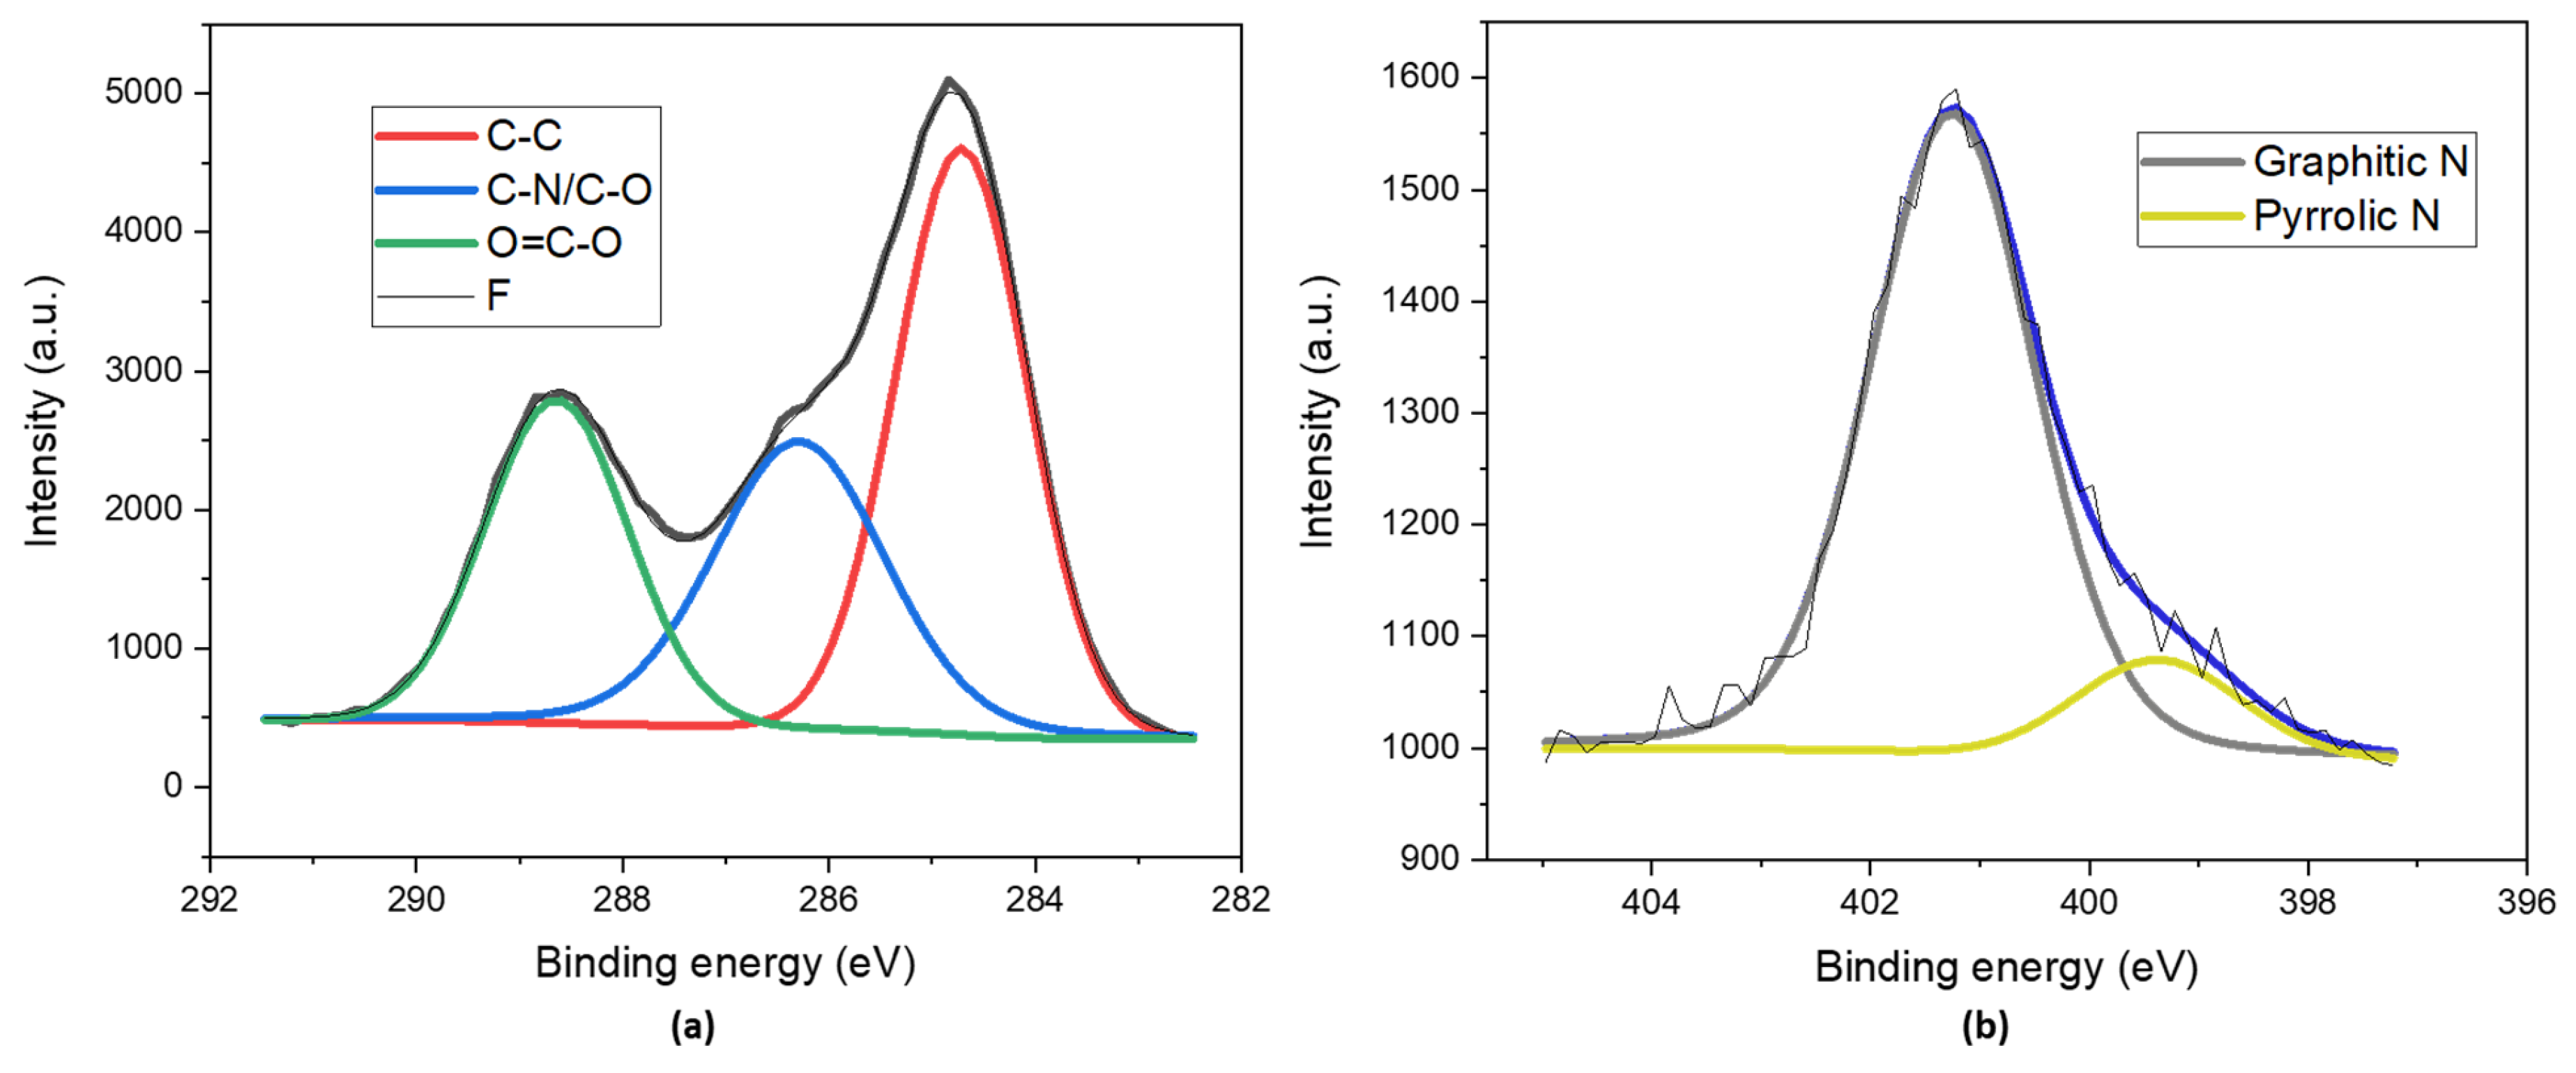
The surfaces of the N-CDs were analyzed by means of XPS analysis. We found that 45.6% of the surface was C (Table 1), as was expected due to the graphitic nature of the core. As can be observed in the deconvolution of the C1s core level (Figure 2a), there was a major contribution at 284.7 eV (Table 2) that corresponded to the C-C bond [36]. The existence of highly oxidized groups was doubly confirmed, on the one hand, by the high percentage of O present on the surface (47.7%), and on the other hand, by the next two bands in the deconvolution at 286.3 eV and 288.6 eV, which were associated with the C–N/C–O bond and the O=C–O type of bond, respectively [37]. The N1s core level was analyzed to determine the nature of the species included on the surfaces of the N-CDs (Figure 2b). The band at 401.3 eV (Table 2) made the greatest contribution. This band is usually attributed to graphitic N. The other band (399.4 eV) present in the deconvolution spectrum was related to a small amount of amine nitrogen [38,39].

Table 1.
XPS mass concentration table of the surface of N-CDs synthesized using 100 mg VOPO4 as the catalyst, 0.75 M of xylose as the C precursor, NH4Cl as the dopant, and 17 g/L of CH3COOH at 180 °C after 4 h of reaction.
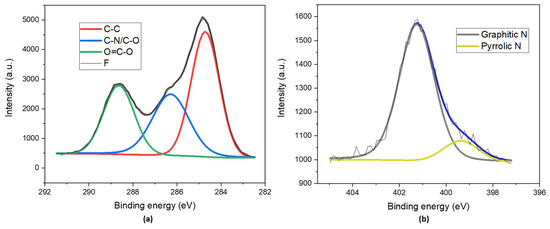
Figure 2.
XPS deconvoluted spectra of (a) the C1s core level and (b) the N1s core level of dialyzed and lyophilized N-CDs synthesized from 100 mg VOPO4 as the catalyst, 0.75 M of xylose as the precursor, NH4Cl as the dopant, and 17 g/L of CH3COOH at 180 °C after 4 h of reaction.

Table 2.
XPS energy binding deconvoluted bands of the C1s core level and N1s core level of N-CDs synthesized using 100 mg VOPO4 as the catalyst, 0.75 M of xylose as the C precursor, NH4Cl as the dopant, and 17 g/L of CH3COOH at 180 °C after 4 h of reaction.
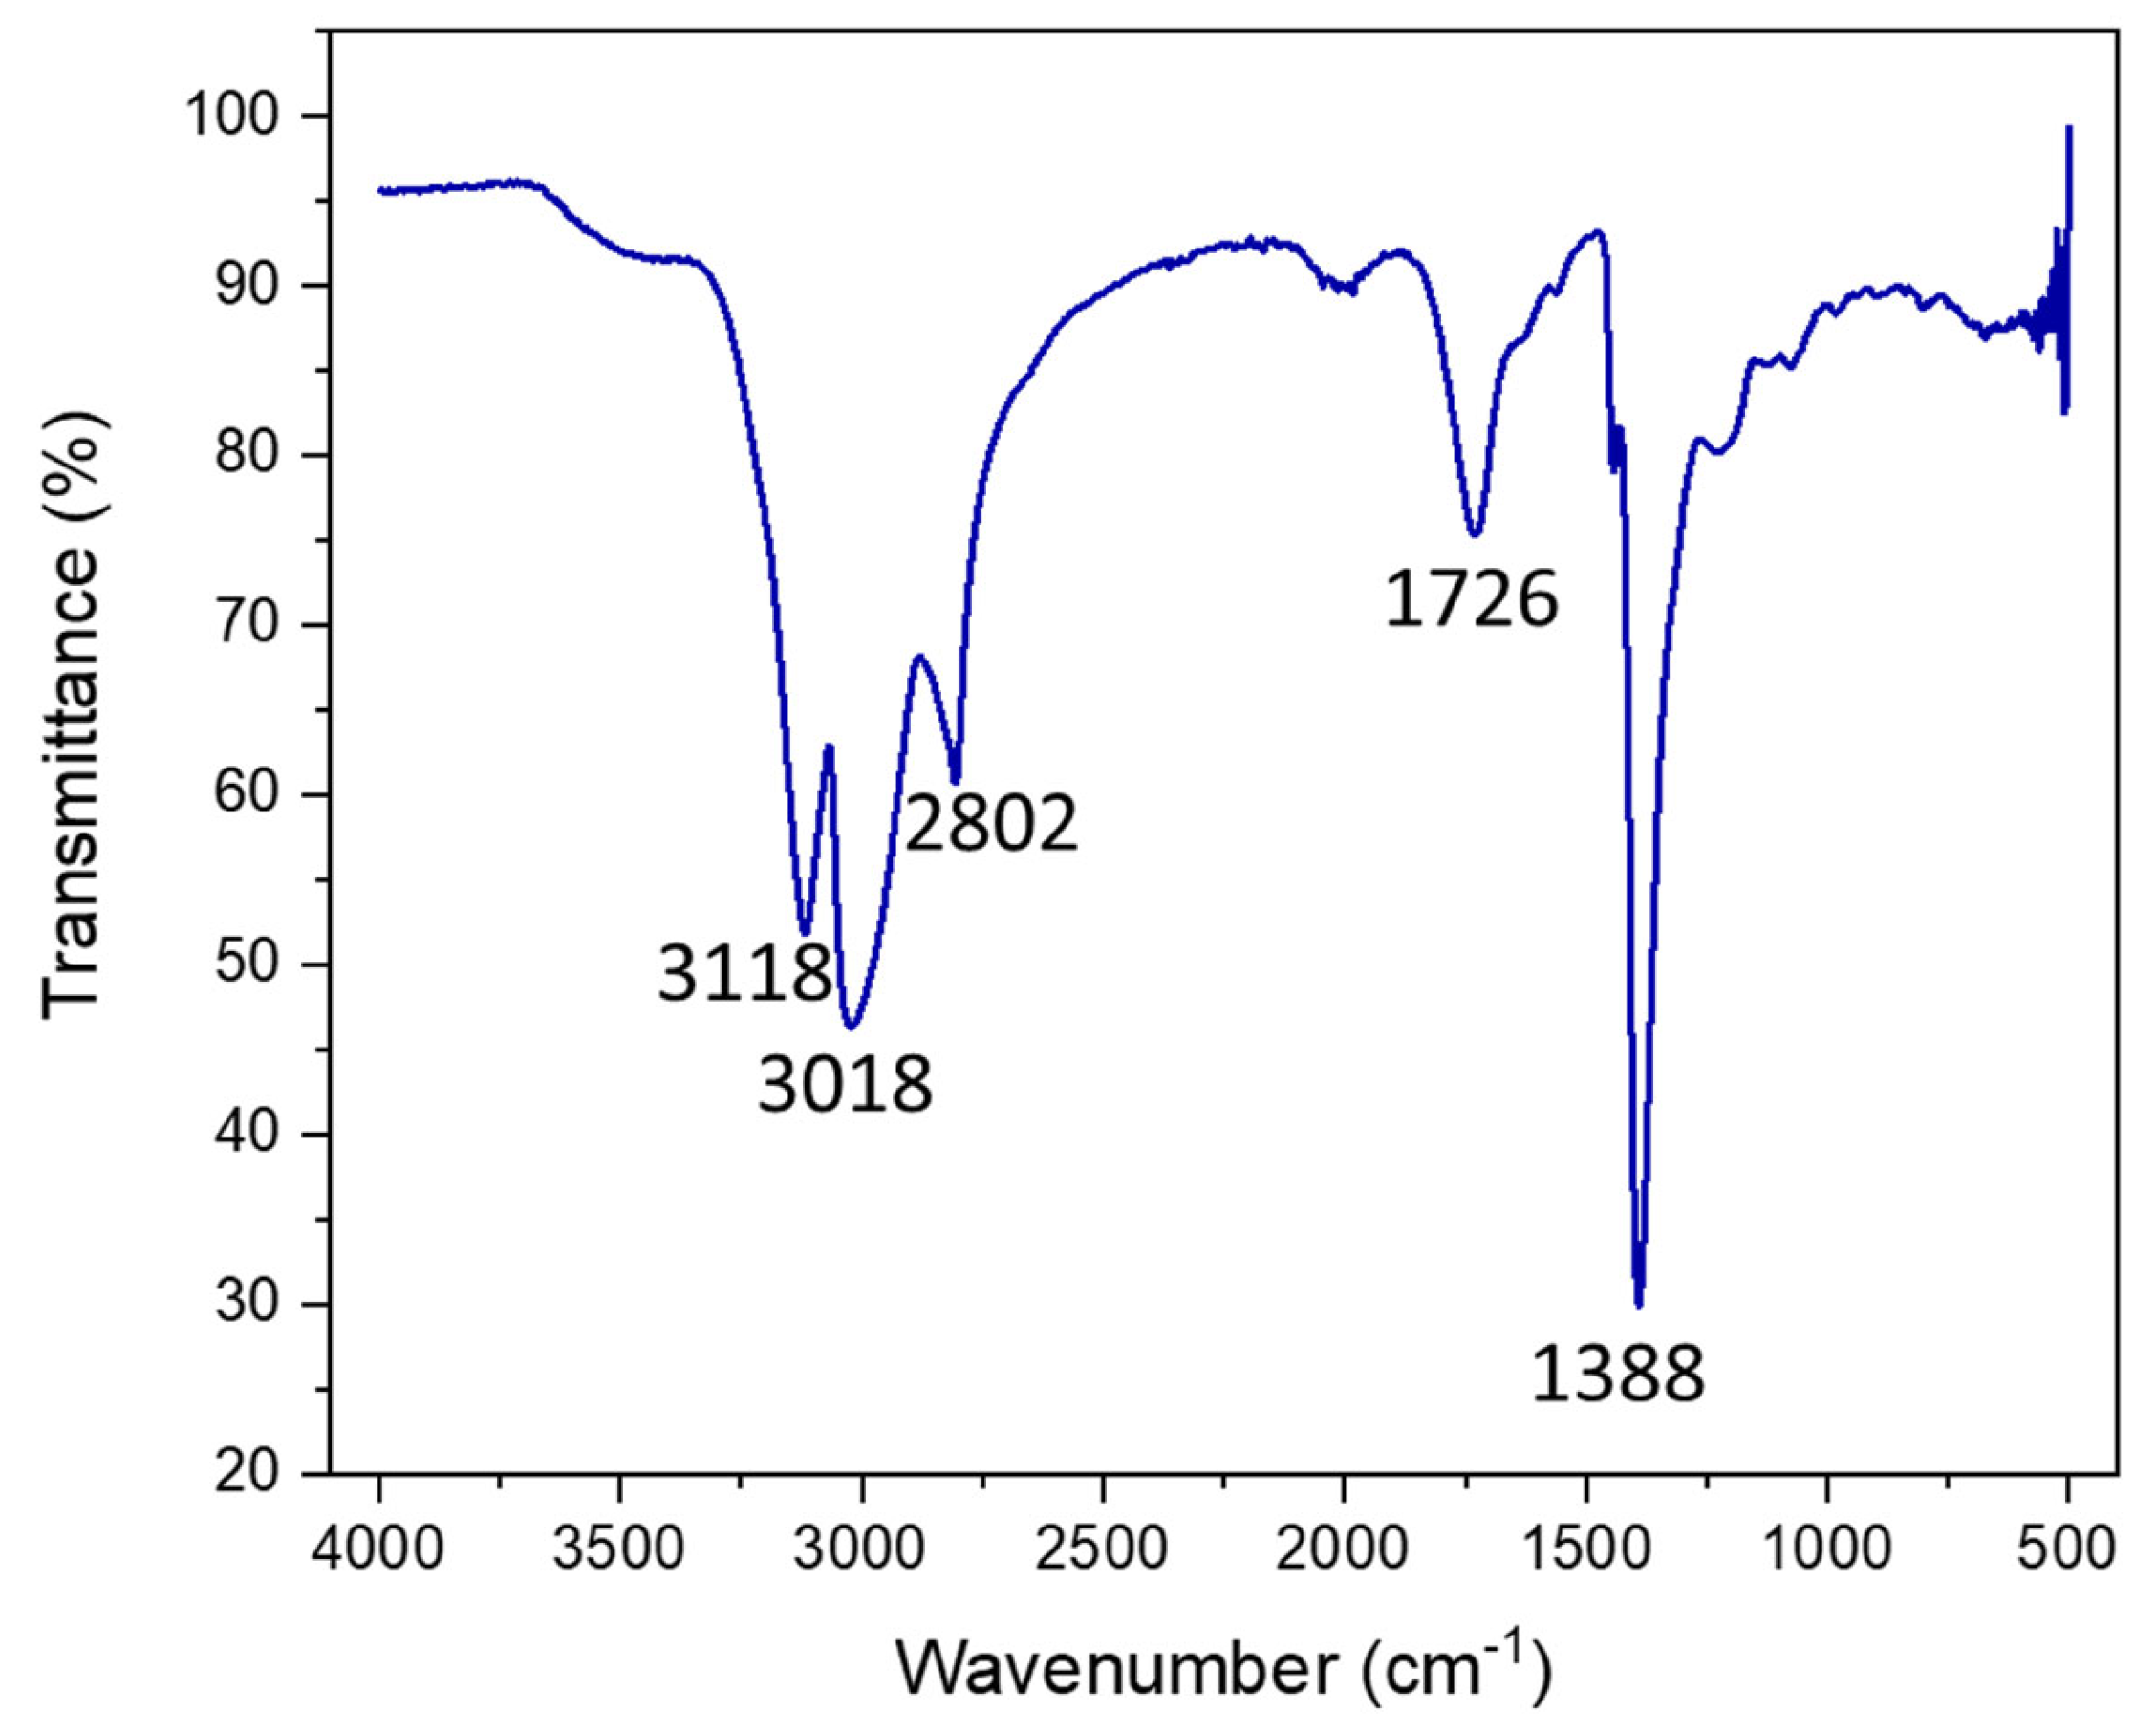
In order to support the XPS results and to confirm the presence of N inclusions and the carboxylic functionalization of the surface of CDs, the Fourier-Transform Infrared (FTIR) spectrum of the sample was recorded (Figure 3).
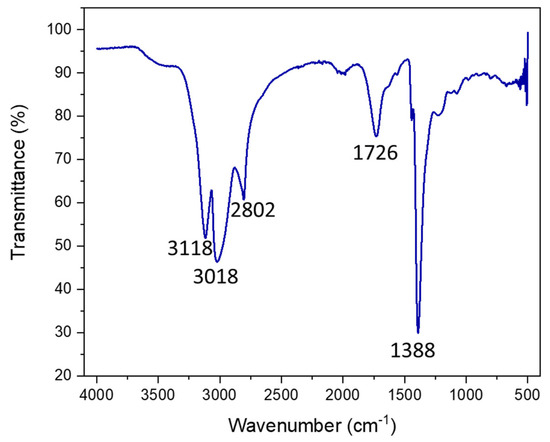
Figure 3.
FTIR of dialyzed and lyophilized N-CDs synthesized using 100 mg VOPO4 as the catalyst, 0.75 M of xylose as the C precursor, NH4Cl as the dopant, and 17 g/L of CH3COOH at 180 °C after 4 h of reaction. Before measurement, the N-CDs were dialyzed, purified, and lyophilized.
The IR spectrum presented five main bands, located at 3118 cm−1, 3018 cm−1, 2802 cm−1, 1726 cm−1, and 1388 cm−1. The bands that appeared at 3118 cm−1 and 3018 cm−1 corresponded to the N–H vibration bands [40,41,42] of the two N species present on the CDs, amine/pyrrolic N and graphitic N, respectively. On the other hand, the 2800 cm−1 band could be assigned to the vibration of the C–H bond and the 1388 cm−1 band to its corresponding bending band. The signal at 1726 cm−1 was associated with the C=O bond vibration band from carboxylic acids. Thus, this corroborated the XPS characterization data, as N was successfully included in the structure and functional groups, and the surfaces of the CDs were fully oxidized to carboxylic species.
2.1.2. Optical Properties of the CDs
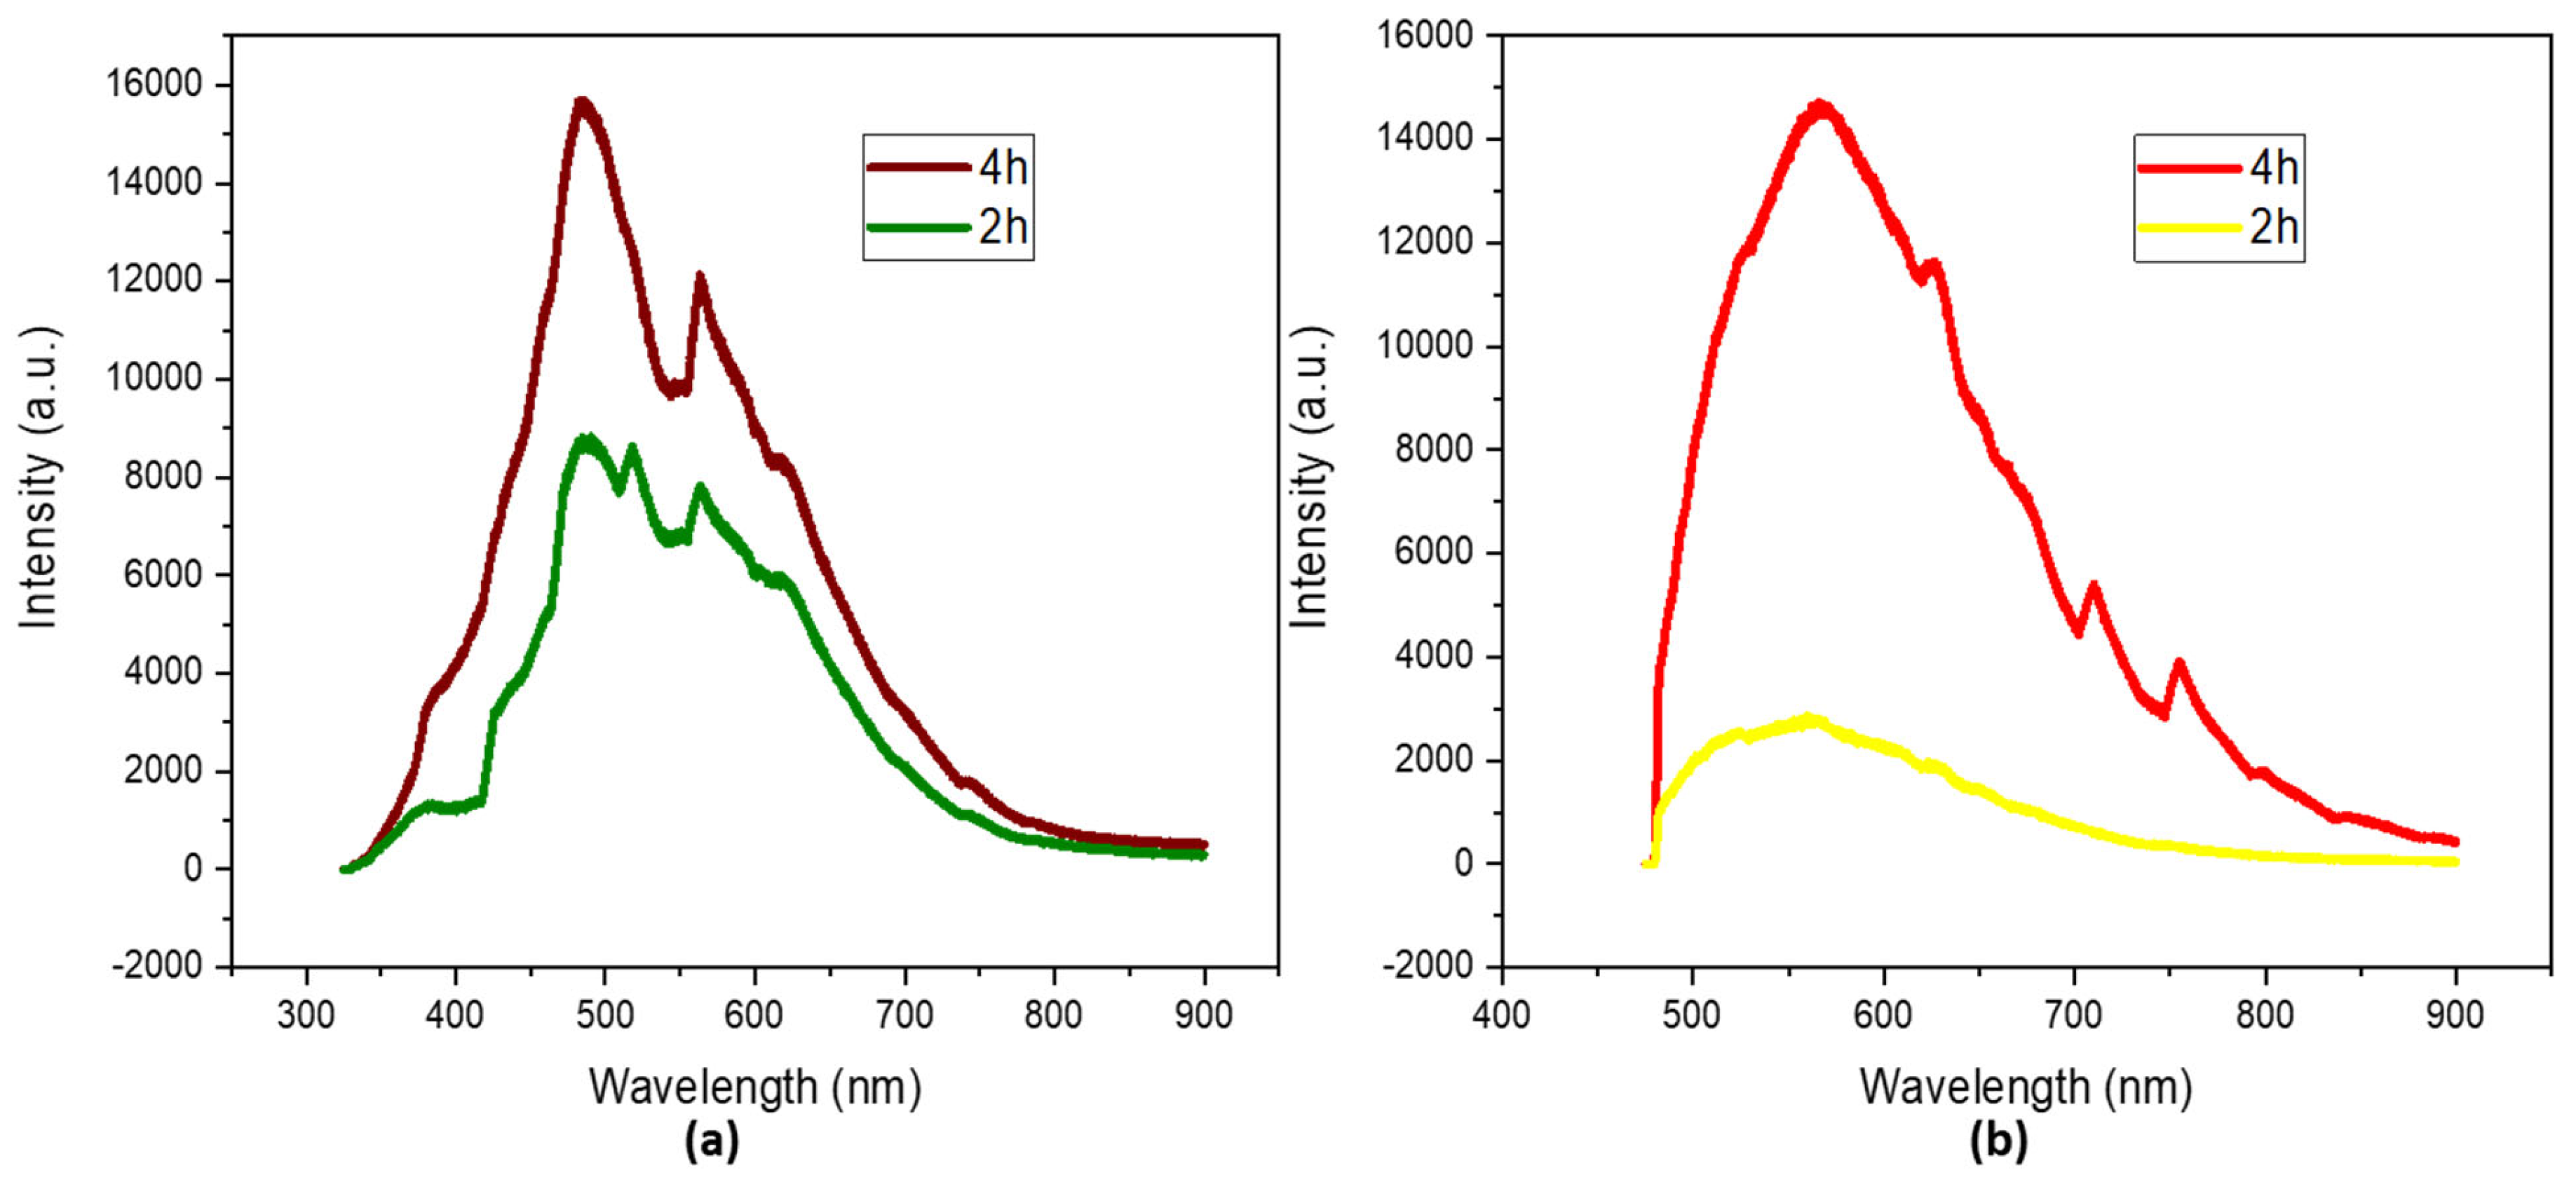
The photoluminescent properties were studied at two different wavelengths, 325 nm and 473 nm, in order to study the possibility of tuning their emission. There was a clear difference between the photoluminescence of the solution of N-CDs that was left for 2 h and that that was left for 4 h. The intensity of the spectrum doubled as time passed, indicating a higher concentration of species emissions [43]. Two maximums can be identified in the spectrum of N-CDs irradiated under 325 nm (Figure 4a) after 4 h at 484 and 563 nm; these can be associated with C–N-emitting species and O–C=O-emitting species, respectively [44].
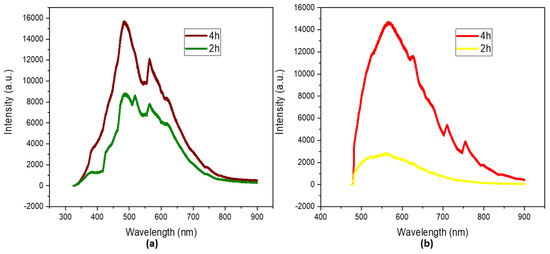
Figure 4.
Photoluminescence spectra under (a) 325 nm (b) 473 nm irradiation of dialyzed solutions of N−CDs synthesized from 100 mg VOPO4 as the catalyst, 0.75 M of xylose as the precursor, NH4Cl as the dopant, and 17 g/L of CH3COOH at 180 °C after 4 h of reaction. No dilution was performed prior to the analysis.
A third emission at 518 nm can be observed for the spectrum of the N-CDs after 2 h of reaction. This emission can be attributed to an intermediate species of C–O/C=O; after another 2 h, it fully oxidized into O–C=O.
When the N-CDs were irradiated under 473 nm (Figure 4b), the intensity of the spectra was lower, as a less energetic laser was used. two major contributions can be identified, at 566 nm and 625 nm, which can be associated with the formerly mentioned species. They suffered bathochromic shifts of 82 and 62 nm, respectively, proving the tunable photoluminescence properties of N-CDs [45,46,47].
The QY and fluorescence lifetime were also measured for both N-CDs, resulting in QYs of 2.3% when the synthesis lasted 2 h and 6.2% when it was left for 4 h. Fluorescence lifetimes of 2.59 ns for N-CDs and 3.04 ns for N-CDs were also observed when the reaction time was set at 2 h and when the reaction was maintained for 4 h.
2.1.3. Photostability Tests
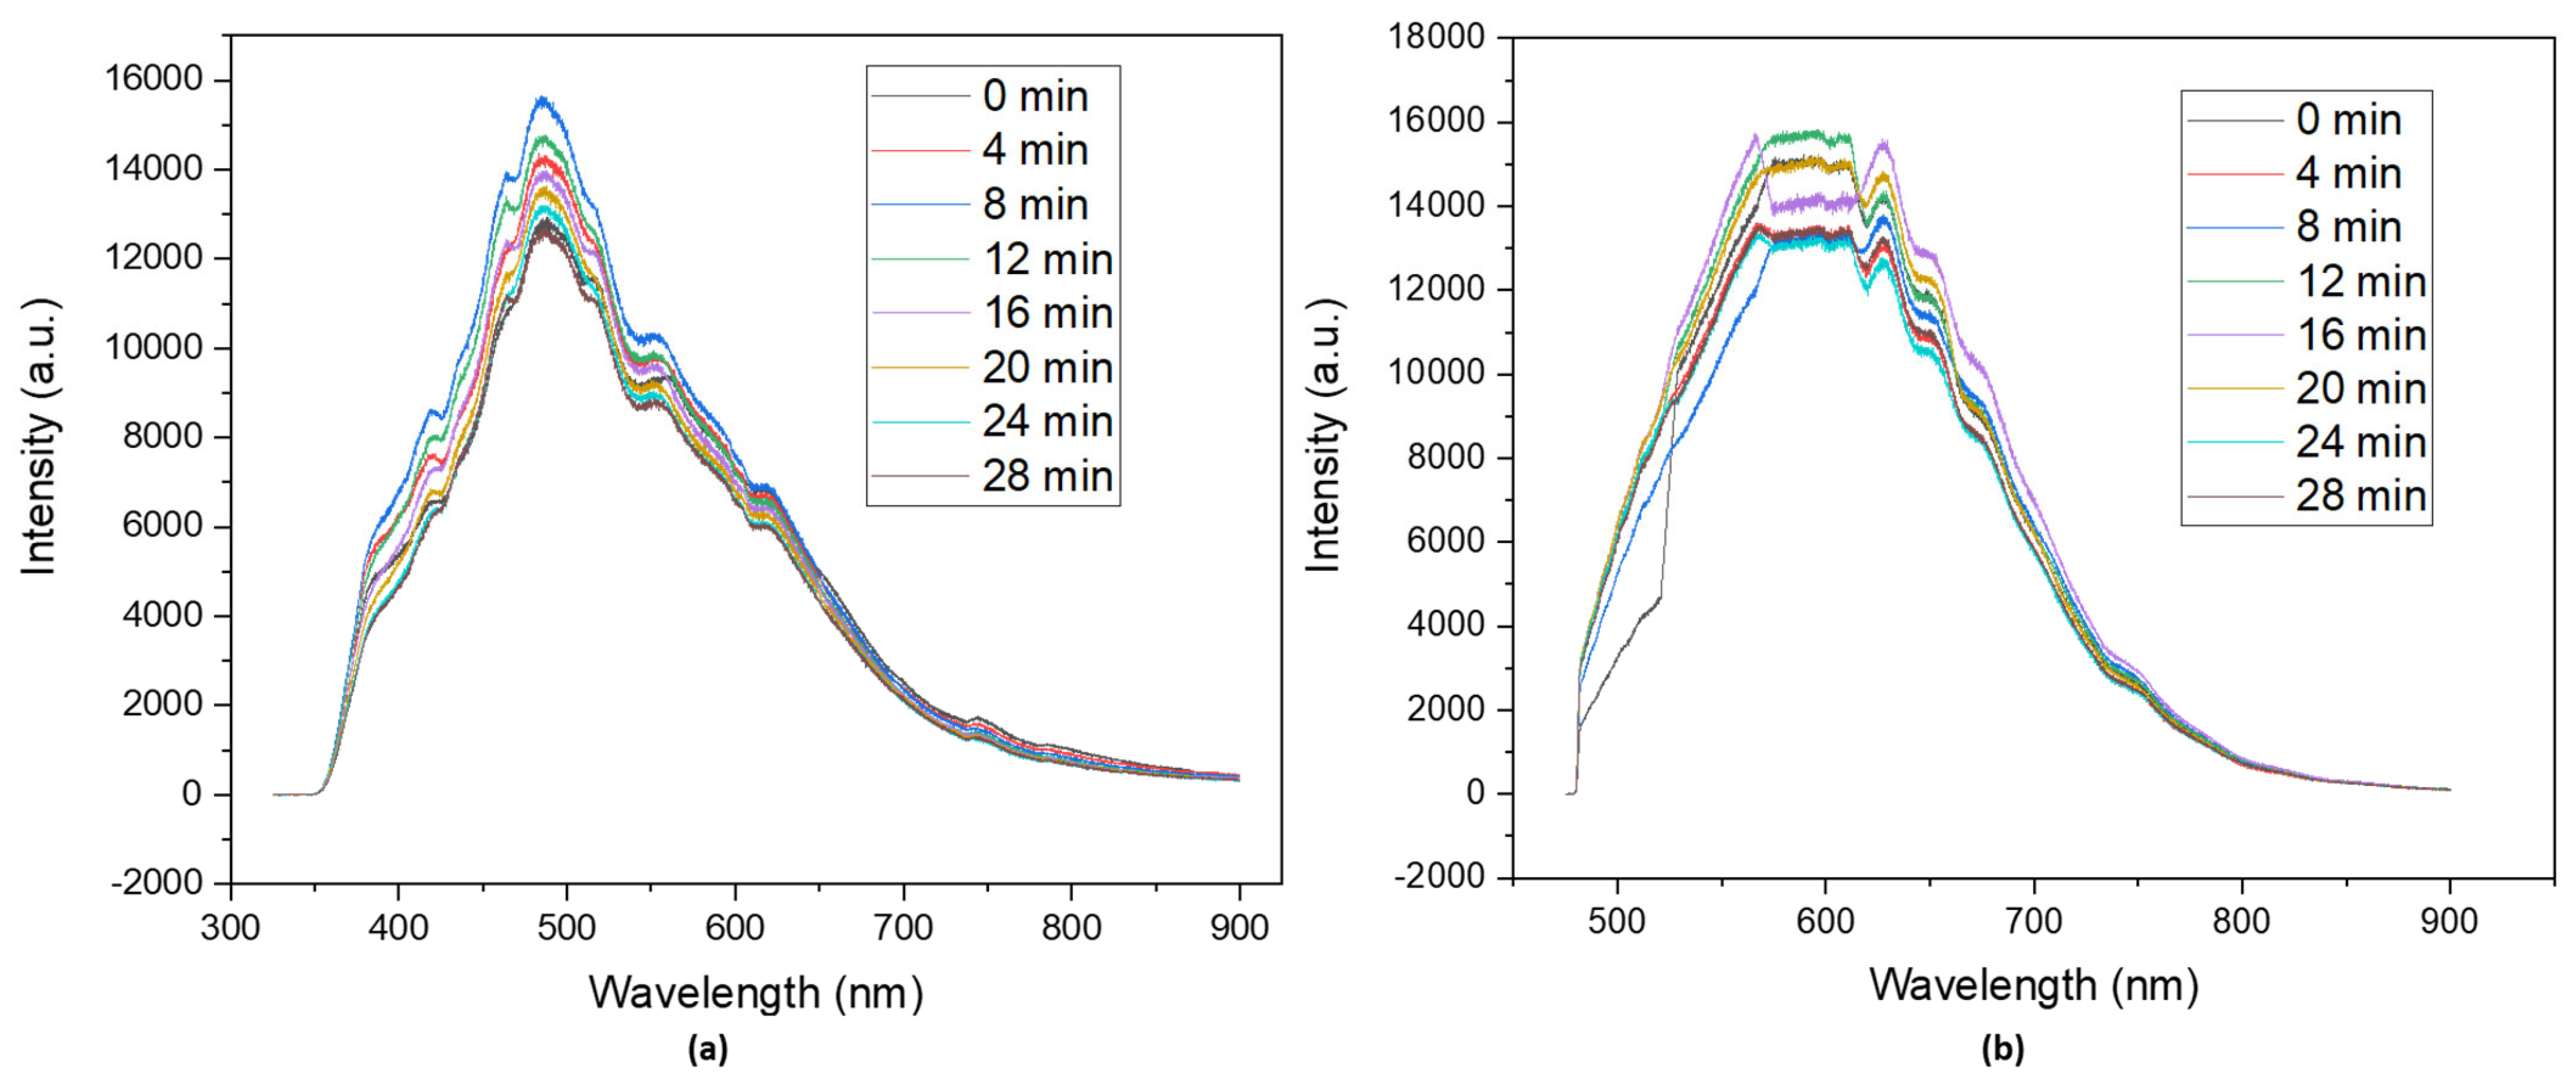
Since the designated application for CDs is to work as photocatalysts, it becomes clear that photostability is a key parameter that confirms whether N-CDs are suitable for a photocatalysis reaction. The photostability tests were carried out in the same conditions as the photoluminescence measurements, changing only the exposure time. Samples for photoluminescence typically undergo a 2 min exposure time in order for the spectra to be recorded. During photostability assays, the solutions were irradiated for 28 min, and spectra were recorded every 2 min. During this time, there was a slight variation in intensity (Figure 5) in the spectra of both lasers, but it was not significant enough to consider the samples unstable in the selected conditions for the photocatalytic tests.
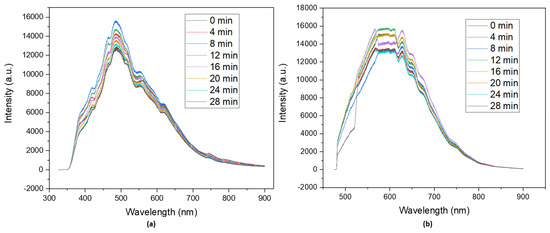
Figure 5.
Photostability tests of dialyzed solutions of N−CDs using 100 mg of VOPO4 as the catalyst, 0.75 M of xylose as the precursor, NH4Cl as the dopant, and 17 g/L of CH3COOH at 180 °C after 4 h of reaction under (a) a 325 nm irradiation laser and (b) a 473 nm irradiation laser. No dilution was performed prior to the analysis.
2.2. Catalyst Recovery, Recycling, and Regeneration
After 4 h of reaction, the catalyst was recovered, calcined to eliminate the organic matter over its surface, and re-assayed for several catalytic runs. The catalyst also underwent a regeneration step, at which point it was decided that its catalytic performance had excessively decreased. The changes in the active surface of the catalyst were followed by XPS (Figures S7–S10, Tables S1 and S2).
2.2.1. Recycling Tests
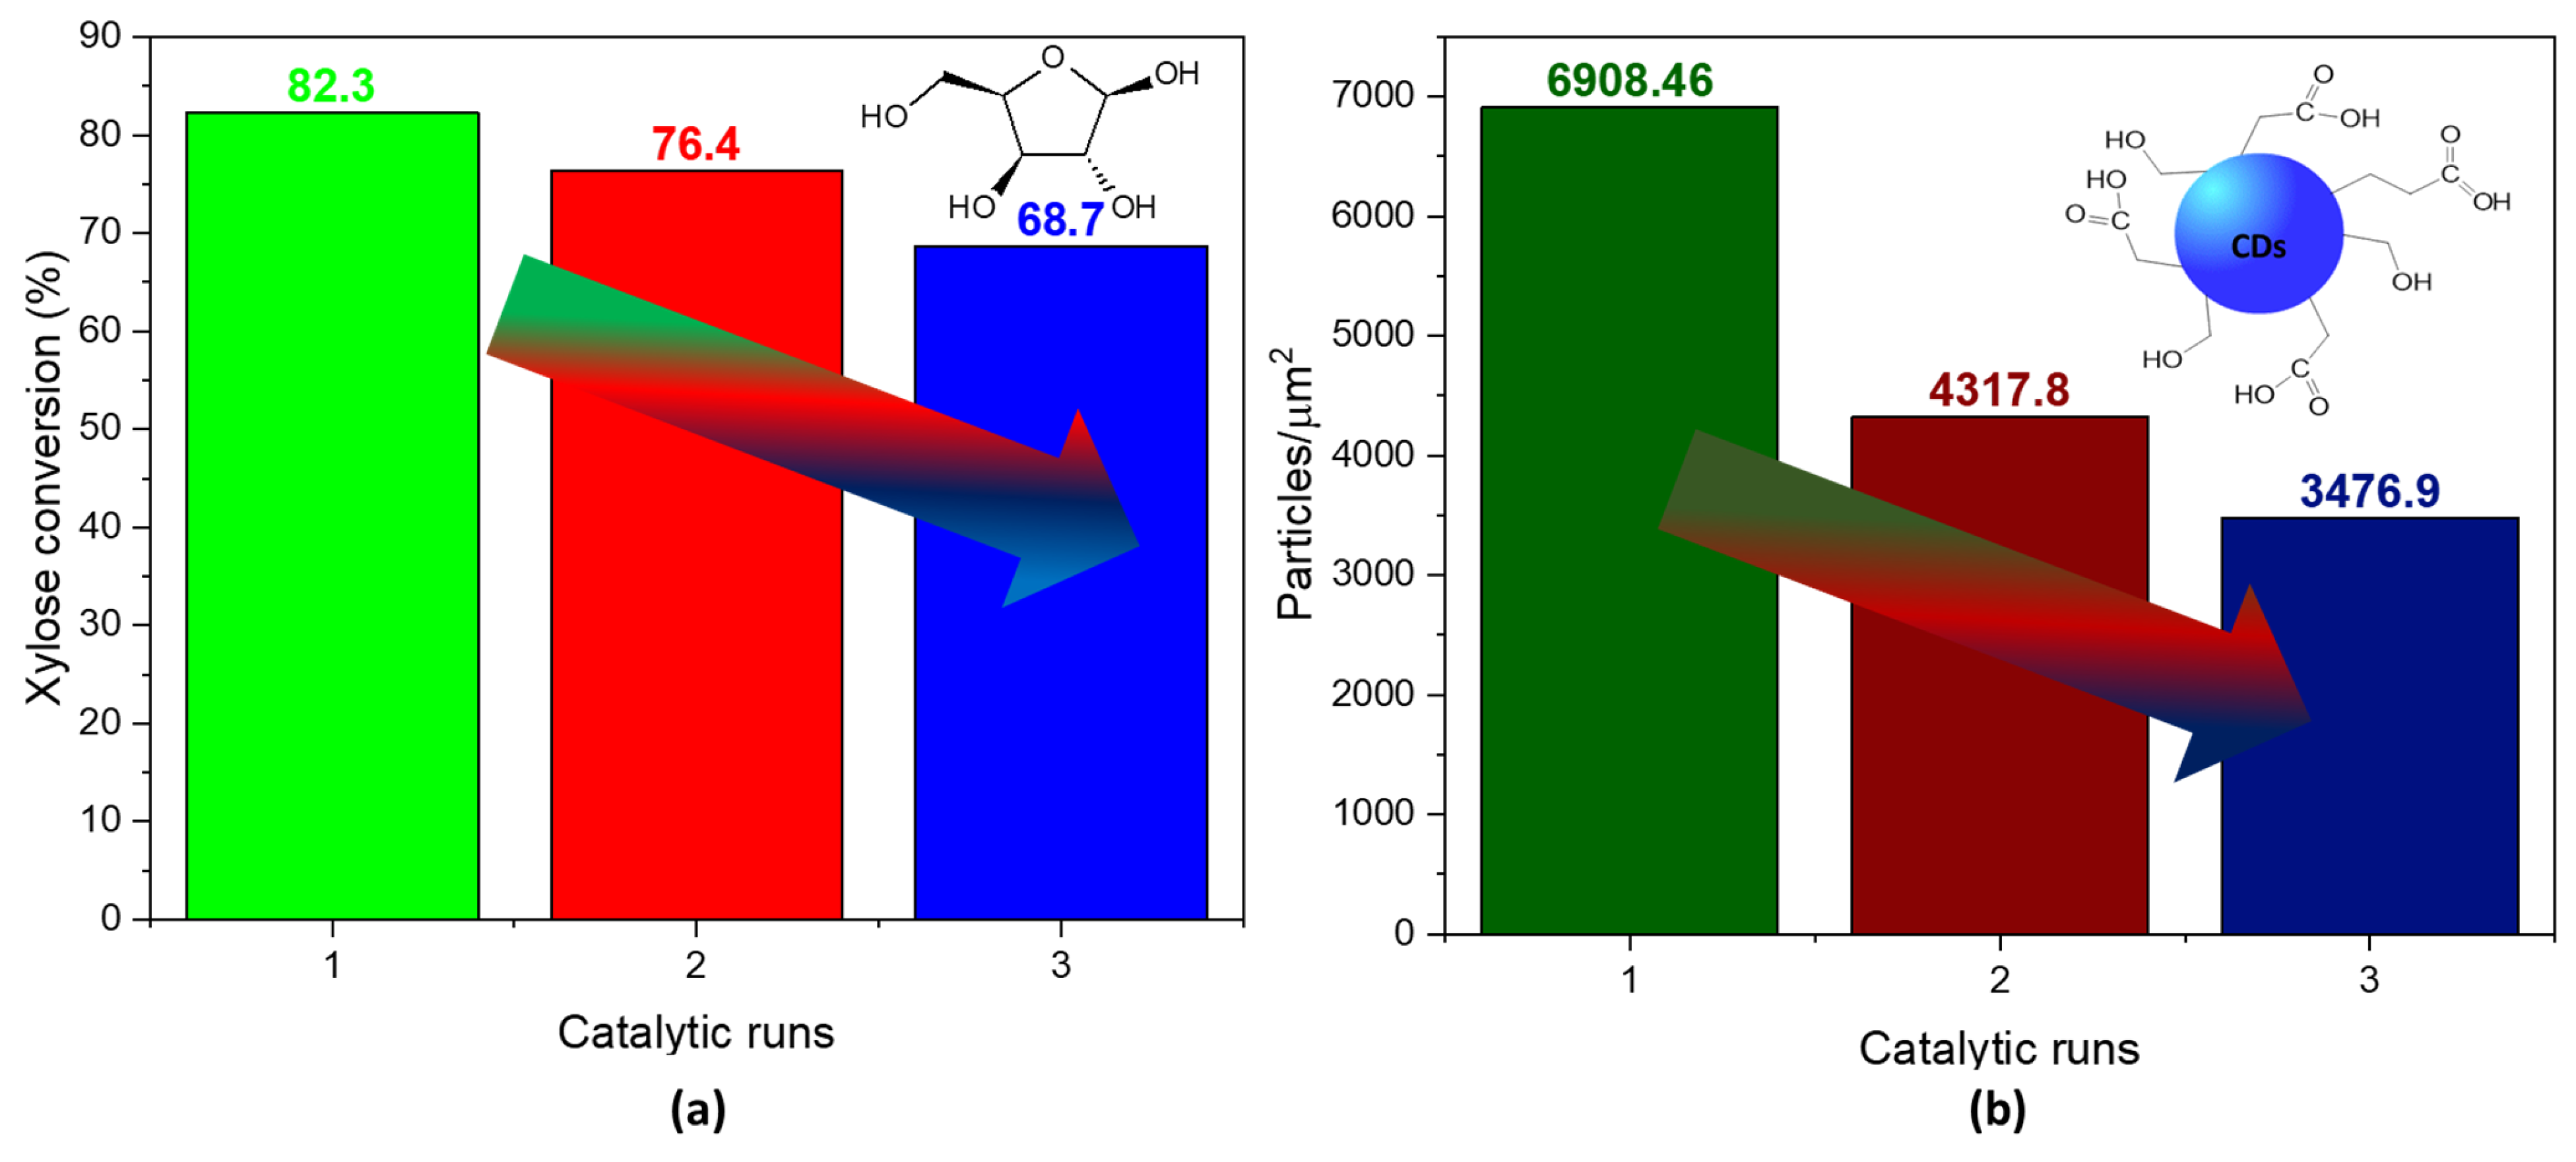
After three reaction cycles, the conversion did not suffer an alarming decrease in the conversion of xylose (Figure 6a). However, the presence of particles per squared micrometer dropped substantially with every cycle, suggesting that the catalyst’s selectivity to N-CDs diminished as it was used in the reaction (Figure 6b). A possible reason for the decrease in the number of CD particles could be attributed to the presence of carbonaceous species adsorbed on the catalyst surface (Table S1), as shown by the increase in the atomic concentration of C after the reaction. Since no reactivation procedure was conducted between each catalytic run, these species may have been blocking the acid sites necessary for the dehydration reactions. Additionally, a partial reduction in V(V) was observed after the reaction (Table S2), indicating a potential decrease in the acidity of the catalyst. This reduction in acidity can be attributed to the fact that V(V) is more acidic than V(IV), providing a clue to the mechanism behind the observed changes.
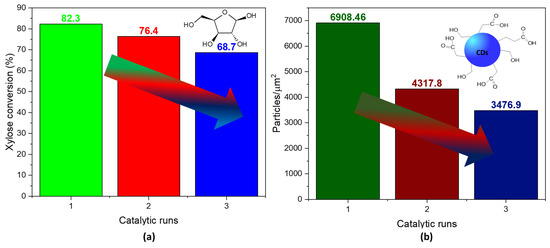
Figure 6.
(a) Conversion of xylose in N-CDs solution samples after three catalytic runs of the VOPO4 catalyst. (b) Particle density per squared micrometer in N-CDs dialyzed solutions after 4 h of reaction time. No dilution was performed prior to the analysis.
In the bottom-up mechanism of CD synthesis, the role of the VOPO4 catalyst was firstly to promote the dehydration of the xylose to furfural, which afterwards aggregated into higher structures that carbonized into N-CDs [43,48]. Secondly, the catalyst was able to oxidize the surfaces of the N-CDs. However, both the xylose and acetic acid dissolved in the reaction medium can act as reducing agents, promoting the rapid reduction of V(V) to V(IV), as confirmed via XPS (Table S2, before reaction). This partial reduction of vanadium could lead to leaching of the vanadium species, as it is a much more soluble species, especially in acidic media. Therefore, in order to avoid any contamination of the N-CDs with vanadium species, a purification step of the N-CDs was carried out. Thus, the pH was lowered to 2 after a reaction using a citrate/citric acid to ensure the protonation of the acidic groups on the surfaces of the N-CDs so they would not interact in any way with vanadium species such as VO2+ or VO2+. After the purification of the N-CDs by means of dialysis, the presence of vanadium in the sample inside the dialysis tube was analyzed via ICP-MS (Table S3), confirming, along with the absence of vanadium in the XPS survey spectra of the N-CDs (Figure S11), that whether the reaction lasted 2 h or 4 h, the purification method was effective, as no significant quantities of V were detected on the samples of the N-CDs solutions.
2.2.2. Regeneration Tests
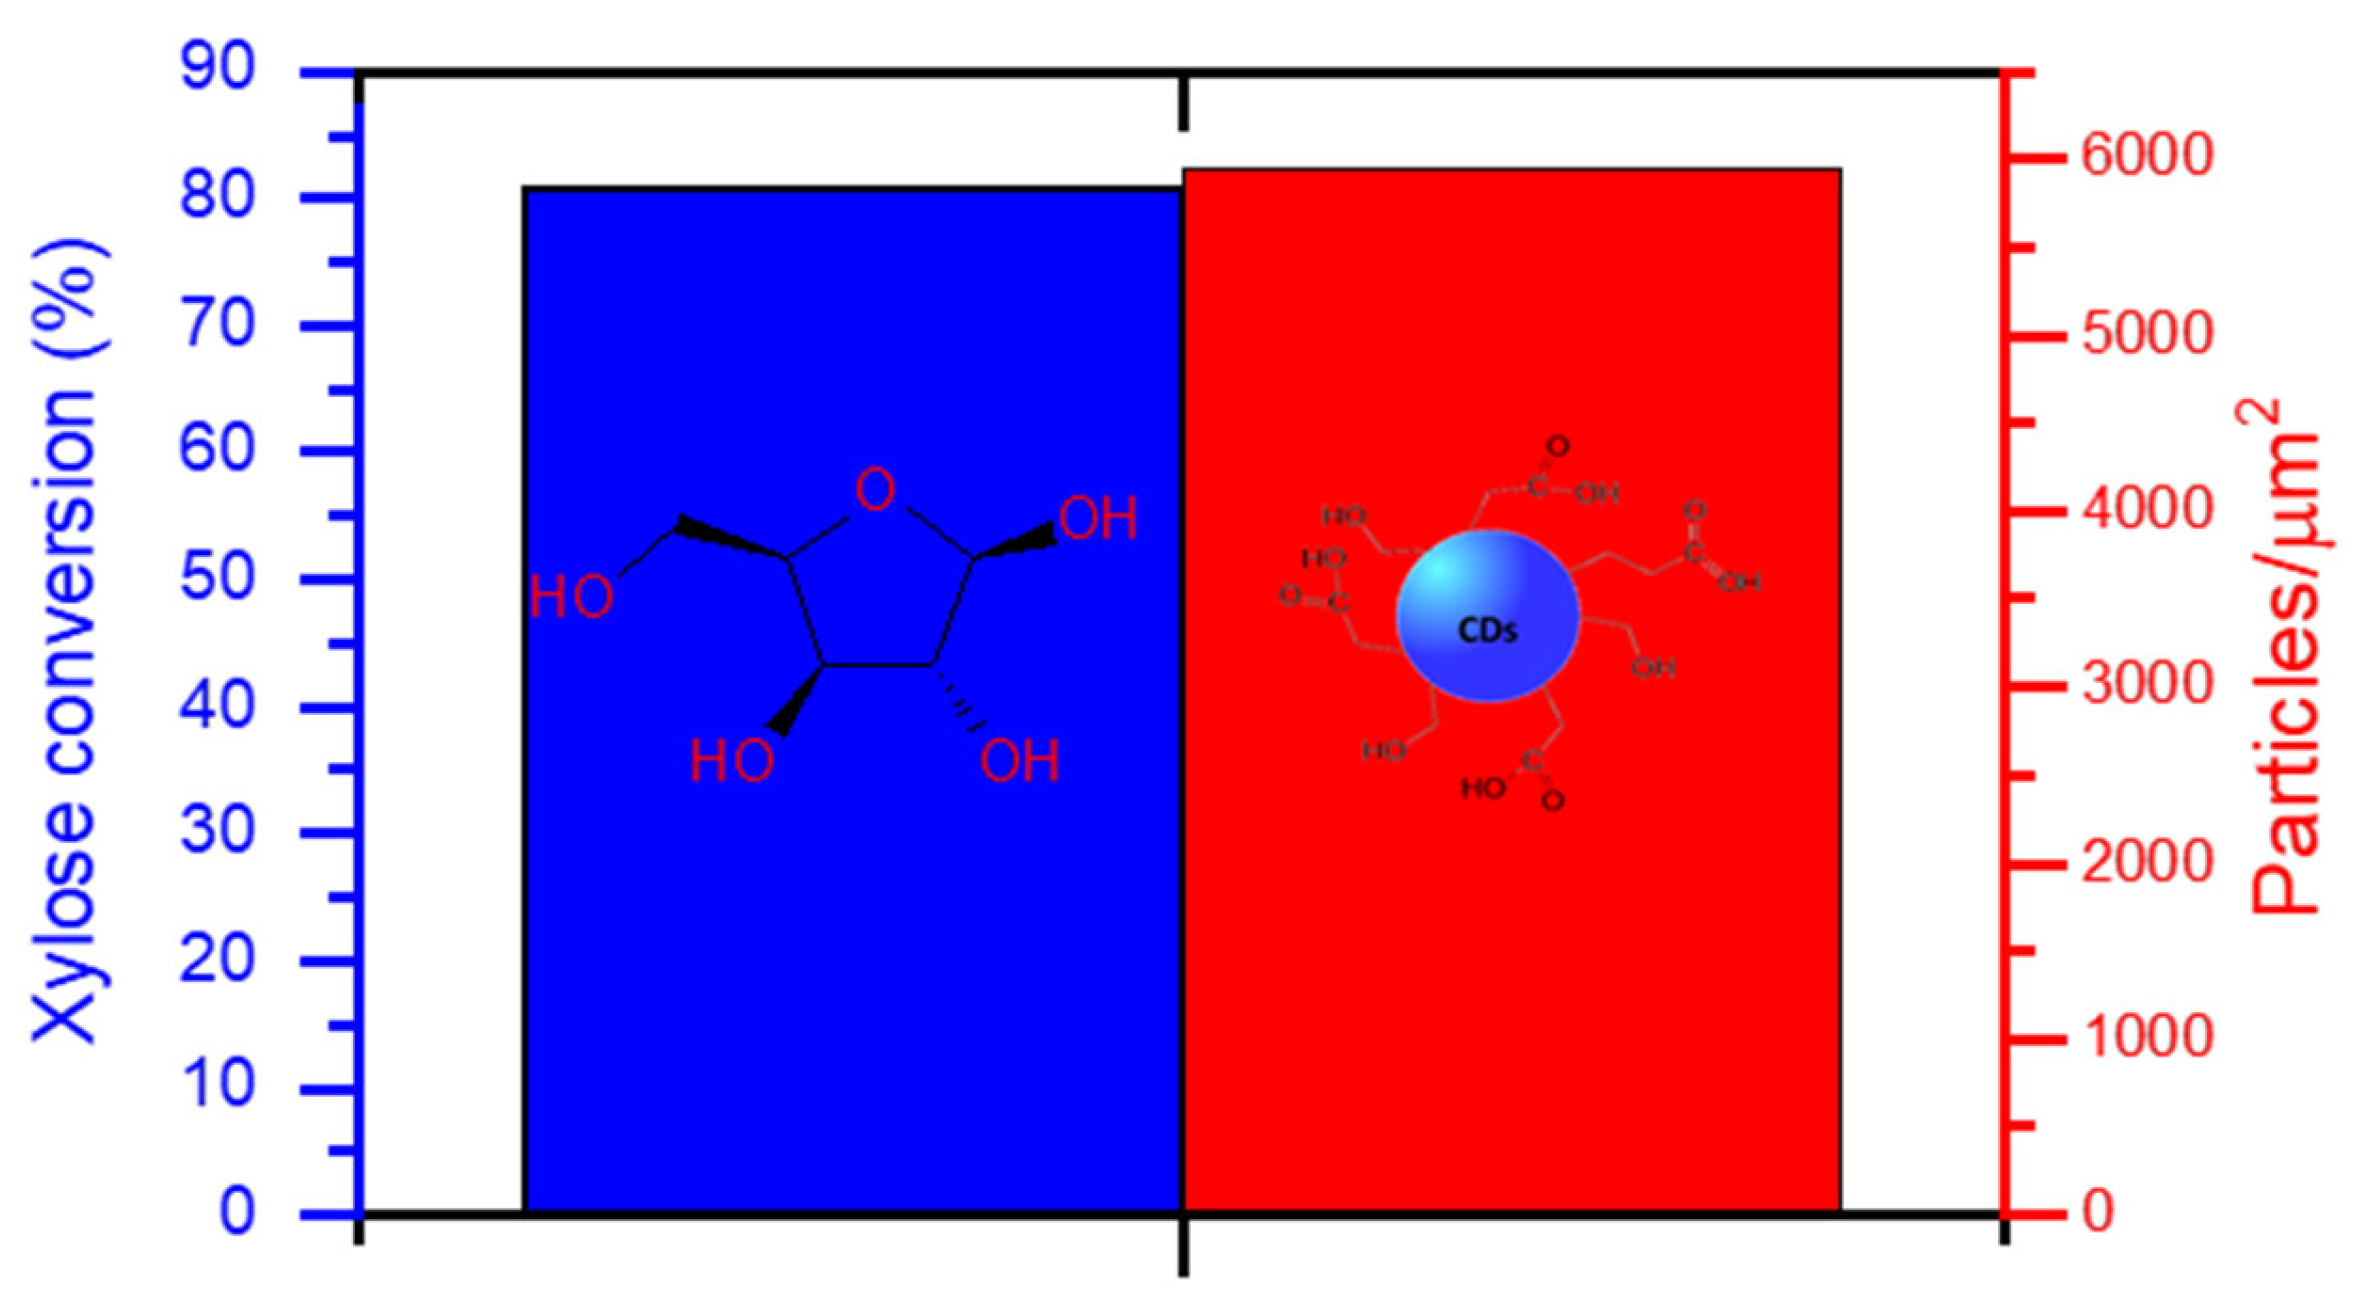
After heating the used catalyst at 500 °C for the regeneration procedure, it was assayed for another catalytic run (Figure 7). The conversion of xylose attained in this new cycle was nearly the same as that obtained during the first catalytic run of the catalyst (blue bar). Nevertheless, this did not translate exactly into the same catalytic activity, as the ratio of particles per micrometer (red bar) achieved after the regeneration was higher than that obtained after the first recycling, but lower than the ratio reached when the catalyst was added fresh (Figure 7b). This can be attributed, again, to a partial blockage of the acidic sites due to residual carbonaceous species. Since, after regeneration, there is a reoxidation of V(IV) to V(V) a change in conversion or activity would not be due to a lack of V(V) species.
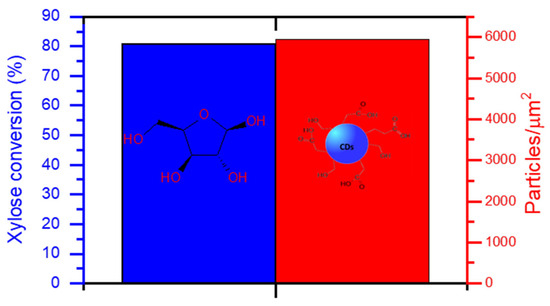
Figure 7.
Conversion of xylose after the regeneration of the VOPO4 catalyst and particle density per squared micrometer in N-CDs dialyzed solutions after 4 h of reaction time. No dilution was performed prior to the analysis.
2.3. Photocatalytic Assay
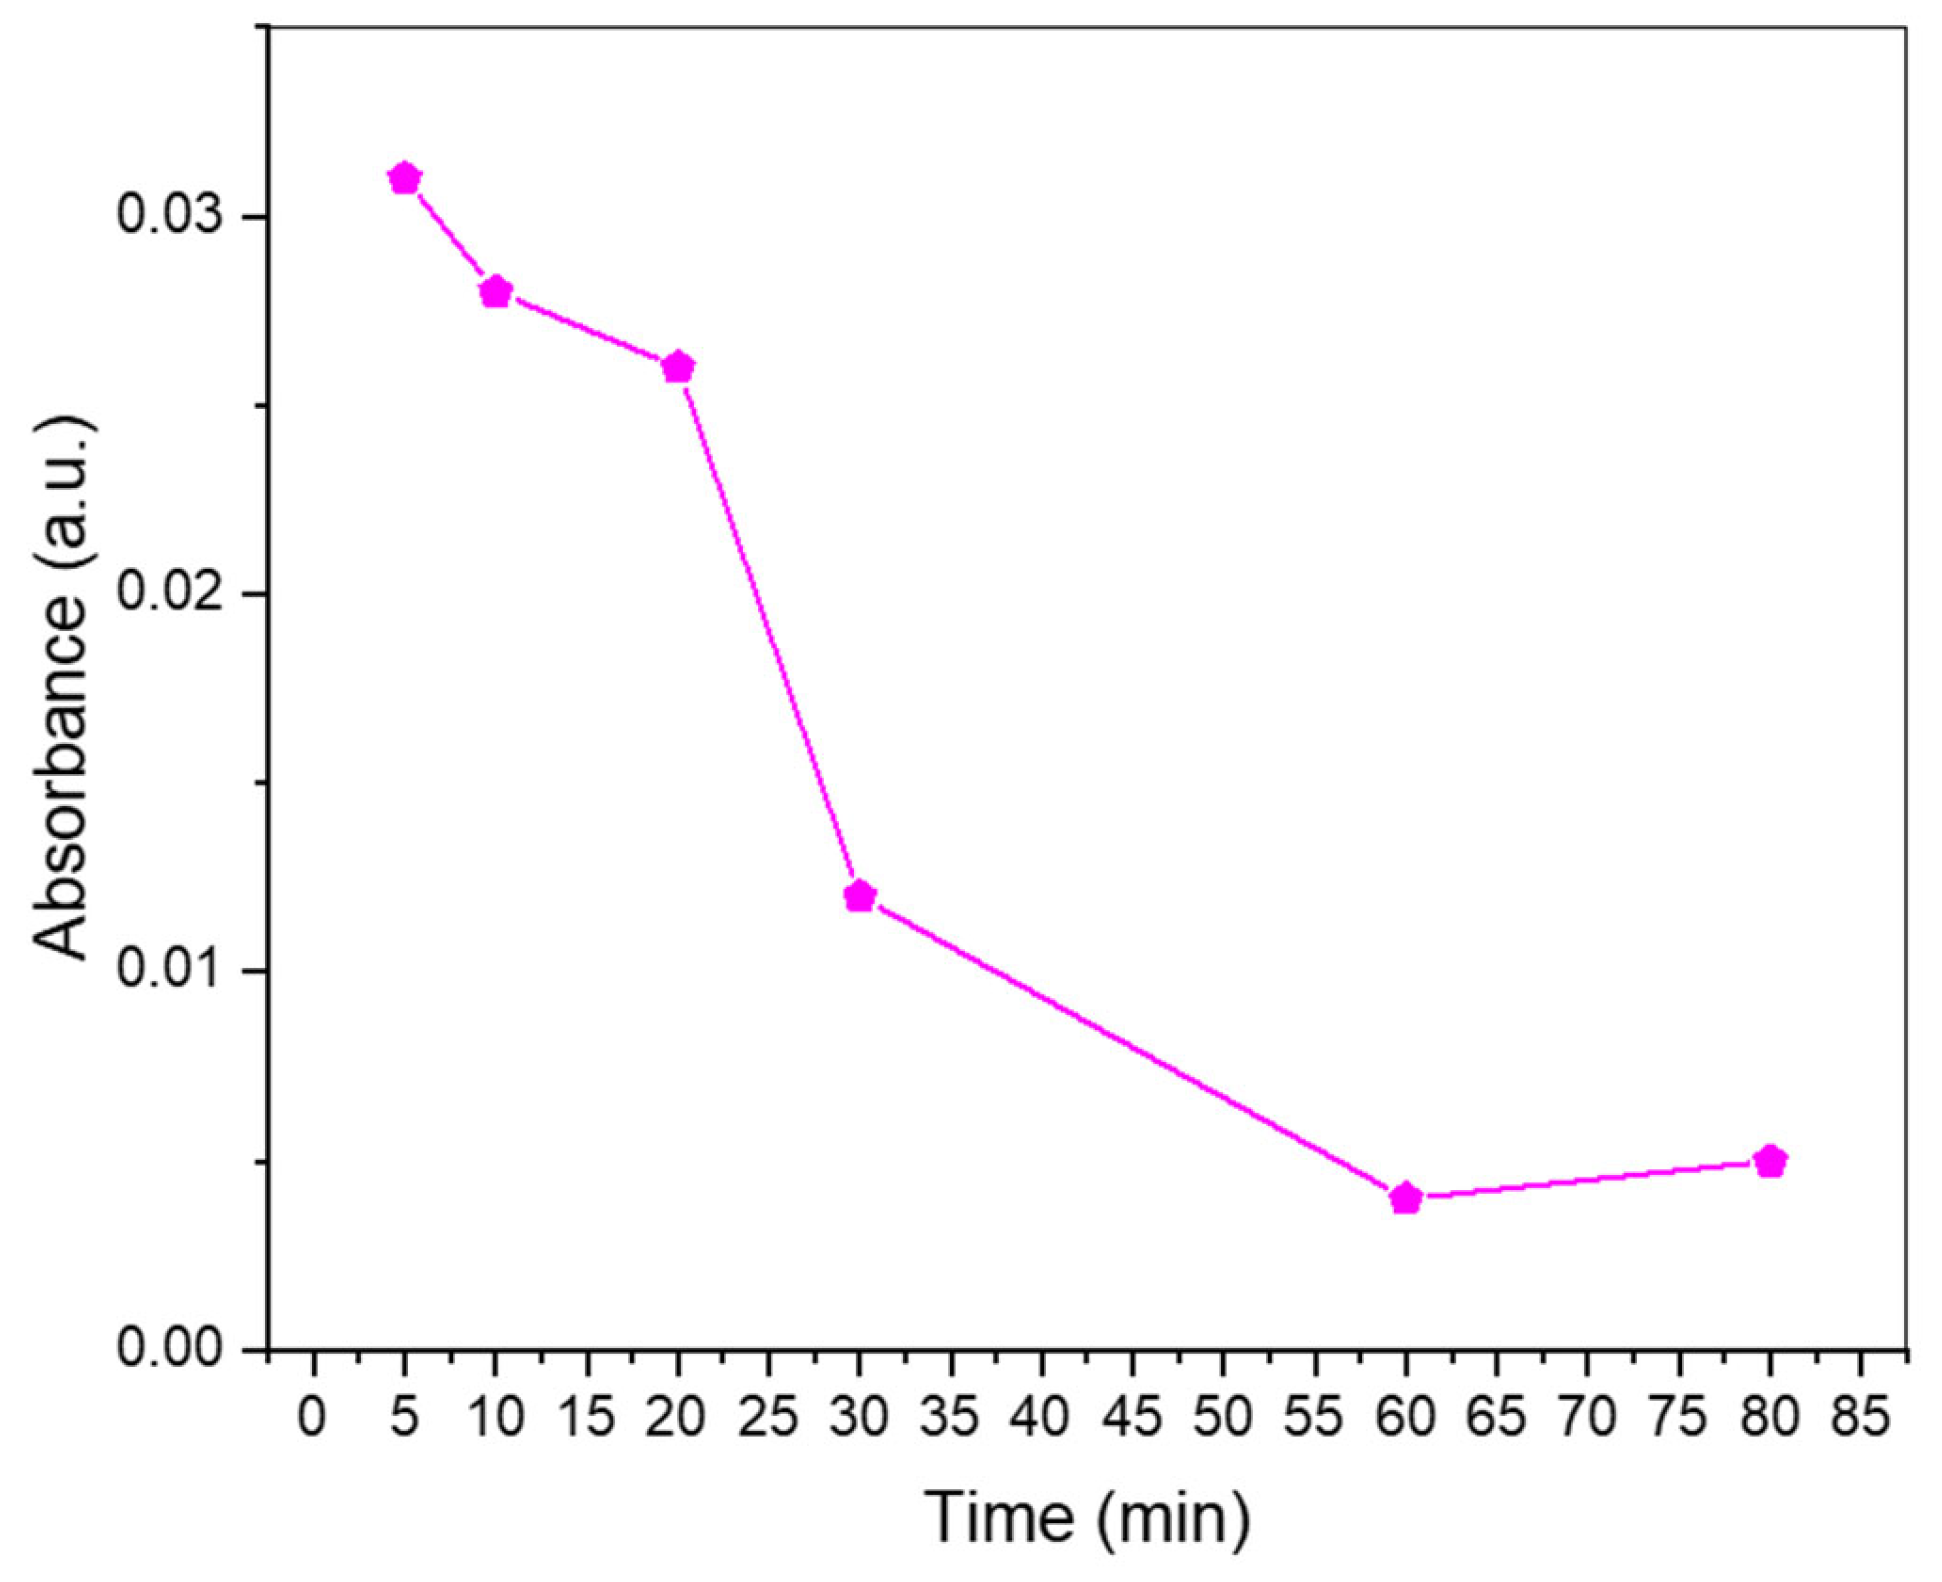
Since the photoluminescence measurements revealed that the synthesized N-CDs had good photoelectronic potential, meaning that their surface properties would be optimal for electronic transfer and movement, it was decided to test their activity as catalysts in the photodegradation of methyl orange (MO) (Figure 8). The assay was performed under visible light. During the first 20 min of the reaction, the degradation was moderate, but after 30 min, the absorbance observed in the UV-Vis had greatly diminished. By the time the hour of reaction was reached, nearly no absorbance was detected, meaning that the CDs had effectively promoted the degradation of the colorant. The UV-vis absorbance spectrum of N-CDs was measured in order to ensure that no secondary absorbance to MO absorbance was taking place (Figure S12).
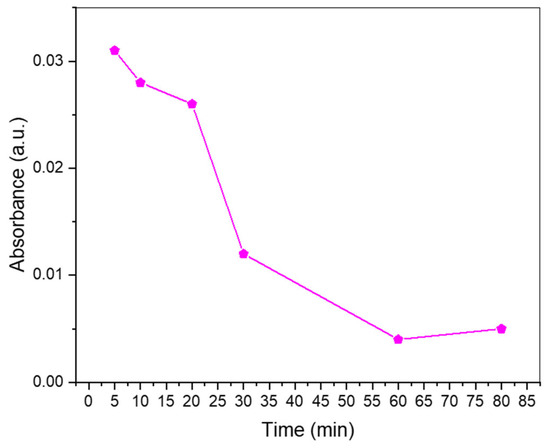
Figure 8.
Photodegradation of methyl orange over time using 50 mg of N-CDs as the catalyst on an aqueous solution of 5 ppm of methyl orange.
3. Materials and Methods
3.1. Materials
Vanadium (V) oxide (V2O5) (>99.6%) and NH4Cl (>99.5%) were purchased from Sigma-Aldrich. Orthophosphoric (H3PO4) (>85%) and nitric acid (HNO3) (>65%) were purchased from Panreac (Barcelone, Spain) and VWR (Radnor, PA, USA). Xylose (>98%) was purchased from Millipore (Burlington, MA, USA).
3.2. VOPO4 Catalyst Synthesis
Briefly, the VOPO4 preparation was based on a previous existing method [49], in which 1.93 g of V2O5 is magnetically stirred along with 10.5 mL of H3PO4, 22 mL of water, and 2 mL of concentrated HNO3. The resulting suspension is kept for 2 h at 105 °C in reflux until the yellow precipitate is completely formed. Then, the vibrant yellow solid is filtered and left to dry in the stove overnight at 60 °C.
3.3. CDs Preparation
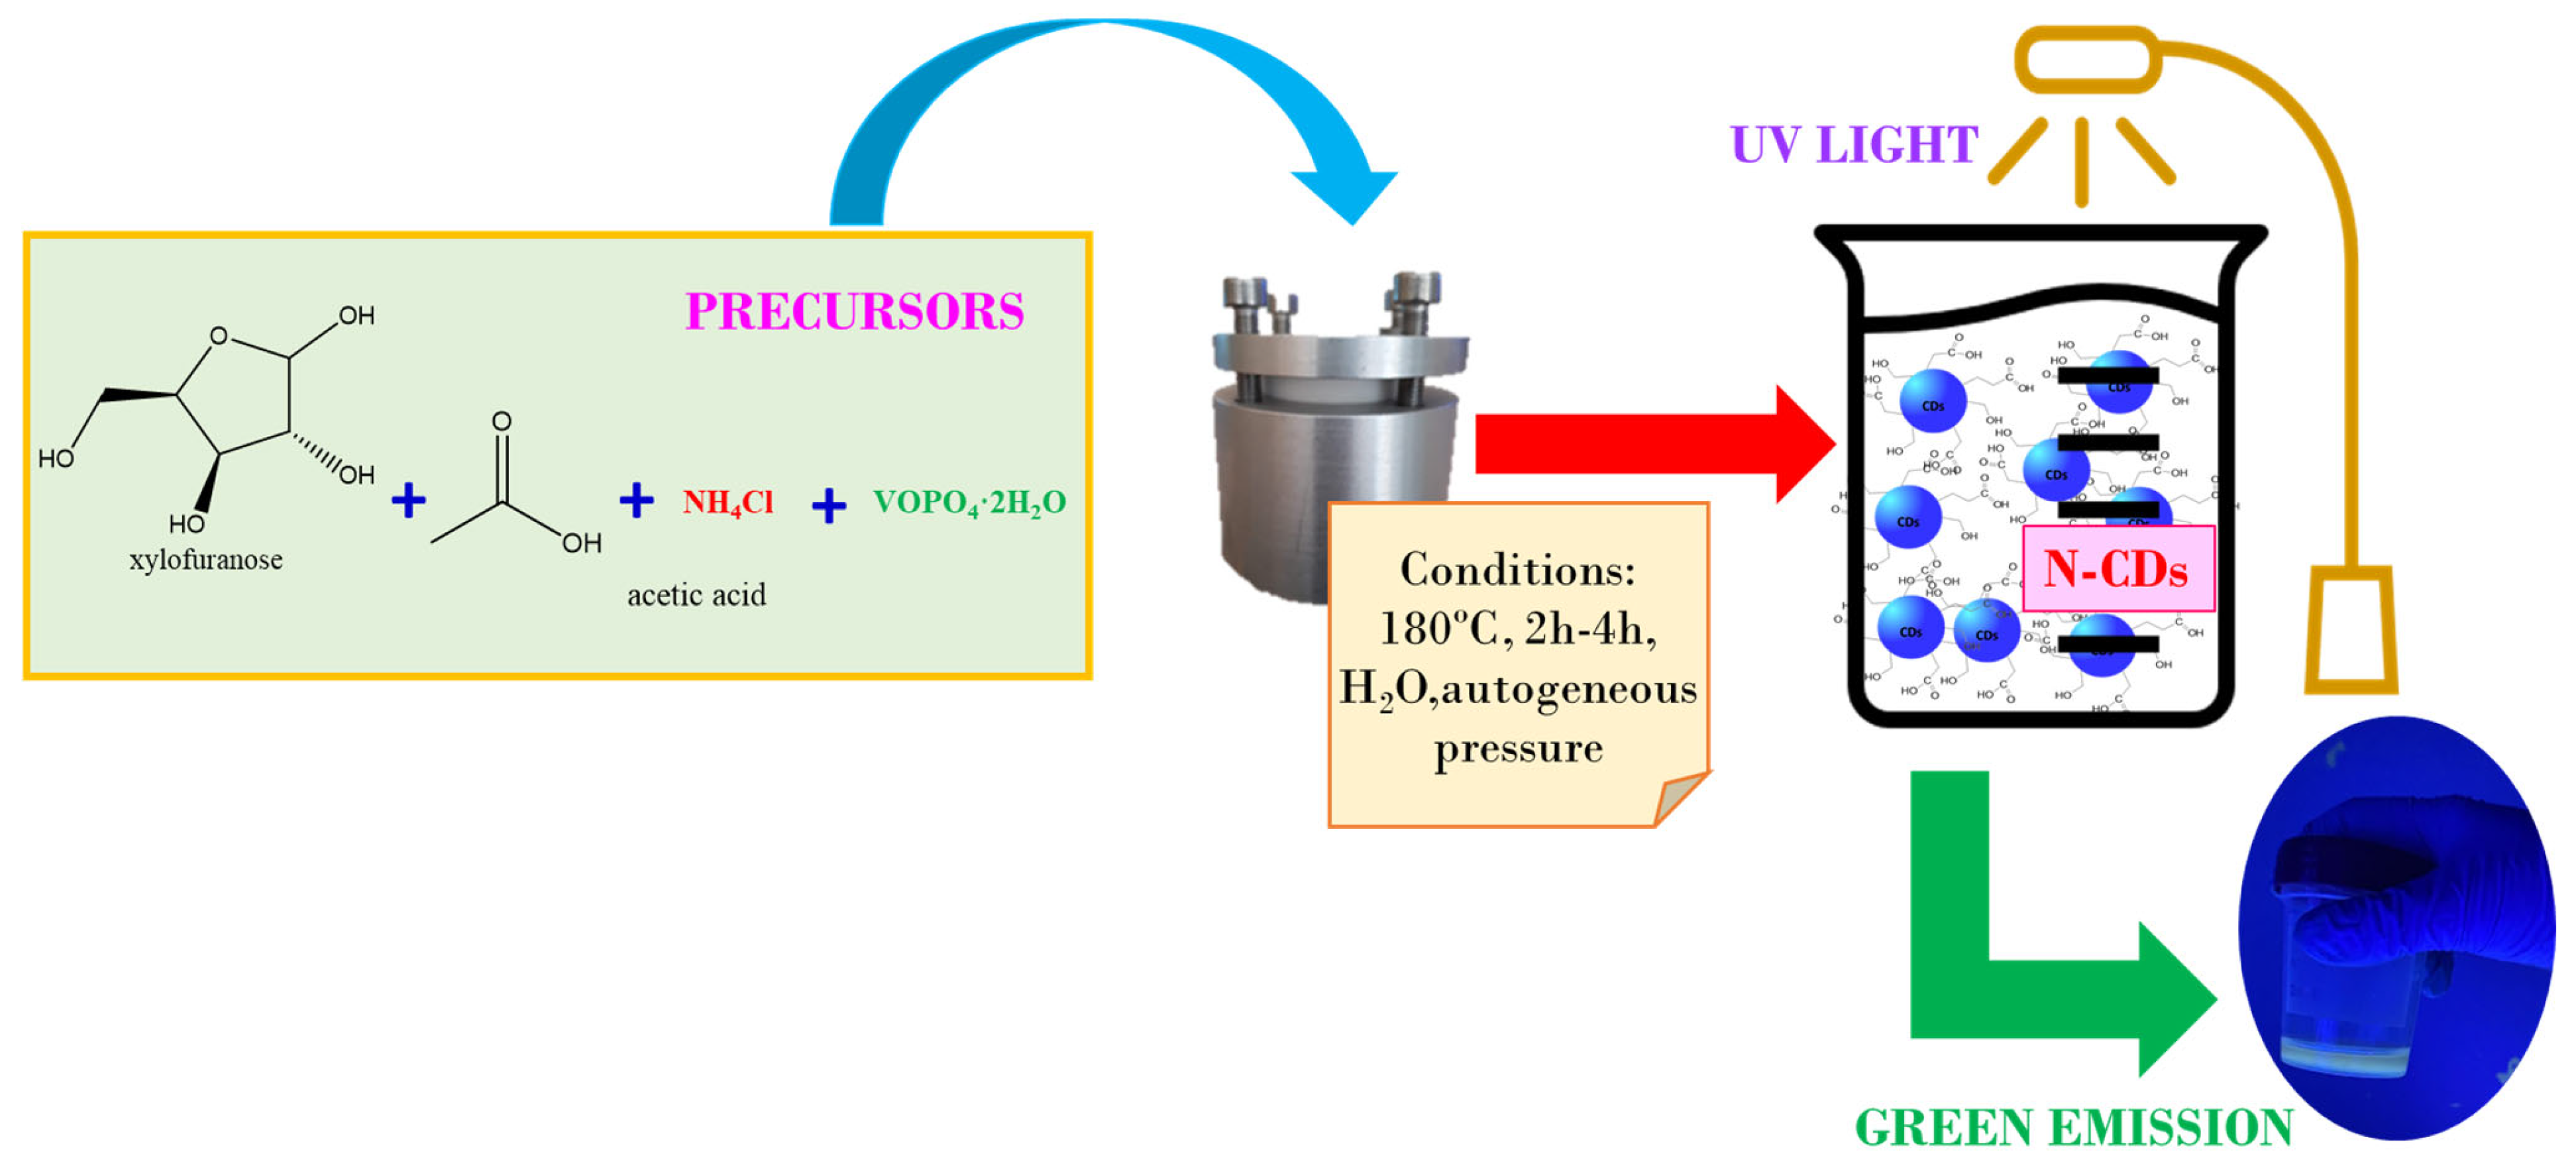
CDs were prepared following a hydrothermal procedure (Figure 9) that consisted of the addition of 100 mg of VOPO4 as the catalyst, 1.62 mL of CH3COOH, and 25 mL of 0.75 M xylose solution into a Teflon-lined steel hydrothermal reactor (Parr, Moline, IL, USA). As the ultimate target was to optimize the production for large-scale biomass transformation of olive pits, in order to replicate the conditions of acidity of a biomass-derived xylose solution, the expected amount of acetic acid that would be produced as a by-product when treating the biomass was added into reaction media. With the aim of doping the surfaces of the CDs to enhance their photocatalytic and photoluminescent properties, 5 g of NH4Cl was added into the hydrothermal reactor along with the rest of the components for the synthesis. The reaction temperature was set at 180 °C inside a muffle furnace in all cases, while the reaction time varied between 2 h and 4 h. Since the obtained N-CDs showed a high photoluminescence yield, it was decided that the synthesized N-CDs would be assayed in the photocatalytic degradation of methyl orange.
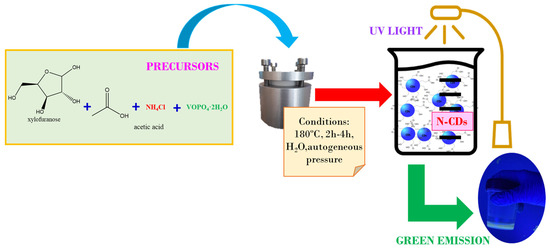
Figure 9.
Scheme of the hydrothermal one-pot method for the synthesis of N-CDs from xylose as the carbon precursor, VOPO4 as the catalyst, and NH4Cl as the doping agent.
3.4. CDs Purification
After the reaction, the purification method involved a centrifugation step to separate the remaining carbonization solids and the majority of the catalyst; then, there was a second centrifugation step, along with 10 mL pH = 2 citrate-citric acid buffer. After centrifugation, the suspended solid particles of the catalyst were separated by filtrating the solution over 0.45 μm syringe filters. Before continuing with the purification process, after this filtering step, the photoluminescent emission of every sample was checked under a UV lamp (Electro DH, Barcelone, Spain) as a rapid way to confirm the success of the synthesis. Filtered solutions were then poured into dialysis membranes (Pur-A-LyzerTM 1 kDa, Sigma-Aldrich (St. Luis, MO, USA)), along with citric/citrate buffer solution. After 48 h, the samples were removed from the dialysis tubes, while keeping the rinsing water. To obtain solid N-CDs for XPS analysis and for their use in the photodegradation of methyl orange as catalysts, the samples were lyophilized after dialysis using Scanvac® Coolsave™ (Bjarkesvej, Denmark) lyophilizer equipment. After lyophilization, 10 mg of solid N-CD was recovered each time the procedure was carried out, so the average N-CD mass yield of the synthetic process rose to 0.36%.
3.5. Catalyst Recovering
The separated carbonaceous solid underwent a thermal treatment in order to remove all the organic residues masking the catalyst. The calcination of this solid was performed at 550 °C for 6 h, at a heating rate of 5 °C/min.
3.6. Catalyst Recycling
The calcined solid was then reused into further catalytic cycles in the same reaction conditions. As some of the catalyst was inevitably lost during the process of recovery and calcination, the recovered catalyst from two identical catalytic runs was evenly mixed for reuse.
3.7. Catalyst Regeneration
After three catalytic runs, the catalyst followed a regeneration step based on a previously published procedure [50], which involved the addition of H3PO4 along with HNO3 to a suspension in the rinsing water used for the dialysis of the catalyst after the reaction.
3.8. Photocatalytic Assay
For the photocatalytic assay, 50 mg of CD was added into 0.5 L of an aqueous solution consisting of 5 ppm of methyl orange dye. A photoreactor (Luzchem (Gloucester, ON, Canada) Model CCP-4V 220 V 50 Hz 3 A) was used to irradiate the samples with visible light, employing the fourteen white visible lamps inside the reactor. After 5, 10, 20, 30, 60, and 80 min, an aliquot of the solution was taken to control methyl orange (MO) photodegradation by determining its remaining concentration. After 5, 10, 20, 30, 60, and 80 min, an aliquot of the solution was taken to control the methyl orange (MO) photodegradation by determining its remaining concentration. Prior to the measurement of the sample, a calibration curve was performed using five standards of methyl orange of 1, 2, 3, 4, and 5 ppm.
3.9. Characterization Conditions
Transmission electron microscopy (TEM) was carried out in a FEITalos F200X (Thermo Fisher Scientific, Waltham, MA, USA) equipped with an FEG 200 kV electron gun, four STEM detectors, and four FEG detectors. A Thermo Scientific-FEI Tecnai G2 20 Twin Transmission Electron Microscope equipped with LaB6 filament, tomography software, a cryo-transmission system, and an EDS/EDX (energy-dispersive X-ray spectroscopy) elemental analyzer (Thermo Fisher Scientific, Waltham, MA, USA) was used to evaluate the characteristics of the surfaces of the CDs. TEM and HRTEM images were processed using ImageJ v. 1.53k software. The photophysical characteristics of the CDs were studied by photoluminescence measurements using a LabRAM Odyssey PL microscope (Horiba, Kyoto, Japan). Samples were irradiated under two lasers: (1) 325 nm, ×40 lens, 100-hole aperture, 5% ND filter, 28 mW power. (2) 473 nm, ×40 lens, 100-hole aperture, 5% ND filter, 100 mW power. Photostability was measured using the same equipment and irradiation conditions over time, following a previously published study [51]. QY and the fluorescence lifetime were measured using an Edinburgh Instruments FLS920 fluorimeter coupled with a 1-M-1 integrating sphere for calculating the QY, and using the ultra-rapid F-G05 detector. XPS analysis was utilized to characterize the superficial composition of the CDs and the surface of the catalyst, VOPO4. It was performed by means of a Physical Electronics PHI5700 spectrometer using monochromatic Al Kα of 15 kV and 1486.6 eV, with a dual charge beam and a hemispheric multichannel detector for the VOPO4 and N-CDs spectra. The analysis zone comprised an area 100 μm in diameter when AlKα radiation was used. The constant pass energy mode was set at 29.35 eV. The obtained spectrum was processed using MultiPak v.9.3 software. The XPS analysis was carried out for the lyophilized samples in the case of N-CDs. All values were referenced to adventitious carbon (C 1s at 284.8 eV). FTIR was performed for N-CDs in a Bruker Vertex70 coupled with a Golden Gate Single Reflection Diamond ATR System (Bruker, Billerica, MA, USA). The spectral resolution was set at 4 cm−1 in a spectral range of 4000–500 cm−1. The Raman spectrum of VOPO4 was measured using a FT-Raman RFT-6000-JASCO spectrometer (JASCO, Tokyo, Japan) with a 1064 nm laser at 150 mW of power. The XRD patterns were collected on a PANanalytical EMPYREAN (Malvern Panalytical, Malvern, UK) automated diffractometer. The PIXcel 3D detector was set at a step size of 0.017° (2θ). The diffractograms were recorded between 4 and 70 in 2θ. The remaining xylose in the reaction samples was controlled using an HPLC instrument (JASCO, Tokyo, Japan) equipped with an autoinjector (AS-2055), which injected 6 μL of the sample into a Phenomenex (Torrance, CA, USA) Rezex ROA-Organic Acid H+ (8%) (300 mm × 7.8 mm) column. The mobile phase (0.0025 M H2SO4) was pumped by a quaternary gradient pump (PU-2089) at a 0.35 mL/min−1 flow rate to the column, heated at 40 °C. The possible remains of vanadium species after the reaction were studied by means of ICP-MS in a Nexon 300D at a flow rate of 0.8 L/min of nebulizer gas, 18 L/min of gas for the plasma, and 1.2 L/min of auxiliary gas at a potential RF of 1600 W. The Brönsted–Lewis acidic sites were determined via pyridine adsorption measurements. The catalyst was shaped into wafers along with KBr and saturated in pyridine for 10 min at room temperature; then, it was gradually heated in a tubular oven until 125 °C, recording the spectrum each 20 to 30 °C. The adsorption and desorption spectra, at different temperatures, were recorded by a SHIMADZU (Kyoto, Japan) FTIR-8300 infrared spectrophotometer at a fixed irradiation wavelength and power of 632.8 nm and 0.5 mW, respectively. The photodegradation of MO was followed by UV-vis spectrophotometry (UV 1800 SHIMADZU (Kyoto, Japan) UV). The UV-vis spectrum of N-CDs was recorded using the same equipment in a 300–900 nm range.
4. Conclusions
Green-emitting N-CDs were successfully obtained using heterogeneous catalysis via a hydrothermal synthetic procedure. Nevertheless, there is still work to be done as this procedure could be improved in terms of production yield. VOPO4 played a bifunctional role in the synthesis, while Brønsted acidity promoted the dehydration and condensation of the carbon precursor. Its oxidizing properties provoked a complete oxidation of the organic groups functionalizing the surface of the N-CDs, as was deduced from the XPS results and confirmed by photoluminescent emissions. The addition of a certain amount of CH3COOH in order to replicate the composition of a real biomass liquor positively affected the synthesis, as it enhanced the oxidizing properties of the catalyst. The VOPO4 catalyst was successfully recovered, recycled, and regenerated with no further negative effect on its performance in terms of the dehydration, aggregation, and oxidation of the surfaces of the N-CDs. CDs were doped with N atoms using NH4Cl, and the doping was confirmed by XPS. The doping of CDs to N-CDs greatly improved the photophysical properties of pristine CDs, as was observed in the photoluminescent measurements that affected the photocatalytic performance of the CDs in a positive way, as methyl orange was easily degraded at a high rate after 30 min of reaction. After 1 h of reaction, the degradation was considered to have been completed.
Supplementary Materials
The following supporting information can be downloaded at: https://www.mdpi.com/article/10.3390/catal13101358/s1, Figure S1: Size histograms of N-CDs synthesized using 100 mg VOPO4 as catalyst, 0.75 M of xylose as C precursor, NH4Cl as dopant, and 17 g/L of CH3COOH at 180 °C after 4 h of reaction calculated from TEM images; Figure S2: Graphitic spacing of N-CDs dialyzed solution samples synthesized using 100 mg VOPO4 as catalyst, 0.75 M of xylose as C precursor, NH4Cl as dopant, and 17 g/L of CH3COOH at 180 °C after 4 h of reaction; Figure S3: XRD pattern of dialyzed and lyophilized N-CDs synthesized using 100 mg VOPO4 as catalyst, 0.75 M of xylose as C precursor, NH4Cl as dopant, and 17 g/L of CH3COOH at 180 °C after 4 h of reaction; Figure S4: Pyridine adsorption and desorption on VOPO4 followed by FTIR; Figure S5: XRD pattern of freshly synthesized VOPO4; Figure S6: Raman spectrum of freshly synthesized VOPO4; Figure S7: XPS spectrum of V 2p core level binding energy of freshly synthesized VOPO4; Figure S8: XPS spectra of V 2p core level binding energy of (a) VOPO4 before reaction* and (b) VOPO4 after reaction; Figure S9: Survey XPS spectrum of freshly synthesized VOPO4; Figure S10: Survey spectra of (a) VOPO4 before reaction* and (b) VOPO4 after reaction; Table S1: XPS atomic concentration table of VOPO4; Table S2: XPS energy binding deconvoluted bands of VOPO4; Table S3: ICP-MS measurements of vanadium species in N-CDs-dialyzed solutions; Figure S11: XPS survey spectrum of dialyzed and lyophilized N-CDs synthesized using 100 mg VOPO4 as catalyst, 0.75 M of xylose as C precursor, NH4Cl as dopant, and 17 g/L of CH3COOH at 180 °C after 4 h of reaction; Figure S12: UV-vis spectrum of N-CDs dialyzed synthesized using 100 mg VOPO4 as catalyst, 0.75 M of xylose as C precursor, NH4Cl as dopant, and 17 g/L of CH3COOH at 180 °C after 4 h of reaction solution from 300 nm to 900 nm. No dilution was performed prior to the analysis. References [52,53,54,55,56,57] are cited in the Supplementary Materials.
Author Contributions
Conceptualization, R.M.-T., C.G.-S. and M.A.; methodology, G.R.-C. and M.A.; software, G.R.-C.; validation, M.A., C.G.-S. and R.M.-T.; formal analysis, G.R.-C.; investigation, G.R.-C.; resources, E.C.; data curation, G.R.-C.; writing—original draft preparation, G.R.-C.; writing—review and editing, G.R.-C., R.M.-T. and M.A.; visualization, R.M.-T. and C.G.-S.; supervision, R.M.-T. and C.G.-S.; project administration, M.A. and R.M.-T.; funding acquisition, R.M.-T. and M.A. All authors have read and agreed to the published version of the manuscript.
Funding
This research was funded by the Spanish Ministry of Science and Innovation (PID2021-122736OB-C42, PID2021-122613OB-I00) and FEDER (European Union) funds (PID2021-122736OB-C42, P20-00375, UMA20-FEDERJA88).
Data Availability Statement
No data is available.
Conflicts of Interest
The authors declare no conflict of interest. The funders had no role in the design of the study; in the collection, analyses, or interpretation of data; in the writing of the manuscript; or in the decision to publish the results.
References
- Moustafa, R.M.; Talaat, W.; Youssef, R.M.; Kamal, M.F. Carbon dots as fluorescent nanoprobes for assay of some non-fluorophoric nitrogenous compounds of high pharmaceutical interest. Beni-Suef Univ. J. Basic Appl. Sci. 2023, 12, 8. [Google Scholar] [CrossRef] [PubMed]
- Lagos, K.J.; García, D.; Cuadrado, C.F.; de Souza, L.M.; Mezzacappo, N.F.; da Silva, A.P.; Inada, N.; Bagnato, V.; Romero, M.P. Carbon dots: Types, preparation, and their boosted antibacterial activity by photoactivation. Current status and future perspectives. WIREs Nanomed. Nanobiotechnol. 2023, 15, e1887. [Google Scholar] [CrossRef]
- Khan, M.E.; Mohammad, A.; Yoon, T. State-of-the-art developments in carbon quantum dots (CQDs): Photo-catalysis, bio-imaging, and bio-sensing applications. Chemosphere 2022, 302, 134815. [Google Scholar] [CrossRef] [PubMed]
- Macairan, J.-R.; de Medeiros, T.V.; Gazzetto, M.; Villanueva, F.Y.; Cannizzo, A.; Naccache, R. Elucidating the mechanism of dual-fluorescence in carbon dots. J. Colloid Interface Sci. 2022, 606, 67–76. [Google Scholar] [CrossRef] [PubMed]
- Zhu, S.; Song, Y.; Zhao, X.; Shao, J.; Zhang, J.; Yang, B. The photoluminescence mechanism in carbon dots (graphene quantum dots, carbon nanodots, and polymer dots): Current state and future perspective. Nano Res. 2015, 8, 355–381. [Google Scholar] [CrossRef]
- Gedda, G.; Sankaranarayanan, S.A.; Putta, C.L.; Gudimella, K.K.; Rengan, A.K.; Girma, W.M. Green synthesis of multi-functional carbon dots from medicinal plant leaves for antimicrobial, antioxidant, and bioimaging applications. Sci. Rep. 2023, 13, 6371. [Google Scholar] [CrossRef]
- Lan, X.; Wang, Y.; Chen, X.; Liu, P.; Liu, C.; Xu, J.; Liu, C.; Jiang, F. Dual-action carbon quantum dots with light assist in enhancing the thermoelectric performance of polymers. J. Mater. Chem. C 2022, 10, 15906–15912. [Google Scholar] [CrossRef]
- Madrid, A.; Martín-Pardillos, A.; Bonet-Aleta, J.; Sancho-Albero, M.; Martinez, G.; Calzada-Funes, J.; Martin-Duque, P.; Santamaria, J.; Hueso, J.L. Nitrogen-doped carbon nanodots deposited on titania nanoparticles: Unconventional near-infrared active photocatalysts for cancer therapy. Catal. Today 2023, 419, 114154. [Google Scholar] [CrossRef]
- Han, W.; Li, D.; Hu, X.; Qin, W.; Sun, H.; Wang, S.; Duan, X. Photocatalytic activation of peroxymonosulfate by carbon quantum dots: Rational regulation of surface functionality and computational insights. Mater. Today Chem. 2023, 30, 101546. [Google Scholar] [CrossRef]
- Jeong, G.; Park, C.H.; Yi, D.; Yang, H. Green synthesis of carbon dots from spent coffee grounds via ball-milling: Application in fluorescent chemosensors. J. Clean. Prod. 2023, 392, 136250. [Google Scholar] [CrossRef]
- Liu, Y.; Sun, K.; Shi, N.; Li, R.; Zhang, J.; Zhao, J.; Geng, L.; Lei, Y. Dual functions of nitrogen and phosphorus co-doped carbon dots for drug-targeted delivery and two-photon cell imaging. Arab. J. Chem. 2023, 16, 104671. [Google Scholar] [CrossRef]
- Ding, P.; Song, H.; Chang, J.; Lu, S. N-doped carbon dots coupled NiFe-LDH hybrids for robust electrocatalytic alkaline water and seawater oxidation. Nano Res. 2022, 15, 7063–7070. [Google Scholar] [CrossRef]
- Zhou, P.; Xu, J.; Hou, X.; Dai, L.; Zhang, J.; Xiao, X.; Huo, K. Heteroatom-engineered multicolor lignin carbon dots enabling bimodal fluorescent off-on detection of metal-ions and glutathione. Int. J. Biol. Macromol. 2023, 253, 126714. [Google Scholar] [CrossRef]
- Miao, S.; Liang, K.; Zhu, J.; Yang, B.; Zhao, D.; Kong, B. Hetero-atom-doped carbon dots: Doping strategies, properties and applications. Nano Today 2020, 33, 100879. [Google Scholar] [CrossRef]
- Yang, X.; Li, X.; Wang, B.; Ai, L.; Li, G.; Yang, B.; Lu, S. Advances, opportunities, and challenge for full-color emissive carbon dots. Chin. Chem. Lett. 2021, 33, 613–625. [Google Scholar] [CrossRef]
- Wareing, T.C.; Gentile, P.; Phan, A.N. Biomass-Based Carbon Dots: Current Development and Future Perspectives. ACS Nano 2021, 15, 15471–15501. [Google Scholar] [CrossRef] [PubMed]
- Wang, B.; Lu, S. The light of carbon dots: From mechanism to applications. Matter 2022, 5, 110–149. [Google Scholar] [CrossRef]
- Liao, L.; Lin, X.; Zhang, J.; Hu, Z.; Wu, F. Facile preparation of carbon dots with multicolor emission for fluorescence detection of ascorbic acid, glutathione and moisture content. J. Lumin. 2023, 264, 120169. [Google Scholar] [CrossRef]
- Gong, P.; Sun, L.; Wang, F.; Liu, X.; Yan, Z.; Wang, M.; Zhang, L.; Tian, Z.; Liu, Z.; You, J. Highly fluorescent N-doped carbon dots with two-photon emission for ultrasensitive detection of tumor marker and visual monitor anticancer drug loading and delivery. Chem. Eng. J. 2018, 356, 994–1002. [Google Scholar] [CrossRef]
- Zhu, X.; Han, L.; Liu, H.; Sun, B. A smartphone-based ratiometric fluorescent sensing system for on-site detection of pyrethroids by using blue-green dual-emission carbon dots. Food Chem. 2022, 379, 132154. [Google Scholar] [CrossRef] [PubMed]
- Nguyen, K.G.; Baragau, I.-A.; Gromicova, R.; Nicolaev, A.; Thomson, S.A.J.; Rennie, A.; Power, N.P.; Sajjad, M.T.; Kellici, S. Investigating the effect of N-doping on carbon quantum dots structure, optical properties and metal ion screening. Sci. Rep. 2022, 12, 13806. [Google Scholar] [CrossRef] [PubMed]
- Cao, M.; Zhao, X.; Gong, X. Ionic Liquid-Assisted Fast Synthesis of Carbon Dots with Strong Fluorescence and Their Tunable Multicolor Emission. Small 2022, 18, 2106683. [Google Scholar] [CrossRef]
- Mattinzoli, D.; Cacioppo, M.; Ikehata, M.; Armelloni, S.; Alfieri, C.M.; Castellano, G.; Barilani, M.; Arcudi, F.; Messa, P.; Prato, M. Carbon dots conjugated to SN38 for improved colorectal anticancer therapy. Mater. Today Bio 2022, 16, 100286. [Google Scholar] [CrossRef] [PubMed]
- Dai, R.; Chen, X.; Ouyang, N.; Hu, Y. A pH-controlled synthetic route to violet, green, and orange fluorescent carbon dots for multicolor light-emitting diodes. Chem. Eng. J. 2022, 431, 134172. [Google Scholar] [CrossRef]
- Wang, B.; Yu, J.; Sui, L.; Zhu, S.; Tang, Z.; Yang, B.; Lu, S. Rational Design of Multi-Color-Emissive Carbon Dots in a Single Reaction System by Hydrothermal. Adv. Sci. 2020, 8, 2001453. [Google Scholar] [CrossRef] [PubMed]
- Algarra, M.; Dos Orfãos, L.; Alves, C.S.; Moreno-Tost, R.; Pino-González, M.S.; Jiménez-Jiménez, J.; Rodríguez-Castellón, E.; Eliche-Quesada, D.; Castro, E.; Luque, R. Sustainable Production of Carbon Nanoparticles from Olive Pit Biomass: Understanding Proton Transfer in the Excited State on Carbon Dots. ACS Sustain. Chem. Eng. 2019, 7, 10493–10500. [Google Scholar] [CrossRef]
- Wang, T.; Peng, L.; Wu, D.; Chen, B.; Jia, B. Crude fiber and protein rich cottonseed meal derived carbon quantum dots composite porous carbon for supercapacitor. J. Alloys Compd. 2023, 947, 169499. [Google Scholar] [CrossRef]
- Hallaji, Z.; Bagheri, Z.; Ranjbar, B. One-Step Solvothermal Synthesis of Red Chiral Carbon Dots for Multioptical Detection of Water in Organic Solvents. ACS Appl. Nano Mater. 2023, 6, 3202–3210. [Google Scholar] [CrossRef]
- Yin, C.-L.; An, B.-L.; Li, J.; Wang, X.-H.; Zhang, J.-M.; Xu, J.-Q. High-efficient synthesis of bright yellow carbon quantum dots catalyzed by SnO2 NPs. J. Lumin. 2021, 233, 117850. [Google Scholar] [CrossRef]
- Sarpiri, J.N.; Chermahini, A.N.; Saraji, M.; Shahvar, A. Dehydration of carbohydrates into 5-hydroxymethylfurfural over vanadyl pyrophosphate catalysts. Renew. Energy 2020, 164, 11–22. [Google Scholar] [CrossRef]
- Mérida-Morales, S.; García-Sancho, C.; Oregui-Bengoechea, M.; Ginés-Molina, M.; Cecilia, J.; Arias, P.; Moreno-Tost, R.; Maireles-Torres, P. Influence of morphology of zirconium-doped mesoporous silicas on 5-hydroxymethylfurfural production from mono-, di- and polysaccharides. Catal. Today 2020, 367, 297–309. [Google Scholar] [CrossRef]
- Faria, V.W.; Santos, K.M.A.; Calazans, A.M.; Fraga, M.A. Hydrolysis of Furfuryl Alcohol to Angelica Lactones and Levulinic Acid over Nb-based Catalysts. ChemCatChem 2023, 15, e202300447. [Google Scholar] [CrossRef]
- Yan, J.; Zhou, Y.; Shen, J.; Zhang, N.; Liu, X. Facile synthesis of S, N-co-doped carbon dots for bio-imaging, Fe3+ detection and DFT calculation. Spectrochim. Acta Part A Mol. Biomol. Spectrosc. 2023, 302, 123105. [Google Scholar] [CrossRef]
- Parry, E. An infrared study of pyridine adsorbed on acidic solids. Characterization of surface acidity. J. Catal. 1963, 2, 371–379. [Google Scholar] [CrossRef]
- Glazunov, V.; Odinokov, S. Infrared spectra of pyridinium salts in solution—II. Fermi resonance and structure of νNH bands. Spectrochim. Acta Part A Mol. Spectrosc. 1982, 38, 409–415. [Google Scholar] [CrossRef]
- Zhao, Y.; Yu, L.; Deng, Y.; Peng, K.; Yu, Y.; Zeng, X. A multi-color carbon quantum dots based on the coordinated effect of quantum size and surface defects with green synthesis. Ceram. Int. 2023, 49, 16647–16651. [Google Scholar] [CrossRef]
- Crispi, S.; Nocito, G.; Nastasi, F.; Condorelli, G.; Ricciardulli, A.; Samorì, P.; Conoci, S.; Neri, G. Development of a novel C-dots conductometric sensor for NO sensing. Sens. Actuators B Chem. 2023, 390, 133957. [Google Scholar] [CrossRef]
- Wang, X.; Liuye, S.; Ma, X.; Cui, S.; Pu, S. Construction of a solid-state fluorescent switching with carbon dots and diarylethene. Dye. Pigment. 2023, 216, 111318. [Google Scholar] [CrossRef]
- Li, R.; Shi, N.; Sun, K.; Fang, M.; Zhang, Z.; Geng, L.; Zhang, J. Nitrogen-doped carbon dots for doxorubicin-targeted delivery and two-photon cell imaging. Arab. J. Chem. 2023, 16, 105067. [Google Scholar] [CrossRef]
- Matter, E.A.; El-Naggar, G.A.; Nasr, F.; Ahmed, G.H.G. Facile synthesis of N-doped carbon dots (N-CDs) for effective corrosion inhibition of mild steel in 1 M HCl solution. J. Appl. Electrochem. 2023, 53, 2057–2075. [Google Scholar] [CrossRef]
- Gorji, Z.E.; Khodadadi, A.A.; Riahi, S.; Repo, T.; Mortazavi, Y.; Kemell, M. Functionalization of nitrogen-doped graphene quantum dot: A sustainable carbon-based catalyst for the production of cyclic carbonate from epoxide and CO2. J. Environ. Sci. 2023, 126, 408–422. [Google Scholar] [CrossRef] [PubMed]
- Ezati, P.; Rhim, J.-W.; Molaei, R.; Priyadarshi, R.; Roy, S.; Min, S.; Kim, Y.H.; Lee, S.-G.; Han, S. Preparation and characterization of B, S, and N-doped glucose carbon dots: Antibacterial, antifungal, and antioxidant activity. Sustain. Mater. Technol. 2022, 32, e00397. [Google Scholar] [CrossRef]
- Rodríguez-Padrón, D.; Algarra, M.; Tarelho, L.A.C.; Frade, J.R.; Franco, A.; de Miguel, G.; Jiménez, J.; Rodríguez-Castellón, E.; Luque, R. Catalyzed Microwave-Assisted Preparation of Carbon Quantum Dots from Lignocellulosic Residues. ACS Sustain. Chem. Eng. 2018, 6, 7200–7205. [Google Scholar] [CrossRef]
- Van Dam, B.; Nie, H.; Ju, B.; Marino, E.; Paulusse, J.M.J.; Schall, P.; Li, M.; Dohnalová, K. Excitation-Dependent Photoluminescence from Single-Carbon Dots. Small 2017, 13, 1702098. [Google Scholar] [CrossRef] [PubMed]
- Anthony, A.M.; Pandurangan, P.; Abbas, S. Ligand engineering with heterocyclic aromatic thiol doped carbon quantum dots. Carbon 2023, 211, 118086. [Google Scholar] [CrossRef]
- Liang, C.; Shi, Q.; Zhang, Y.; Xie, X. Water-soluble carbonized polymer dots with tunable solid- and dispersion-state fluorescence for multicolor films, anti-counterfeiting, and fungal imaging. Mater. Today Nano 2023, 22, 100324. [Google Scholar] [CrossRef]
- Panigrahi, A.; Behera, R.K.; Mishra, L.; Dubey, P.; Dutta, S.; Sarangi, M.K. Regulating optoelectronics of carbon dots with redox-active dopamine. Talanta Open 2023, 7, 100198. [Google Scholar] [CrossRef]
- Xiong, H.-F.; An, B.-L.; Zhang, J.-M.; Yin, C.-L.; Wang, X.-H.; Wang, J.-H.; Xu, J.-Q. Efficient one step synthesis of green carbon quantum dots catalyzed by tin oxide. Mater. Today Commun. 2020, 26, 101762. [Google Scholar] [CrossRef]
- Luo, Z.; Liu, E.; Hu, T.; Li, Z.; Liu, T. Effect of synthetic methods on electrochemical performances of VOPO4·2H2O supercapacitor. Ionics 2014, 21, 289–294. [Google Scholar] [CrossRef]
- Zazhigalov, V.; Kharlamov, A.; Haber, J.; Stoch, J.; Yaremenko, V.; Bacherikova, I.; Bogutskaya, L. Regeneration of VPMeO Catalysts for n-butane oxidation by means of mechanochemical and barothermal treatments. Prep. Catal. V Sci. Bases Prep. Heterog. Catal. Proc. Fifth Int. Symp. 1997, 111, 207–212. [Google Scholar] [CrossRef]
- Ji, Y.; Wang, M.; Yang, Z.; Qiu, H.; Ji, S.; Dou, J.; Gaponenko, N.V. Highly stable Na: CsPb(Br,I)3@Al2O3 nanocomposites prepared by a pre-protection strategy. Nanoscale 2020, 12, 6403–6410. [Google Scholar] [CrossRef] [PubMed]
- He, Y.; Yang, X.; Bai, Y.; Zhang, J.; Kang, L.; Lei, Z.; Liu, Z.-H. Vanadyl phosphate/reduced graphene oxide nanosheet hybrid material and its capacitance. Electrochim. Acta 2015, 178, 312–320. [Google Scholar] [CrossRef]
- Trchová, M.; Čapková, P.; Matějka, P.; Melánová, K.; Beneš, L.; Uhlířová, E. Intercalation of Water into Anhydrous Vanadyl Phosphate Studied by the Infrared and Raman Spectroscopies. J. Solid State Chem. 1999, 148, 197–204. [Google Scholar] [CrossRef]
- De Luna, Y.; Bensalah, N. Synthesis, Characterization and Electrochemical Evaluation of Layered Vanadium Phosphates as Cathode Material for Aqueous Rechargeable Zn-ion Batteries. Front. Mater. 2021, 8, 645915. [Google Scholar] [CrossRef]
- Griesel, L.; Bartley, J.K.; Wells, R.P.K.; Hutchings, G.J. Preparation of vanadium phosphate catalysts from VOPO4·2H2O: Effect of VOPO4·2H2O preparation on catalyst performance. J. Mol. Catal. A: Chem. 2004, 220, 113–119. [Google Scholar] [CrossRef]
- Antonio, M.R.; Barbour, R.L.; Blum, P.R. Interlayer coordination environments of iron, cobalt, and nickel in vanadyl phosphate dihydrate, VOPO4·2H2O, intercalation compounds. Inorg. Chem. 1987, 26, 1235–1243. [Google Scholar] [CrossRef]
- Beneš, L.; Melánová, K.; Zima, V.; Trchová, M.; Čapková, P.; Koudelka, B. Vanadyl phosphate intercalated with dimethyl sulfoxide. J. Phys. Chem. Solids 2006, 67, 956–960. [Google Scholar] [CrossRef]
Disclaimer/Publisher’s Note: The statements, opinions and data contained in all publications are solely those of the individual author(s) and contributor(s) and not of MDPI and/or the editor(s). MDPI and/or the editor(s) disclaim responsibility for any injury to people or property resulting from any ideas, methods, instructions or products referred to in the content. |
© 2023 by the authors. Licensee MDPI, Basel, Switzerland. This article is an open access article distributed under the terms and conditions of the Creative Commons Attribution (CC BY) license (https://creativecommons.org/licenses/by/4.0/).

