Article

Gadolinium-Doped Bismuth Ferrite for the Photocatalytic Oxidation of Arsenite to Arsenate under Visible Light

1
Department of Industrial Engineering, University of Salerno, Giovanni Paolo II, 132, 84084 Fisciano, Italy
2
Department of Applied Science and Technology and INSTM Unit, Politecnico di Torino, Corso Duca degli Abruzzi 24, 10129 Turin, Italy
*
Authors to whom correspondence should be addressed.
Catalysts 2024, 14(4), 258; https://doi.org/10.3390/catal14040258
Submission received: 8 March 2024 / Revised: 27 March 2024 / Accepted: 10 April 2024 / Published: 13 April 2024

Abstract

:
Arsenic in drinking water is one of the most concerning problems nowadays due to its high toxicity. The aim of this work is the photocatalytic oxidation of As(III) to As(V) under visible light. This study is focused on the use of gadolinium-doped bismuth ferrite as a photocatalyst active under visible light. Different gadolinium amounts were evaluated (0, 0.5, 1, 2, 5, 10 mol%), and 2 mol% resulted in the best gadolinium amount to reach higher photocatalytic efficiency in terms of As(V) production. The samples were thoroughly characterized in their optical, structural, and morphological properties. The results allowed us to identify an optimal concentration of gadolinium equal to 2 mol%. The reactive oxygen species most responsible for the photocatalytic mechanism, evaluated through the addition of radical scavengers, were O2−● and e. Finally, a photocatalytic test was performed with a drinking water sample polluted by As(III), showing photocatalytic performance similar to distilled water. Therefore, gadolinium-doped bismuth ferrite can be considered an efficient catalytic material for the oxidation of As(III) to As(V) under visible light.

Graphical Abstract

1. Introduction

Water is the most important factor for human survival. Nowadays, attention is being paid more and more to aqueous pollution caused by the increase in industrial and agricultural production, necessary to meet the continuous demand due to population growth [1]. Among all the different pollutants that can be found dissolved in water, arsenic is considered a priority because of its carcinogen effects [2]. It is the 20th most occurring element on the earth, 14th in seawater, and 12th in the human body, and nowadays, because of the consequences on human health, its removal from mainly drinking water is one of the most important challenges for researchers and authorities [3].
Arsenic can be found in water in two different forms, As(III) and As(V), depending on the water pH and its oxidation potential [4]. Of the two of them, As(III) is the most dangerous, because its toxicity is 20–60 times higher than As(V), but also because it is less easy to remove with traditional processes [5,6,7].
Both natural and human activities can be the cause of high arsenic concentrations in waters, rocks, and organisms [8]. The main responsible factors are natural processes such as biological activity, weathering reactions, and volcanic activities, but human activities are responsible for a high environmental impact because of the extensive use of arsenic-based pesticides and herbicides or gold mining [9,10].
Particularly concerning is the presence of As in groundwater, since it is the main source of drinking water, and since, due to the reducing environment, arsenic is present in its most dangerous form [5]. For this reason, specific treatments are needed for arsenic removal. In particular, a first step for the oxidation of As(III) into As(V) is necessary, since the latter one is easier to remove from water [11,12]. So, the arsenic removal process consists of a pre-oxidation step of As(III) into As(V), followed by the removal of As(V) through various removal technologies [12] that include adsorption, precipitation, membrane filtration, ion exchange, phytoremediation, electrocoagulation, electrokinetic methods, and phytobial remediation [3,5,13,14]. Oxidants, such as NaClO [15], KMnO4 [16], ClO2 [17], NH2Cl [17], MnO2 [18], and H2O2 [19], are usually used for arsenite oxidation to arsenate. However, these conventional oxidation processes are characterized by some limitations such as by-product formation, the use of expensive oxidants, and sludge production [11]. To overcome these drawbacks, alternative oxidation processes are preferred, such as heterogeneous photocatalysis, which is widely used for the removal of water pollutants [20,21,22,23,24,25]. In particular, the TiO2 photocatalyst is shown particularly performing for As(III) oxidation without the addition of chemicals other than dissolved O2 [26]. Moreover, TiO2 is a cheap, nontoxic, and easily available material [27]. However, the TiO2 band-gap is equal to about 3.2 eV, meaning that it can be activated only by UV light. On the other hand, the activation of TiO2 by visible light is achieved by lowering the band-gap energy thanks to the introduction of dopant elements into the TiO2 lattice [28,29]. A valid alternative to TiO2 is the ZnO, which shows a similar band-gap (3.2 eV) [30]. This photocatalyst is cheaper than titania. However, the photocatalytic application of ZnO is limited because of photocorrosion phenomena that occur under UV light [31]. As for the TiO2, dopant elements can be added to the ZnO lattice to reduce the band-gap energy.
In recent years, much attention has been paid to the use of perovskites as photocatalysts, due to their band-gap energy lower than TiO2 and ZnO. Among the possible perovskites that can be employed in photocatalysis, very interesting is the bismuth ferrite (BiFeO3), that shows a band-gap of 2.2 eV, lower than the TiO2 and ZnO, which allows BiFeO3 to be active under visible light [32]. BiFeO3 is widely used to remove organic dyes, such as Methylene Blue [33] and Reactive Black 5 [34]. Moreover, in our previous work, we showed that BiFeO3 was effective in the As(III) oxidation to As(V) under visible light [11]. On the other hand, BiFeO3 doped with various elements, such as Zr [35], Eu-Ni [36], Mn-Sm [37], and Gd [38,39] has been studied for the photocatalytic degradation of organic pollutants but never as a catalytic material for the photocatalytic oxidation of As(III) to As(V).
For this reason, the present work aimed to test, for the first time, the efficiency of gadolinium-doped BiFeO3 (Gd-BFO) in the photocatalytic oxidation of arsenite to arsenate under visible light. In particular, the properties of synthesized materials were investigated by several analyses (Raman spectra, UV–Vis, SSA, SEM, XRD, PL). The operating conditions of the photocatalytic tests were optimized, and the role of the main oxidizing species was identified. The efficiency of the best photocatalyst was also demonstrated in the presence of a drinking water sample polluted by arsenite.

2. Results and Discussion

2.1. Photocatalysts Characterization

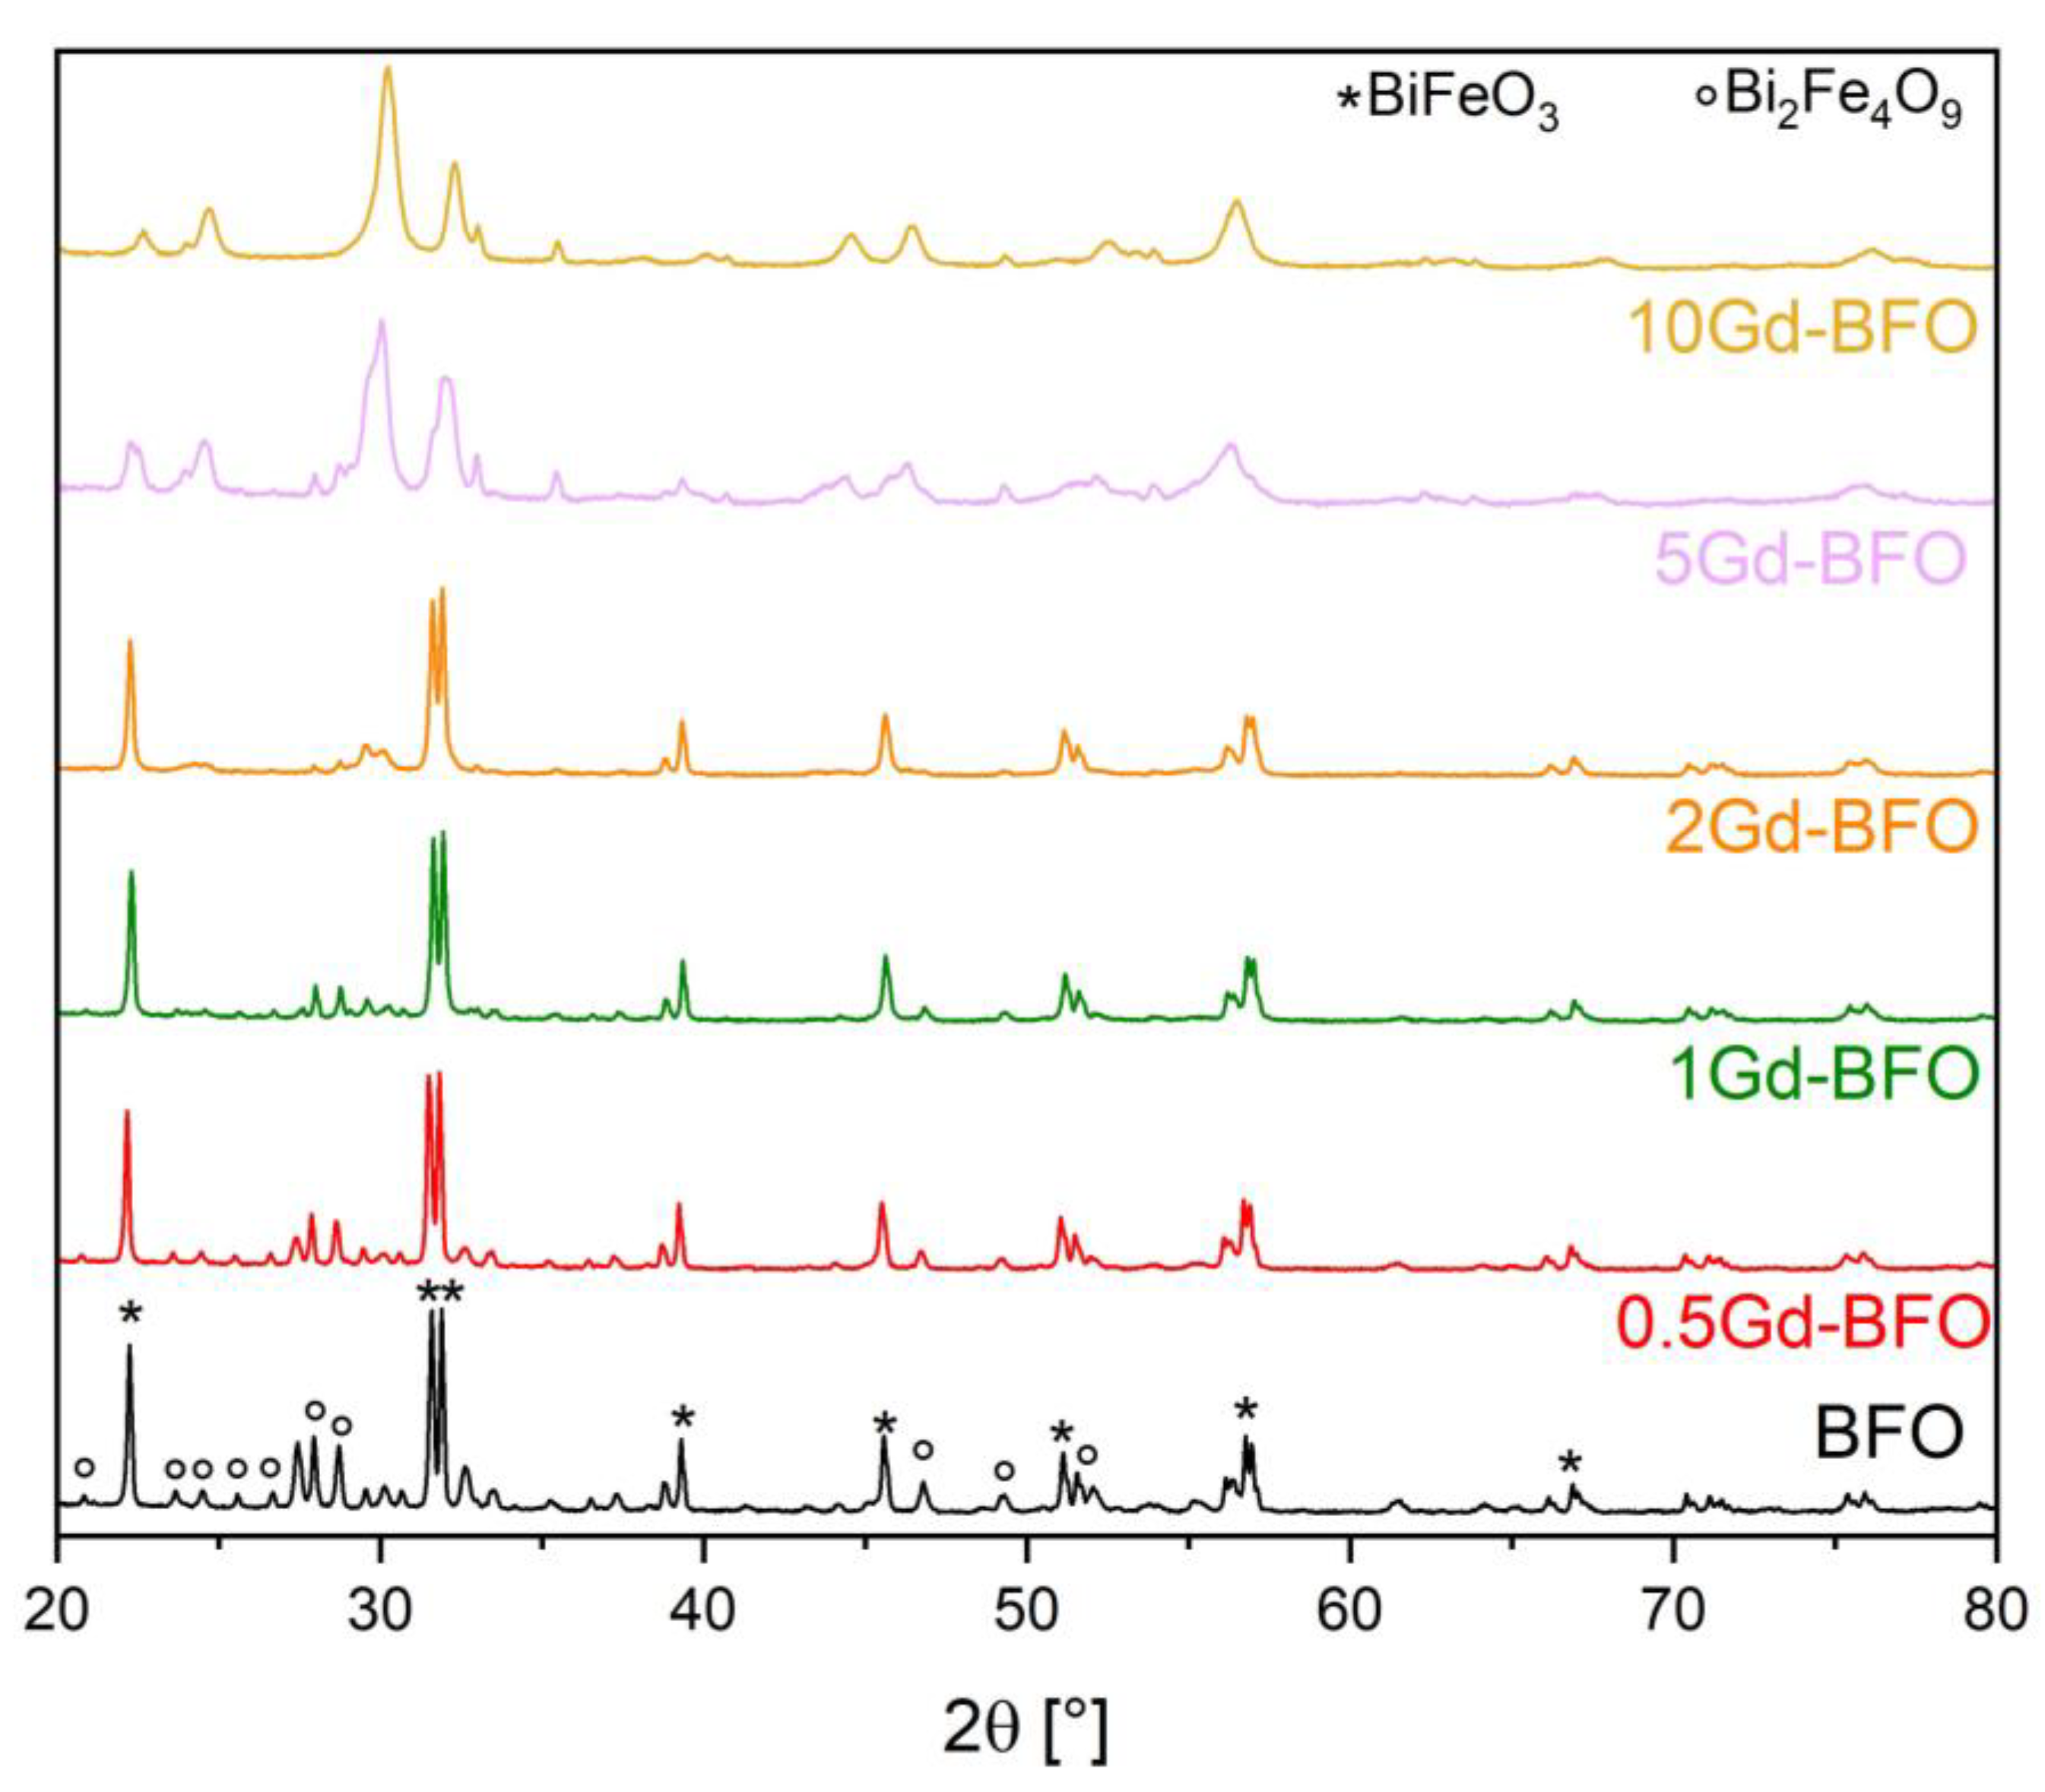
2.1.1. X-ray Powder Diffraction Analysis (XRD)

XRD patterns of the samples synthesized with different concentrations of gadolinium are shown in Figure 1.
The adopted sol-gel strategy leads to the formation of a mixed bismuth-ferrite oxide phase. The diffraction peaks of BFO samples (black curve Figure 1) can be assigned to a polycrystalline rhombohedral-distorted perovskite structure with an R3c space group (BiFeO3, JCPDS card No. 00-020-0169, represented by stars in Figure 1), with the presence of a second phase Bi2Fe4O9 (JCPDS card No. 01-074-1098, represented by circles in Figure 1) [40]. The increasing amount of Gd3+ doping mainly affects the minor phase Bi2Fe4O9, reducing the intensity of its typical peaks located about at 2θ values of 28.2°, 29.9°, and 47.1°. This gradual decrease is observed up to sample 2Gd-BFO, where the structure of phase BiFeO3 is still preserved. A further increase in Gd content leads to the formation of new phases that can be tentatively assigned to pure and mixed gadolinium oxide species, clearly visible for samples doped at 5 and 10 mol%. Interestingly, the Gd-doping set at 2 mol% seems to set a threshold with a dual beneficial effect: (i) reducing the presence of secondary phases (Bi2Fe4O9) and (ii) ensuring that gadolinium oxide is not formed.
For samples in which the BFO phase is well defined (BFO undoped and Gd doped at 0.5 mol%, 1 mol%, and 2 mol% samples), the crystallite size has been calculated from the most intense peaks (0 1 2 and 1 1 0) located both around 2θ = 32°. The undoped sample has the largest crystallites with a size of about 69 nm (Table 1). This value decreases with the addition of gadolinium, reaching a minimum value of 55 nm for the 2Gd-BFO sample.

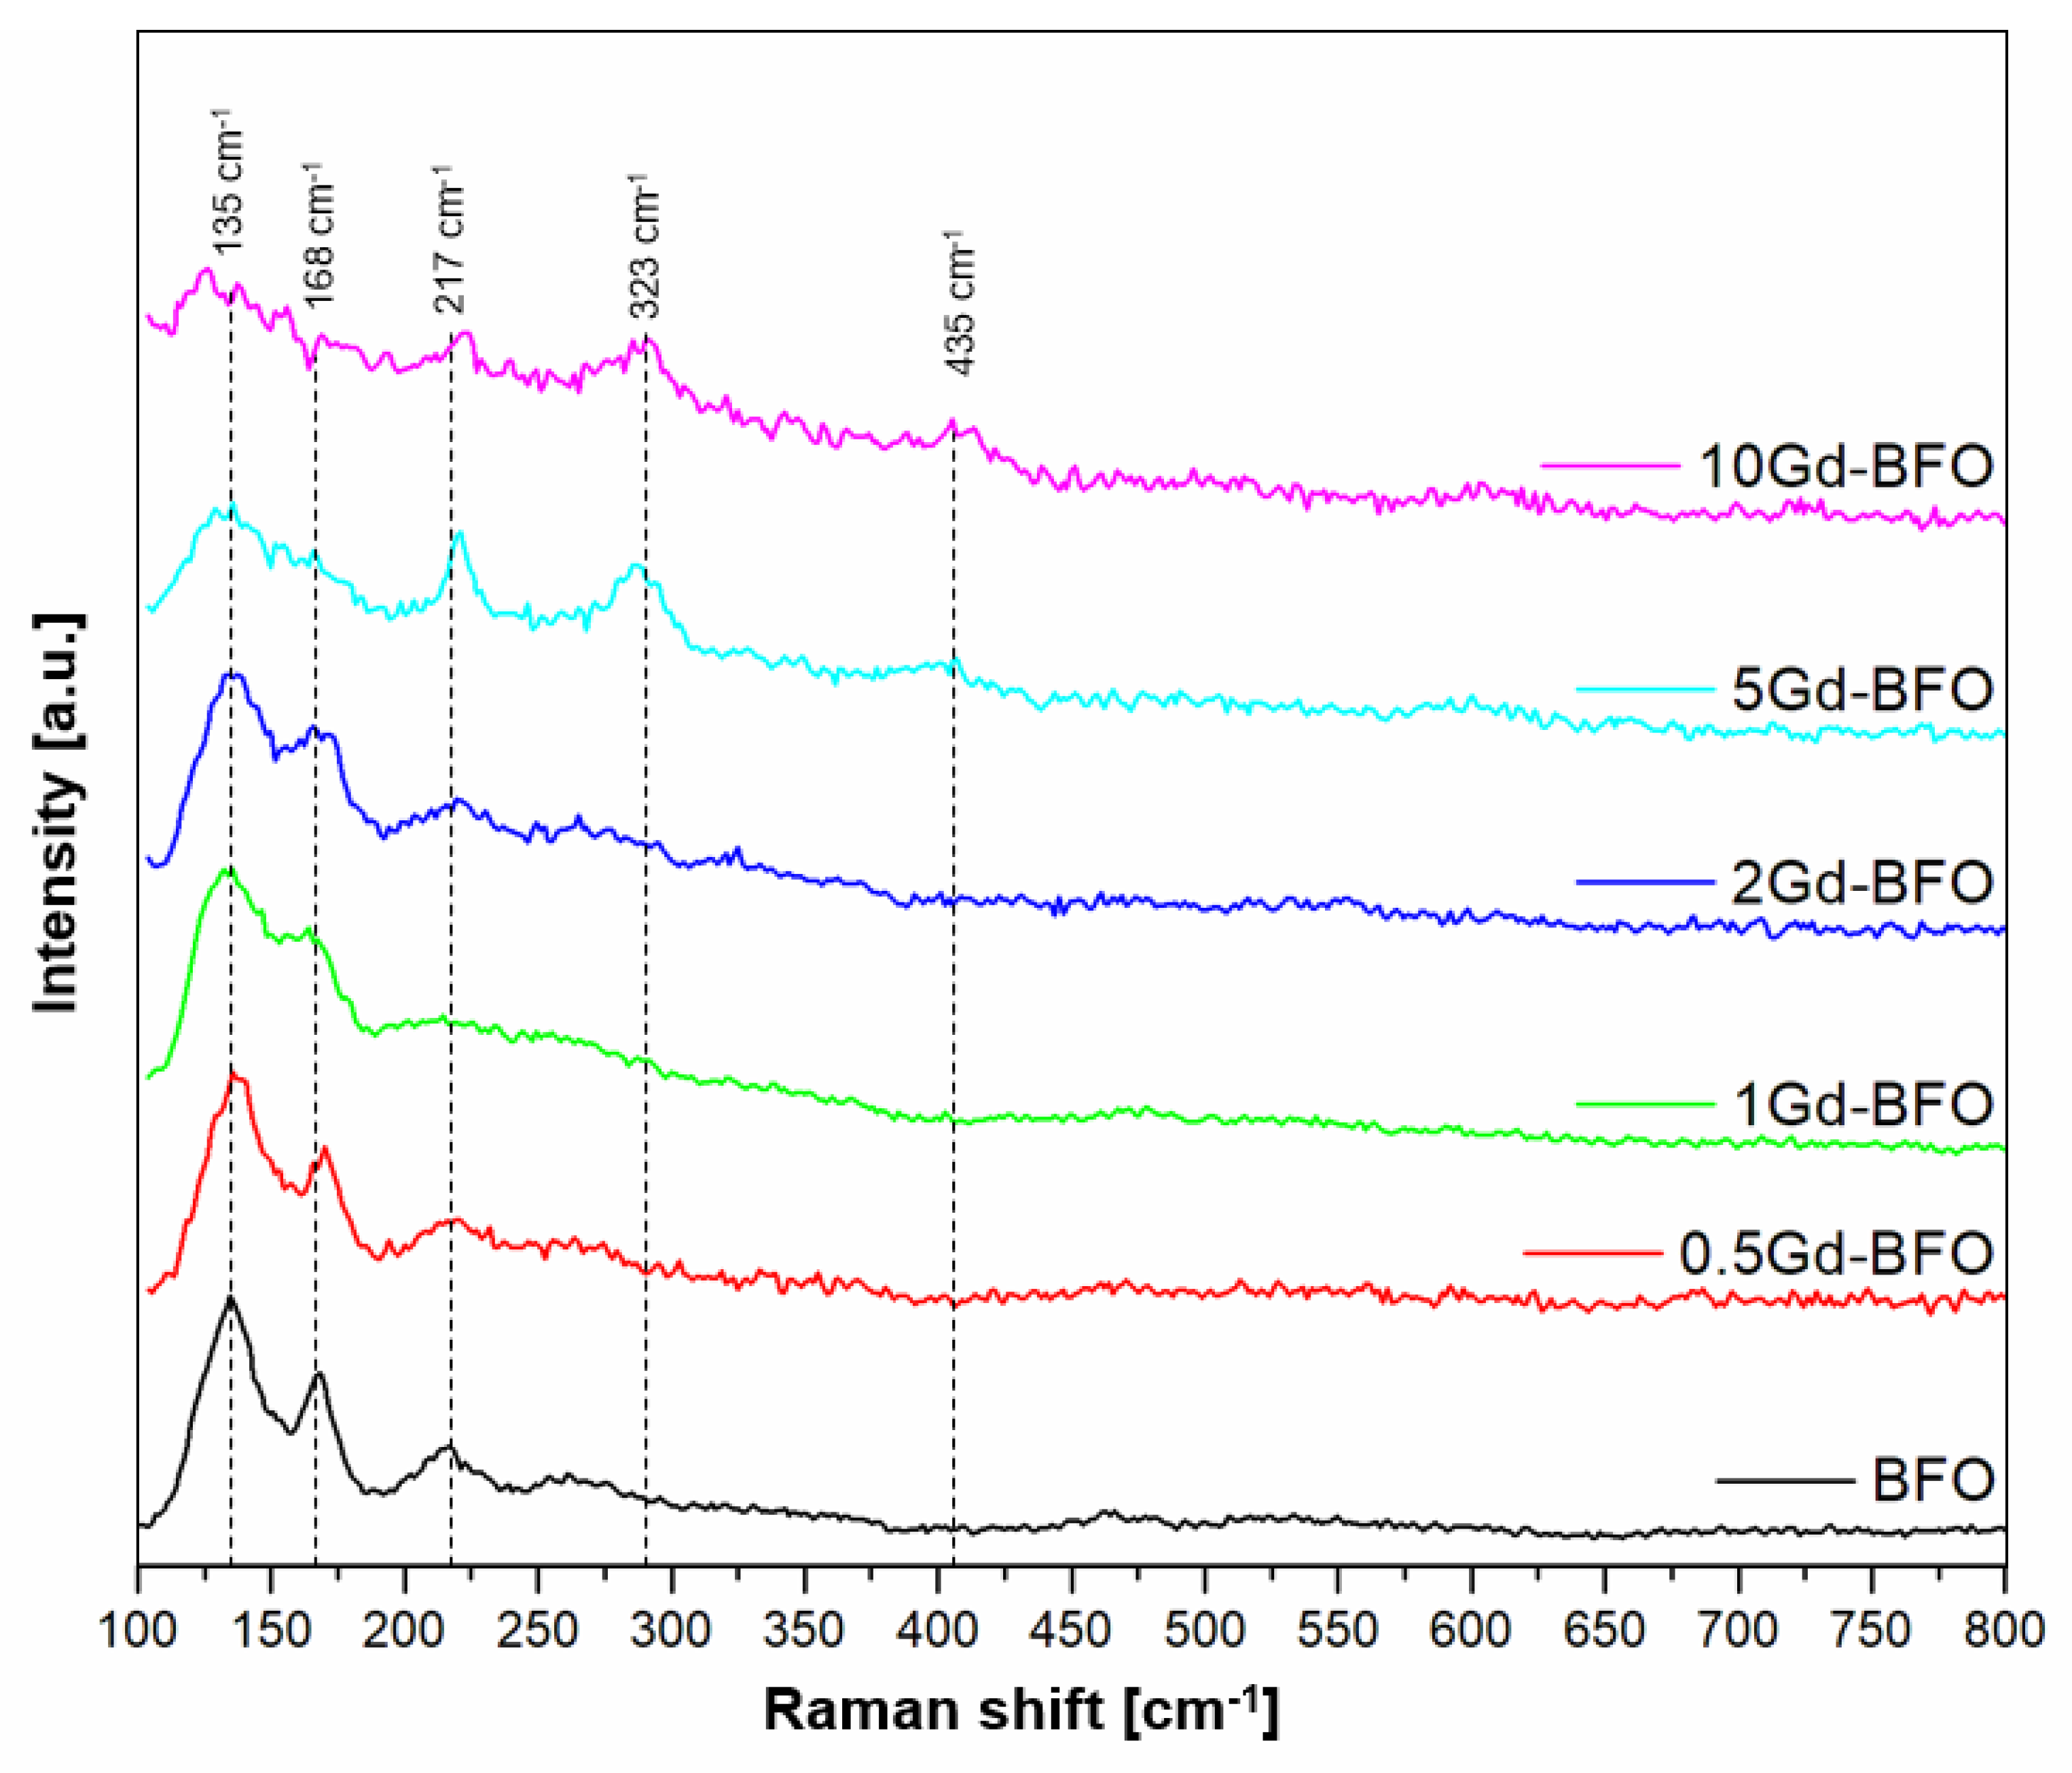
2.1.2. Raman Spectroscopy

Figure 2 reports the Raman spectra of the prepared sample. All the photocatalysts show the typical BFO signals at 135, 168, and 217 cm−1 [41]. In particular, 0.5Gd-BFO, 1Gd-BFO, and 2Gd-BFO do not display bands different from BFO. However, the spectra of 1Gd-BFO and 2Gd-BFO photocatalysts show a broadening of the BFO Raman signals, attributed to the distortion of the BFO lattice caused by Gd3+ substitution [42]. The spectra of 5Gd-BFO and 10Gd-BFO samples are characterized by the presence of Raman bands at 323 and 435 cm−1, typical of gadolinium oxides probably formed on the surface of the two samples due to the high quantity of gadolinium used during the preparation step [38]. The results are in agreement with XRD findings.

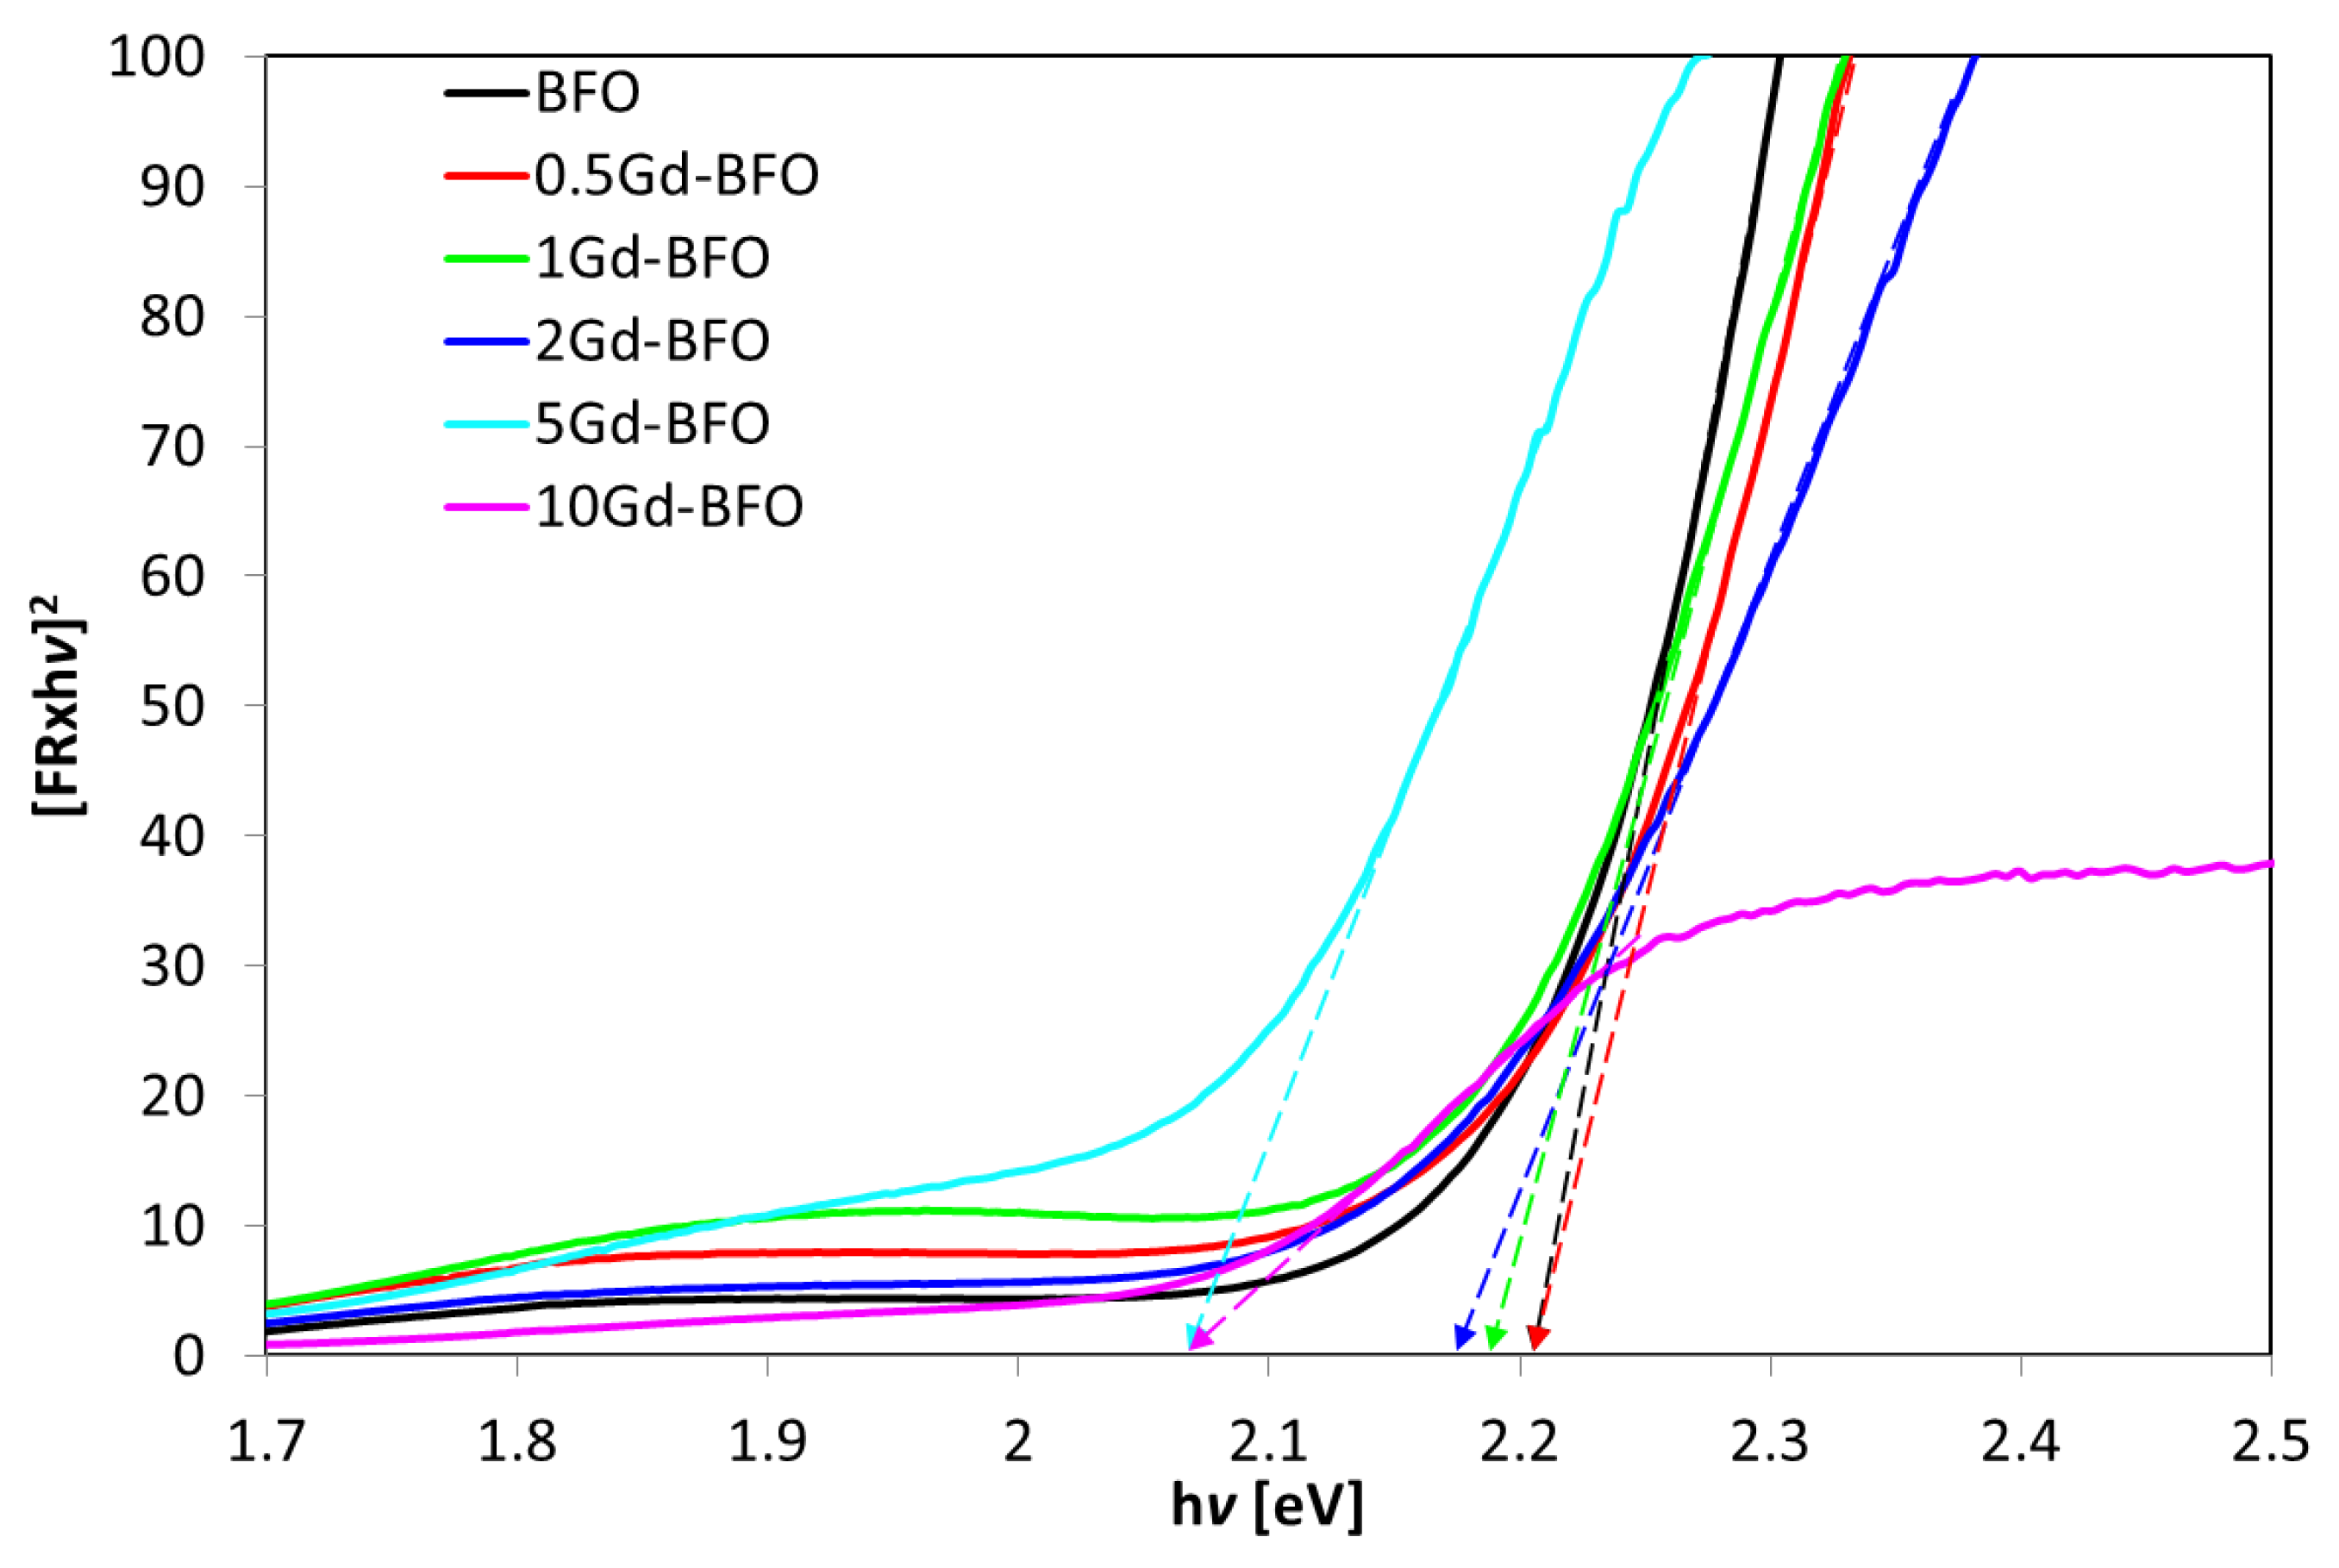
2.1.3. Optical Characterization

UV–Vis DRS spectra were used to determine the optical band-gap of the samples using the Kubelka–Munk function (FR) (Figure 3). It is possible to note that for the 0.5Gd-BFO sample, there are no substantial differences compared to the BFO sample, given the small quantity of the doping element. Indeed, both samples show the same band-gap of 2.21 eV (Table 2). An increase in the gadolinium content, from 1 to 10 mol%, causes a gradual decrease in the band-gap value up to 2.07 eV (Table 1), in agreement with the literature. [43]. The change in the band-gap value as the gadolinium content increases is due to the introduction of the doping metal ion in BFO lattice. In this way, some impurity levels are generated in the forbidden band, resulting in the shifts in the donor level above the original valence band or an acceptor level under the original conduction band [44,45].

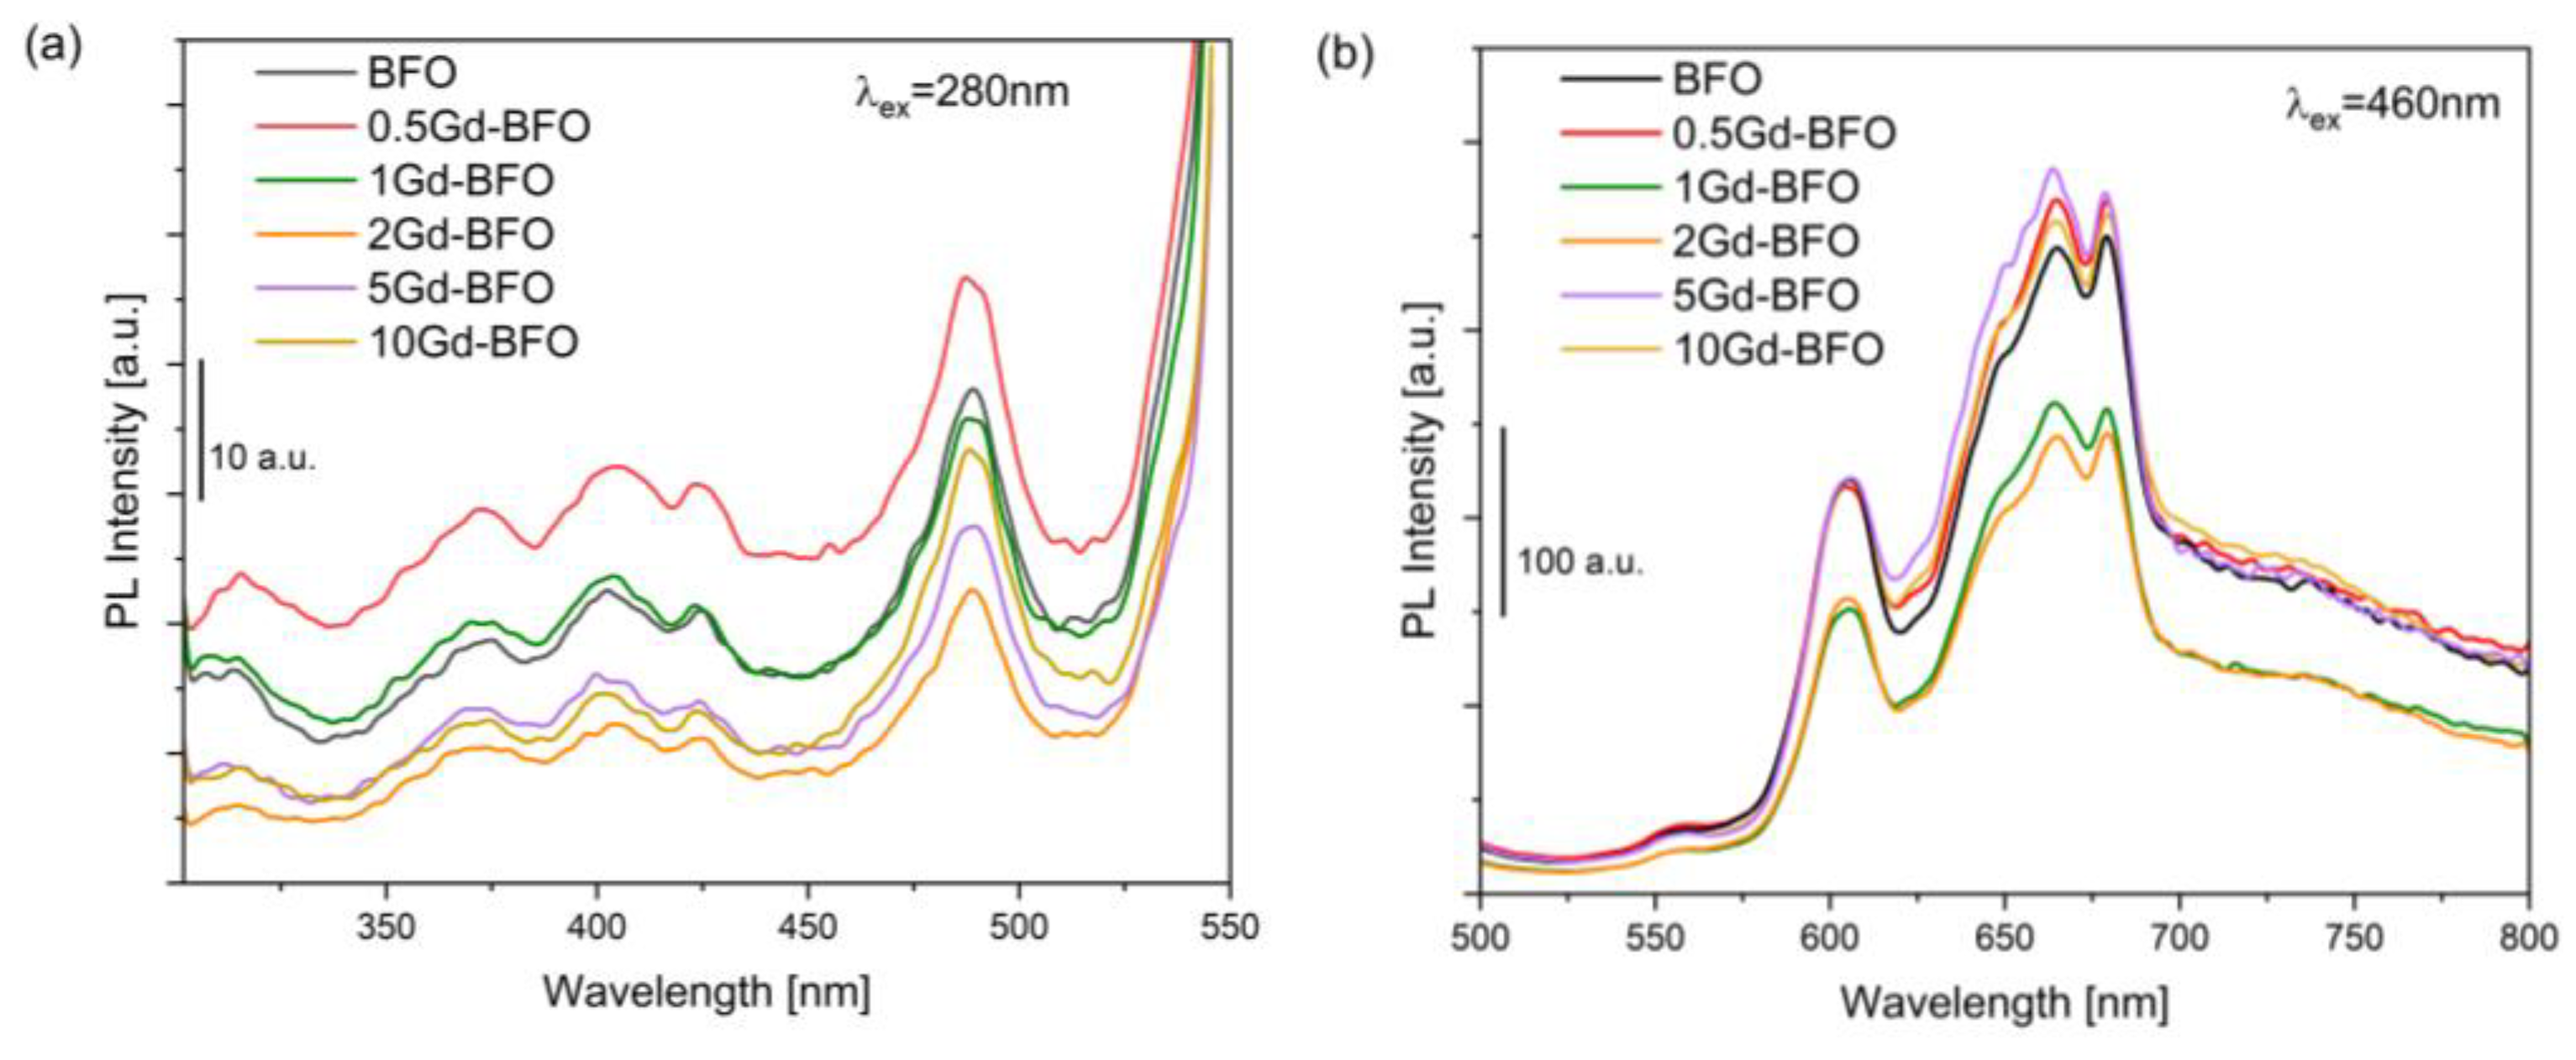
2.1.4. Photoluminescence (PL) Spectroscopy

Photoluminescence (PL) spectra of all samples are presented in Figure 4, using two different excitation wavelengths. With both λex, the BFO samples show the same set of peaks whose intensity varies with the dopant concentration. BiFeO3 emission signals are conventionally attributed to band-to-band (or band-edge) transitions, near-band-edge emission (NBE), and defect-level emission (DLE) [46]. With an excitation wavelength of 280 nm (Figure 4a), the relevant emission peaks fall into the (ultra-)violet and blue emission regions. In particular, the bluish emission at ~485 nm has been associated with a band edge transition [47]. Change in excitation length from 280 nm to 460 nm values (Figure 4b) allows to highlight in-band transitions due to defect levels, generally attributed to shallow (or surface) oxygen vacancies [46].
The 2Gd-BFO sample shows the lowest photoluminescence emission intensity for both excitation wavelengths. The lower photoluminescence emission intensity is reflected in the lower recombination rate of the photo-generated electron-hole pairs and consequently in more effective photocatalytic activity [40].

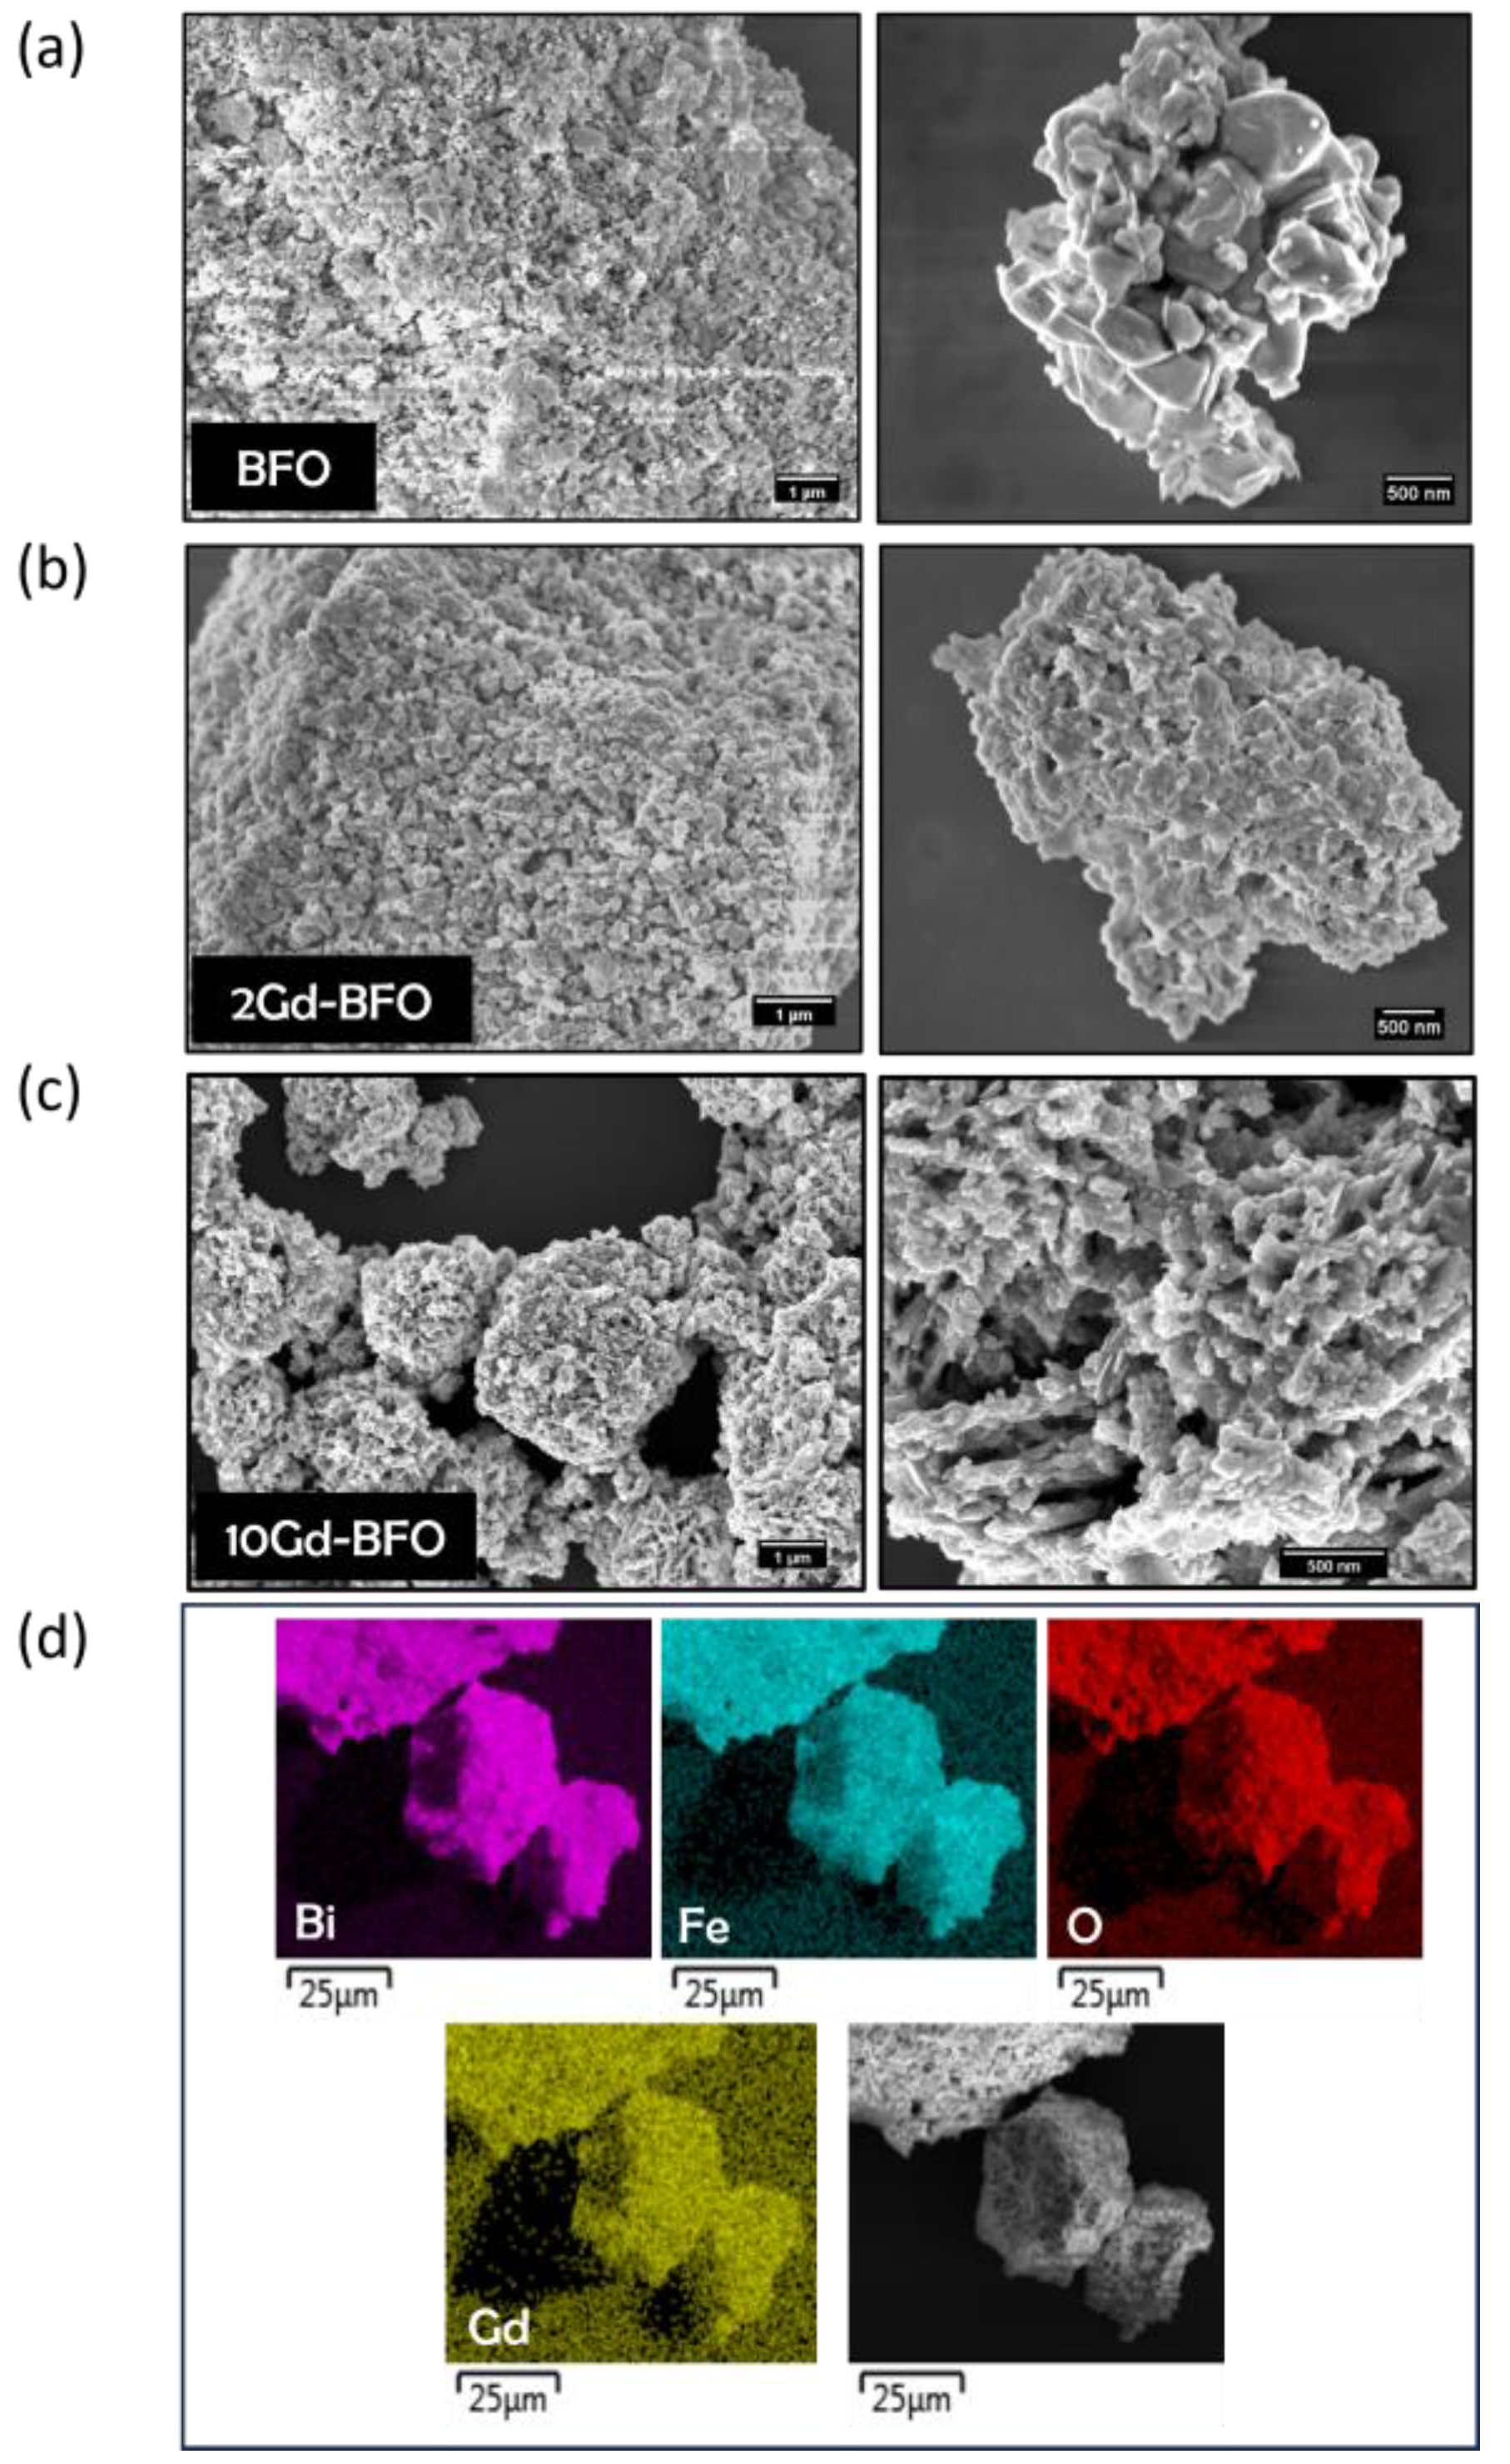
2.1.5. Field Emission Scanning Electron Microscopy (FE-SEM)

Scanning electron microscopy (SEM) was used to investigate the morphology of the powder sample. The analysis indicates that the adopted synthesis led to the formation of irregular hexagonal-shaped nanoparticles. The micrographs of the 10Gd-BFO sample show a material with a different morphology (Figure 5c) that confirms the findings of the XRD analysis. Indeed, especially at high magnifications, nanoparticles with different shapes are clearly distinguishable. An EDX analysis was also conducted on the most active sample, 2Gd-BFO. The map obtained (Figure 5d) shows a uniform distribution of all elements in the sample.

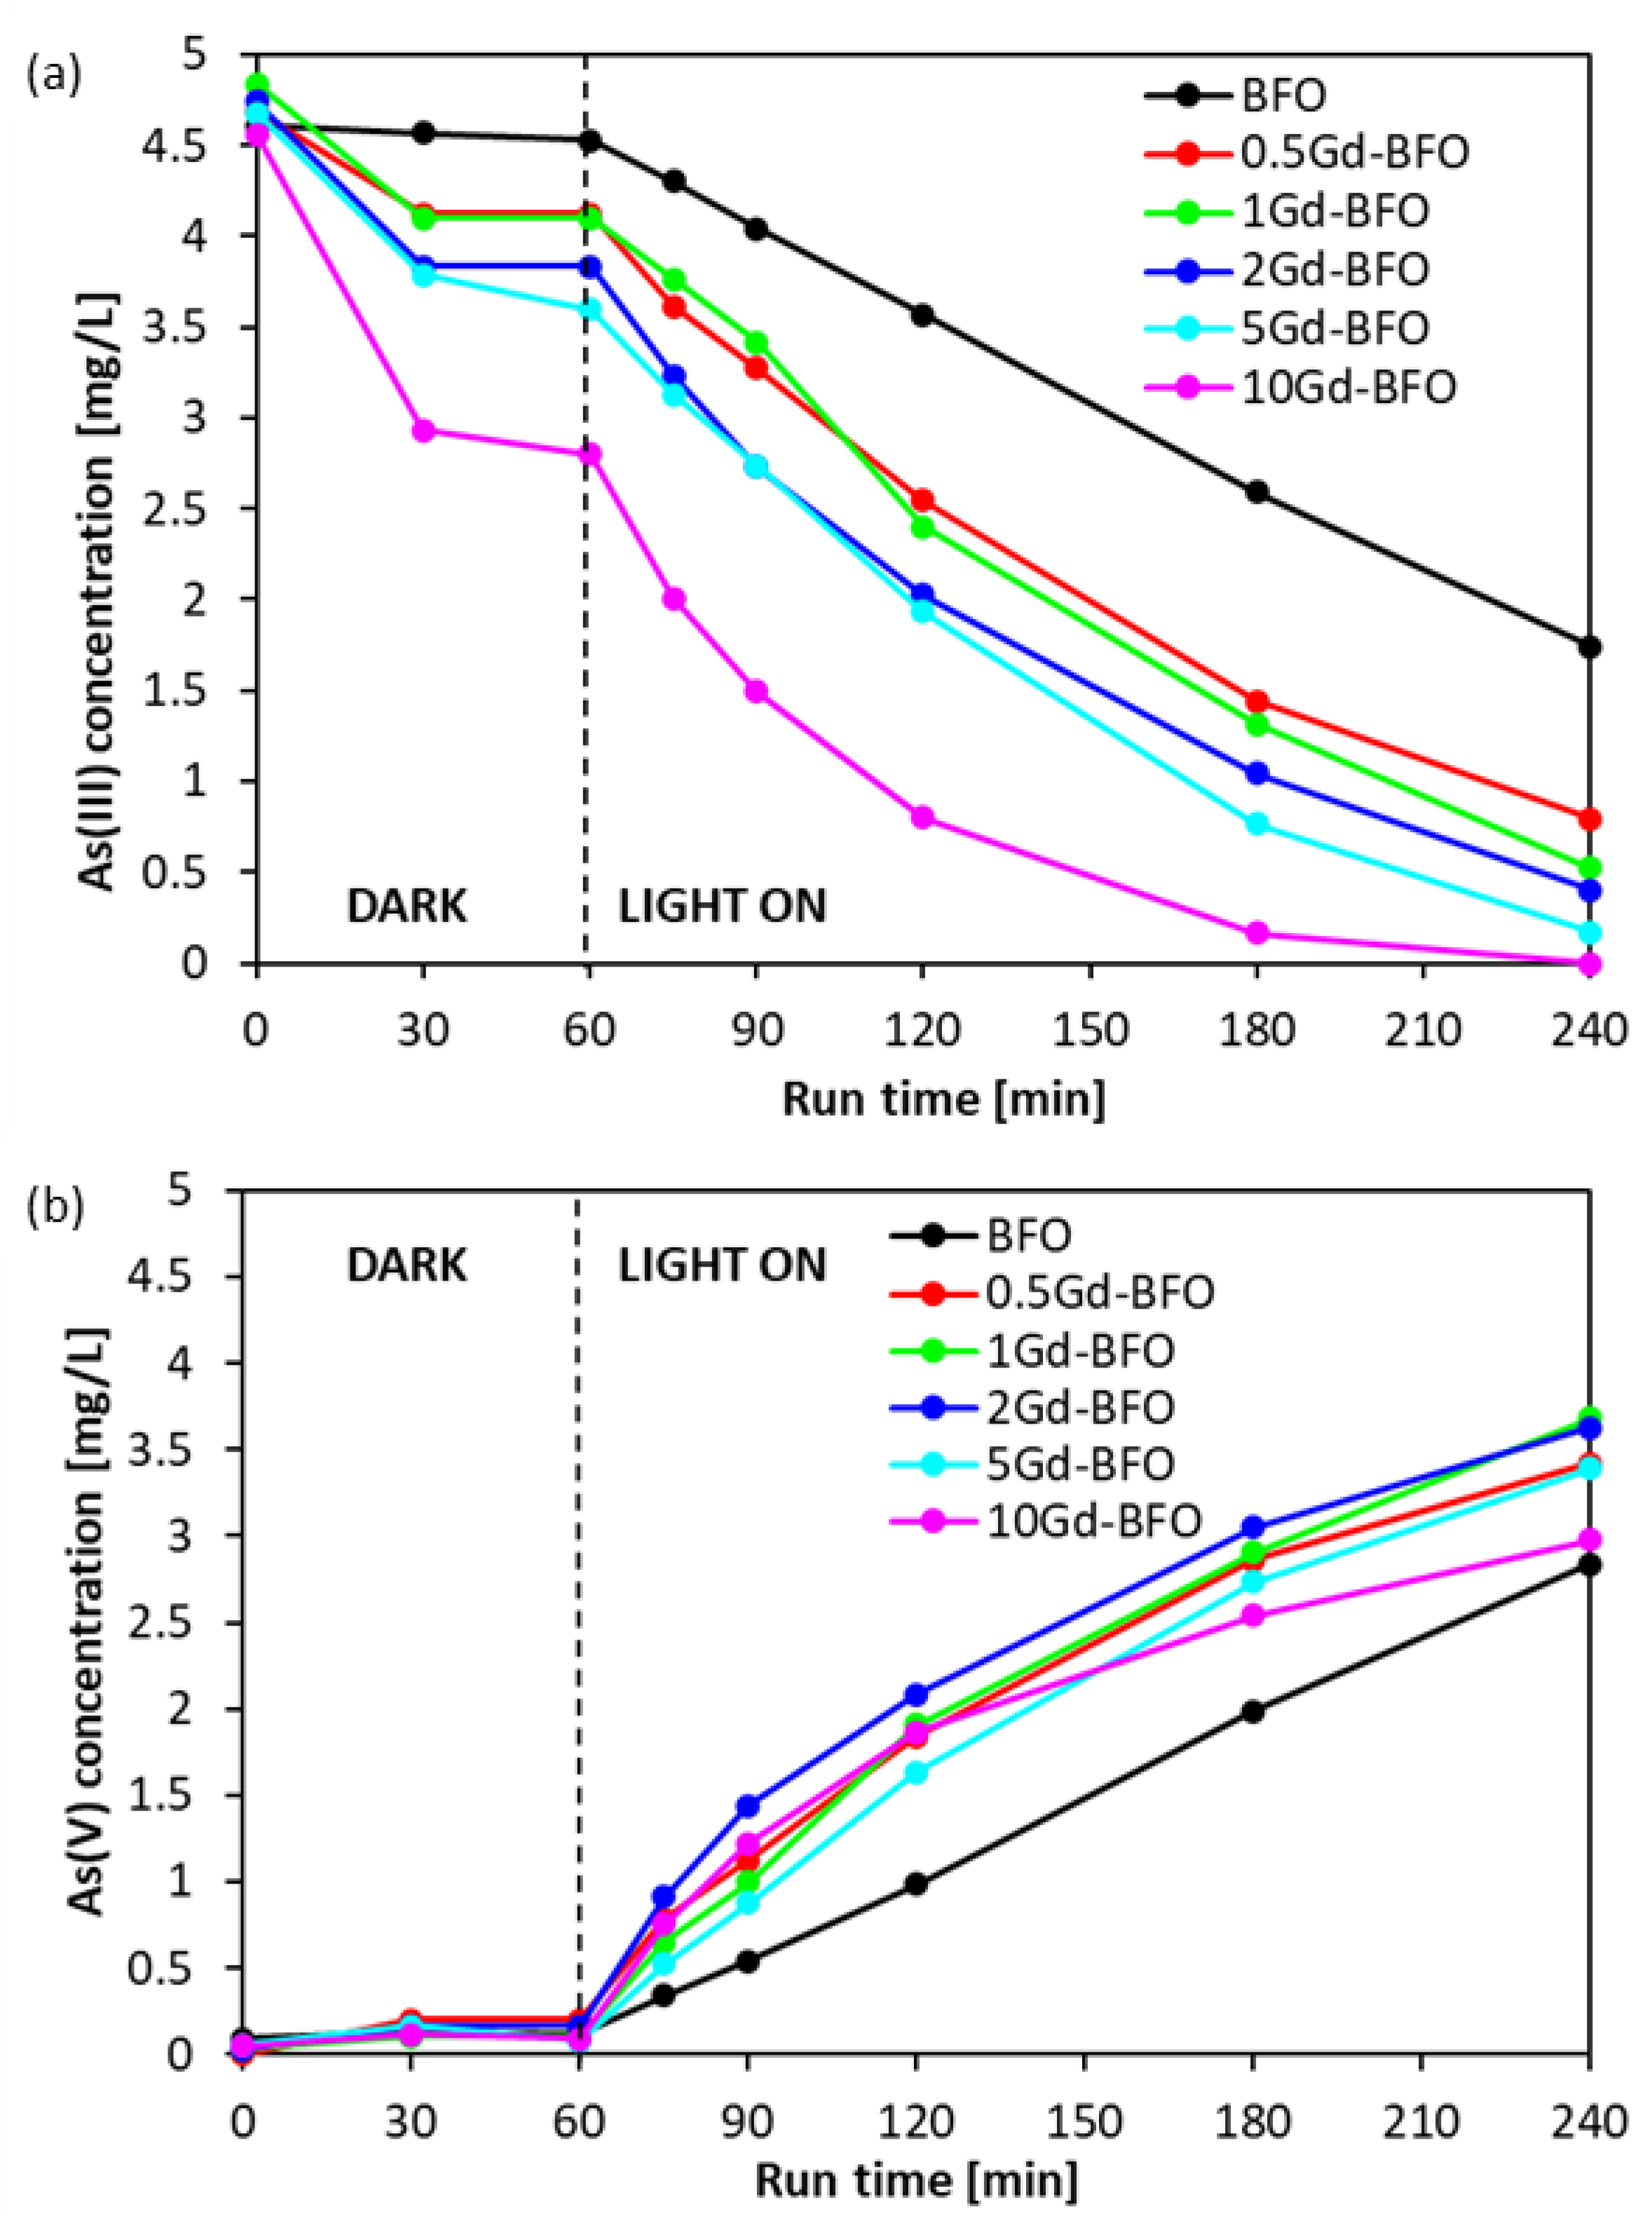
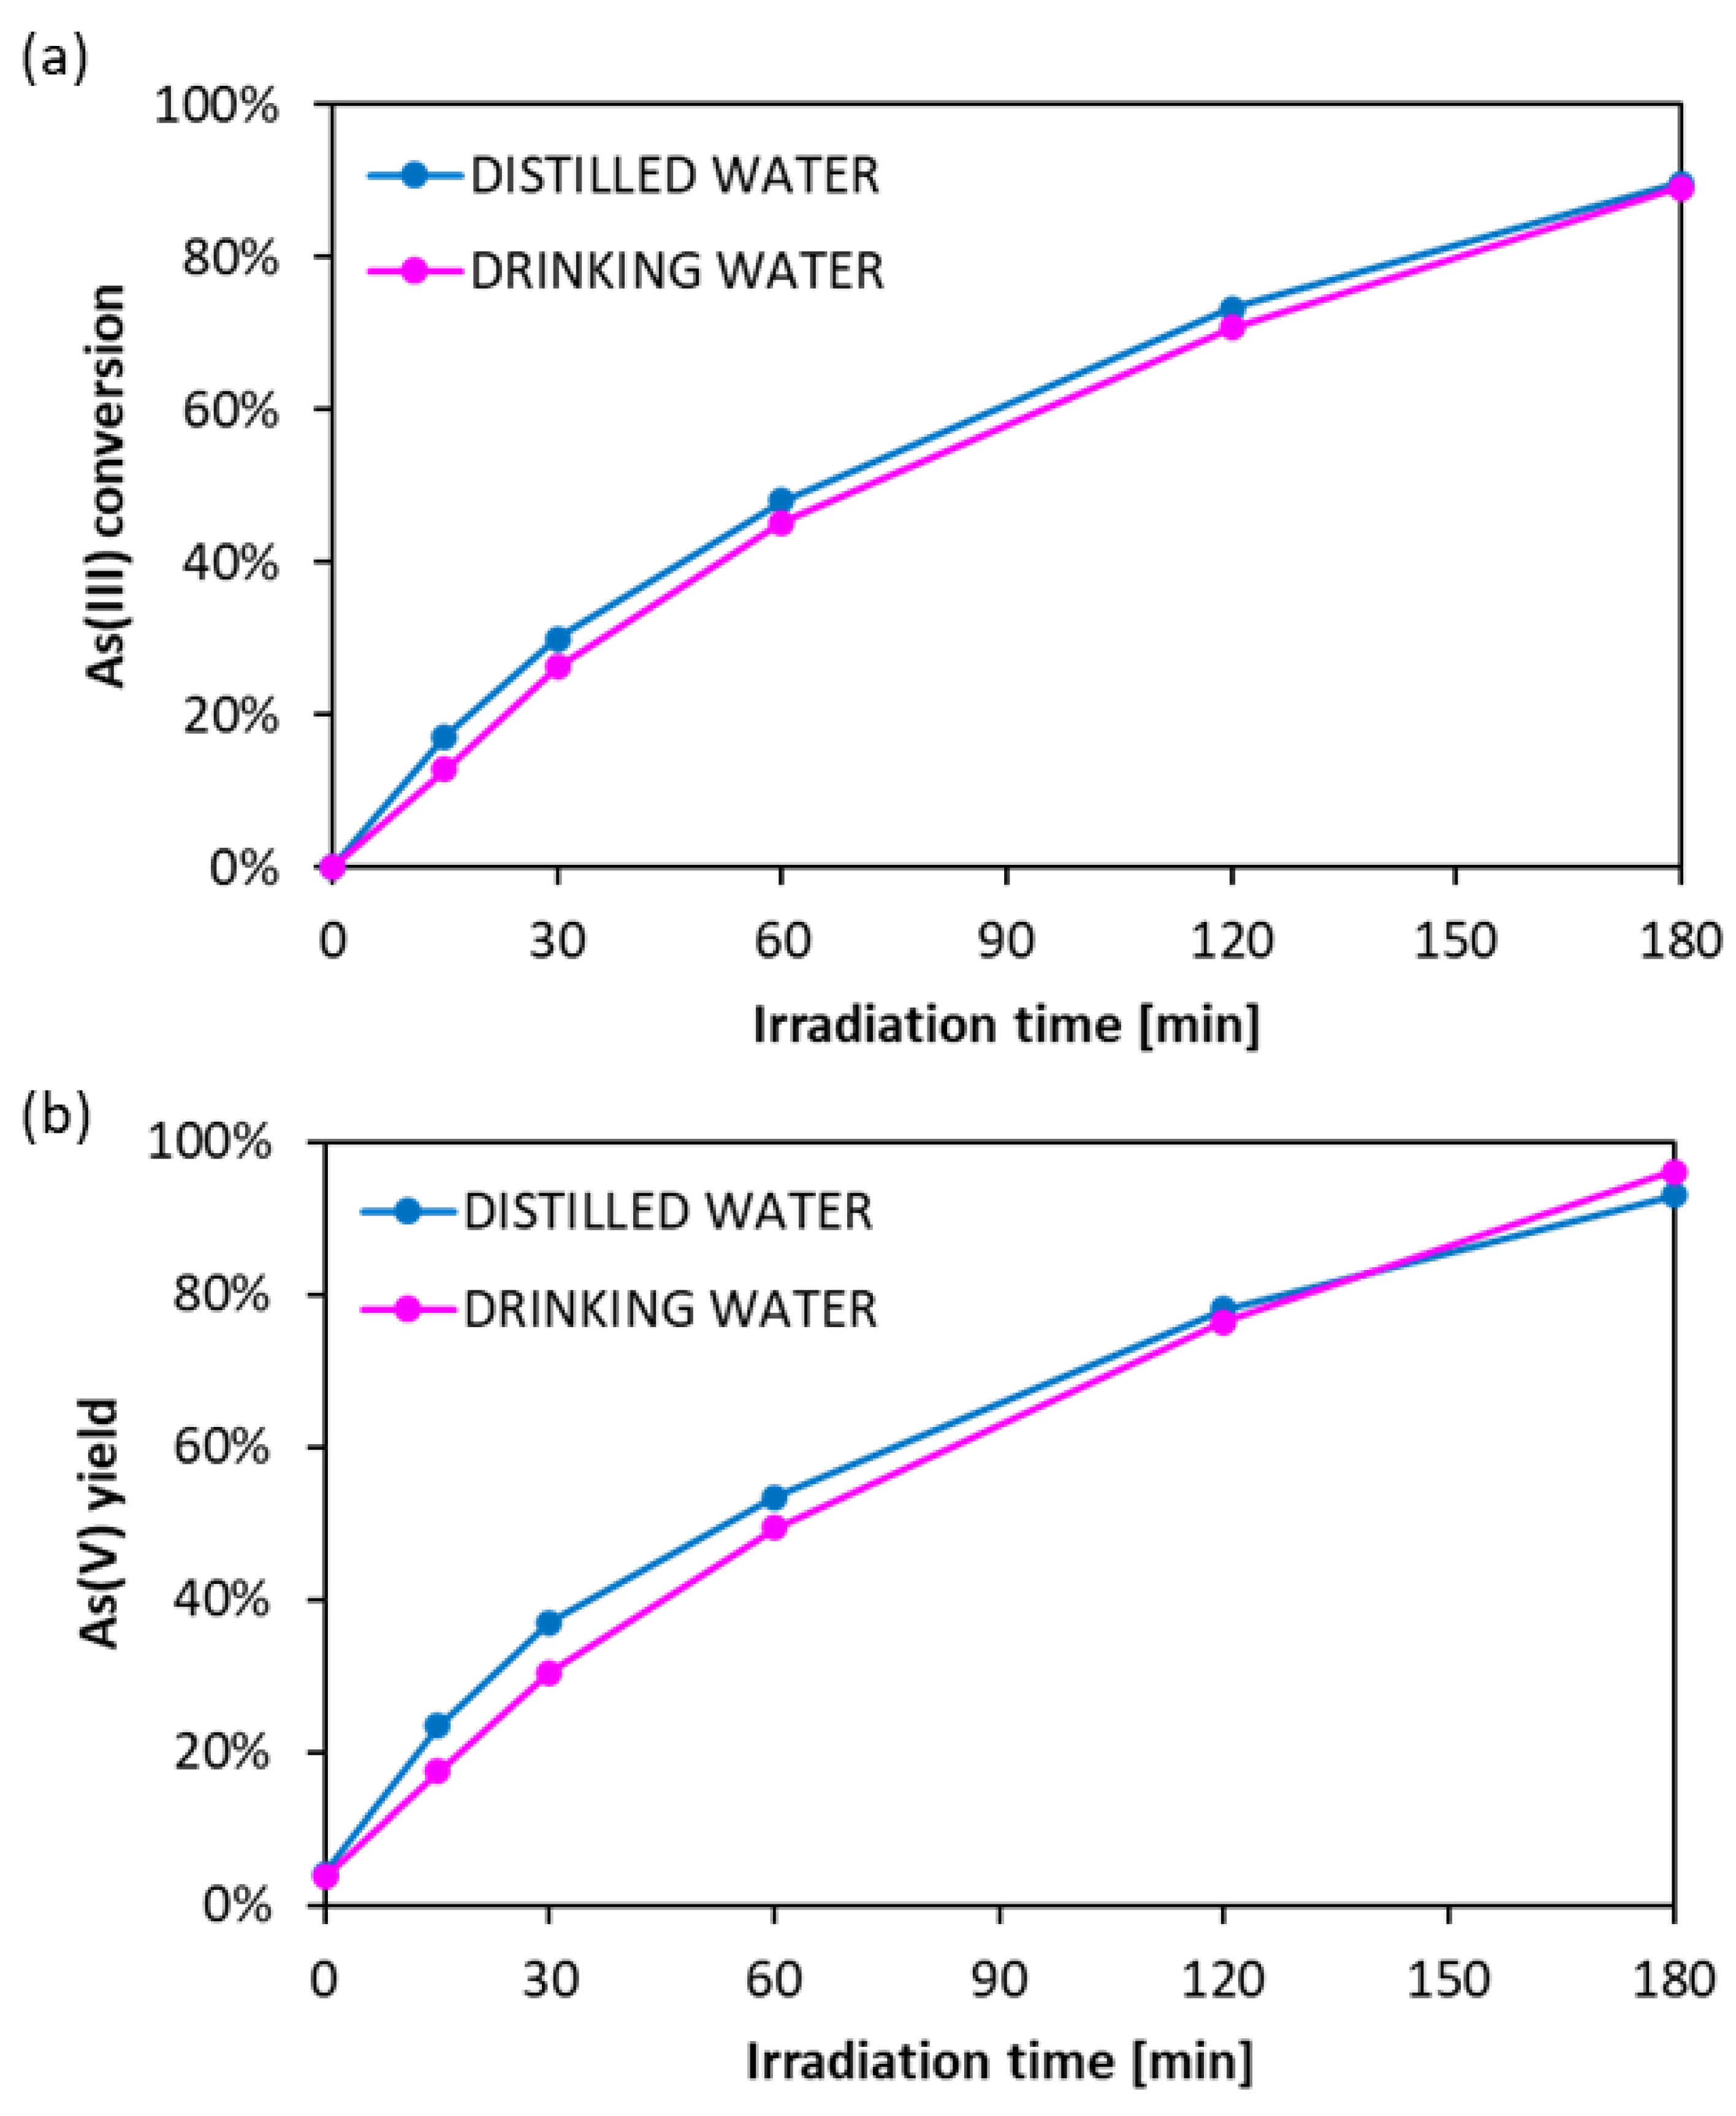
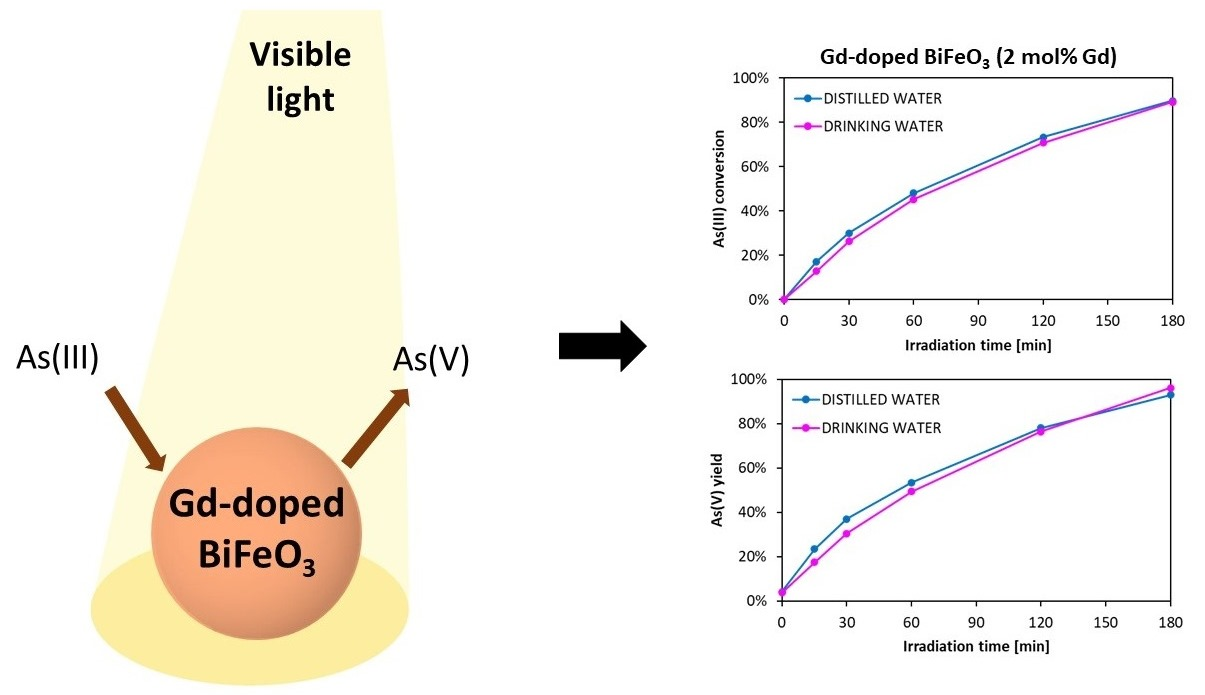
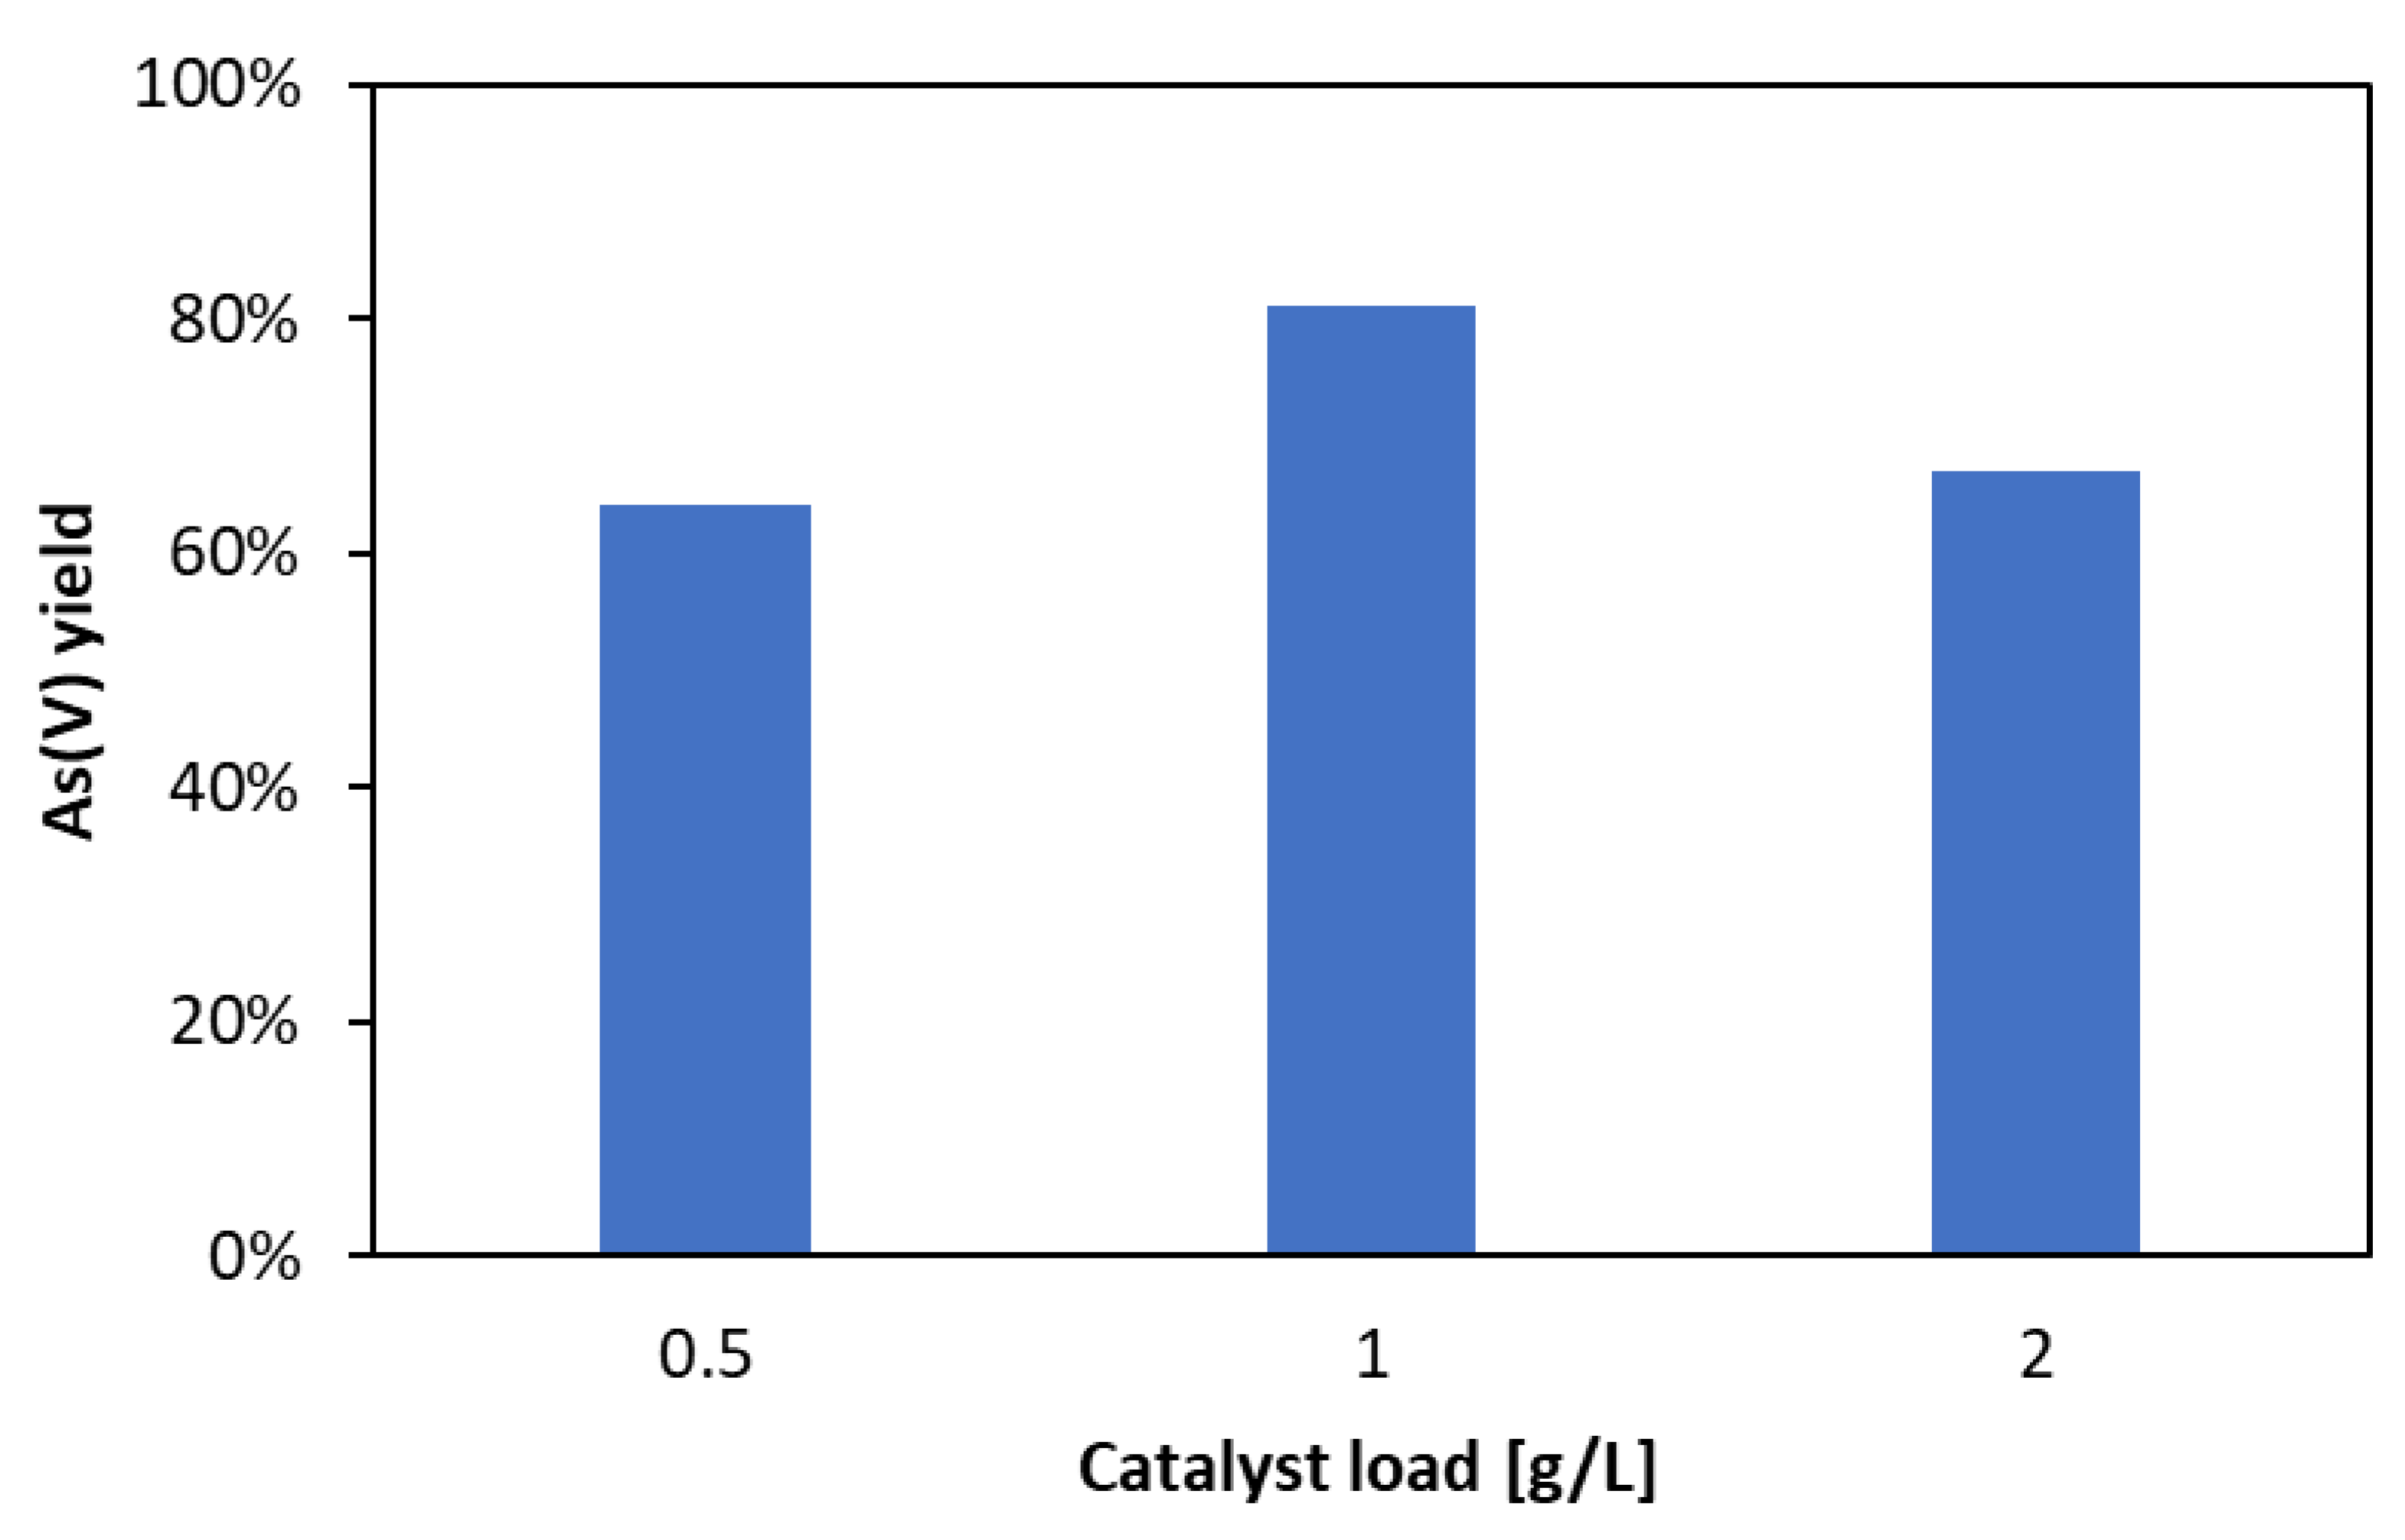
2.2. Photocatalytic Activity Results

Figure 6 displays the behavior of As(III) (Figure 6a) and As(V) concentration (Figure 6b) in the dark phase and under visible light irradiation. All the Gd-doped samples adsorbed As(III) in dark conditions while bare BFO appeared to be ineffective in the adsorption of arsenite (Figure 6a). In particular, the amount of As(III) adsorbed increased by increasing the Gd amount. However, 0.5Gd-BFO and 1Gd-BFO showed a similar behavior during the dark phase, evidencing an As(III) adsorption efficiency of about 8%. On the other hand, the highest As(III) adsorption efficiency (about 35%) was achieved with the 10Gd-BFO sample. Once the light was switched on, all the photocatalysts showed a progressive decrease in As(III) concentration in the aqueous solution. In detail, at fixed irradiation time, the residual As(III) concentration for all the Gd-BFO samples was lower than that observed when bare BFO was used as photocatalyst, indicating that the doping with Gd improved the photocatalytic activity under visible light [38]. Looking at the behavior of As(V) concentration (Figure 6b), it is possible to notice that As(V) was not formed during the dark phase, and it started to be produced only in the presence of visible light. During the irradiation period, all the doped samples showed an As(V) concentration higher than that observed in the presence of bare BFO. In detail, 1Gd-BFO and 2Gd-BFO allowed for achieving the highest As(V) concentration. Considering the comparable band-gap energy values of Gd-BFO samples, the better photocatalytic activity of these two photocatalysts may be explained based on PL results. Indeed, such analysis evidenced that 1Gd-BFO and 2Gd-BFO have a lower e/h+ recombination rate compared with both bare BFO and the other doped photocatalysts. More in detail, the PL analysis also showed that the 2Gd-BFO has an e/h+ recombination rate lower than 1Gd-BFO, reflecting on the As(V) formation rate that resulted slightly higher than that of 1Gd-BFO. However, the enhanced activity of the Gd-BFO photocatalysts did not increase further when the Gd content was increased at values above 2 mol%. Specifically, compared to 2Gd-BFO, 5Gd-BFO and 10Gd-BFO photocatalysts evidenced a lower As(V) concentration, despite their lower band-gap energy values. Possibly, the worsening of photocatalytic As(V) generation rate for Gd amount higher than 2 mol% could be ascribed to the presence of gadolinium oxide species in the 5Gd-BFO and 10Gd-BFO samples (as shown from XRD and Raman results), clearly indicating that not all the Gd amount used in the photocatalysts preparation step was introduced into the BFO lattice.
For this reason, 2 mol% can be considered as the optimal gadolinium content for BiFeO3 doping. The literature data confirmed the enhanced photocatalytic activity of Gd-doped BiFeO3 under visible light in the case of photodegradation of Indigo Carmine and Congo Red dyes, using a Gd amount very similar to that found in our work [39].
Once the optimal percentage of gadolinium was assessed, the influence of the catalyst dosage was studied in the reaction system, by performing experiments with a catalyst dosage of 0.5, 1, and 2 g/L. From Figure 7, it is possible to notice that the As(V) yield increased from 64 to about 81% by increasing the 2Gd-BFO dosage from 0.5 up to 2 g/L.
Over a photocatalyst dosage of 1 g/L, the As(V) yield decreased (about 67% of As(V) yield with a dosage equal to 2 g/L against about 81% As(V) yield achieved with 2 g/L catalyst loading). This last result may be explained by the increased opacity of the aqueous solution, making difficult the penetration of light inside the core of the photoreactor [11]. Therefore, the optimal dosage of photocatalyst was 1 g/L.
Photocatalytic tests in the presence of scavenger molecules (shown in Table 3) were carried out to determine the reactive oxygen species (ROS) that play a significant role in As(III) oxidation under visible light.
Figure 8 shows the behaviors of As(III) conversion (Figure 8) in the presence of the selected scavenger molecules. From the obtained results, it is possible to observe that, by trapping the superoxide and electrons, the photocatalytic efficiency worsened with respect to that observed in the absence of scavengers, evidencing that the main ROS involved in the photocatalytic oxidation of As(III) to As(V) are the photogenerated electrons and superoxide.
It is worthwhile to note that, when the h+ and OH∙ scavengers were added to the solution, the As(III) conversion increased, meaning that the consumption of photo-generated OH∙ and h+ could increase the separation efficiency of photo-generated electron–hole pairs. In this way, more electrons are available for the generation of the superoxide.
The effectiveness of the optimal 2Gd-BFO was also evaluated on drinking water contaminated with 5 mg/L of As(III).
The obtained results are shown in Figure 9 and compared with the test with distilled water. Both As(III) conversion and As(V) yield show a trend similar to the distilled water results. So, 2Gd-BFO is a well-performant photocatalyst for the treatment of drinking water polluted by arsenite.

3. Materials and Methods

3.1. Gd-BFO Preparation

Gadolinium-doped bismuth ferrite (Gd-BFO) has been synthesized by sol-gel method. Iron nitrate nonahydrate [Fe(NO3)3∙9H2O], bismuth nitrate pentahydrate [Bi(NO3)3∙5H2O], and gadolinium chloride hexahydrate [Cl3Gd∙6H2O] are the precursor salts used in the preparation. An amount of 1.66 g of iron nitrate nonahydrate is added to 100 mL of ethanol, and the solution is kept stirred. Once the iron salt is completely dissolved, 1.99 g of bismuth nitrate pentahydrate is added to the solution. When the system is homogeneous, different amounts of gadolinium chloride hexahydrate are added to achieve 0.5/1/2/5/10 mol% of gadolinium in the final samples. The solution is kept stirred and is heated up to 60 °C to facilitate the ethanol evaporation. With the help of a thermocouple, the temperature is monitored so that it is always kept below the boiling point of ethanol. When most of the ethanol is evaporated, the solution is transferred into a crucible and dried at room temperature up to the formation of a gel. The crucible is then placed into a muffle and annealed at 600 °C in static air for 2 h with a heating rate of 20 °C/min. The obtained photocatalysts are named xGd-BFO, where x is the Gd nominal molar percentage.

3.2. Photocatalysts Characterization

Different techniques have been used to characterize the various samples synthesized. The Raman spectra of the samples were recorded with a Dispersive MicroRaman system (Invia, Renishaw, Italy), equipped with a 514 nm laser, in the range of 100–800 cm−1 Raman shift. UV–Vis reflectance spectra (UV–Vis DRS) of powder catalysts were recorded by a Perkin Elmer spectrometer Lambda 35 using an RSA-PE20 reflectance spectroscopy accessory (Labsphere Inc., North Sutton, NH, USA). Band-gap energy of the photocatalysts was determined from Kubelka–Munk function (FR) by plotting (FR × hν)2 vs. hν. To investigate the effect of gadolinium doping on the optical properties of BFO powders, the photoluminescence (PL) spectra were collected by means of a Perkin Elmer Spectrofluorometer LS55 (PerkinElmer, Milan, Italy). The analysis was conducted using two different excitation wavelengths (λex = 285 nm and λex = 460 nm), with spectra recorded in the range of 300–550 nm for the lower excitation and in the range of 500–800 nm for the least excitation wavelength. X-ray powder diffraction (XRD) patterns were collected on an X’Pert Phillips diffractometer (Panalytical, Almelo, The Netherlands), with Cu Kα radiation of 1.541874 Å, to provide information on the crystal structure of the samples (,). The crystallite size (L) was calculated by Scherrer formula: =kλ/βcosθ, where k is a constant equal to 0.90, λ is the X-ray wavelength equal to 0.154 nm, β is the full width at half maximum, and θ is the half diffraction angle. The morphology of synthesized powder was obtained by field emission scanning electron microscopy (FE-SEM). The samples were dispersed in ethanol and then, deposited on a silicon wafer and dried before being analyzed by a Merlin FESEM instrument (Carl-Zeiss AG, Oberkochen, Germany), equipped with an EDX (Energy Dispersive X-ray Analysis) probe (Oxford instruments, Abingdon, UK) for semi-quantitative elemental analysis.

3.3. Photocatalytic Activity Tests

The activity of the prepared photocatalysts was tested on 100 mL of aqueous solutions contaminated with 5 mg/L As(III). The As(III) aqueous solutions were prepared by mixing 1.33 mL of sodium arsenite (0.05 mol/L) in 1 L distilled water. A pyrex batch reactor (Microglass Heim, Italy) (ID = 2.5 cm; height = 18 cm) provided with an air distributor device (QAIR = 150 cm3 STP/min) was employed for photocatalytic tests. A visible LEDs strip (nominal power: 10 W; emission wavelength: 400–700 nm) was used as the light source. The LEDs strip was rolled up the external surface of the photoreactor. The used photocatalyst dosage was 1 g/L. The suspension was left in the dark condition for 1 h before switching the LEDs on for 3 h. The temperature of the solution was monitored during the photocatalytic experiments, and it was equal to 3 about 0 °C during the irradiation time.
To determine the main reactive oxygen species (ROS) involved in the photocatalytic oxidation of As(III) to As(V), additional experiments were performed in the presence of scavenger molecules. In particular, isopropyl alcohol (10 mM), methanol (300 mM), benzoquinone (1 mM), and copper sulfate (1 mM) were used as OH∙, h+, ∙O2 and e scavengers, respectively [48,49,50].
During the activity tests, slurry samples were collected at different times to analyze the As(III) and As(V) concentrations. Before the analytical measurements, the solution samples were filtered through a 0.22 µ CA filter (SIMPLEPURE, Levanto, Italy) to remove solid particles.

3.4. Analytical Measurements

As(III) concentration was evaluated by a spectrophotometric method based on the formation of molybdenum blue reported in the literature [51]. In particular, since the method can only measure the As(V) concentration, As(III) was evaluated as the difference between the total arsenic (Astot) and As(V) concentration. Astot concentration was measured after the solution was treated with a 0.1 M solution of potassium permanganate that oxidized all the residual As(III) to As(V).

4. Conclusions

The results of this study demonstrate that gadolinium is an effective dopant for BiFeO3 to be used in the oxidation of As(III) to As(V) in the presence of visible light. In particular, the amount of gadolinium was optimized, and it was equal to 2 mol%. Interestingly, Gd doping set at 2% molar seemed to be the right compromise to reduce the presence of the additional Bi2Fe4O9 phase and, at the same time, avoid the formation of gadolinium oxide. In addition, the 2Gd-BFO sample showed the lowest charge carrier recombination rate.
2Gd-BFO photocatalyst, with a dosage of 1 g/L, allowed us to obtain the highest photocatalytic activity in terms of As(V) formation. Furthermore, through experiments performed in the presence of scavenger molecules, it was demonstrated that the photo-generated electrons and superoxide were the dominant reactive species in the photocatalytic mechanism. Finally, a photocatalytic test conducted on drinking water polluted by As(III) showed that the optimal 2Gd-BFO photocatalyst oxidized As(III) to As(V) with an efficiency very close to that observed in the presence of distilled water.

Author Contributions

Conceptualization, V.V. and G.I.; methodology, L.C. and S.G.; validation, L.C., G.I. and O.T.; data curation, V.V.; writing—original draft preparation, L.C. and O.T.; writing—review and editing, G.I., V.V. and S.E.; visualization, V.V.; supervision, V.V. and S.E. All authors have read and agreed to the published version of the manuscript.

Funding

This research received no external funding.

Data Availability Statement

Data are contained within the article.

Conflicts of Interest

The authors declare no conflicts of interest.

References

  1. Pezeshki, H.; Hashemi, M.; Rajabi, S.J. Removal of arsenic as a potentially toxic element from drinking water by filtration: A mini review of nanofiltration and reverse osmosis techniques. Heliyon 2023, 9, e14246. [Google Scholar] [CrossRef] [PubMed]
  2. Tchounwou, P.B.; Yedjou, C.G.; Udensi, U.K.; Pacurari, M.; Stevens, J.J.; Patlolla, A.K.; Noubissi, F.; Kumar, S.J. State of the science review of the health effects of inorganic arsenic: Perspectives for future research. Environ. Toxicol. 2019, 34, 188–202. [Google Scholar] [CrossRef]
  3. Zakhar, R.; Derco, J.; Čacho, F.J. An overview of main arsenic removal technologies. Acta Chim. Slovaca 2018, 11, 107–113. [Google Scholar] [CrossRef]
  4. Goering, P.L.; Aposhian, H.V.; Mass, M.J.; Cebrián, M.; Beck, B.D.; Waalkes, M.P. The enigma of arsenic carcinogenesis: Role of metabolism. Toxicol. Sci. Off. J. Soc. Toxicol. 1999, 49, 5–14. [Google Scholar] [CrossRef]
  5. Kartinen, E.O., Jr.; Martin, C.J.J. An overview of arsenic removal processes. Desalination 1995, 103, 79–88. [Google Scholar] [CrossRef]
  6. Liu, R.; Qu, J. Review on heterogeneous oxidation and adsorption for arsenic removal from drinking water. J. Environ. Sci. 2021, 110, 178–188. [Google Scholar] [CrossRef]
  7. Navarrete-Magaña, M.; Estrella-González, A.; May-Ix, L.; Cipagauta-Díaz, S.; Gómez, R. Improved photocatalytic oxidation of arsenic (III) with WO3/TiO2 nanomaterials synthesized by the sol-gel method. J. Environ. Manag. 2021, 282, 111602. [Google Scholar] [CrossRef]
  8. Masuda, H. Arsenic cycling in the Earth’s crust and hydrosphere: Interaction between naturally occurring arsenic and human activities. Prog. Earth Planet. Sci. 2018, 5, 1–11. [Google Scholar] [CrossRef]
  9. Villaescusa, I.; Bollinger, J.-C. Arsenic in drinking water: Sources, occurrence and health effects (a review). Rev. Environ. Sci. Bio/Technol. 2008, 7, 307–323. [Google Scholar] [CrossRef]
  10. Olson, K.R.; Cihacek, L. The fate of Agent Blue, the arsenic based herbicide, used in South Vietnam during the Vietnam War. Open J. Soil Sci. 2020, 10, 518–577. [Google Scholar] [CrossRef]
  11. Chianese, L.; Murcia, J.; Hidalgo, M.; Vaiano, V.; Iervolino, G. Bismuth ferrite as innovative and efficient photocatalyst for the oxidation of As (III) to As (V) under visible light. Mater. Sci. Semicond. Process. 2023, 167, 107801. [Google Scholar] [CrossRef]
  12. ALSamman, M.T.; Sotelo, S.; Sánchez, J.; Rivas, B.L. Arsenic oxidation and its subsequent removal from water: An overview. Sep. Purif. Technol. 2023, 309, 123055. [Google Scholar] [CrossRef]
  13. Ng, K.-S.; Ujang, Z.; Le-Clech, P. Arsenic removal technologies for drinking water treatment. Rev. Environ. Sci. Bio/Technol. 2004, 3, 43–53. [Google Scholar] [CrossRef]
  14. Alka, S.; Shahir, S.; Ibrahim, N.; Ndejiko, M.J.; Vo, D.-V.N.; Abd Manan, F. Arsenic removal technologies and future trends: A mini review. J. Clean. Prod. 2021, 278, 123805. [Google Scholar] [CrossRef]
  15. Zhao, Y.; Qiu, W.; Sun, Z. Removal of arsenic from flue gas using NaClO/NaClO2 complex absorbent. Chem. Eng. Res. Des. 2019, 144, 505–511. [Google Scholar] [CrossRef]
  16. Li, N.; Fan, M.; Van Leeuwen, J.; Saha, B.; Yang, H.; Huang, C.P. Oxidation of As(III) by potassium permanganate. J. Environ. Sci. 2007, 19, 783–786. [Google Scholar] [CrossRef] [PubMed]
  17. Sorlini, S.; Gialdini, F. Conventional oxidation treatments for the removal of arsenic with chlorine dioxide, hypochlorite, potassium permanganate and monochloramine. Water Res. 2010, 44, 5653–5659. [Google Scholar] [CrossRef] [PubMed]
  18. Gude, J.; Rietveld, L.; Van Halem, D.J. As (III) oxidation by MnO2 during groundwater treatment. Water Res. 2017, 111, 41–51. [Google Scholar] [CrossRef] [PubMed]
  19. Pettine, M.; Campanella, L.; Millero, F.J. Arsenite oxidation by H2O2 in aqueous solutions. Geochim. Cosmochim. Acta 1999, 63, 2727–2735. [Google Scholar] [CrossRef]
  20. Ahmed, S.N.; Haider, W.J. Heterogeneous photocatalysis and its potential applications in water and wastewater treatment: A review. Nanotechnology 2018, 29, 342001. [Google Scholar] [CrossRef]
  21. Liu, H.; Wang, C.; Wang, G. Photocatalytic Advanced Oxidation Processes for Water Treatment: Recent Advances and Perspective. Chem. Asian J. 2020, 15, 3239–3253. [Google Scholar] [CrossRef] [PubMed]
  22. Gowland, D.C.A.; Robertson, N.; Chatzisymeon, E. Photocatalytic Oxidation of Natural Organic Matter in Water. Water 2021, 13, 288. [Google Scholar] [CrossRef]
  23. Loddo, V.; Bellardita, M.; Camera-Roda, G.; Parrino, F.; Palmisano, L. Chapter 1—Heterogeneous Photocatalysis: A Promising Advanced Oxidation Process. In Current Trends and Future Developments on (Bio-) Membranes; Basile, A., Mozia, S., Molinari, R., Eds.; Elsevier: Amsterdam, The Netherlands, 2018; pp. 1–43. [Google Scholar]
  24. Tammaro, O.; Paparo, R.; Chianese, M.; Ritacco, I.; Caporaso, L.; Camellone, M.F.; Masenelli, B.; Lamirand, A.D.; Bluet, J.-M.; Fontana, M.; et al. Reverse micelle strategy for effective substitutional Fe-doping in small-sized CeO2 nanocrystals: Assessment of adsorption and photodegradation efficiency of ibuprofen under visible light. Chem. Eng. J. 2024, 479, 147909. [Google Scholar] [CrossRef]
  25. Tammaro, O.; Morante, N.; Marocco, A.; Fontana, M.; Castellino, M.; Barrera, G.; Allia, P.; Tiberto, P.; Arletti, R.; Fantini, R.; et al. The beneficial role of nano-sized Fe3O4 entrapped in ultra-stable Y zeolite for the complete mineralization of phenol by heterogeneous photo-Fenton under solar light. Chemosphere 2023, 345, 140400. [Google Scholar] [CrossRef] [PubMed]
  26. Armaković, S.J.; Savanović, M.M.; Armaković, S. Titanium Dioxide as the Most Used Photocatalyst for Water Purification: An Overview. Catalysts 2023, 13, 26. [Google Scholar] [CrossRef]
  27. Choi, W.; Yeo, J.; Ryu, J.; Tachikawa, T.; Majima, T. Photocatalytic oxidation mechanism of As (III) on TiO2: Unique role of As (III) as a charge recombinant species. Environ. Sci. Technol. 2010, 44, 9099–9104. [Google Scholar] [CrossRef]
  28. Garza-Arévalo, J.; García-Montes, I.; Reyes, M.H.; Guzmán-Mar, J.; Rodríguez-González, V.; Reyes, L.H. Fe doped TiO2 photocatalyst for the removal of As (III) under visible radiation and its potential application on the treatment of As-contaminated groundwater. Mater. Res. Bull. 2016, 73, 145–152. [Google Scholar] [CrossRef]
  29. Imparato, C.; Bonifazzi, M.M.; D’Errico, G.; Bifulco, A.; Tammaro, O.; Esposito, S.; Aronne, A.; Pirozzi, D. Dark and sunlight-driven dye degradation over a TiO2–dibenzoylmethane hybrid xerogel. Colloids Surf. A Physicochem. Eng. Asp. 2024, 684, 133148. [Google Scholar] [CrossRef]
  30. Vaiano, V.; Iervolino, G. Photocatalytic removal of methyl orange azo dye with simultaneous hydrogen production using ru-modified zno photocatalyst. Catalysts 2019, 9, 964. [Google Scholar] [CrossRef]
  31. Tian, C.; Zhang, Q.; Wu, A.; Jiang, M.; Liang, Z.; Jiang, B.; Fu, H. Cost-effective large-scale synthesis of ZnO photocatalyst with excellent performance for dye photodegradation. Chem. Commun. 2012, 48, 2858–2860. [Google Scholar] [CrossRef]
  32. Irfan, S.; Zhuanghao, Z.; Li, F.; Chen, Y.-X.; Liang, G.-X.; Luo, J.-T.; Ping, F. Critical review: Bismuth ferrite as an emerging visible light active nanostructured photocatalyst. J. Mater. Res. Technol. 2019, 8, 6375–6389. [Google Scholar] [CrossRef]
  33. Soltani, T.; Entezari, M.H. Photolysis and photocatalysis of methylene blue by ferrite bismuth nanoparticles under sunlight irradiation. J. Mol. Catal. A Chem. 2013, 377, 197–203. [Google Scholar] [CrossRef]
  34. Soltani, T.; Entezari, M. Solar photocatalytic degradation of RB5 by ferrite bismuth nanoparticles synthesized via ultrasound. Ultrason. Sonochemistry 2013, 20, 1245–1253. [Google Scholar] [CrossRef]
  35. Wang, F.; Chen, D.; Zhang, N.; Wang, S.; Qin, L.; Sun, X.; Huang, Y. Oxygen vacancies induced by zirconium doping in bismuth ferrite nanoparticles for enhanced photocatalytic performance. J. Colloid Interface Sci. 2017, 508, 237–247. [Google Scholar] [CrossRef]
  36. Brahma, S.S.; Nanda, J.; Sahoo, N.K.; Naik, B.; Das, A.A. Phase transition, electronic transitions and visible light driven enhanced photocatalytic activity of Eu–Ni co-doped bismuth ferrite nanoparticles. J. Phys. Chem. Solids 2021, 153, 110018. [Google Scholar] [CrossRef]
  37. Irfan, S.; Shen, Y.; Rizwan, S.; Wang, H.C.; Khan, S.B.; Nan, C.W. Band-gap engineering and enhanced photocatalytic activity of Sm and Mn doped BiFeO3 nanoparticles. J. Am. Ceram. Soc. 2017, 100, 31–40. [Google Scholar] [CrossRef]
  38. Guo, R.; Fang, L.; Dong, W.; Zheng, F.; Shen, M. Enhanced photocatalytic activity and ferromagnetism in Gd doped BiFeO3 nanoparticles. J. Phys. Chem. C 2010, 114, 21390–21396. [Google Scholar] [CrossRef]
  39. Basavarajappa, P.S.; Seethya, B.N.H.; Ganganagappa, N.; Eshwaraswamy, K.B.; Kakarla, R.R. Enhanced photocatalytic activity and biosensing of gadolinium substituted BiFeO3 nanoparticles. ChemistrySelect 2018, 3, 9025–9033. [Google Scholar] [CrossRef]
  40. Irfan, S.; Rizwan, S.; Shen, Y.; Li, L.; Asfandiyar; Butt, S.; Nan, C.-W. The gadolinium (Gd3+) and Tin (Sn4+) Co-doped BiFeO3 nanoparticles as new solar light active photocatalyst. Sci. Rep. 2017, 7, 42493. [Google Scholar] [CrossRef]
  41. Anthoniappen, J.; Chang, W.S.; Soh, A.K.; Tu, C.-S.; Vashan, P.; Lim, F.S. Electric field induced nanoscale polarization switching and piezoresponse in Sm and Mn co-doped BiFeO3 multiferroic ceramics by using piezoresponse force microscopy. Acta Mater. 2017, 132, 174–181. [Google Scholar] [CrossRef]
  42. Kumar, M.; Chauhan, S.; Pandey, H. Effect of Gd3+ substitution on structural, morphological, and magnetic properties of BiFeO3 nanoparticles. J. Sol-Gel Sci. Technol. 2024, 109, 272–282. [Google Scholar] [CrossRef]
  43. Zhang, N.; Chen, D.; Niu, F.; Wang, S.; Qin, L.; Huang, Y. Enhanced visible light photocatalytic activity of Gd-doped BiFeO3 nanoparticles and mechanism insight. Sci. Rep. 2016, 6, 26467. [Google Scholar] [CrossRef] [PubMed]
  44. Vishwakarma, A.K.; Tripathi, P.; Srivastava, A.; Sinha, A.; Srivastava, O. Band gap engineering of Gd and Co doped BiFeO3 and their application in hydrogen production through photoelectrochemical route. Int. J. Hydrog. Energy 2017, 42, 22677–22686. [Google Scholar] [CrossRef]
  45. Chen, X.; Shen, S.; Guo, L.; Mao, S.S. Semiconductor-based photocatalytic hydrogen generation. Chem. Rev. 2010, 110, 6503–6570. [Google Scholar] [CrossRef] [PubMed]
  46. Pandey, D.K.; Modi, A.; Pandey, P.; Gaur, N. Variable excitation wavelength photoluminescence response and optical absorption in BiFeO3 nanostructures. J. Mater. Sci. Mater. Electron. 2017, 28, 17245–17253. [Google Scholar] [CrossRef]
  47. Anshul, A.; Kumar, A.; Gupta, B.K.; Kotnala, R.; Scott, J.; Katiyar, R. Photoluminescence and time-resolved spectroscopy in multiferroic BiFeO3: Effects of electric fields and sample aging. Appl. Phys. Lett. 2013, 102, 222901. [Google Scholar] [CrossRef]
  48. Alam, U.; Shah, T.A.; Khan, A.; Muneer, M. One-pot ultrasonic assisted sol-gel synthesis of spindle-like Nd and V codoped ZnO for efficient photocatalytic degradation of organic pollutants. Sep. Purif. Technol. 2019, 212, 427–437. [Google Scholar] [CrossRef]
  49. Gekko, H.; Hashimoto, K.; Kominami, H. Photocatalytic reduction of nitrite to dinitrogen in aqueous suspensions of metal-loaded titanium (IV) oxide in the presence of a hole scavenger: An ensemble effect of silver and palladium co-catalysts. Phys. Chem. Chem. Phys. 2012, 14, 7965–7970. [Google Scholar] [CrossRef] [PubMed]
  50. Xu, T.; Kamat, P.V.; O’Shea, K.E. Mechanistic evaluation of arsenite oxidation in TiO2 assisted photocatalysis. J. Phys. Chem. A 2005, 109, 9070–9075. [Google Scholar] [CrossRef]
  51. Lenoble, V.; Deluchat, V.; Serpaud, B.; Bollinger, J.-C. Arsenite oxidation and arsenate determination by the molybdene blue method. Talanta 2003, 61, 267–276. [Google Scholar] [CrossRef]
Figure 1. XRD pattern of Gd-doped BFO and pure BFO samples.
Catalysts 14 00258 g001
Figure 2. Raman spectra of the prepared samples.
Catalysts 14 00258 g002
Figure 3. Tauc plots for estimation of optical band-gap of the prepared photocatalysts. The intersection of the dashed lines with the x-axis gives the value of the optical band-gap.
Catalysts 14 00258 g003
Figure 4. Photoluminescence (PL) emission spectra of Gd-doped BFO and pure BFO samples for (a) excitation wavelength of 280 nm and (b) excitation wavelength of 460 nm.
Catalysts 14 00258 g004
Figure 5. Scanning electron microscopy images at low (left) and high (right) magnification of nanostructured samples (a) BFO, (b) 2Gd-BFO, and (c) 10Gd-BFO. (d) SEM-EDX elemental mapping for Bi, Fe, O, and Gd elements on the 2Gd-BFO powder.
Catalysts 14 00258 g005
Figure 6. Behavior of (a) As(III) and (b) As(V) concentration as a function of run time for all the tested photocatalysts.
Catalysts 14 00258 g006
Figure 7. Influence of 2Gd-BFO photocatalyst dosage on As(V) yield after 180 min of irradiation.
Catalysts 14 00258 g007
Figure 8. Behavior of As(III) conversion as a function of irradiation time during the photocatalytic tests in the presence of scavenger molecules.
Catalysts 14 00258 g008
Figure 9. Results of the photocatalytic activity on drinking water sample compared with the photocatalytic activity results with distilled water: (a) As(III) conversion, (b) As(V) yield.
Catalysts 14 00258 g009
Table 1. Structural and textural parameters of the prepared samples.
SampleFWHMCrystallite Size (nm)
BFO32.02330.12068.9
32.34550.11969.5
0.5Gd-BFO31.95120.13362.3
32.27270.12466.7
1Gd-BFO32.07810.14357.8
32.39550.129064.2
2Gd-BFO32.04780.15254.7
32.36480.13660.8
5Gd-BFO---
10Gd-BFO---
Table 2. Band-gap value for each sample evaluated from the Tauc plot reported in Figure 2.
SampleBand-Gap [eV]
BFO2.21
0.5Gd-BFO2.21
1Gd-BFO2.18
2Gd-BFO2.17
5Gd-BFO2.07
10Gd-BFO2.07
Table 3. List of radical scavengers used in the analysis.
Radical ScavengerSubtracted SpeciesConcentration
Isopropyl alcoholOH∙quencher10 mM
Benzoquinone∙O2 quencher1 mM
Methanolh+ quencher300 mM
Copper Sulfatee quencher1 mM
Disclaimer/Publisher’s Note: The statements, opinions and data contained in all publications are solely those of the individual author(s) and contributor(s) and not of MDPI and/or the editor(s). MDPI and/or the editor(s) disclaim responsibility for any injury to people or property resulting from any ideas, methods, instructions or products referred to in the content.

