Article

Investigation into the Exciton Binding Energy of Carbon Nitrides on Band Structure and Carrier Concentration through the Photoluminescence Effect

1
State Key Laboratory of Photocatalysis on Energy and Environment, College of Chemistry, Fuzhou University, Fuzhou 350108, China
2
Fujian Provincial Key Laboratory of Theoretical and Computational Chemistry, Xiamen University, Xiamen 361005, China
*
Author to whom correspondence should be addressed.
Catalysts 2024, 14(4), 262; https://doi.org/10.3390/catal14040262
Submission received: 1 March 2024 / Revised: 9 April 2024 / Accepted: 11 April 2024 / Published: 15 April 2024
(This article belongs to the Special Issue Application of Photocatalysts in Air Pollution)

Abstract

:
Carbon nitrides form a series of polymer semiconductors popular in photocatalysis. In the course of photoresponse, the separation of light-induced electron–hole pairs is one of the critical factors that affect the conversion rate from photoenergy to chemical substance. Exciton binding energy ( E b ) is treated as a classical parameter to evaluate the barrier of exciton dissociation. In this work, we study the electronic and optical nature of two specific members of the carbon nitride family, polymeric carbon nitride (melon) and crystallized poly(triazine imide) (PTI/Li+Cl) by employing the photoluminescence spectra and density functional theory (DFT) calculations based on the Wannier-Mott exciton module. The results of self-consistent GW computation were applied. The measurement of photoluminescence spectra, by which exciton binding energies are estimated, is likewise discussed. Generally, compared with the results calculated by GW-BSE, the DFT results based on the Wannier-Mott model are closer to the experimental values. From a materials perspective, on the other hand, the exciton binding energy of the melon is lower than that of PTI/Li+Cl.

1. Introduction

Carbon nitride is a novel polymeric semiconductor in the field of photosynthesis [1,2]. However, the poor understanding of its formation process and long-range structure has limited researchers to purposefully controlling and modifying the reactivities of these materials, as well as making the theoretical simulation deviate from the experiment results [3,4]. Two relatively convincing carbon nitride structures, respectively containing two typical building blocks, have generally been explored in the literature: heptazine-based amorphous polymeric carbon nitride (melon) and triazine-based highly crystalline structure poly(triazine imide) (PTI/Li+Cl) [5,6,7] (Figure S1). During the photoresponse procedure, light absorption is the very first step including the intrinsic absorption of the non-excited state and the exciton absorption. The relatively free motion of interrelated electron–hole pairs can be described as neutral quasiparticles using the effective mass approximation in the Schrodinger equation. The Coulomb binding between them will lower the overall energy of the system, which usually performs as impurity doping of energy levels within the band gap. Therefore, the experimentally measured optical bandgap (denoted as E g o p t ) is generally slightly smaller than the electronic band gap (denoted as E g e l ):
E g o p t = E g e l E b
where E b is the binding energy representing the Coulomb interaction between the excitons. The main feature of this pattern of excitation is the absence of observable photoconductivity, since the electron is not raised to the conduction band. A high exciton binding energy is not favorable in photoreaction, for the reaction activity is the appearance of competition between photo or photothermal conversion, photochemical conversion and other factors. A puzzling phenomenon is that the binding energy can vary from several meV to ~100 meV, even structurally and electronically familiar materials can show disparately quantitative values. This might be caused both by obstacles in experimental accuracy and by the lack of an appropriate theoretical description of the exciton energy structure. When electron–hole pairs are delocalized over several unit cells, which reflect a relatively large dielectric constant, they can be empirically classified as Wannier-Mott excitons. In contrast, a small dielectric constant leading to weak Coulomb interaction between electrons and holes would be a fit for Frenkel excitons which typically exist in organic molecules composed of aromatic units or the d-d orbital excitations in transition metal compounds. It is suitable to describe carbon nitrides as belonging to the Wannier model due to the magnitude of the exciton binding energy and the exciton radius [8,9]. The value of E b can be inferred from the temperature-dependent photoluminescence (TDPL), assuming the depopulation of photogenerated excitons is dominated by the thermal dissociation and radiative spontaneous emission process [10]. For a hydrogenic Wannier model, two main factors have to be considered: the reduced effective mass of the single quasi-particle and the dielectric function varying with evaluation of the shielding effect between electron–hole pairs and their polarizability.
Optical properties usually relate to the response of electrons to an external field, the effective mass approximation inductively describes the electric field where the quasi-particles of the system are submerged, so the E b of Wannier excitons naturally contains the effective mass term. The effective masses were commonly obtained by fitting the bottom of the conduction band (for the effective mass of the electron) and the top of the valence band (for the effective mass of the hole). In some cases, the influence of carrier concentration is not negligible, optical effective mass is proposed to take this factor into consideration as well as the nonparabolicity and anisotropy of the bands upon the Fermi level. In other words, the effective mass computes a statistical average of the effective mass of each k-point with corresponding Fermi–Dirac functions as weighting coefficients.
In this work, the exciton binding energy of typical carbon nitride materials is calculated by the DFT based on hydrogenic Wannier model and the first principles method based on Bethe–Salpeter equation (BSE) assisted by GW approximation. The E b of the material is determined by fitting the photoluminescence intensity at a series of temperatures. The simulated E b is generally larger than the actual measurements whichever calculating method is used. Further comparison is carried out to test whether the factor in the model is reliable, as well as to judge the rationality of the model itself. In the calculations, the optical properties of single and multiple layers are hardly discernable from each other, which indicate the excitation behaviors might somehow be traced back to certain basic building blocks of different carbon nitrides.

2. Results and Discussion

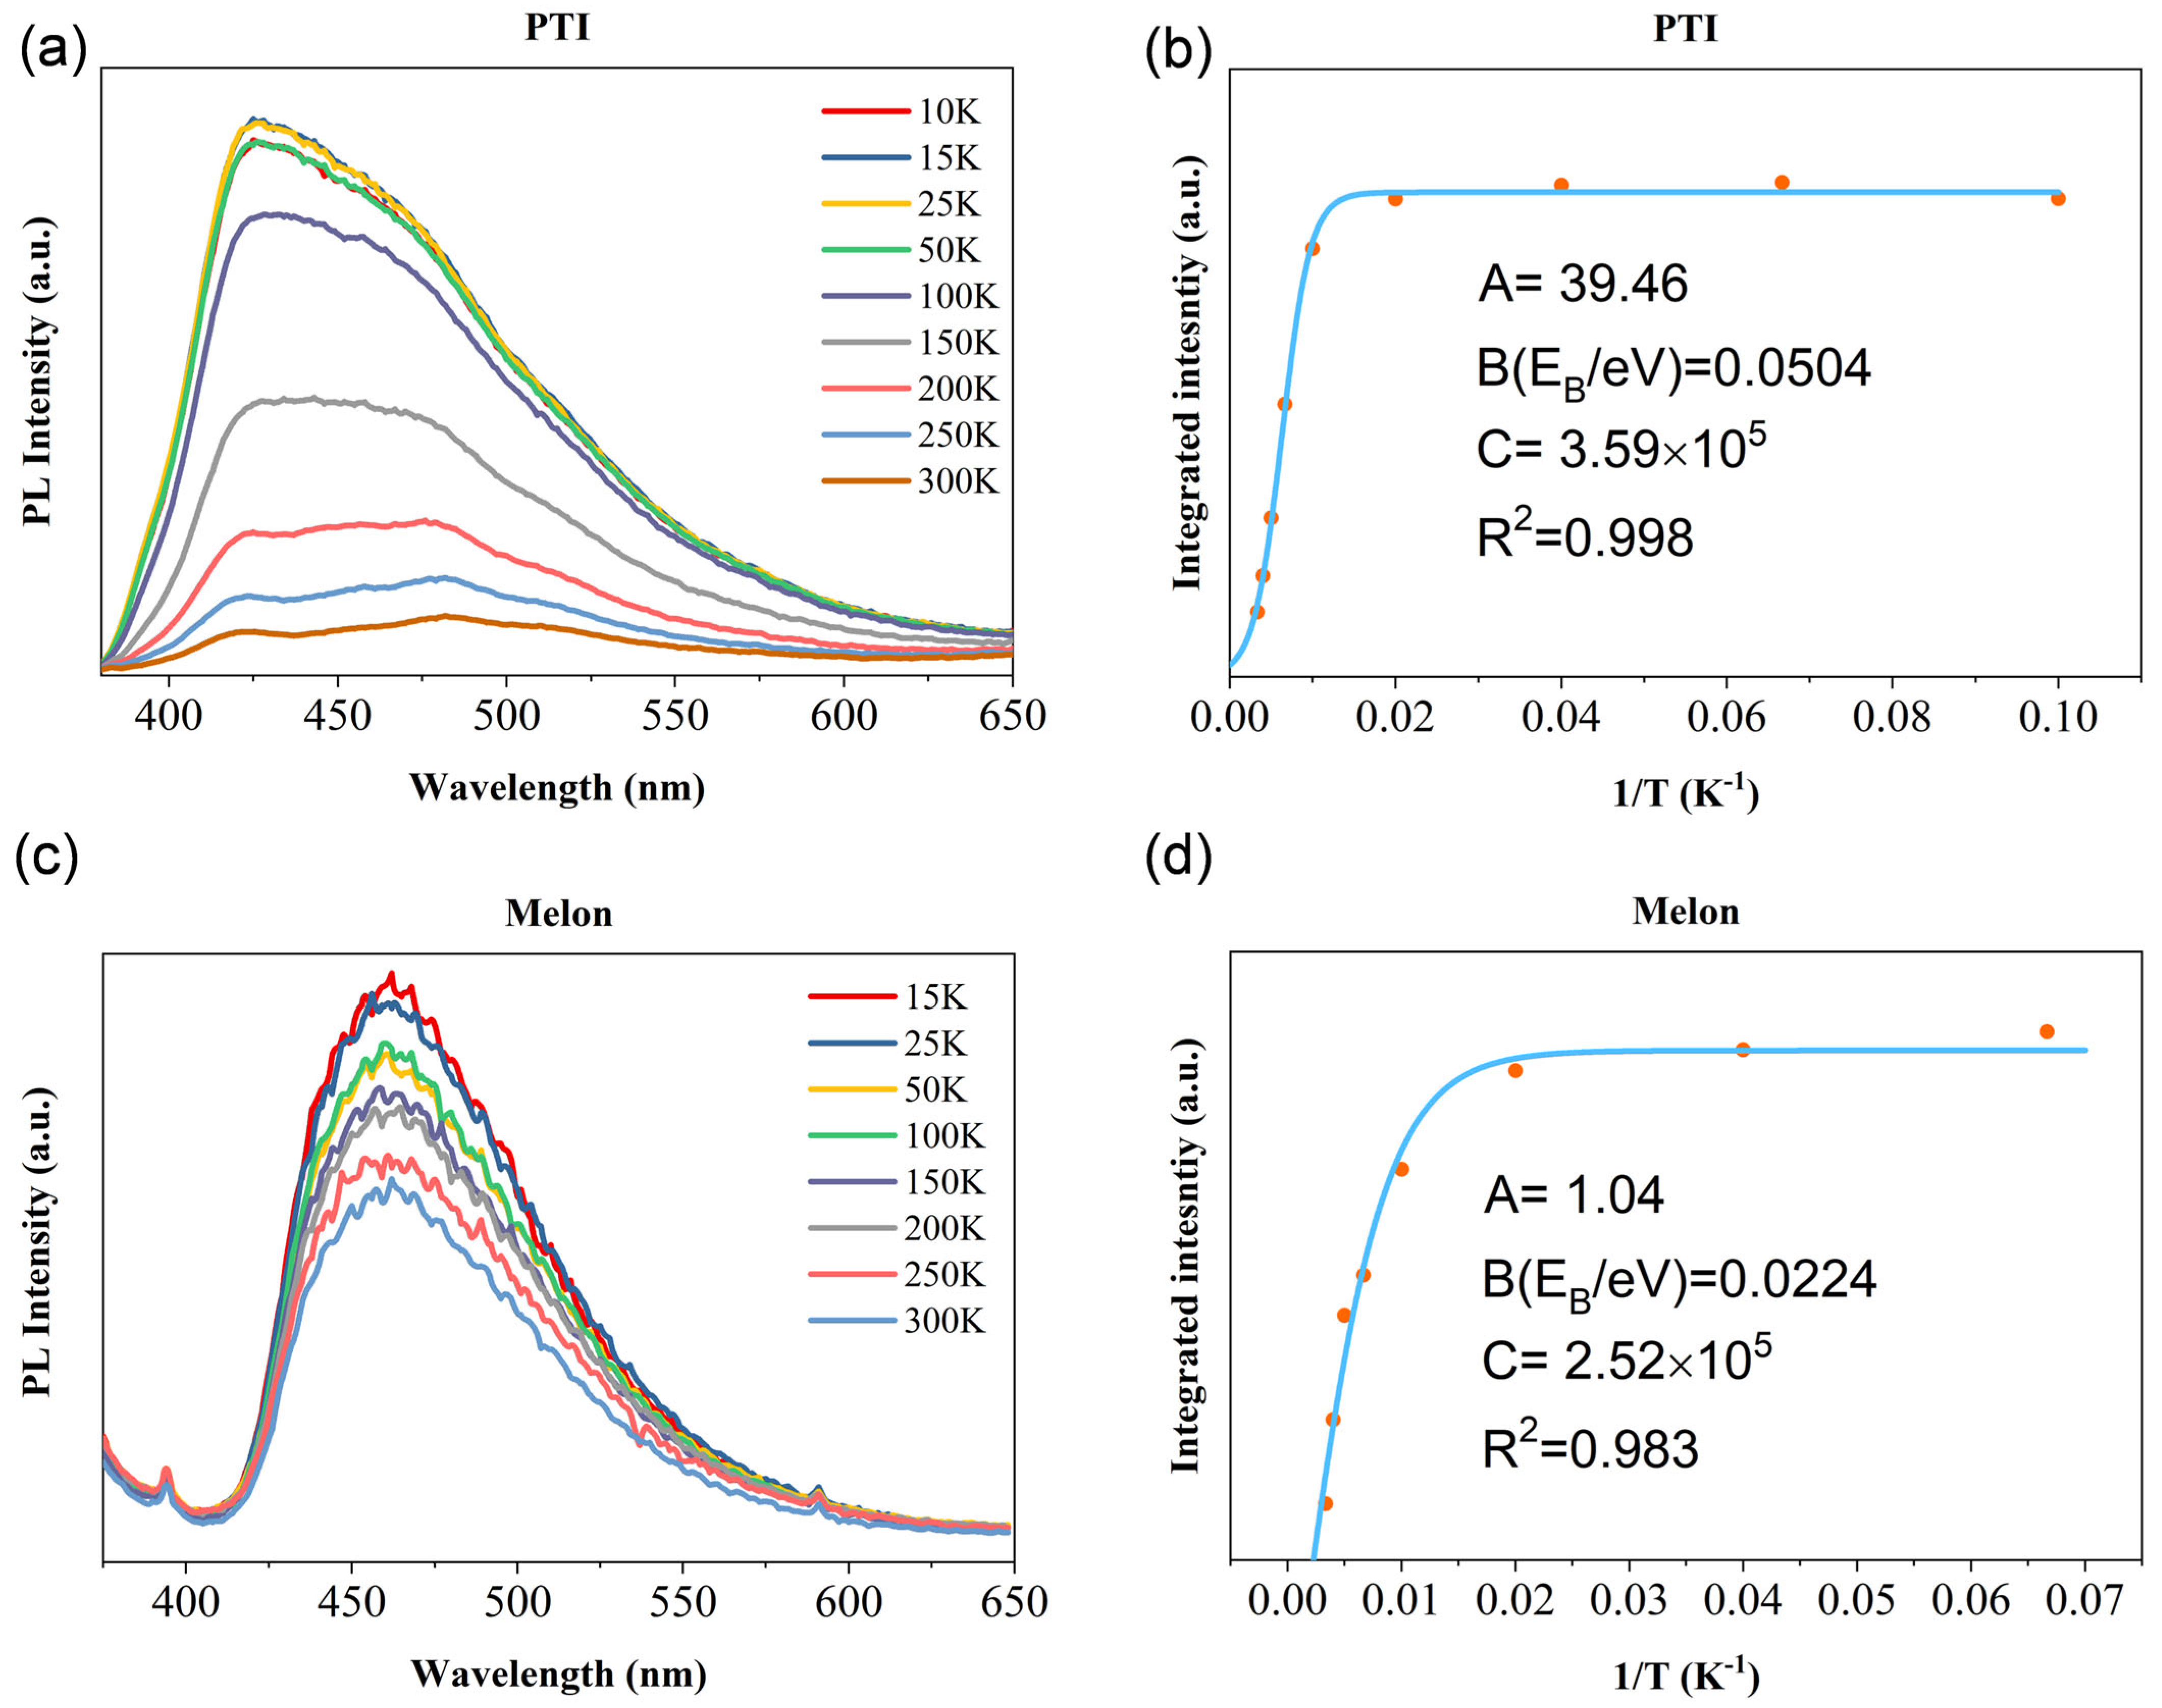
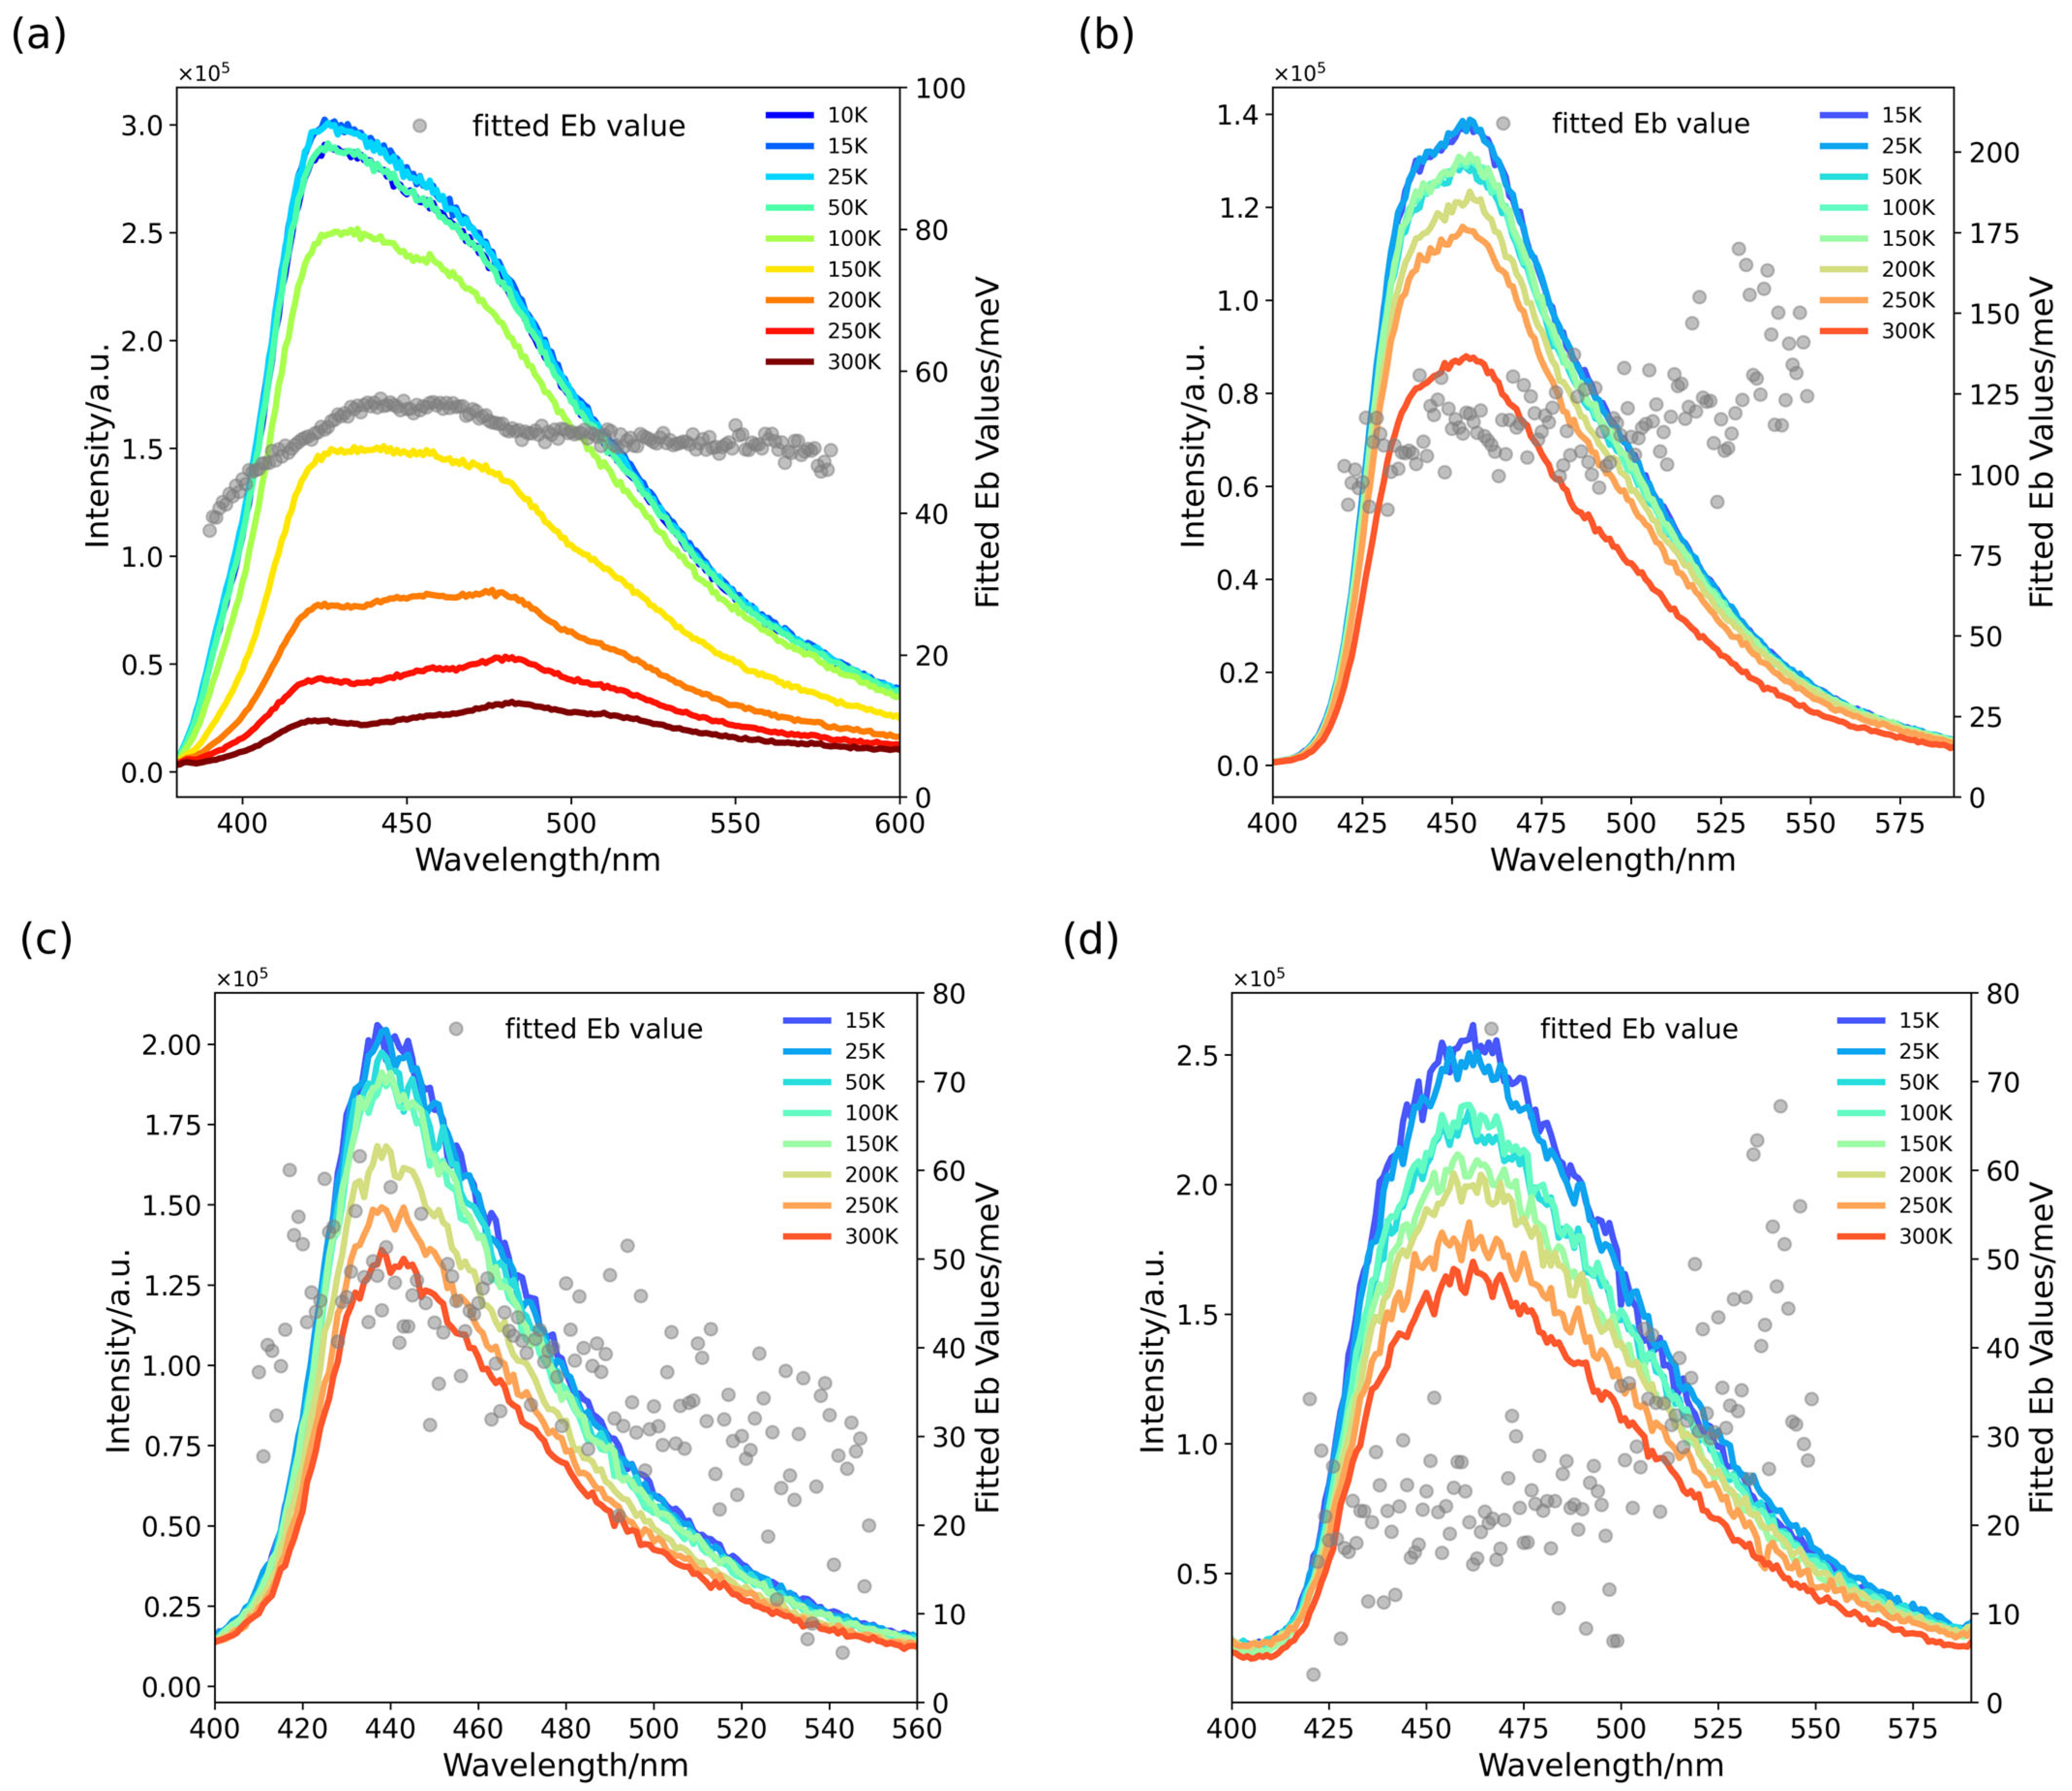
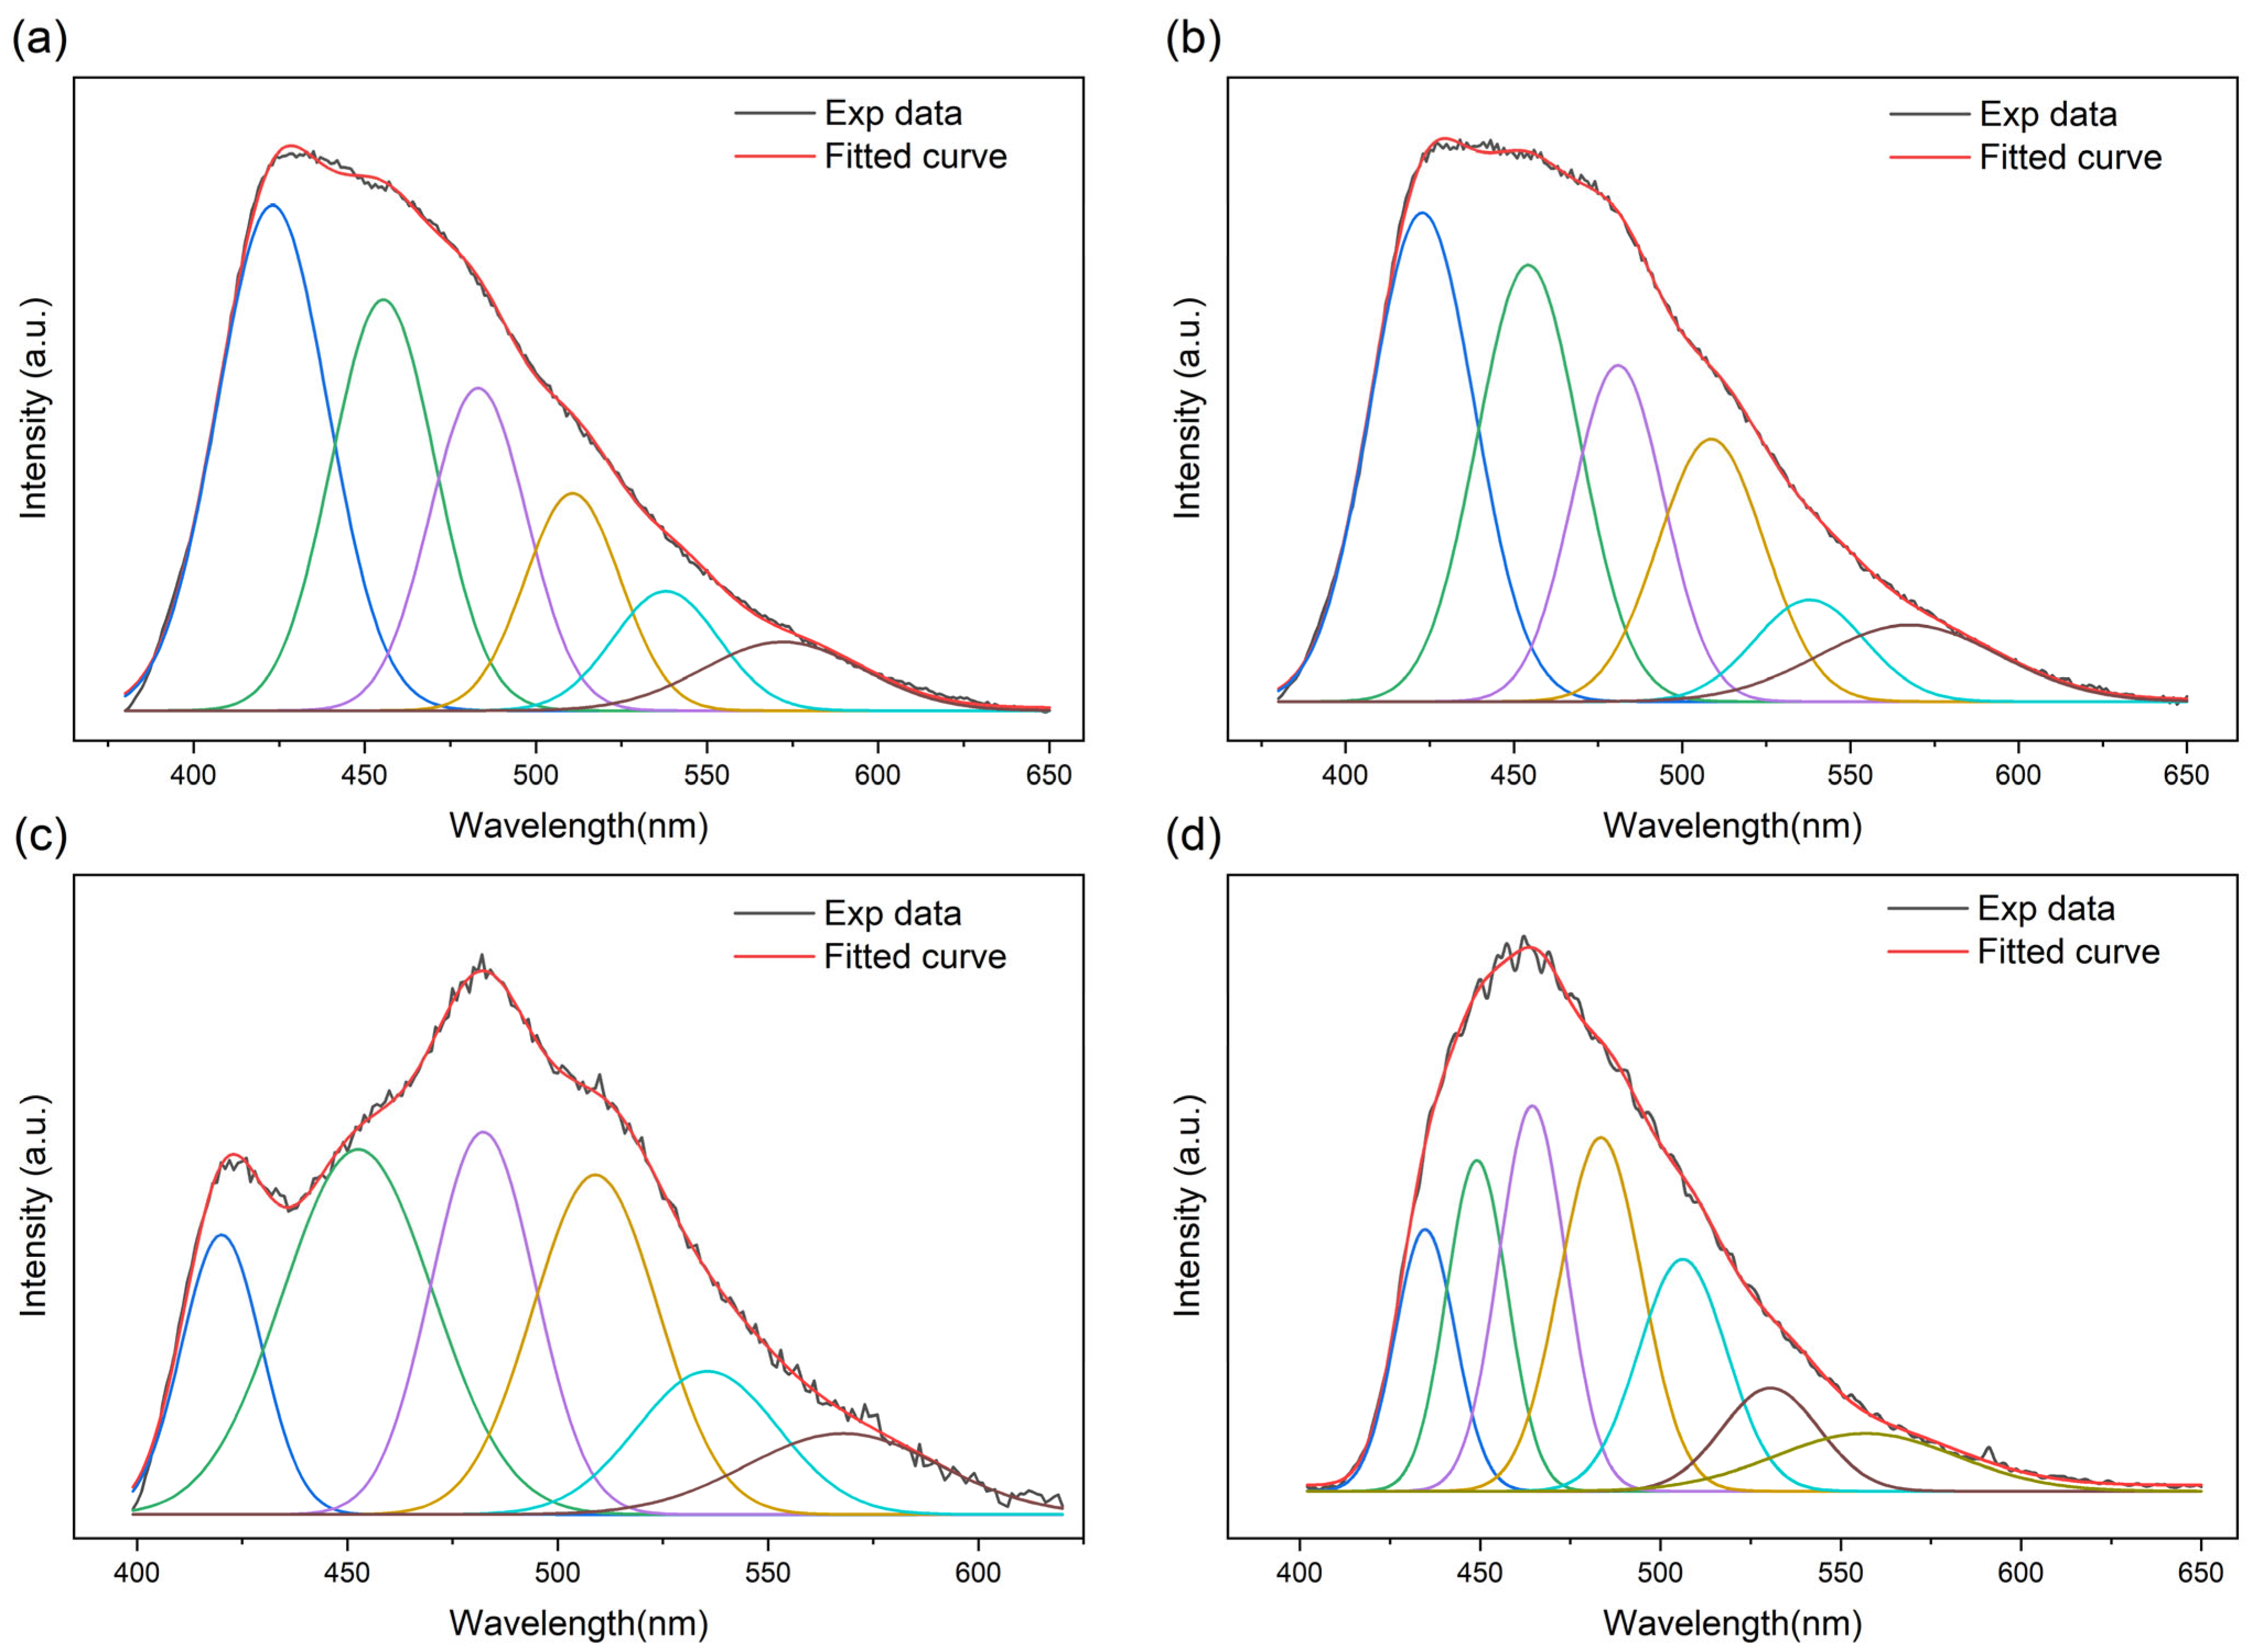
2.1. Experiment Measurement of E b

The exciton binding energy was fitted out according to the equation below [9,10,11]:
I T = I 0 1 + A e E b   T k B
where kB is the Boltzmann constant, I0 is the peak intensity at 0 K, and A = τ r τ 0 is defined as a parameter to describe radiative lifetime, in which τ 0 and τ r are the radiative lifetime when T → 0 K and the radiative lifetime under usual conditions, respectively. This equation is derived from the fluorescence quantum efficiency:
η = 1 + τ r τ n r = I I 0
τ n r = τ 0 e E b   T k B
As can be inferred from the equations above, the depopulation of photogenerated excitons is dominated simply by the thermal dissociation and radiative spontaneous emission, so that the fluorescence intensity is the competitive result of these two factors.
To obtain the value of E b , intensity I is plotted as a function of 1/T as shown in (Figure 1). The fitting results exhibit that the E b of PTI/Li+Cl (~50 meV) is more than twice that of the melon (~22 meV). Although it seems quite outrageous, this observation did not contradict the empirical energy band gap scaling law that is proportional to its energy band gap [12,13]. The reduction of nonradiative lifetime with rising temperature manifests as a reduction in luminescence intensity. No visible shift of peak position is observed as the temperature increases in the PL spectra among all carbon nitrides.
Although many reports use the peak intensity as a standard I0 for fitting data, it has further been confirmed that whatever wavelength is applied to extract fitting data, the reason for the frequent use of the highest peaks may primarily be that the components near the main peak are predominantly bound-state excitons, which can be well described by Equation (2). For example, the E b values of PTI/Li+Cl always fluctuate slightly above and below 50 meV, which verifies the validity of the previous assumption in any radiative emission transition. On the other hand, the E b values of melon or poly-(heptazine imide) (PHI) float over a wider range (Figure 2) and rise swiftly in the longer wavelength region. The better crystallized the material component is, the more unitary the fluorescence emission mode is, and the more stable is the fitted binding energy it exhibits. The fitted exciton binding energy shows a relatively monotonous change from short to long wavelengths. This observation suggests that the excitons from shallow energy levels are more stable and less prone to dissociation.
The deconvolution of the photoluminescence curve at varying temperatures is collected and shown by several Gaussian–Lorentz functions to investigate the component of the fluorescence emission peaks. As can be seen, the PL spectra contain various emission features: the major composition peaks are chosen to be narrow and share the same half-peak breadth, since the width of the peak indicates a mixture of multiple recombinations. The PTI/Li+Cl emission center is observed at P1 (420 nm, ~2.9 eV), P2 (450 nm, ~2.7 eV), P3 (480 nm, ~2.6 eV) and P4 (509 nm, ~2.43 eV) (Figure 3), which mainly originate from the three different pathways of transition: π*-π, π*-σ and π*-n to non-bonding orbitals (n) [14,15]. The components of the band pairs with an energy gap corresponding to the wavelength of the wave function shapes (Figures S2–S4) as well as the typical emission peaks (Figures S5–S9) are listed. The shape change in the spectrum with the variation in temperature provides information to distinguish free excitons from bound excitons. As shown in the figure, the shoulder at 420 nm becomes progressively weaker with the increase in temperature, which points to the signature of the quenching of bound-state excitons [16,17].
Moreover, each wavelength covered within the peak width, on the other hand, can be converted to the energy gap between the excited states and the ground state. The peak intensity is correlated with the likelihood of hopping occurring between two states with corresponding differences, which is related not only to the number of energy state pairs, but can also thus be analyzed by the transition dipole moment for certain transition modes. This physical quantity provides a means to investigate the relationship between the peak intensity of fluorescence and the transition probability.

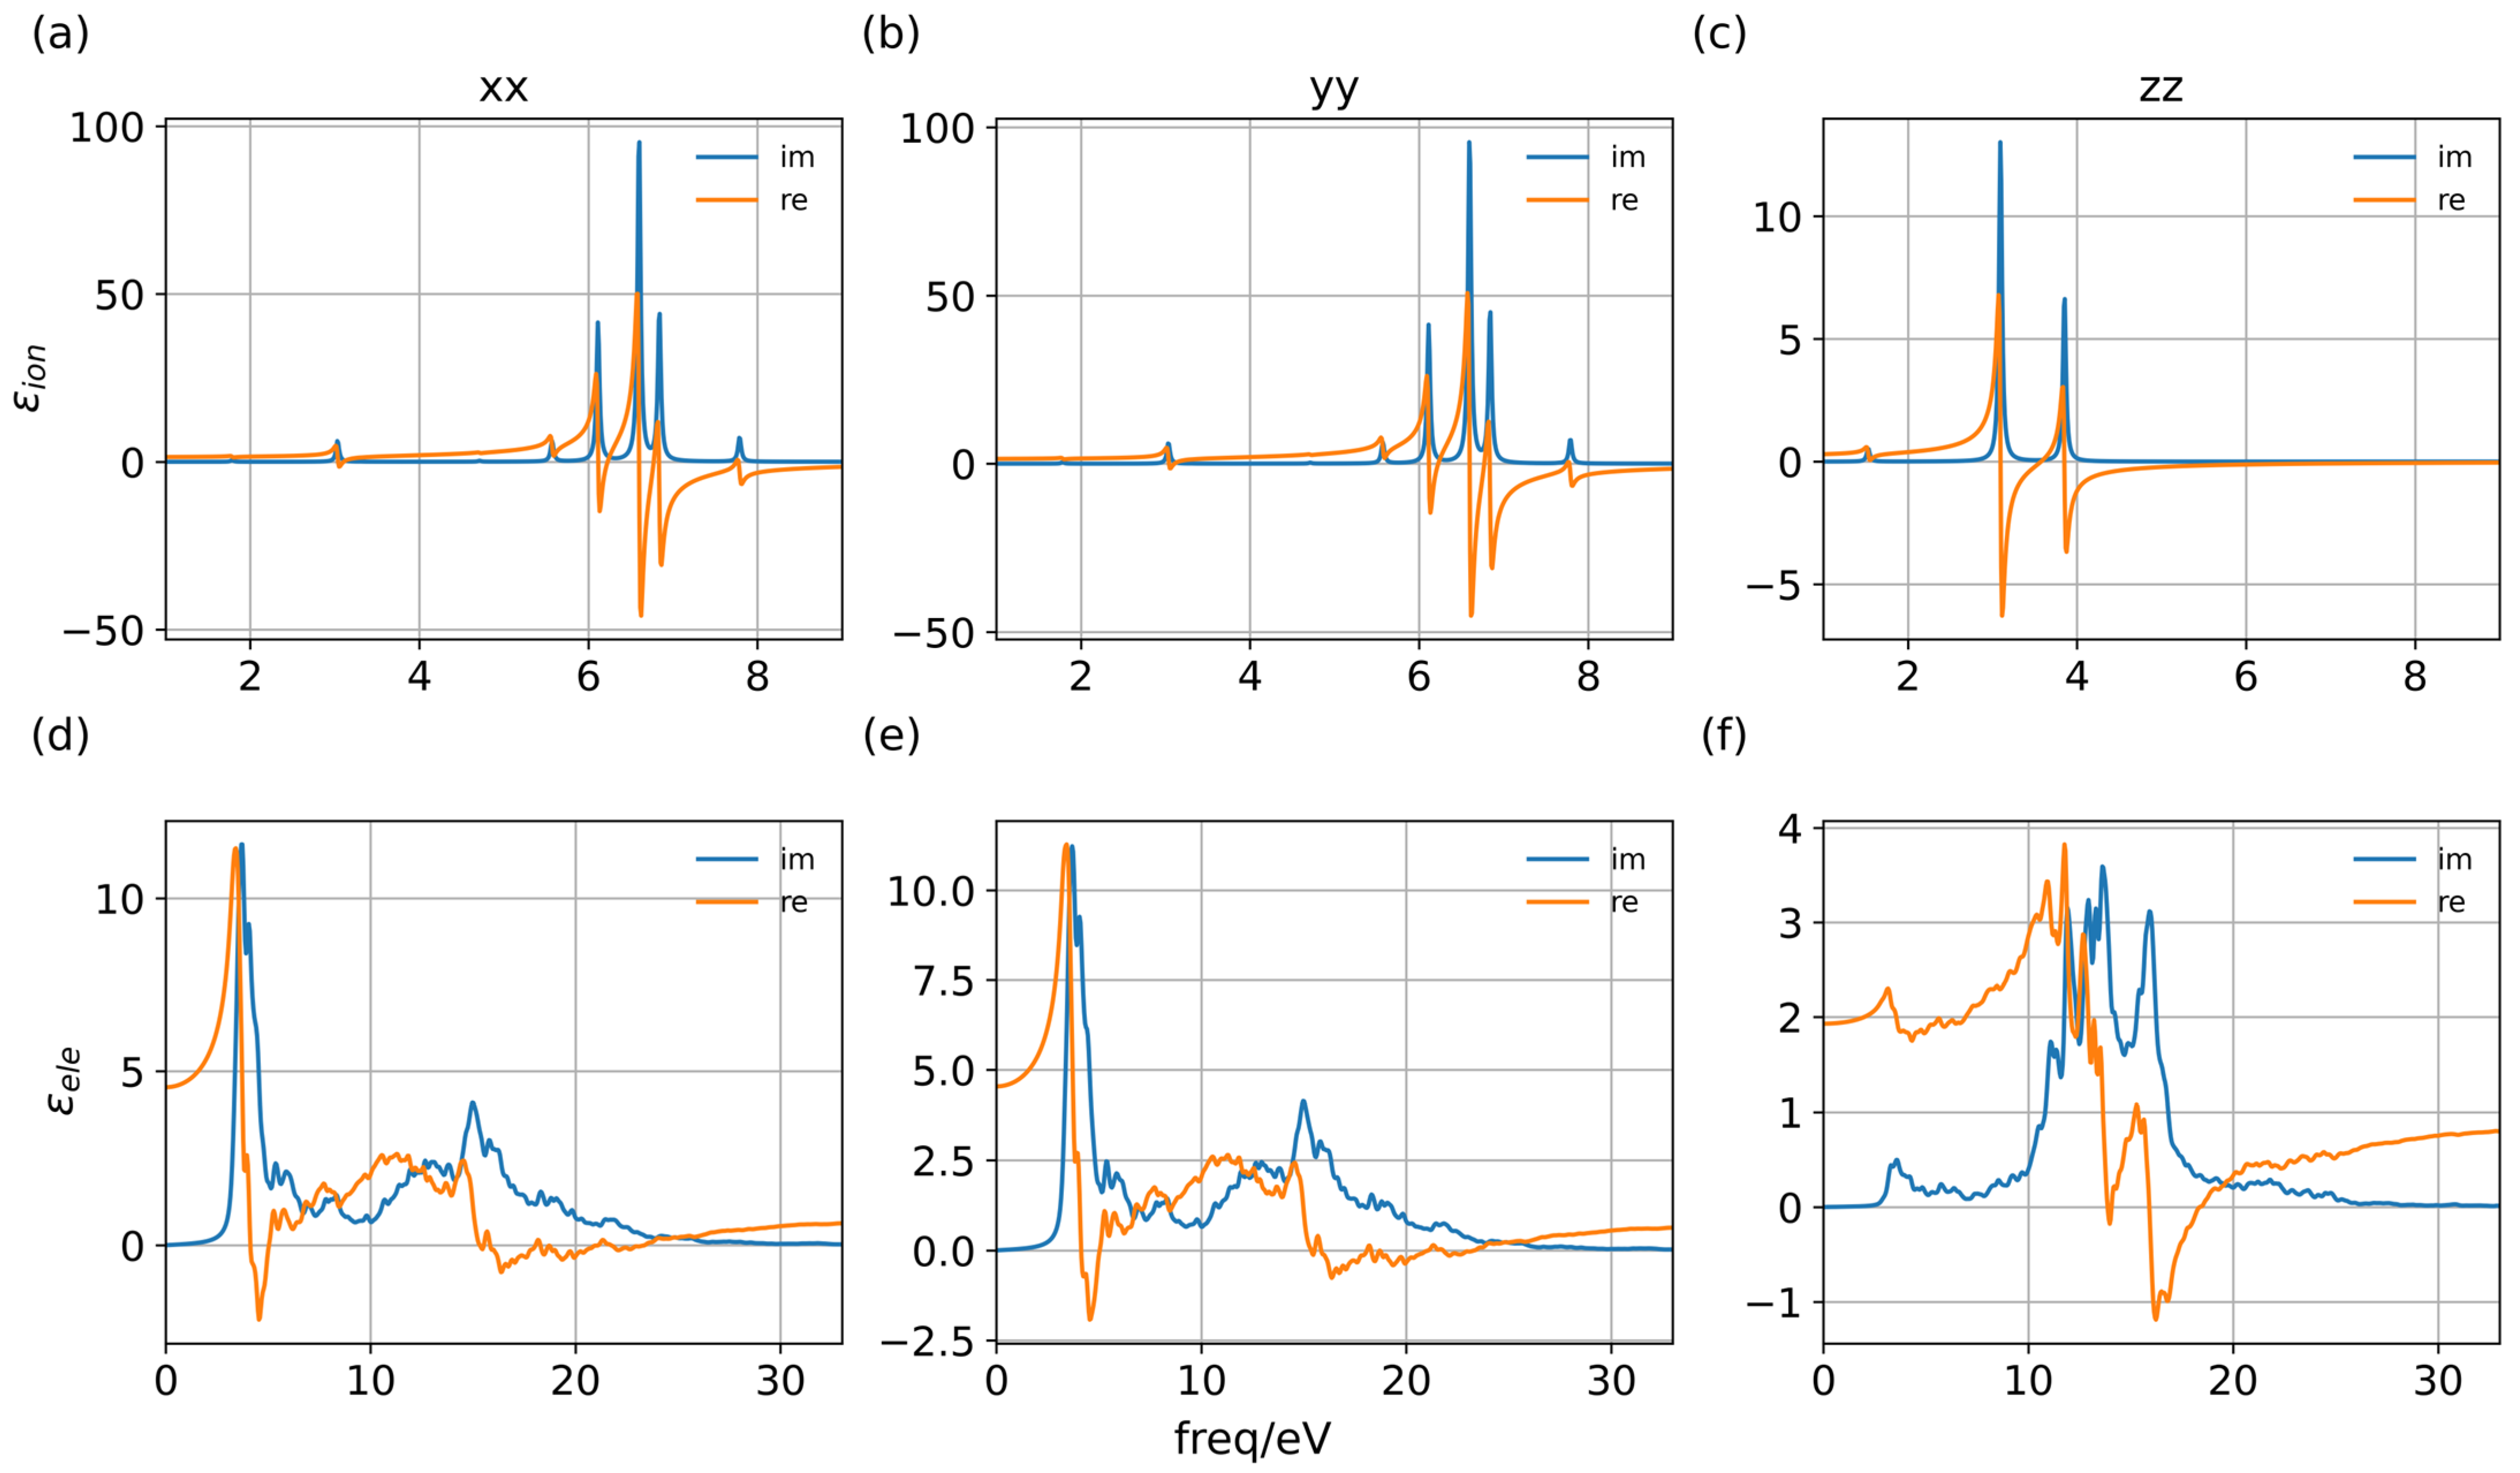
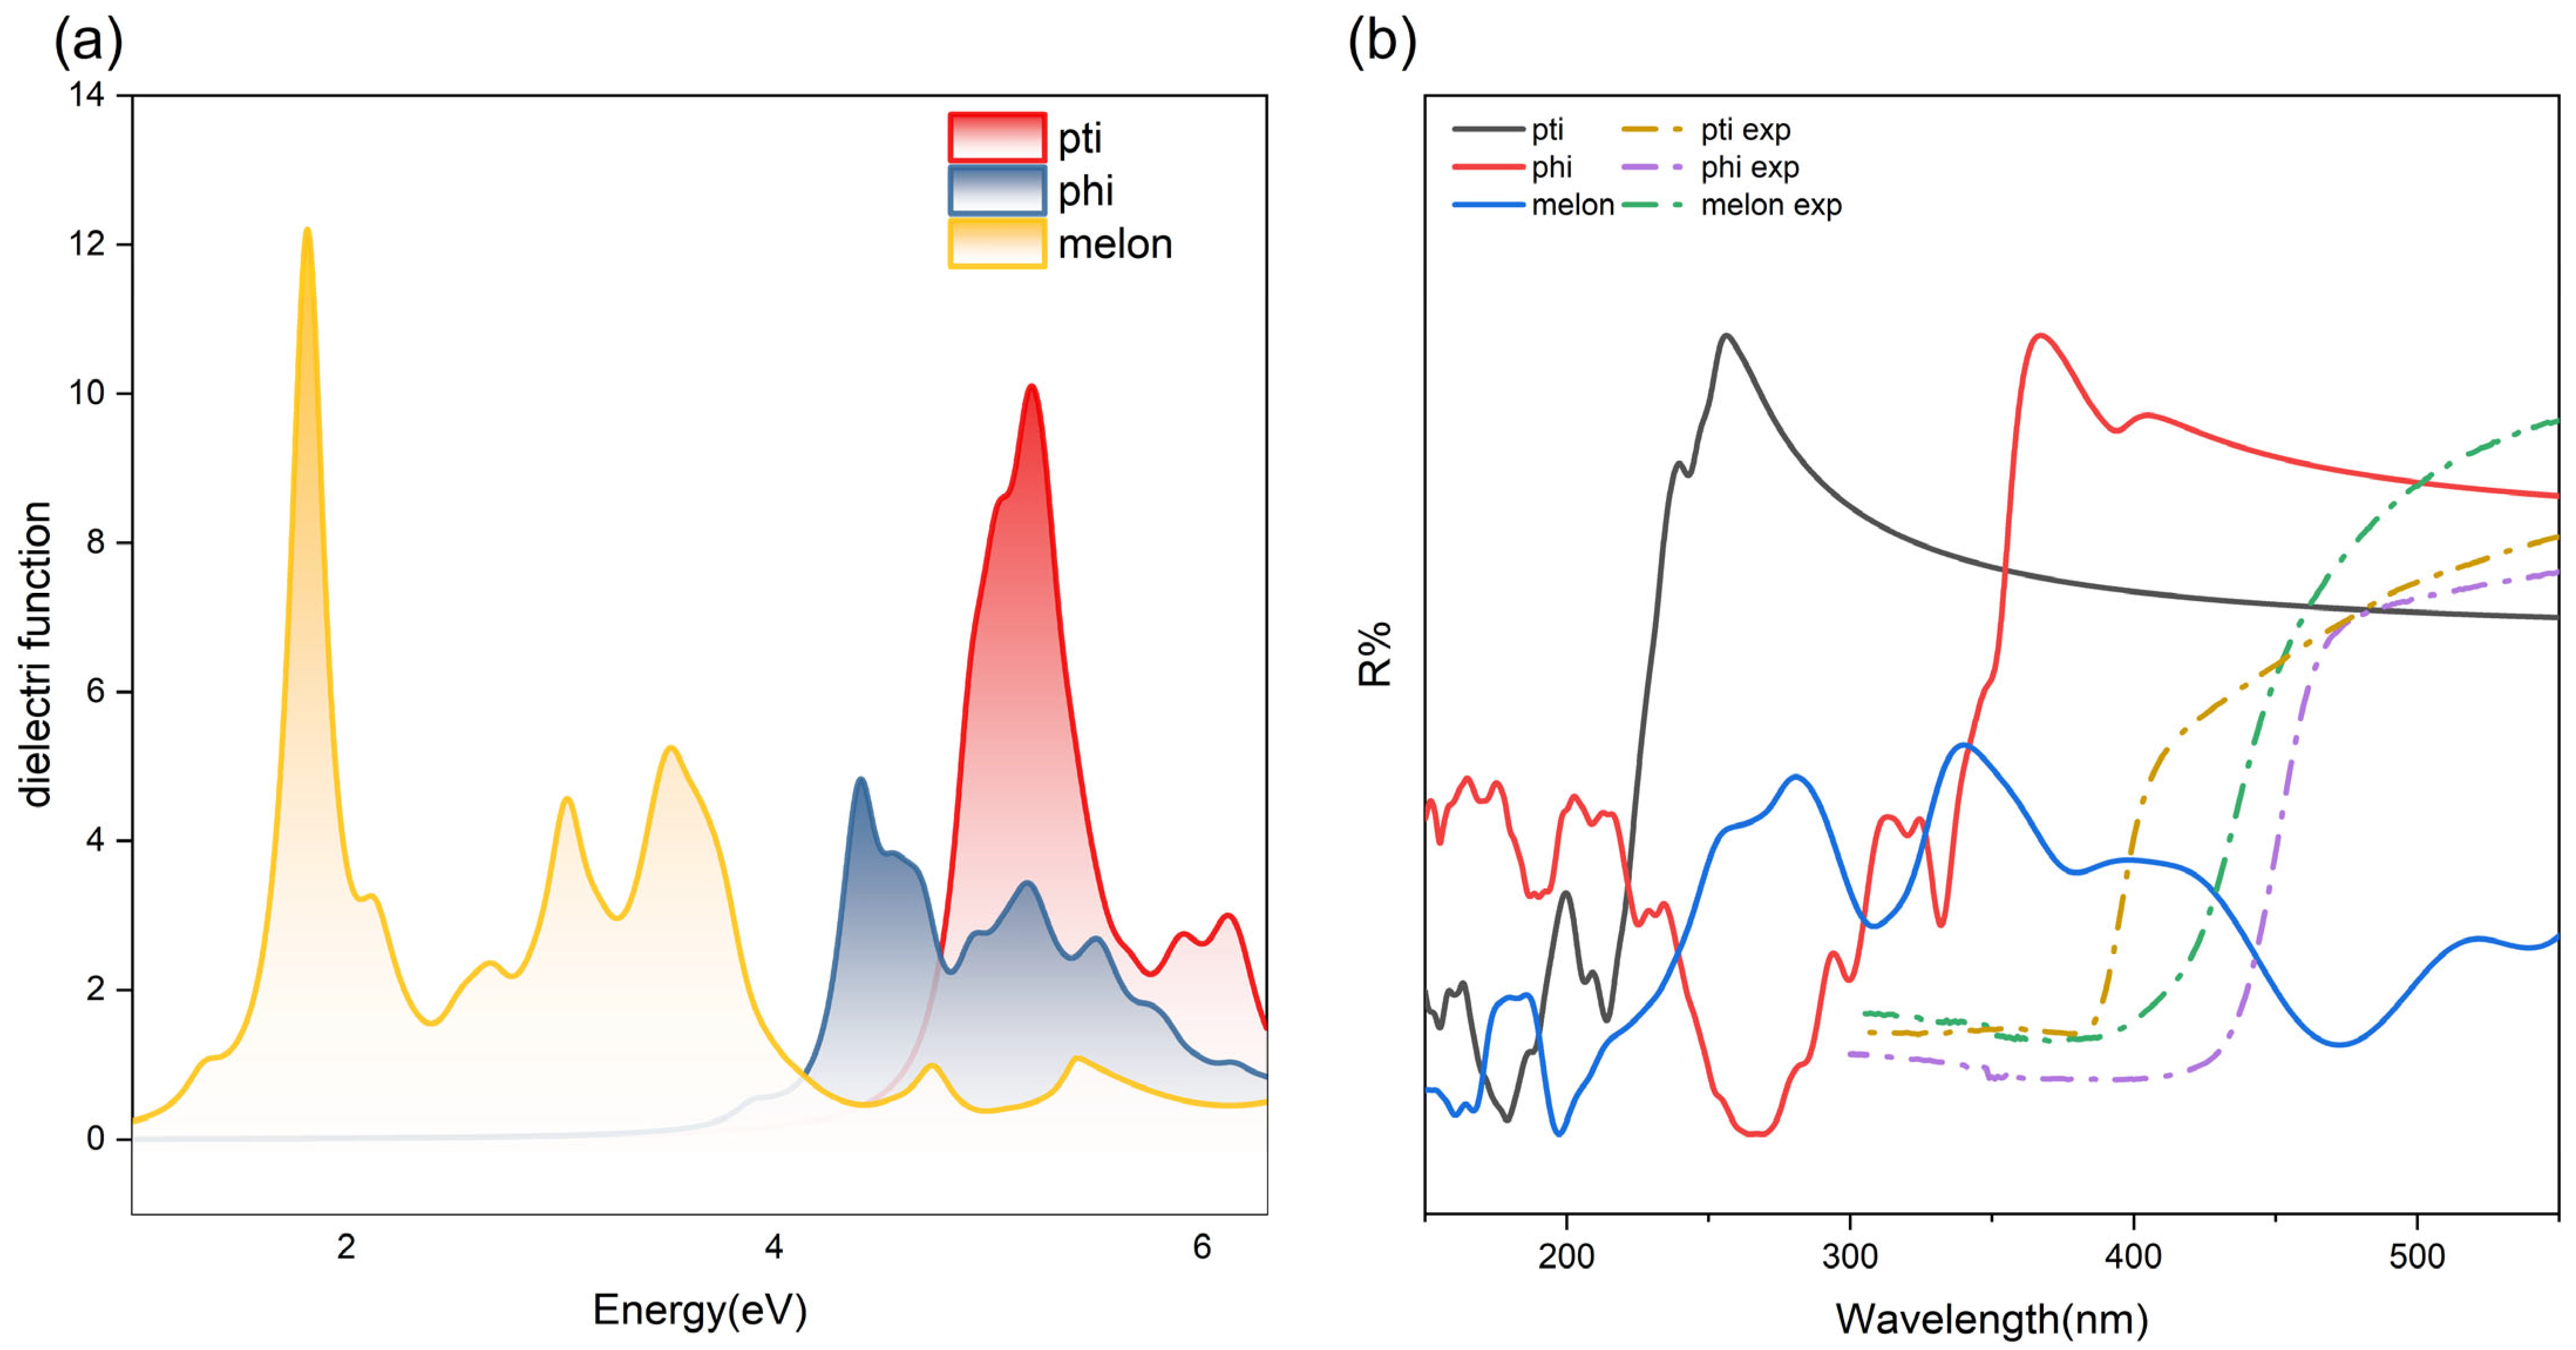
2.2. Calculations of the Dielectric Function

When materials are immersed in the electric field, it generates an electric displacement field ( D ) inside, both of which are associated with the dielectric constant E r . Dielectric constants measure the ability of the material to screen external electric fields in a form of polarization, as well as the electrostatic force between electrons and holes, which are involved in exciton dissociation thermal dynamics. The dielectric constant of a certain material is usually attribute to reorganization of the electronic density or the ions’ consistence, the term induced by the electronic density is marked E , while the contribution of the dielectric constant involving the ionic motions is labeled E v i b . In total, the static dielectric constant is the summation over both:
E r = E + E v i b
The electronic contribution to the static dielectric tensor is evaluated through finite difference methods and the vibration contribution is compted by density functional perturbation theory (DFPT) [18,19,20] (Table 1).
Considering the fact that the PL process provides a sufficient time for the whole system to relax before we observe the signal, so the dielectric value chosen to calculate binding energy is determined at 0 eV (Figure 4).

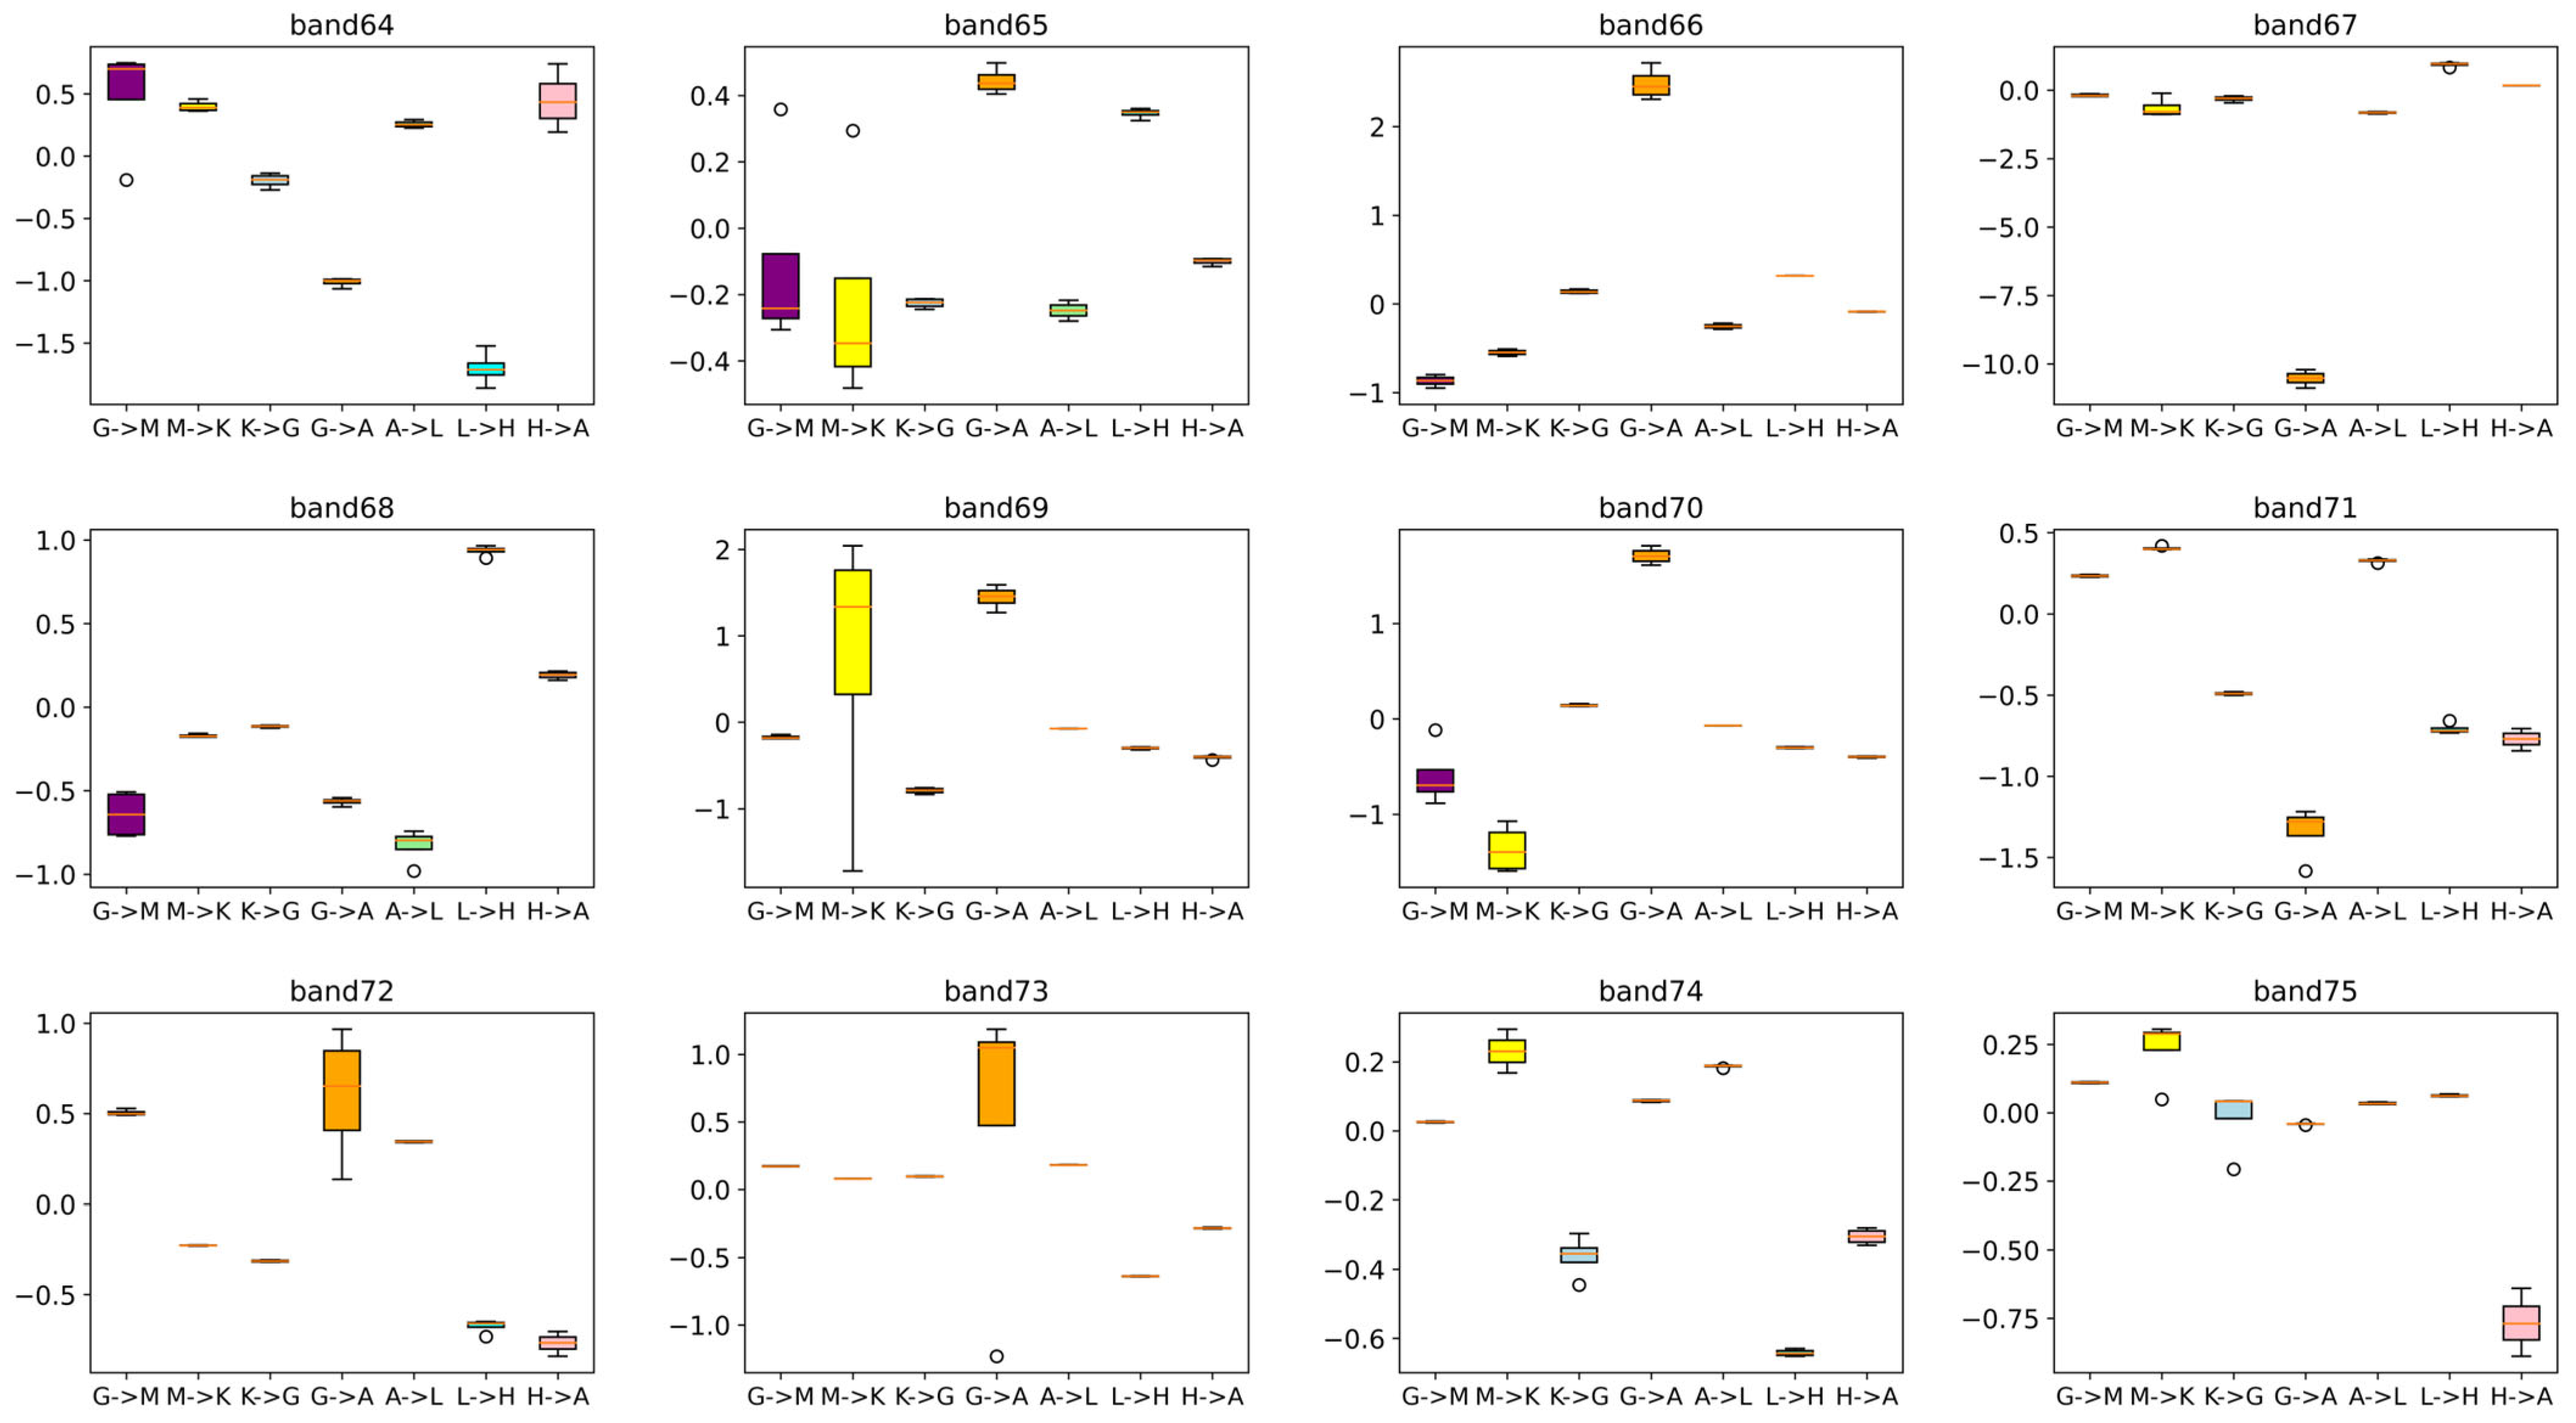
2.3. Calculations of the Effective Mass

For a semiconductor with a low carrier concentration, the conventional definition of the wavevector-dependent effective mass in branch l , along the direction i on the selected k-points path, is:
1 m i j l k = 1 E l k k i k j
where the subscripts i and j are reciprocal components, and E l k is the dispersion relation of the band designated l . Carbon nitride, as a polymeric semiconductor, has a relatively low conductivity, so that the dispersion curve is flat, making it difficult to fit the band to a quadratic polynomial. Thus, a numerical method was proposed to calculate the real symmetric tensor:
2 E k 2 = 2 E k x 2 2 E k x k y 2 E k x k z 2 E k x k y 2 E k y 2 2 E k y k z 2 E k x k z 2 E k y k z 2 E k z 2
where the second order mixed partial derivatives can be obtained by the finite difference method [21]. The eigenvalue of each term is the inverse of the effective mass. For semiconductors with low carrier concentrations, every dispersion segment on a branch of band l seperated by the high symmetry k-points can match an effective mass value. To exclude the influence of the Kane dispersion as a more precise approximation of nonparabolic band structure [22], a polynomial expansion of the energy term to keep the second-order k 2 ellipsoidal energy surface is employed.
Additionally, all the effective mass in the formula represents the reduced effective mass m r * , which was obtained from the relative effective mass of the electrons ( m e * ) and holes ( m h * ). Compared with other conventional inorganic semiconductors, the flat peculiarity of the band curves of carbon nitride make its concavity unusually sensitive to numerical fluctuations, thus, 5–9 points along the dispersion segments were taken to monitor the transformation of concavity with the variation in interval length. All the effective mass data shown in this article are relative to the electron rest mass ( m e ) (Figure 5). It has been observed that the box with a wider whisker expansion (for example, path G → A) usually exhibits a larger absolute median and maximum effective mass value, indicating the band passes through a flat region in this section. A large effective mass along the G → A path constantly exhibits low carrier mobility along this direction ([001]). This observation aligns with our understanding that two-dimensional materials exhibit comparatively greater impediments to interlayer transport in contrast to their in-plane conduction properties.
In reality, effective mass is influenced by the external field which is partially determined by the carrier concentration in a material. As a typical semiconductor, carbon nitride experiences a variation in carrier concentration under photoexcitation, thus affecting the value of the effective mass. One of the quantitative instruments for this condition is the introduction of optical effective mass that takes an average of all occupied k-states, and takes carrier concentration into consideration [23,24]:
1 m i j o p t = 2 n e l k o c c u p i e d 1 m i j l k
With n e as the total carrier concentration, this definition also avoids the limitation of the parabolicity of the band curve, and when we substitute n e for the expression of the Fermi–Dirac distribution f E , T :
n e = l 2 2 π 3 f E l , T d k   l n e l
so that the optical effective mass m o p t has the form:
1 m i j o p t = l f E l k , T 2 E l k k 2 d k l f E l k , T d k = l n e l m i j o p t n e
As it can be inferred from the form of the equation, the band numbers or the k-point paths in Brillouin zones can serve as suitable summation indicators for practical applications.
In this work, the simulation results of common effective mass at certain k points and optical effective mass are compared in the binding energy section. To ensure the equivalent temperature of a photo-induced carrier ( T q ) in the Fermi–Dirac distribution, we assume the remaining energy of the incident light (hν) is utilized intact in the thermal motion of the exciton after excitation. As a quasiparticle, the degree of freedom of an exciton can amount to a pair of spring-connected rigid balls 7 2 k T , while considering the energy level distribution issues, the remanent energy is equally allotted to electrons and holes [25]. Thus, for PTI T q ≈ 570 K and for melon T q ≈ 1250 K with exciting beams of 365 nm and 380 nm, respectively. In reality, the overflowing energy may not exclusively channel carriers into higher energy states. On the contrary, it can exacerbate photon vibrations, thereby inducing the ionization of excitons which can be shown by fluorescence attenuation.
In order to refrain from the introduction of non-differentiable points due to the abrupt changes in the path through the high-symmetry k-points, the band segments were selectively chosen to be smooth under the assistance of Effmass-2.3.1. The optical effective mass was similarly calculated with its help [26]. In the context of direct transition and recombination, it is evidently more reasonable to average the effective mass based on the k-point splitting (Figure S10). This approach yields results that align more closely with the experimental values in terms of order of magnitude. Moreover, it can be further popularized that, while dealing with the carbon nitride series of materials characterized by flat energy bands, the practical of splitting of the band according to the energy band is not entirely unrealistic, as long as a continuous polynomial curve can be discovered by the appropriate truncating of k-point selection. Despite notable deviations in optical effective mass results from the observations when averaged by band number, those averaged by k-point closely align with experimental outcomes. The optical effective mass of conductive bands predominantly exhibits a positive value and a negative value for valence bands (red to pink color gamut). This outcome elucidates that the optical effective mass inherently equalizes the unusual bands to convex functions and concave functions mathematically. Such a model concurs with well-established profiles of the lower edge of the conduction band and the upper edge of the valence band in most typical excitations.

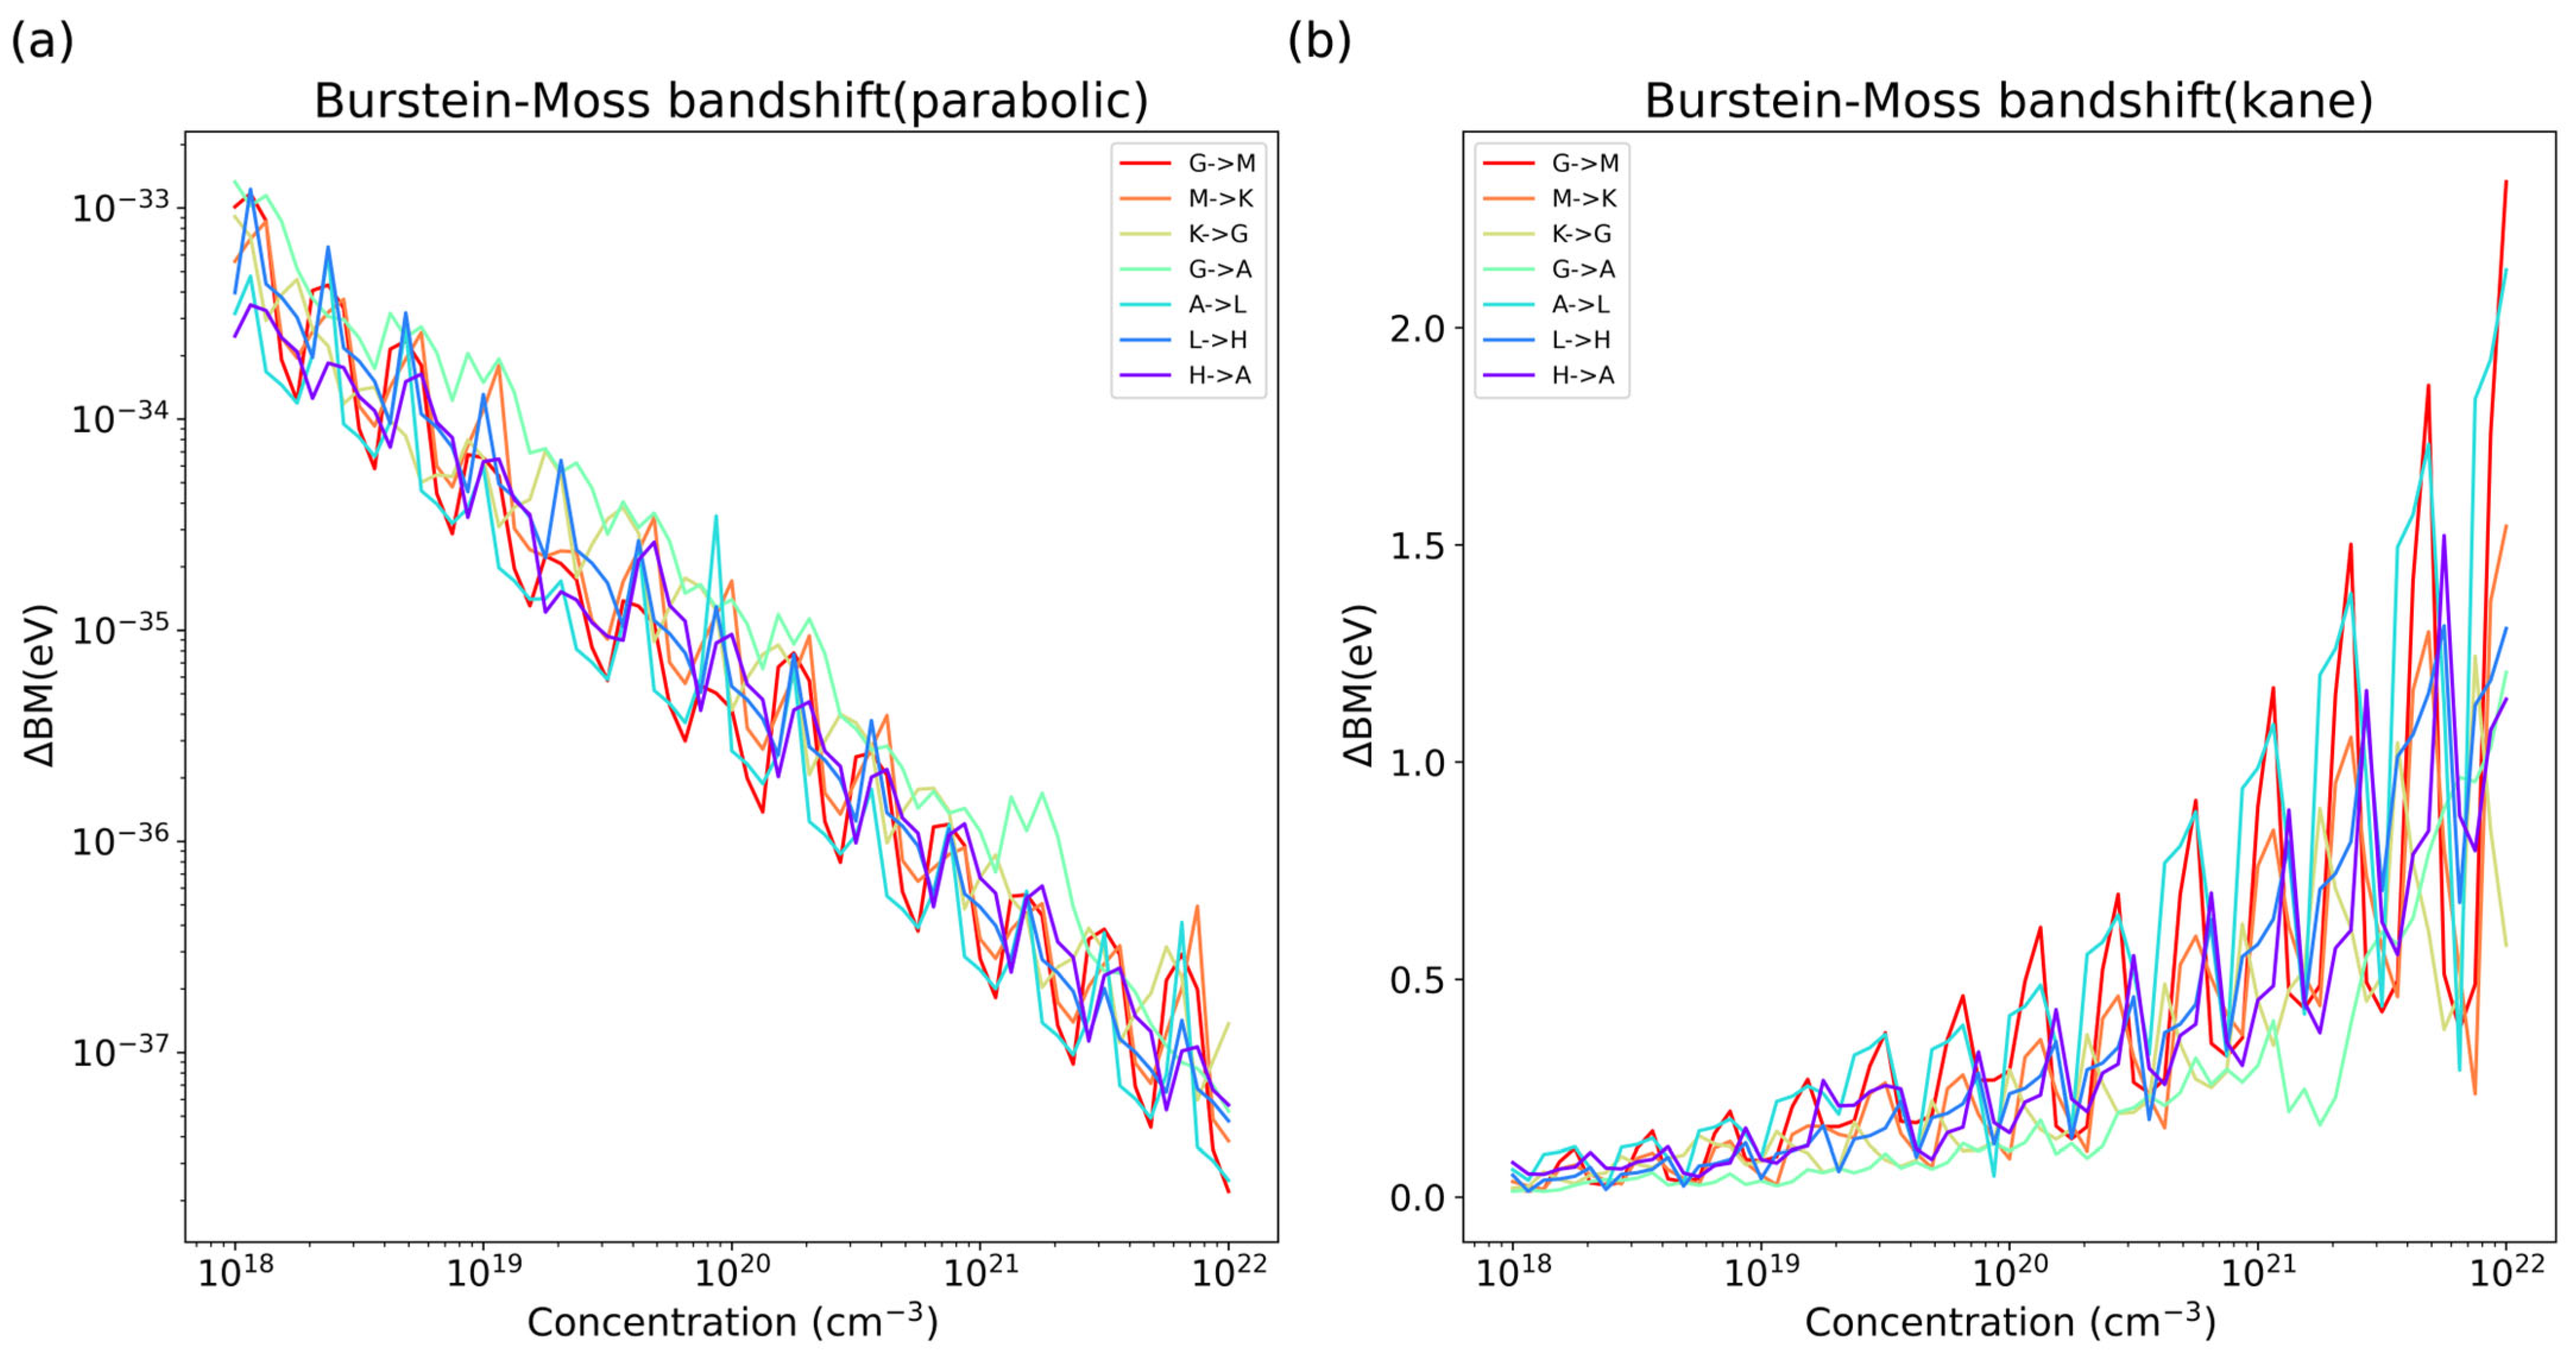
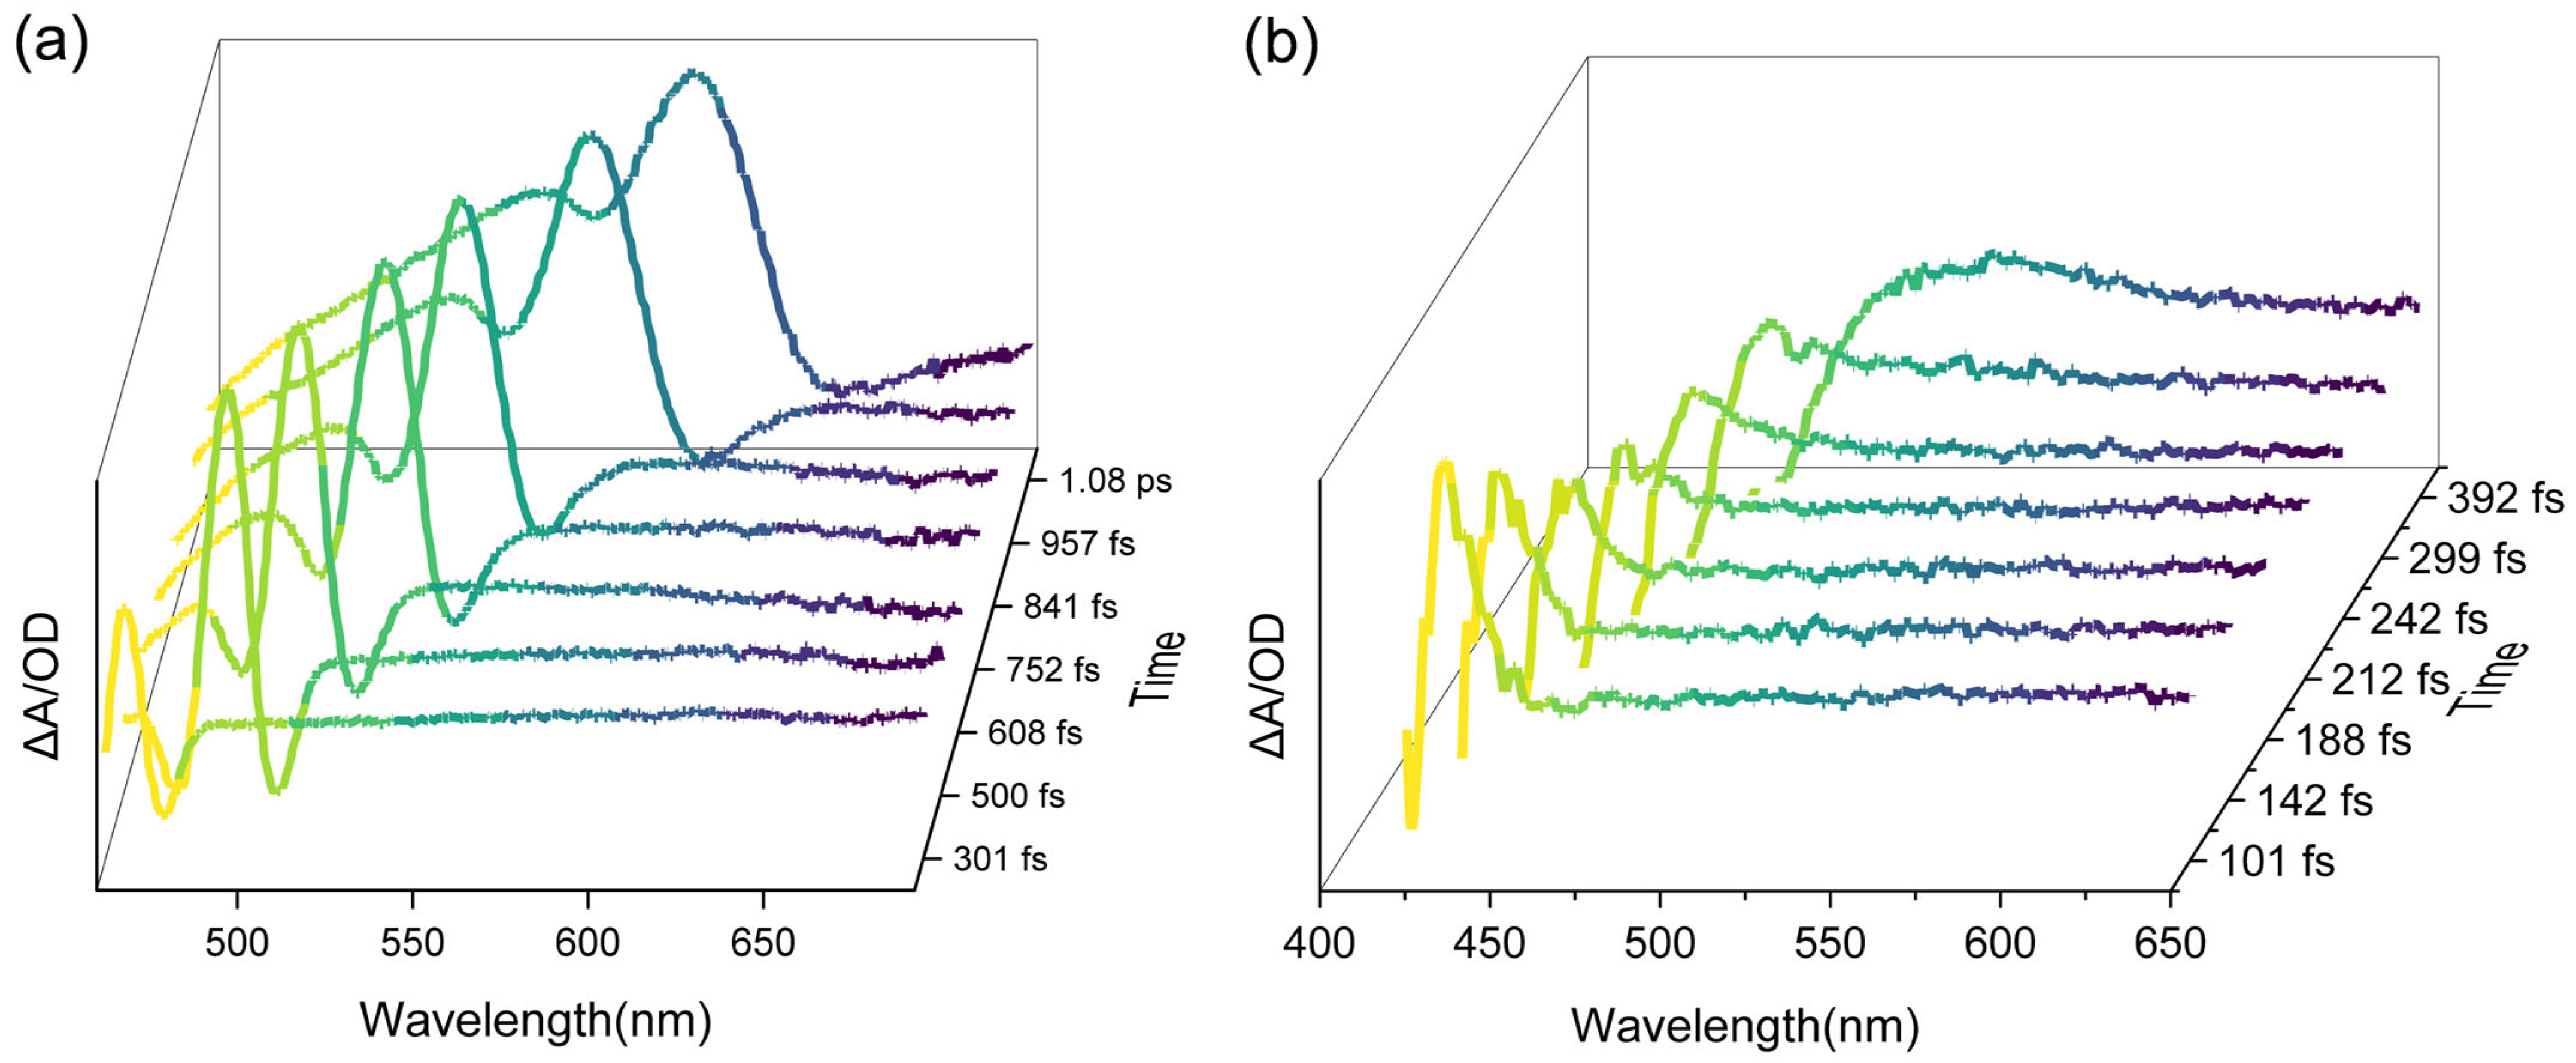
2.4. Burstein–Moss Band Shift and Transient Absorption Spectra (TASs)

When the carrier equilibrium state of a semiconductor is disrupted by external simulations, excess charge carriers (either electrons or holes) would give rise to a band shift effect referred to as the Burstein–Moss (B-M) band shift, which emerges primarily from the n-type semiconductor InSb with a high doping density and electrons of relatively small effective mass [27,28]. The surplus charge carriers (electrons or holes) could of course be introduced in many other ways such as doping, photoexcitation and temperature variation in the electronic band structure of the material [29,30]. The increased concentration of certain carriers leads to a screening of the Coulombic potential between electrons and holes, so that the formation energy of an exciton is reduced, causing the absorption edge to have a blue shift:
E B M = 2 2 m r * 3 π 2 n e 2 3
Therein, m r * can be replaced by m o p t that is computed with the Kane dispersion. It is easy to find the superiority of the latter (Figure 6). The Burstein–Moss band shift of these materials was grossly underestimated, showing a negligible variation with the concentration of carriers if calculated by parabolic approximation. In the intrinsic state, the carrier concentration of p-type carbon nitride semiconductors is of the order of ca. 1018 cm−3, while it can rise to as high as ca. 1021–1022 cm−3 after photoexcitation under AM 1.5G illumination [31]. Thus, the influence of E B M can be observed in transient absorption spectroscopy; the highest band shifts of melon and PTI at a carrier concentration of 1022 cm−3 are about 0.6 eV and 1.2 eV, respectively. Considering the anisotropy of the effective mass, a detailed value of the Burstein–Moss band shift depends on how the carriers fill up the energy state; namely, which energy band and which section of k-space the carriers populate. There might exist some discrepancy in the excitation between the compressed powder sample and electrodes immersed in electrolyte solution.
The observed value of the appreciable band shift can be estimated from the width at half-height of the plot of ΔA vs. λ (Figure 7):
As time goes on, the TAS curve of melon flattened out at short wavelengths because of the large blue shift, yielding a maximum BM band shift of about 0.11 eV. Meanwhile, PTI/Li+Cl exhibited a weaker absorption ability and a more rapid bleaching process compared with melon, which is consistent with our knowledge of the size of the conjugate system. The faint peak simultaneously hindered estimation of the band shift value. Generally, the Burstein–Moss band shift takes effect within 1–2 ps; this time range appears in many other semiconductor materials [30,32], indicating a universal response speed of a material against an external field and carrier re-equilibration relaxation time during the photoexcitation process.

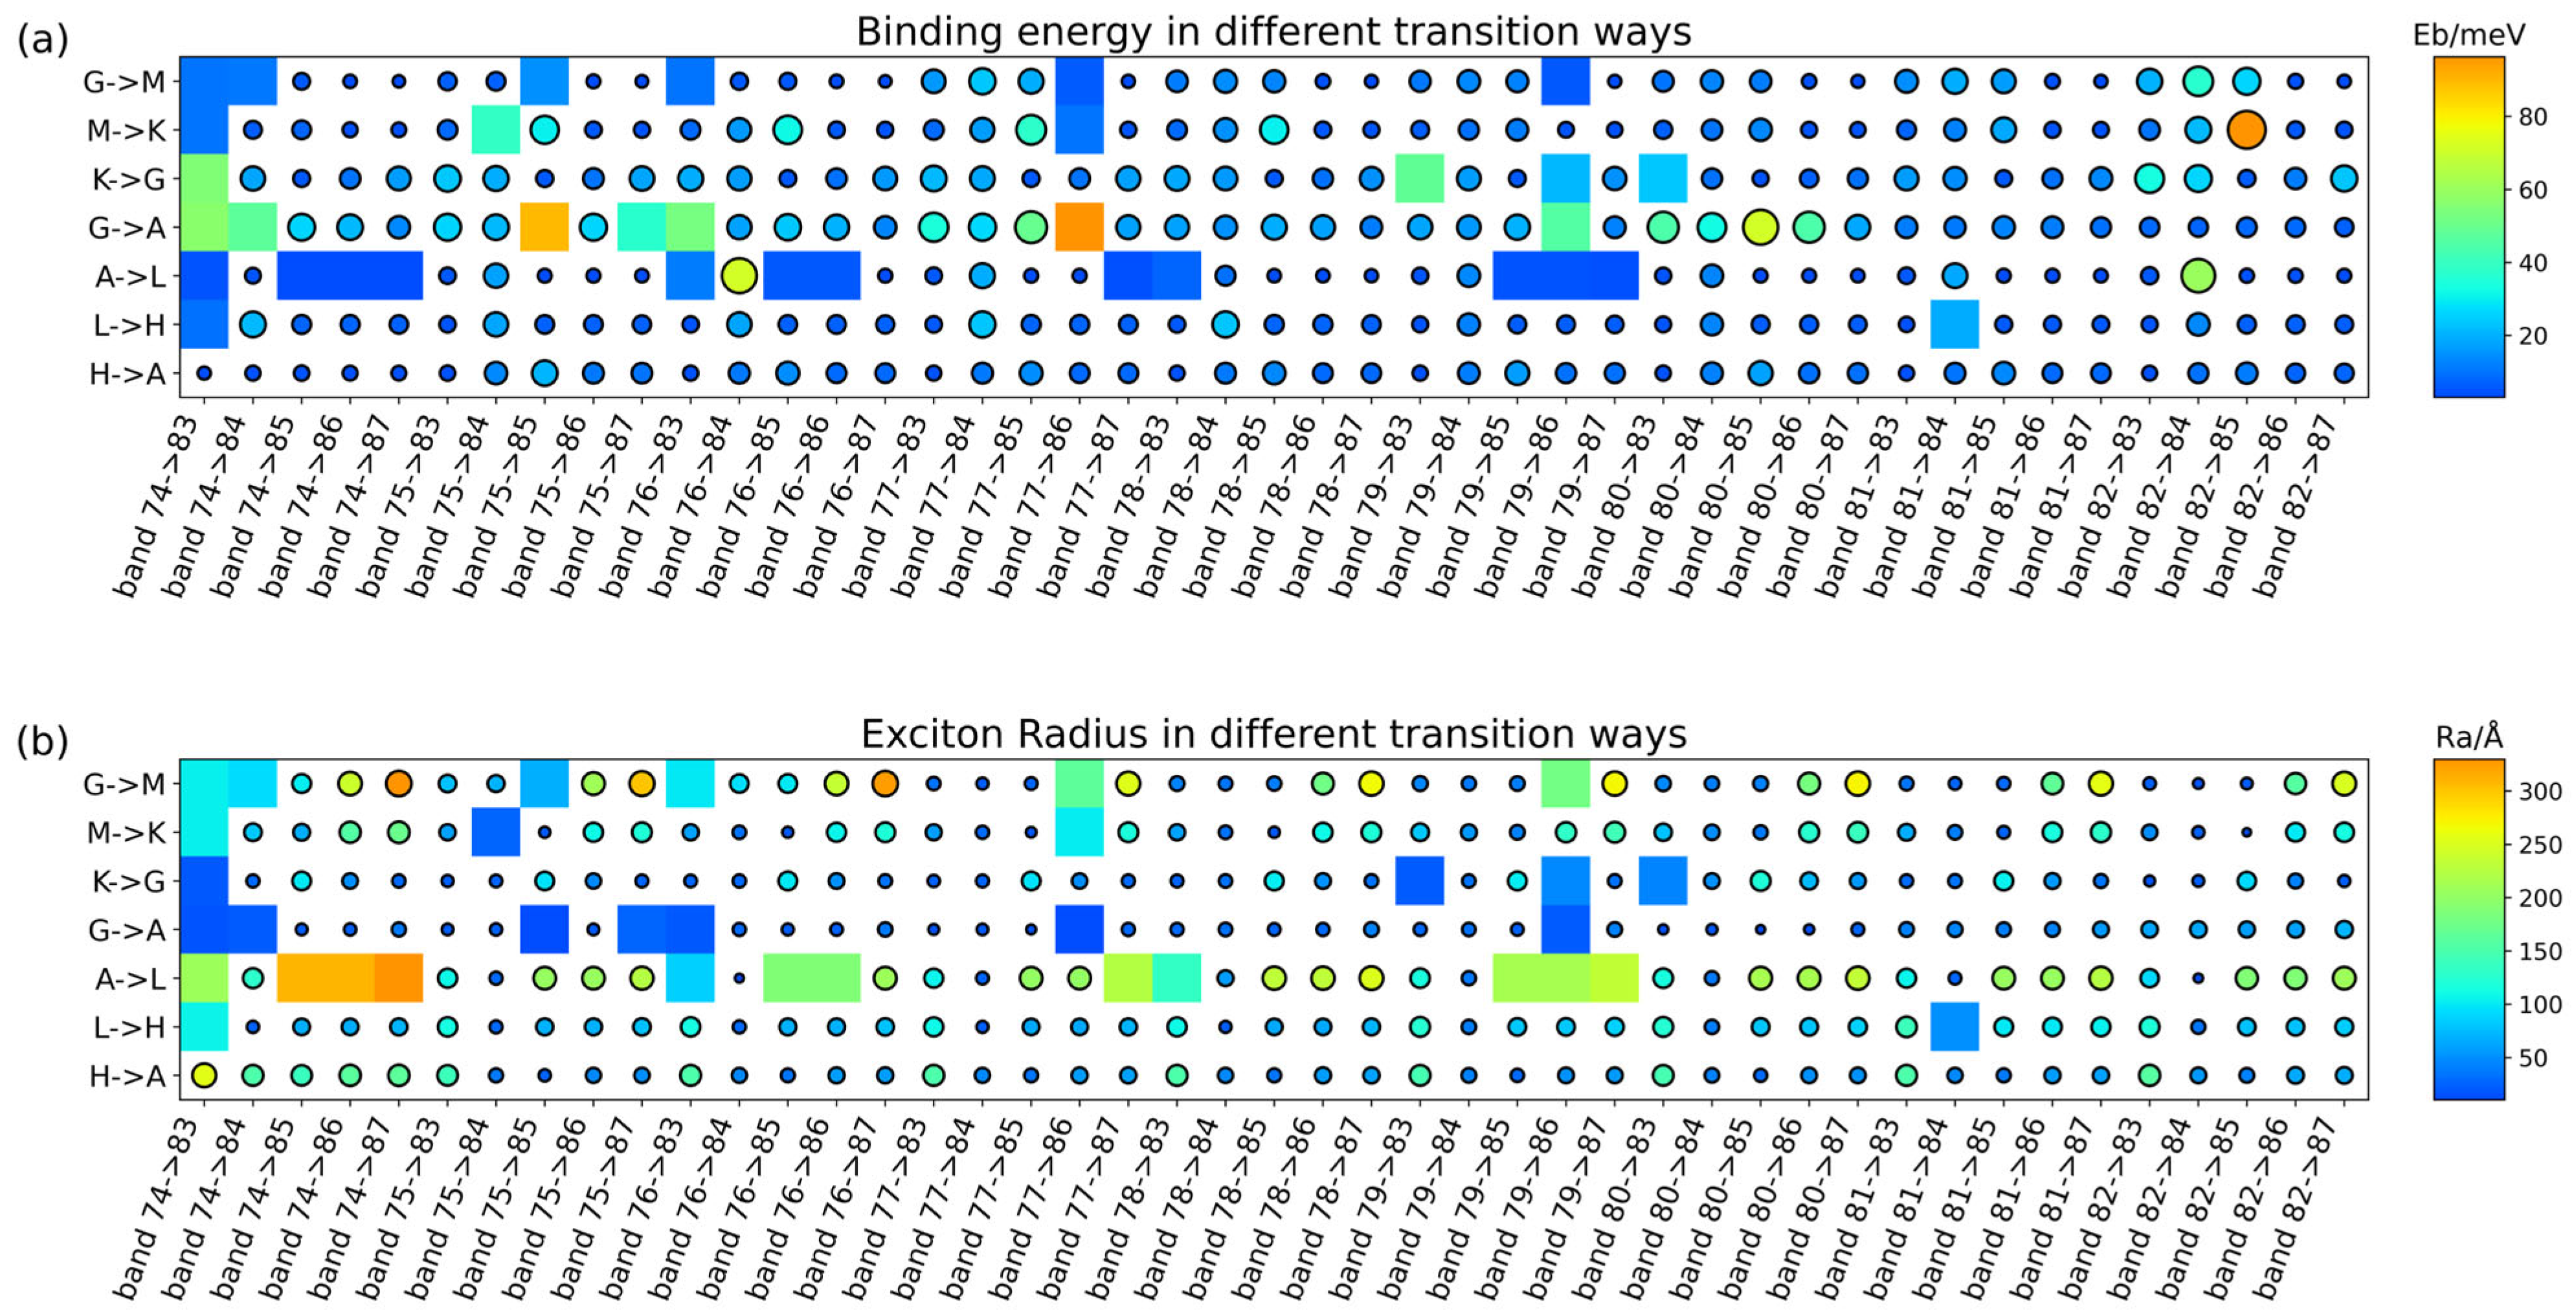
2.5. Calculations of the Exciton Binding Energy

2.5.1. Wannier Model

Exciton binding energy was calculated by the Wannier-Mott quasi-particle model adapted for the dimension of the material. Given that carbon nitrides structures are characterized as π -conjugate linkages, which determine a weak localized behavior of excitons, the applicability of Wannier’s exciton model is established as a matter of nature. Traditionally, carbon nitrides are classified as uniformly 2D materials. The separation between the electron and hole is generally larger than the lattice parameter, and therefore the dielectric function of a lattice can be considered as a constant in the form of an electron–hole Coulombic potential [8]. But when the exciton behavior was taken into account, the motion of the material is not always consist with the geometry connectivity [33], The 2D zigzag arranged melon is supposed to generate 2D behaving excitons and PTI/Li+Cl behaves like a 3D exciton. Thus, the exciton binding energy and the exciton radius can be determined by [34,35,36]:
E b = 2 α 1 2 R y m r * E r 2
R e = α 1 2 2 a 0 E r m r *
where a 0 is the Bohr radius, R y is the Rydberg unit of energy and α is the Hausdorff fractional dimension determined by the degree of anisotropy. When α = 3, the equations above become the most familiar form used to evaluate the E b of 3D materials. Given the anisotropy of effective mass, the binding energy of various activating patterns of all bands can likewise be scanned within an energy range corresponding to the wavelength of excitation light; the total number of combinations is the number of energy bands covered by the excitation energy multiplied by the number of k-points. In this work, only high-symmetry k-points were picked out as a relative concise sample. Furthermore, the binding energy matrix is labeled by the transition dipole moment matrix as well as the wavelength distribution matrix (Figure 8). The filtering conditions are: the transition dipole moment (TDM) value of the transition mode is larger than the upper quartile of the data set, and the corresponding wavelength is larger than the excitation wavelength of the laser used for the experiments (Figures S11 and S12).
It can be observed that, for the radius presented in the map above, most exciton radiuses significantly exceed the cell parameters, so some excitons are delocalized over several unit cells. This suggests that the exciton perceives the surrounding medium akin to a homogeneous dielectric medium, justifying the application of Wannier’s model to computing the exciton binding energy. After further screening through TDM, the remaining transition modes correspondingly exhibit exciton binding energies that generally match the experimental observations. It is worth mentioning that our labeling of G → A on the heatmap of E b is not rigorous, and in fact the corresponding TDMs and effective masses, and hence the exciton binding energies, can be computed for each point on this path. This simplified substitution is approximated such that the curves corresponding to this K-path share the same effective mass value.

2.5.2. GW-BSE Method

GW is the first principal approach to describe many-body self-energy under quasiparticle approximation. The usual exchange–correlation potential is substituted by the quasiparticle self-energy obtained by Green’s function G and screened by Coulomb interaction W and other two functions that do not appear in the nomination. The exciton binding energy is subsequently calculated by solving the BSE equation. According to the simulation conclusions, fully self-consistent quasiparticle computation (marked as scGW), partially self-consistent quasiparticle computation (GW0) and single-shot quasiparticle calculation (G0W0) greatly overestimate the bandgap of carbon nitrides alike. Based on the past computation experience of carbon nitride, this metal-free conjugate system has a special compatibility with the PBE functional. PBE did not underestimate the conjugate effect; the undervalued bandgap provided by PBE (~2.5 eV) should be traced to the misunderstanding and misnaming of carbon nitride structures. It is not an exception that GW produces unsatisfactory yield results compared to experimental observations since the computed band gaps often exhibit a substantial overestimation relative to experimental values [37] (Figure 9). As shown in Figure 9b, the calculated results mutually exhibit a distinct blue shift compared with the experiment value.
The calculated band gap at the GGA level is typically smaller than the GW-calculated band gap, resulting in a proportionally larger dielectric function (given the inverse relationship between polarizability and the band gap of a system). Although GW corrects by the imposition of many-body self-energy and correction of quasi-particle energy, it concurrently weakens the screening effect of the Coulomb interaction [38], thereby diminishing the agreement with experimental band gaps.

3. Computational and Experimental Details

Depicted in Figure S1 is the support bilayer structure of the melon with a relative displacement of 20% of the length of the unit cell along the x axis and 10% of the length along the y axis, the local minimum of the exfoliation counter surface [39]. Likewise, for the PTI/Li+Cl crystals, DFT calculations were carried out on the basis of the crystal structure proposed by Lin et al. [5].
The ultraviolet–visible diffuse reflectance spectra (UV–vis DRS) were measured on a Varian Cary 500 Scan UV-Vis system (Varian Co., Palo Alto, CA, USA). The steady state temperature-dependent photoluminescence (TDPL) measurements, in a range of 10–300 K, were recorded on a Fluorolog-3 spectrophotometer (HORIBA Co., Tokyo, Japan). The transient absorption spectra (TASs) were performed on a Helios (Ultrafast Systems, Sarasota, FL, USA) spectrometer using a regeneratively amplified femtosecond Ti: sapphire laser system (Spitfire Pro-F1KXP, Spectra-Physics (MKS Instruments, Milpitas, CA, USA); frequency, 1 kHz; max pulse energy ~8 mJ; pulse width, 120 fs) with a pump wavelength of 360 nm at room temperature.
All DFT calculations were performed employing the projector augmented wave (PAW) method in the Vienna ab initio simulation package (VASP) 5.4 code [40,41]. The calculations were carried out by the GGA exchange correlation functional of Perdew, Burke and Ernzerhof (PBE) [42], with the cut-off of the plane-wave expansion set to 550 eV. The van del Waals corrections were performed via Grimme’s D2 method [43]. The geometry optimizations were finished using Γ-centered 3 × 3 × 4 K-mesh until the total energy difference converged to 10−7 eV and the Hellmann–Feynman forces on each atom were less than 0.01 eV·Å−1. The regular plane wave cutoff energy was set to 550 eV [44], and the GW cutoff energy was set to 366 eV as the default value of 2/3 of the common cutoff energy.

4. Conclusions

Temperature-dependent PL measurements and exciton binding energy are related by the fluorescence quantum efficiency under the assumption that the depopulation of photogenerated excitons is dominated by the thermal dissociation and radiative annihilation processes [9,10]. In order to establish the correspondence between different transition modes and the relevant binding energies, the wavelengths of the TDPL spectra were interpreted in the energy gap between the excited states and ground state, while the fluorescence intensity at each wavelength was correlated with the probability of hopping occurring between the two states which can thereby be manifested by TDM. The augmentation of the layers increases the number of bands in the calculations, considering the probable inclusion of excited states, which corresponds to the observed tailing phenomena in the experimental absorption spectra. The screening search workflow is hard to generalize universally, for the shape of band is strongly influenced by the choice of paths in the Brillouin zone. No matter what fitting scheme is applied, the unpredictable non-differentiable points have to be eliminated by manual intervention, either by splitting or rearranging the energy bands. Anyhow, leaving aside the tedious works above, the results are still not ideal when it comes to physical quantities related to effective mass other than PTI/Li+Cl; these deviations may not only be attributable to the misalignment of molecule structure, but rather to the backwardness of the description with respect to the excitation model. In the case of GW methods, while it may seem that first-principal methods are employed in describing the energy structure, the fundamental particle remains rooted in a quasi-particle framework. Upon examination of the hydrogen-like model used to calculate binding energy, the formula structure still relies on Columbic interactions, which is essentially a phenomenological approach.

Supplementary Materials

The following supporting information can be downloaded at: https://www.mdpi.com/article/10.3390/catal14040262/s1.

Author Contributions

Conceptualization, W.L.; methodology, Z.L. and X.C.; validation, Z.L., X.C. and W.L.; formal analysis, Z.L.; data curation, Z.L.; writing—original draft preparation, Z.L.; writing—review and editing, W.L.; supervision, W.L.; funding acquisition, W.L. All authors have read and agreed to the published version of the manuscript.

Funding

This work was financially supported by the National Natural Science Foundation of China (22373018 and 21973014).

Data Availability Statement

The data presented in this study are available on request from the corresponding authors.

Conflicts of Interest

The authors declare that they have no known competing financial interests or personal relationships that could have appeared to influence the work reported in this paper.

References

  1. Wang, X. A metal-free polymeric photocatalyst for hydrogen production from water under visible light. Nat. Mater. 2009, 8, 76. [Google Scholar] [CrossRef] [PubMed]
  2. Ong, W.-J.; Tan, L.-L.; Ng, Y.H.; Yong, S.-T.; Chai, S.-P. Graphitic Carbon Nitride (g-C3N4)-Based Photocatalysts for Artificial Photosynthesis and Environmental Remediation: Are We a Step Closer To Achieving Sustainability? Chem. Rev. 2016, 116, 7159–7329. [Google Scholar] [CrossRef]
  3. Kessler, F.K.; Zheng, Y.; Schwarz, D.; Merschjann, C.; Schnick, W.; Wang, X.; Bojdys, M.J. Functional carbon nitride materials—Design strategies for electrochemical devices. Nat. Rev. Mater. 2017, 2, 17030. [Google Scholar] [CrossRef]
  4. Steinmann, S.N.; Melissen, S.T.A.G.; Le Bahers, T.; Sautet, P. Challenges in calculating the bandgap of triazine-based carbon nitride structures. J. Mater. Chem. A 2017, 5, 5115–5122. [Google Scholar] [CrossRef]
  5. Lin, L.; Lin, Z.; Zhang, J.; Cai, X.; Lin, W.; Yu, Z.; Wang, X. Molecular-level insights on the reactive facet of carbon nitride single crystals photocatalysing overall water splitting. Nat. Catal. 2020, 3, 649–655. [Google Scholar] [CrossRef]
  6. Lotsch, B.V.; Döblinger, M.; Sehnert, J.; Seyfarth, L.; Senker, J.; Oeckler, O.; Schnick, W. Unmasking Melon by a Complementary Approach Employing Electron Diffraction, Solid-State NMR Spectroscopy, and Theoretical Calculations-Structural Characterization of a Carbon Nitride Polymer. Chem. Eur. J. 2007, 13, 4969–4980. [Google Scholar] [CrossRef]
  7. Wirnhier, E.; Döblinger, M.; Gunzelmann, D.; Senker, J.; Lotsch, B.V.; Schnick, W. Poly(triazine imide) with Intercalation of Lithium and Chloride Ions [(C3N3)2(NHxLi1−x)3⋅LiCl]: A Crystalline 2D Carbon Nitride Network. Chem. Eur. J. 2011, 17, 3213–3221. [Google Scholar] [CrossRef]
  8. Wannier, G.H. The Structure of Electronic Excitation Levels in Insulating Crystals. Phys. Rev. 1937, 52, 191–197. [Google Scholar] [CrossRef]
  9. Das, D.; Shinde, S.L.; Nanda, K.K. Temperature-Dependent Photoluminescence of g-C3N4: Implication for Temperature Sensing. ACS Appl. Mater. Interfaces 2016, 8, 2181–2186. [Google Scholar] [CrossRef]
  10. Chen, Z.; Yu, C.; Shum, K.; Wang, J.J.; Pfenninger, W.; Vockic, N.; Midgley, J.; Kenney, J.T. Photoluminescence study of polycrystalline CsSnI3 thin films: Determination of exciton binding energy. J. Lumin. 2012, 132, 345–349. [Google Scholar] [CrossRef]
  11. Le Bahers, T.; Rérat, M.; Sautet, P. Semiconductors Used in Photovoltaic and Photocatalytic Devices: Assessing Fundamental Properties from DFT. J. Phys. Chem. C 2014, 118, 5997–6008. [Google Scholar] [CrossRef]
  12. Reynolds, D.C.; Collins, T.C.; Sturge, M. Excitons: Their Properties and Uses. Phys. Today 1983, 36, 73–75. [Google Scholar] [CrossRef]
  13. Haug, H.; Koch, S.W. Quantum Theory of the Optical and Electronic Properties of Semiconductors; World Scientific: Singapore, 2009. [Google Scholar] [CrossRef]
  14. Zhang, Y.; Pan, Q.; Chai, G.; Liang, M.; Dong, G.; Zhang, Q.; Qiu, J. Synthesis and luminescence mechanism of multicolor-emitting g-C3N4 nanopowders by low temperature thermal condensation of melamine. Sci. Rep. 2013, 3, 1943. [Google Scholar] [CrossRef] [PubMed]
  15. Yuan, Y.; Zhang, L.; Xing, J.; Utama, M.I.; Lu, X.; Du, K.; Li, Y.; Hu, X.; Wang, S.; Genc, A.; et al. High-yield synthesis and optical properties of g-C3N4. Nanoscale 2015, 7, 12343–12350. [Google Scholar] [CrossRef] [PubMed]
  16. Shan, W.; Xie, X.C.; Song, J.J.; Goldenberg, B. Time-resolved exciton luminescence in GaN grown by metalorganic chemical vapor deposition. Appl. Phys. Lett. 1995, 67, 2512–2514. [Google Scholar] [CrossRef]
  17. Misra, P.; Sharma, T.K.; Kukreja, L.M. Temperature dependent photoluminescence processes in ZnO thin films grown on sapphire by pulsed laser deposition. Curr. Appl. Phys. 2009, 9, 179–183. [Google Scholar] [CrossRef]
  18. Nunes, R.W.; Gonze, X. Berry-phase treatment of the homogeneous electric field perturbation in insulators. Phys. Rev. B 2001, 63, 155107. [Google Scholar] [CrossRef]
  19. Souza, I.; Iniguez, J.; Vanderbilt, D. First-principles approach to insulators in finite electric fields. Phys. Rev. Lett. 2002, 89, 117602. [Google Scholar] [CrossRef]
  20. Gajdoš, M.; Hummer, K.; Kresse, G.; Furthmüller, J.; Bechstedt, F. Linear optical properties in the projector-augmented wave methodology. Phys. Rev. B 2006, 73, 045112. [Google Scholar] [CrossRef]
  21. Abramowitz, M.S.I. Handbook of Mathematical Functions: With Formulas, Graphs, and Mathematical Tables; U.S. Government Printing Office: New York, NY, USA, 1972.
  22. Kane, E.O. Band Structure of Indium Antimonide. J. Phys. Chem. Solids 1957, 1, 249–261. [Google Scholar] [CrossRef]
  23. Whalley, L.D.; Frost, J.M.; Morgan, B.J.; Walsh, A. Impact of nonparabolic electronic band structure on the optical and transport properties of photovoltaic materials. Phys. Rev. B 2019, 99, 085207. [Google Scholar] [CrossRef]
  24. Huy, H.A.; Aradi, B.; Frauenheim, T.; Deák, P. Calculation of carrier-concentration-dependent effective mass in Nb-doped anatase crystals of TiO2. Phys. Rev. B 2011, 83, 155201. [Google Scholar] [CrossRef]
  25. Yang, Y.; Ostrowski, D.P.; France, R.M.; Zhu, K.; van de Lagemaat, J.; Luther, J.M.; Beard, M.C. Observation of a hot-phonon bottleneck in lead-iodide perovskites. Nat. Photonics 2015, 10, 53–59. [Google Scholar] [CrossRef]
  26. Whalley, L.D. Effmass: An effective mass package. J. Open Source Softw. 2018, 3, 797. [Google Scholar] [CrossRef]
  27. Burstein, E. Anomalous Optical Absorption Limit in InSb. Phys. Rev. 1954, 93, 632–633. [Google Scholar] [CrossRef]
  28. Moss, T.S. The Interpretation of the Properties of Indium. Proc. Phys. Soc. Sect. B 1954, 67, 775. [Google Scholar] [CrossRef]
  29. Dapkus, P.D.; Holonyak, N., Jr.; Burnham, R.D.; Keune, D.L. Direct Observation Of A Dynamic Burstein Shift In A GaAs:Ge Platelet Laser. Appl. Phys. Lett. 2003, 16, 93–95. [Google Scholar] [CrossRef]
  30. Moss, T.S. Theory of Intensity Dependence of Refractive Index. Phys. Status Solidi B 1980, 101, 555–561. [Google Scholar] [CrossRef]
  31. Li, X.; Wang, J.; Xia, J.; Fang, Y.; Hou, Y.; Fu, X.; Shalom, M.; Wang, X. One-Pot Synthesis of CoS2 Merged in Polymeric Carbon Nitride Films for Photoelectrochemical Water Splitting. ChemSusChem 2022, 15, e202200330. [Google Scholar] [CrossRef]
  32. Godin, R.; Wang, Y.; Zwijnenburg, M.A.; Tang, J.; Durrant, J.R. Time-Resolved Spectroscopic Investigation of Charge Trapping in Carbon Nitrides Photocatalysts for Hydrogen Generation. J. Am. Chem. Soc. 2017, 139, 5216–5224. [Google Scholar] [CrossRef]
  33. He, X.-F. Fractional dimensionality and fractional derivative spectra of interband optical transitions. Phys. Rev. B 1990, 42, 11751–11756. [Google Scholar] [CrossRef] [PubMed]
  34. He, X.F. Excitons in anisotropic solids: The model of fractional-dimensional space. Phys. Rev. B Condens. Matter. 1991, 43, 2063–2069. [Google Scholar] [CrossRef] [PubMed]
  35. Panda, A.; Renshaw, C.K.; Oskooi, A.; Lee, K.; Forrest, S.R. Excited State and Charge Dynamics of Hybrid Organic/Inorganic Heterojunctions. II. Experiment. Phys. Rev. B Condens. Matter Mater. Phys. 2014, 90, 045303. [Google Scholar] [CrossRef]
  36. Zhu, X.Y.; Yang, Q.; Muntwiler, M. Charge-Transfer Excitons at Organic Semiconductor Surfaces and Interfaces. Acc. Chem. Res. 2009, 42, 1779. [Google Scholar] [CrossRef] [PubMed]
  37. Grumet, M.; Liu, P.; Kaltak, M.; Klimeš, J.; Kresse, G. Beyond the quasiparticle approximation: Fully self-consistent GW calculations. Phys. Rev. B 2018, 98, 155143. [Google Scholar] [CrossRef]
  38. Shishkin, M.; Marsman, M.; Kresse, G. Accurate Quasiparticle Spectra from Self-ConsistentGWCalculations with Vertex Corrections. Phys. Rev. Lett. 2007, 99, 246403. [Google Scholar] [CrossRef] [PubMed]
  39. Cai, X.; Li, Y.; Zhang, Y.; Lin, W. π–π Interaction-Driven Charge Separation and Interlayer Transfer in Polymeric Carbon Nitride. ACS Catal. 2023, 13, 15877–15885. [Google Scholar] [CrossRef]
  40. Blöchl, P.E. Projector augmented-wave method. Phys. Rev. B 1994, 50, 17953. [Google Scholar] [CrossRef]
  41. Kresse, G.; Joubert, D. From ultrasoft pseudopotentials to the projector augmented-wave method. Phys. Rev. B 1999, 59, 1758. [Google Scholar] [CrossRef]
  42. Perdew, J.P.; Burke, K.; Ernzerhof, M. Generalized gradient approximation made simple. Phys. Rev. Lett. 1996, 77, 3865. [Google Scholar] [CrossRef]
  43. Grimme, S. Semiempirical GGA-type density functional constructed with a long-range dispersion correction. J. Comput. Chem. 2006, 27, 20495. [Google Scholar] [CrossRef]
  44. Thomas, A.; Fischer, A.; Goettmann, F.; Antonietti, M.; Muller, J.-O.; Schlogl, R.; Carlsson, J.M. Graphitic carbon nitride materials: Variation of structure and morphology and their use as metal-free catalysts. J. Mater. Chem. 2008, 18, 4893–4908. [Google Scholar] [CrossRef]
Figure 1. (a,c): Temperature-dependent PL spectra of PTI/Li+Cl and melon. (b,d): fitting process of E b of melon and PTI applying Equation (2), the blue line is the fitted curve and the scatter points were selected from the peak values of PL data at different temperatures.
Catalysts 14 00262 g001
Figure 2. PL spectra of melon in molten salt treated for different durations. (a) Pristine melon; (b) melon treated in molten salt for 4 h, the most popular processing time to synthesis PHI; (c) melon treated in molten salt for 8 h; (d) melon treated in molten salt over 12 h, widely known as PTI/Li+Cl.
Catalysts 14 00262 g002
Figure 3. The deconvolution of PTI/Li+Cl at (a) 50 K, (b) 200 K and (c) 300 K, the four peaks of similar width from left to right correspond to the P1-P4 labeled in the text. (d) The deconvolution of melon at 300 K, only this temperature is chosen, for no visible shape change with the variation in temperature was observed comparing with PTI/Li+Cl, and an extra peak merged at ~464 nm.
Catalysts 14 00262 g003
Figure 4. Dielectric function of PTI/Li+Cl along major axis of primitive cells. (ac) The dielectric contribution of the ionic effect. (df) The dielectric contribution of electric density.
Catalysts 14 00262 g004
Figure 5. Boxplot of the calculated reduced effective mass of selected bands along different k-point paths. High symmetry k-points were chosen to be the segmentation points of the fitted curve to avoid the cusps introduced by the discontinuity of the paths.
Catalysts 14 00262 g005
Figure 6. Burstein–Moss band shift value calculated by two different effective mass: (a) parabolic-fiited effective mass, (b) optical effective mass calculated by Kane dispersion.In the same was as effective mass, the anisotropy of the resulting band shift values was considered on the same K-path as that used for the band calculation.
Catalysts 14 00262 g006
Figure 7. ΔA vs. the wavelength plot for different times after the light pulse; time zero corresponds to the maximum overlap of the excitation and the probe pulse. (a) Photobleaching process of melon; (b) photobleaching process of PTI/Li+Cl.
Catalysts 14 00262 g007
Figure 8. (a) Binding energy of different transition way, (b) exciton radius of different transition ways. All marked exciton binding energies and corresponding exciton radius values of PTI/Li+Cl within the transition energy range. The circular marks in the heatmap indicate the transition mode that does not satisfy the two screening conditions of TDM and experimental excitation energy, and the square colored blocks indicate the results that pass the screening.
Catalysts 14 00262 g008
Figure 9. (a) Real part of dielectric function obtained by GW; (b) reflection function calculated with the dielectric function in (a) three typical structures. The solid lines are the theoretical value, the dashed lines are from the experimental observation.
Catalysts 14 00262 g009
Table 1. List of dielectric tensors of different representative carbon nitride structures, which fits the real part of the zero points value in Figure 2.
ε ε x x e l e ε y y e l e ε z z e l e ε x x i o n ε y y i o n ε z z i o n ε x x r ε y y r ε z z r
PTI4.884.872.442.032.250.8766.917.122.90
PTI-noion3.973.981.941.381.380.2735.355.361.65
PHI1.971.971.150.5130.510.03122.472.470.54
PHI(1k)4.063.791.681.921.620.2175.985.401.88
melon2.382.231.210.720.450.03893.102.680.757
Disclaimer/Publisher’s Note: The statements, opinions and data contained in all publications are solely those of the individual author(s) and contributor(s) and not of MDPI and/or the editor(s). MDPI and/or the editor(s) disclaim responsibility for any injury to people or property resulting from any ideas, methods, instructions or products referred to in the content.

