Article

Investigating the Long-Term Kinetics of Pd Nanoparticles Prepared from Microemulsions and the Lindlar Catalyst for Selective Hydrogenation of 3-Hexyn-1-ol

1
Institute of Technical Chemistry, University of Stuttgart, 70550 Stuttgart, Germany
2
Max Planck Institute for Solid State Research, Heisenbergstraße 1, 70569 Stuttgart, Germany
3
Institute of Physical Chemistry, University of Stuttgart, 70550 Stuttgart, Germany
*
Authors to whom correspondence should be addressed.
Catalysts 2024, 14(4), 271; https://doi.org/10.3390/catal14040271
Submission received: 9 February 2024 / Revised: 5 April 2024 / Accepted: 12 April 2024 / Published: 17 April 2024
(This article belongs to the Section Nanostructured Catalysts)

Abstract

:
The effect of non-saturated corner and edge sites of Pd particles on the long-term selectivity of cis-3-hexen-1-ol in the hydrogenation of 3-hexyn-1-ol was studied in this work. Non-supported Pd agglomerates were synthesized through the microemulsion synthesis route and used at   n a l k y n o l / A P d ratios between 0.08 and 21 m o l / m 2 for the catalytic conversion of 3-hexyn-1-ol for 20 h. The selectivity of the cis-hexenol product increased by reducing the quantity of Pd catalytic sites (increasing the n a l k y n o l / A P d ratio) without introducing any modifier or doping agent to poison the nonselective sites. Then, Pd aggregates with fused primary particles and, thus, fewer corner and edge sites were produced through thermal sintering of the agglomerates at 473–723 K. By comparing the catalytic performance of the agglomerates and aggregates, it was observed that at a rather similar kinetic behavior (99.99% conversion and 85–89% selectivity to cis-hexenol), the sintered aggregates could stay selective despite a catalytic surface area about seven times larger. This emphasizes the role of low-coordinated edge and corner sites on the final selectivity of the cis product and demonstrates that thermal sintering allows the number of non-selective sites to be reduced without any need for toxic or organic doping agents or modifiers.

1. Introduction

Selective hydrogenation is a key process for the production of value-added olefinic compounds, which are frequently used in different industries, including pharmaceuticals and the fine chemicals industry [1]. According to 
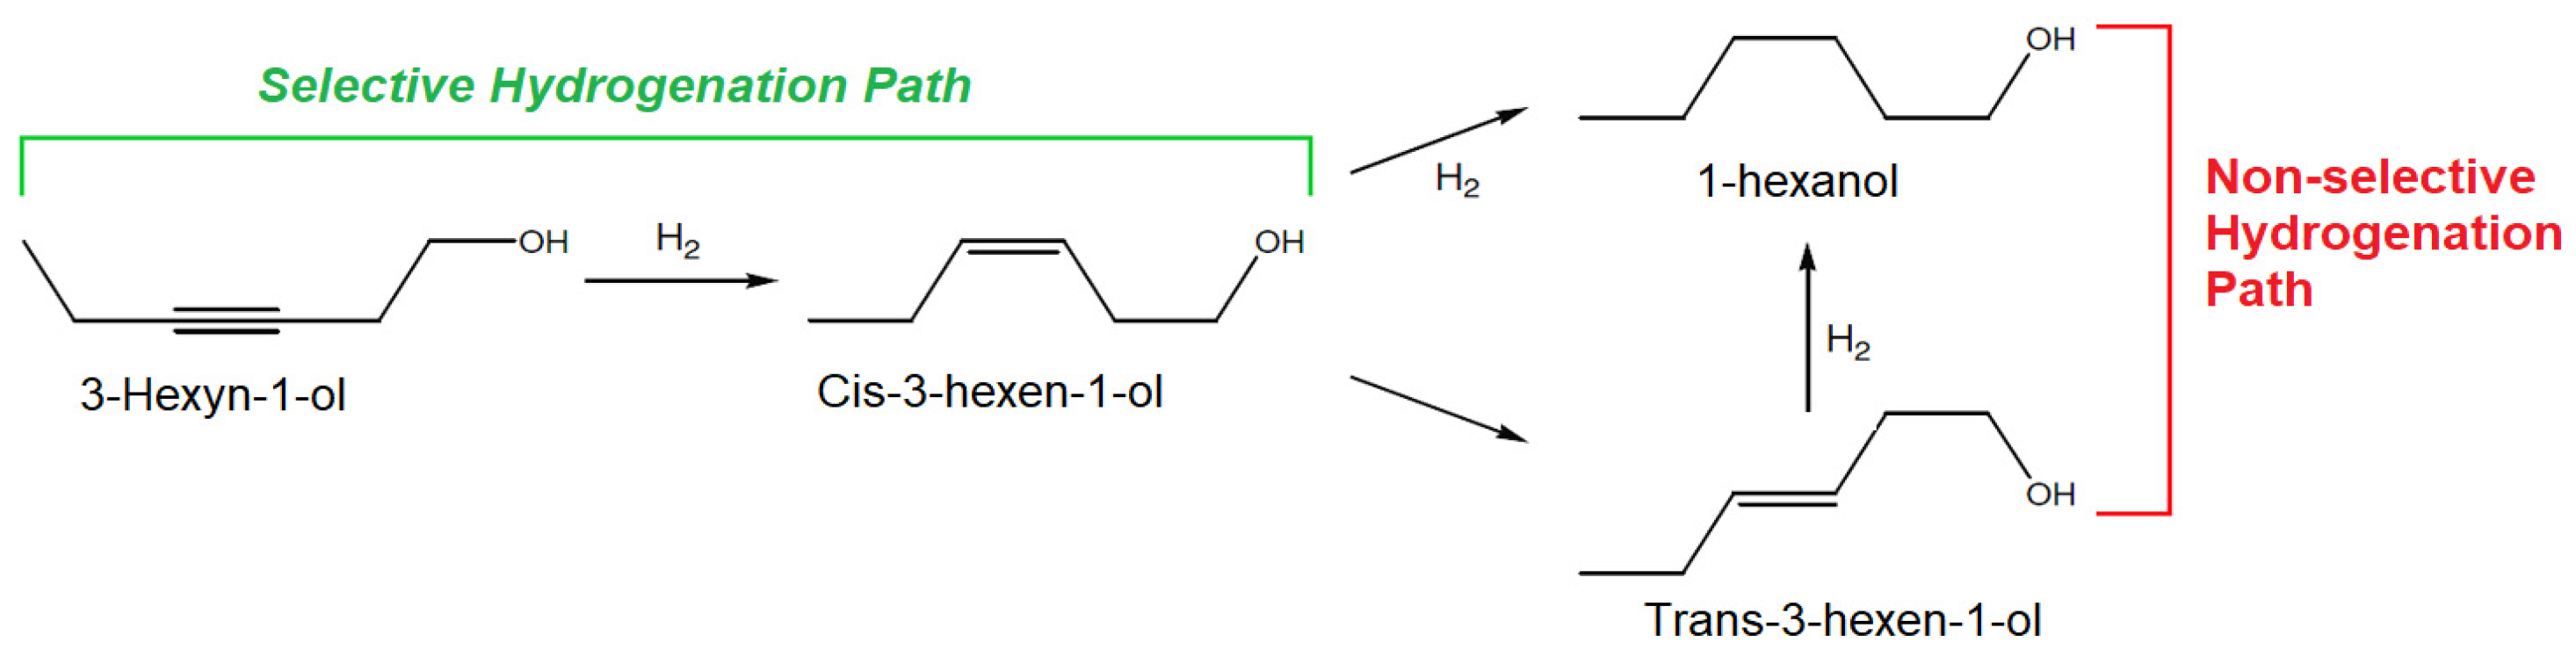
Scheme 1, first, a triple C≡C bond is hydrogenated through the Horiuti–Polanyi mechanism [2]. If the catalyst cannot establish selective behavior, the produced alkene species could be re-adsorbed, isomerized, and/or overhydrogenated into alkane products.
Various metals such as Pd, Pt, Rh, Ru, Fe, and Ni have been used as catalysts for selective hydrogenation reactions, which possess different properties in terms of cost, toxicity, and stability [4]. There are different adsorption sites on the surface of such solid catalysts [5,6]. Among them, the low-coordinated and non-saturated kink and edge sites are capable of intensifying undesirable reactions, including isomerization and overhydrogenation, which, in the end, decreases the selectivity toward valuable intermediate alkene products [6]. It was shown that the low-coordinated edge and corner sites facilitate the re-adsorption of produced alkenes and the conversion of them to alkane species [5]. Therefore, the term ‘design of a selective catalyst’ became an interesting topic [5,6].
Thanks to their unfilled d orbitals, Pd-based catalysts are among the most active candidates in catalytic hydrogenation reactions [7]. However, as noted above, the low selectivity (caused by the re-adsorption of olefinic compounds mostly on their low-coordinated edge and kink sites) is still a major issue, which makes this catalytic hydrogenation process a structure-sensitive reaction [5]. Thereby, different strategies have been used till now to improve the selectivity of these types of catalysts during catalytic hydrogenation reactions, including masking the nonselective sites with P, N, and S-containing ligands [8], dilution of the active phase, changing the local coordination environment of Pd by alloying or adding a second metal like Cu [9] or Pt [10], and changing the particle size and binding energy of Pd0 species by using different supports like carbon materials [11].
Since 1952, the Lindlar catalyst [12] has been the most widely used candidate for selective hydrogenation applications in the industry, which includes 5 wt.% Pd on CaCO3, treated with PbO or Pb acetate, and 0.05–1 molar equivalents of quinoline. These modifiers mostly cover the nonselective active sites on the Pd surface. Although the Lindlar catalyst is still one of the best Pd-based catalysts, the existence of toxic lead and quinoline for limiting the accessibility of the reactants to nonselective sites remains a major environmental challenge [13]. Hence, various efforts have been made to replace the Lindlar catalyst with a more environmentally-friendly counterpart. In this way, BASF developed two generations of supported catalysts named LF100 and LF200, in which the nonselective sites of colloidal Pd species are blocked by the HHDMA organic modifier [3,14]. However, Paganelli et al. [9] showed that during catalytic hydrogenation of 3-hexyn-1-ol at n a l k y n o l / n P d of 500, the conversion value of BASF LF100 catalyst was only 20.7% with 96.1% selectivity to hexenol compounds after about 210 min.
In our previous work [15], it was shown that when spherical cavities of a silica support (FDU-12) were impregnated by microemulsion-prepared Pd agglomerates having a rather broad distribution of particles ( d P = 2 15   n m ), these could not efficiently block the accessibility of the intermediate cis-hexenol species to the surface sites. Mainly 1-hexanol was obtained as a final product during the catalytic hydrogenation of 3-hexyn-1-ol. On the contrary, when Pd agglomerates were added to the corresponding precursors during the synthesis of FDU-12, larger aggregates ( d P = 100 150   n m ) were mainly formed at the pore mouths upon thermal treatment at 823 K. This increased the selectivity of the cis-hexenol product to 91–95% at 97–99% conversion during 200 min and could indicate the importance of the aggregation and blockage of the low-coordinated sites, or reduction of the available Pd surface sites, by fusion of the Pd particles.
Recently, Ballesteros-Soberanas et al. [16] reported on the catalytic hydrogenation of alkynols using the non-supported Pd0 species released by the in-situ reduction of the primary Pd salts like P d C l 2 and P d S O 4 with H 2 in the reaction environment in order to generate Pd species. The most important factors that affected the selectivity value were the number of available Pd sites (in the order of ppm) and the small size of the Pd particles. They used an autoclave reactor with a stirring magnet (at 450 RPM) at a temperature range of 303–363 K and p H 2 = 0.5 MPa. Compared to Pd black (at n a l k y n o l / n P d of 2.5 × 10 3 ) and 1 wt.% Pd/C ( n a l k y n o l / n P d   of 25 × 10 3 ), both of which showed full hydrogenation behavior, Pd0 from P d C l 2 at n a l k y n o l / n P d   of 25 × 10 3   and 500 × 10 3 was highly selective (75–95%) during the same duration (400 min). This emphasizes the importance of the application of the optimal amount of Pd species in a catalytic hydrogenation reaction.
Therefore, considering the effect of the availability of non-saturated Pd surface sites on the final selectivity of the intermediate cis-alkenol product, we studied the kinetic behavior of the microemulsion-prepared Pd agglomerates and also their sintered aggregates in an autoclave reactor for catalytic hydrogenation of 3-hexyn-1-ol in this work.

2. Results and Discussion

The reaction was performed in a catalytic hydrogenation setup (Scheme S1), and the general results of the catalytic tests are shown in Table 1. Also, the corresponding GC peaks of the reagents and products are shown in Figure S1. For comparison, the industrial catalysts Lindlar and BASF LF200 were also used. The values of activity and initial rate of the first hydrogenation step were determined using the average slope between 0.2   H 2   e q u i v a l e n t s   ( e q . )  and  0.8   H 2   e q . and if the hydrogen uptake did not reach   0.8   H 2   e q . ,   the corresponding value at the end of the curve was taken (especially when the cis-alkenol was used as a reagent).
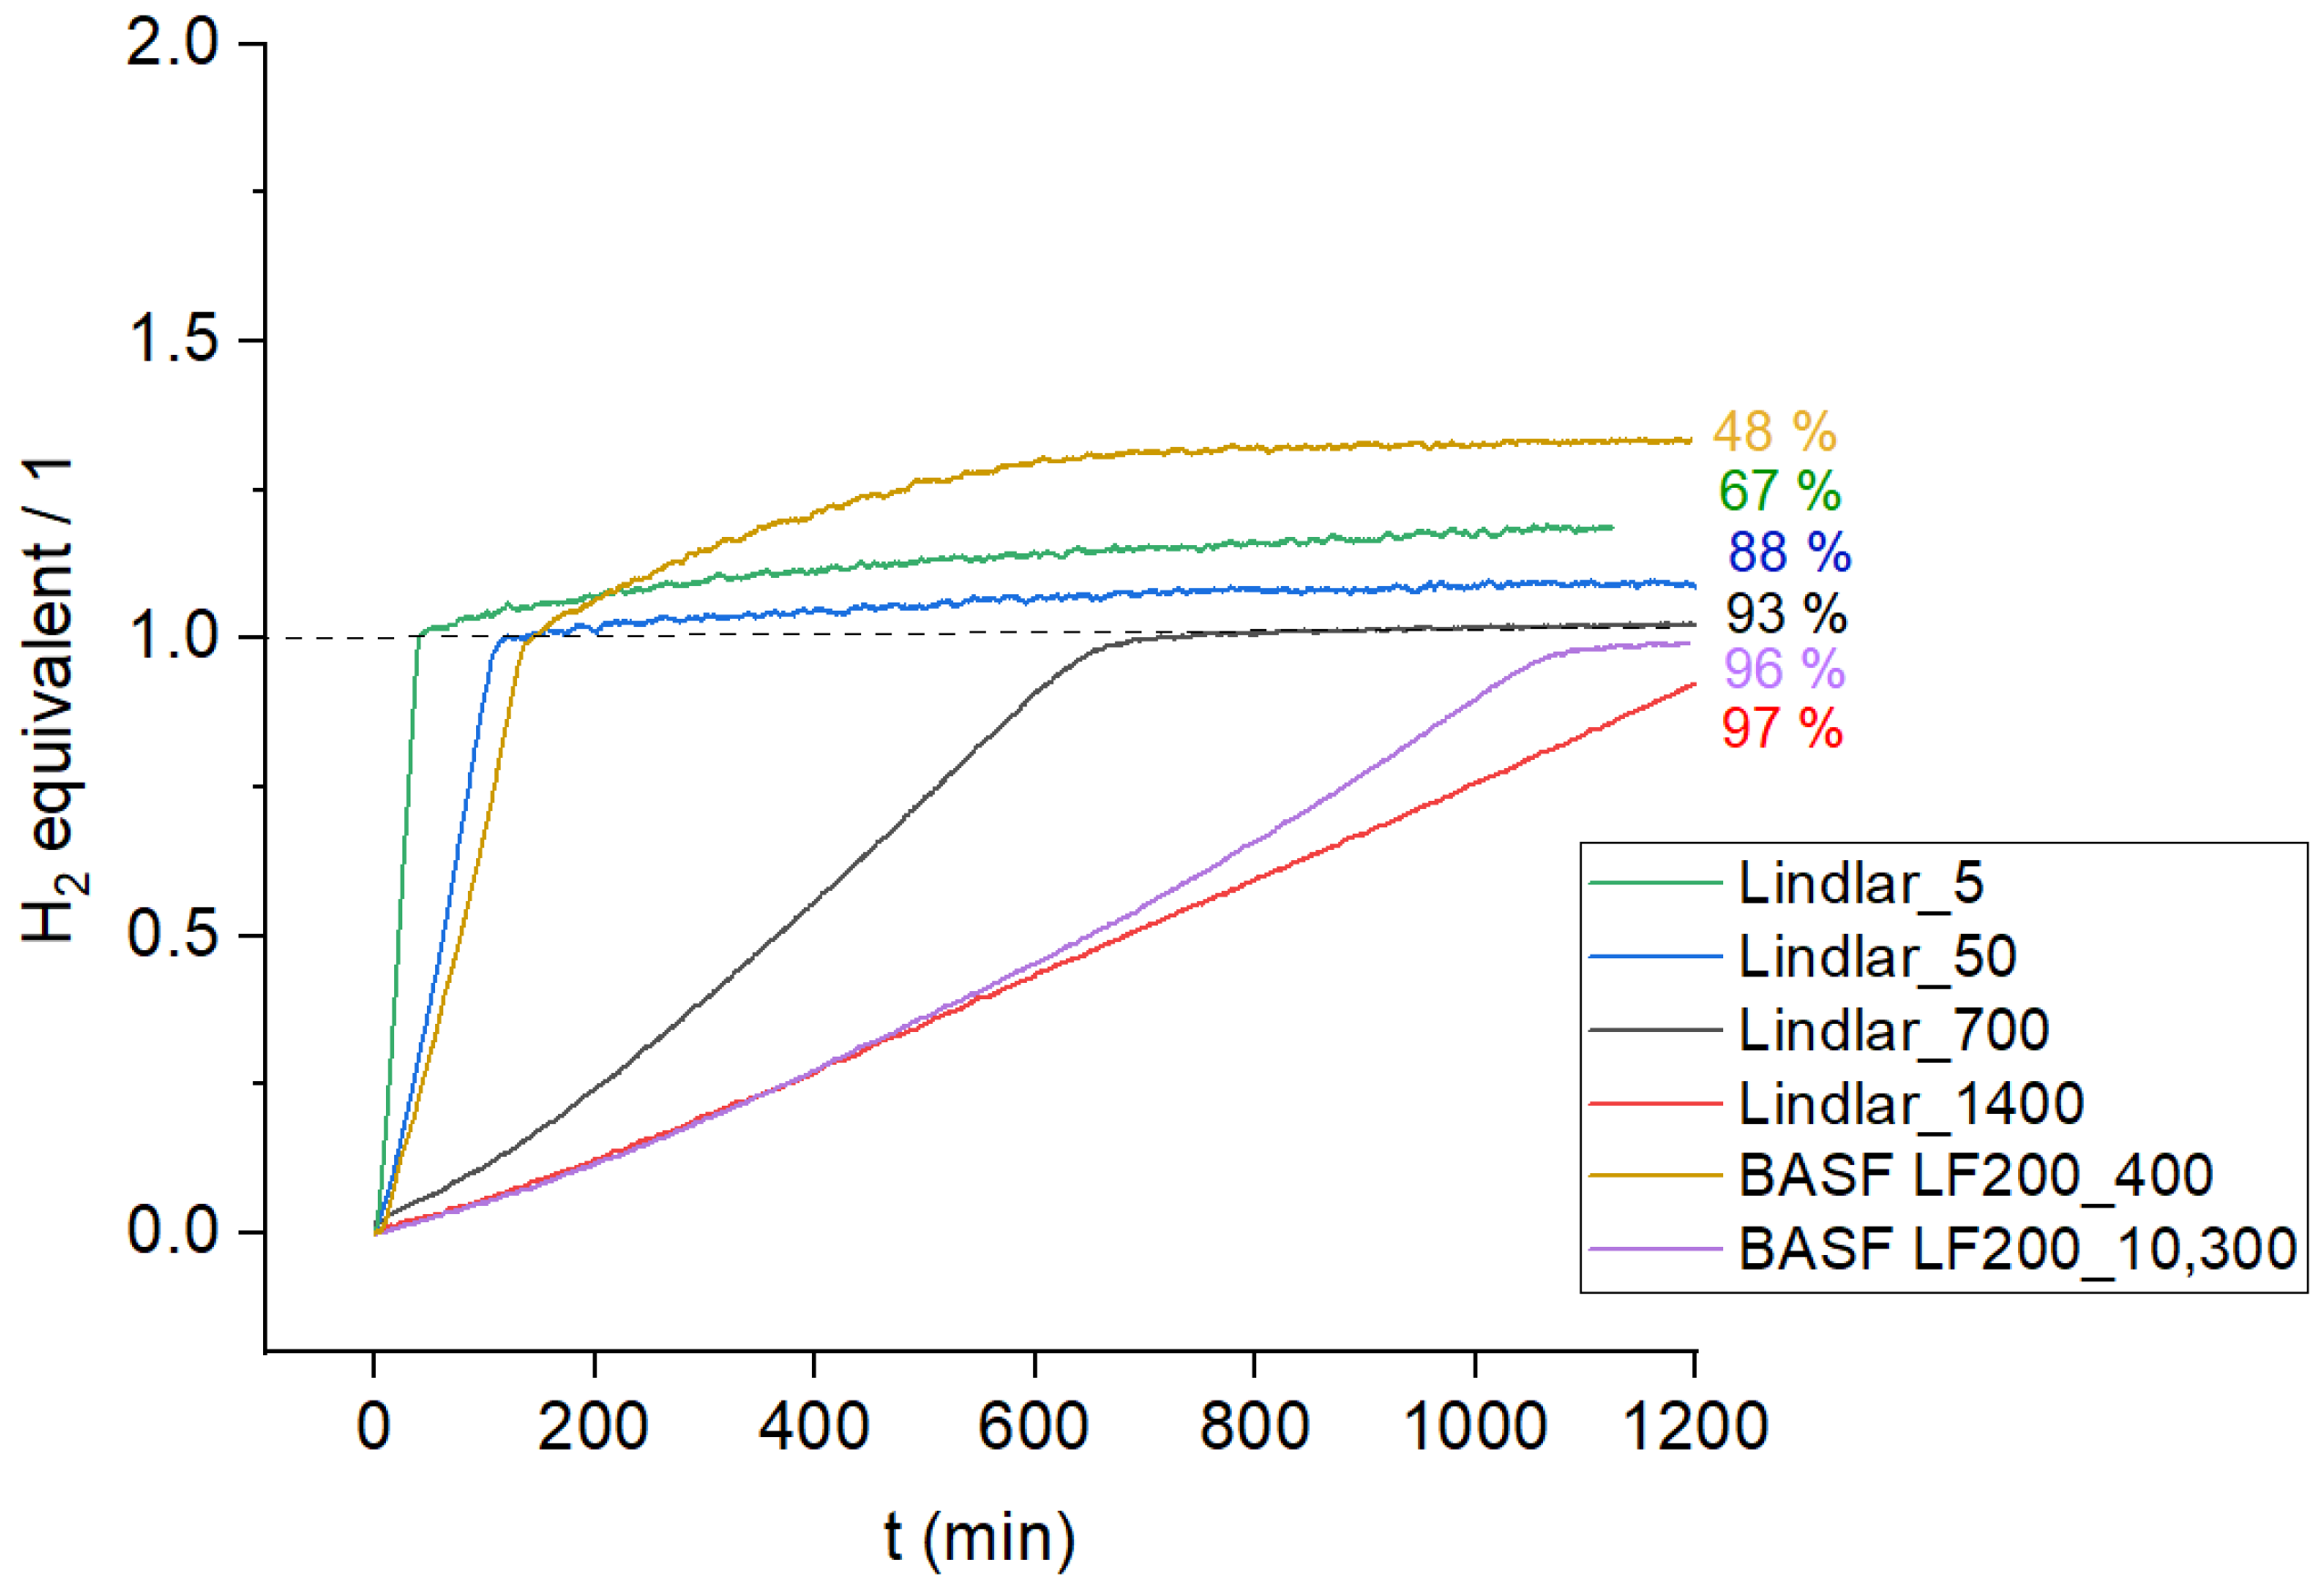
The kinetic results of the catalytic hydrogenation of 3-hexyn-1-ol using the Lindlar and BASF LF200 catalysts are shown in Figure 1. In the case of the Lindlar catalyst, and according to the data summarized in Table 1, the conversion rate obviously decreased from 44.0 × 10 7   m o l / s at n a l k y n o l / A P d   (molar amount n of alkynol per area A of Pd) of 5   m o l / m 2 to 3.13 × 10 7 m o l / s at n a l k y n o l / A P d of 1400   m o l / m 2 . This is reasonable because we would assume that by reducing the number of Pd surface sites in the reactor and increasing the reactant concentration, the probability of reactant molecules colliding with an empty Pd site is reduced. As a result, the alkynol conversion rate is lower. It is also worth noticing that, although the latter one continued overnight, after about 20 h, the conversion value could not reach 100% but about 97%, and according to the GC results, only cis-hexenol and a small amount of non-converted hexynol reagent were detected. This also makes sense because, by reducing the quantity of the Pd catalytic sites, the number of nonselective sites that can convert the alkenol intermediate species to the alkanols would also decrease, and hence there is less possibility for a full hydrogenation pathway. The same trend was also observed for the BASF LF200 catalyst, in which, by increasing n a l k y n o l / A P d from 400   m o l / m 2   to 10,300   m o l / m 2 , the conversion rate in the reaction decreased from 12.1 × 10 7   m o l / s to 3.96 × 10 7   m o l / s . At n a l k y n o l / A P d of 10,300   m o l / m 2 (compared to 400   m o l / m 2 ), one would see that almost two times more cis-hexenol product was obtained at the end of the reaction (96% compared to 48%).
Furthermore, it can be seen in Figure 1 that, at higher values of n a l k y n o l / A P d ( 1400   m o l / m 2   for Lindlar and 10,300   m o l / m 2   for BASF LF200), the activities of the Lindlar and BASF LF200 catalysts were rather similar in the beginning. When the n a l k y n o l / A P d   ratio is reduced to 50 m o l / m 2 for the Lindlar and 400   m o l / m 2 for the BASF LF200 catalysts, the average selectivities of cis-hexenol reach 88% and 48%, respectively, at rather similar rates ( 15.6 × 10 7   m o l / s v e r s u s   12.1 × 10 7   m o l / s ) . Therefore, the BASF LF200 catalyst was less selective for the cis-hexenol product, even at around eight times less catalytic surface area ( 0.02 × 10 3   m 2   for the BASF LF200 catalyst compared to 0.16 × 10 3   m 2 for the Lindlar catalyst). This difference in selectivity could be attributed to the different structures of the Lindlar and BASF LF200 catalysts. In both of them, a nonselective site poisoning strategy has been used to improve the selectivity of the cis-alkenol product, but by applying different agents, i.e., Pb and HHDMA, respectively. In addition, we would like to stress that in this study, according to the ICP-OES results, highly pure Pd species were produced. Further elemental analysis detected no (trace) amounts of C, H, N, and S elements in the Pd agglomerates. Thus, we can assume the presence of stabilizer-free Pd particles.
Furthermore, if the modifying or poisoning agent is not stable enough, more intermediate alkenes would be re-adsorbed and follow the overhydrogenation pathway. In this way, the Lindlar catalyst could stay more selective for the cis-alkenol product during the long time of the reaction because the Pb probably had higher stability compared to the organic HHDMA of the BASF LF200 catalyst. For example, as shown in Table 1, at the same amount of alkynol reagent ( 9 × 10 3   m o l )   for the Lindlar catalyst with n a l k y n o l / A P d   of 50 m o l / m 2 , 98% 88% = 10% of isomers were produced (difference between the average selectivity values of the cis-alkenol and all other alkenol products). This value is 85 %   48% = 37% for the BASF LF200 catalyst, which, as mentioned above, contains around eight times less Pd surface area at n a l k y n o l / A P d   of 400   m o l / m 2 . By increasing n a l k y n o l / A P d to the higher values of 1400 and 10,300 m o l / m 2 (a very low amount of Pd in the system), their performance seems somewhat similar (2% isomers for the Lindlar and 3% for the BASF LF200 catalyst). More details about the activity, reproducibility, and average selectivity of the cis-hexenol product can be found in Figures S2 and S3.
In the following, we compare our results with the selective hydrogenation of 3-methyl-1-pentyn-3-ol reported by Ballesteros-Soberanas et al. [16]. Their results showed that at an n a l k y n o l / n P d   molar ratio of 2.5 × 10 3 , the average conversion rates over the Lindlar and BASF LF200 catalysts in the range of 0–500 min were about 0.77 × 10 7   m o l / s and 1.42 × 10 7   m o l / s . In the present study (we are obliged to compare the n a l k y n o l / n P d values because the active metal surface area is not reported in [16]), it could be observed that higher conversion rates, i.e., 15.6 × 10 7   m o l / s (Lindlar) and 12.1 × 10 7   m o l / s (BASF LF200), were obtained in our laboratory at n a l k y n o l / n P d   of 20 × 10 3 (8 times less Pd catalyst per mole of alkynol in our system compared to [16]). In the same way, at n a l k y n o l / n P d of 500 × 10 3 , the reported activities of the Lindlar and BASF LF200 catalysts in [16] were rather low ( 0.02 × 10 7   m o l / s   and 0.03 × 10 7   m o l / s ), as after about 400 min, only about 5–6% of the alkynol reagent was converted. Again, a comparison of these data with those obtained here at n a l k y n o l / n P d   of 500 × 10 3 for the Lindlar and BASF LF200 catalysts ( 3.13 × 10 7   m o l / s   and 3.96 × 10 7 m o l / s ), showed that higher rates could be obtained in this study, which may be caused by the severe agitation rate using a mechanical stirrer at 775 RPM in our work as opposed to weaker magnetic stirring in [16]. It should be noted that, for the sake of comparison, the values from [16] have been converted to H 2 e q . to be comparable with the data reported in the present study, so that the conversion values of 20% and 80% correspond to   0.2   e q . and 0.8   e q . of H 2   uptake. Also, the selectivity for the cis-hexenol product was calculated in this work as an average value at the end of the reaction, which was much later and took approximately 1200 min compared to 400–500 min in ref. [16].
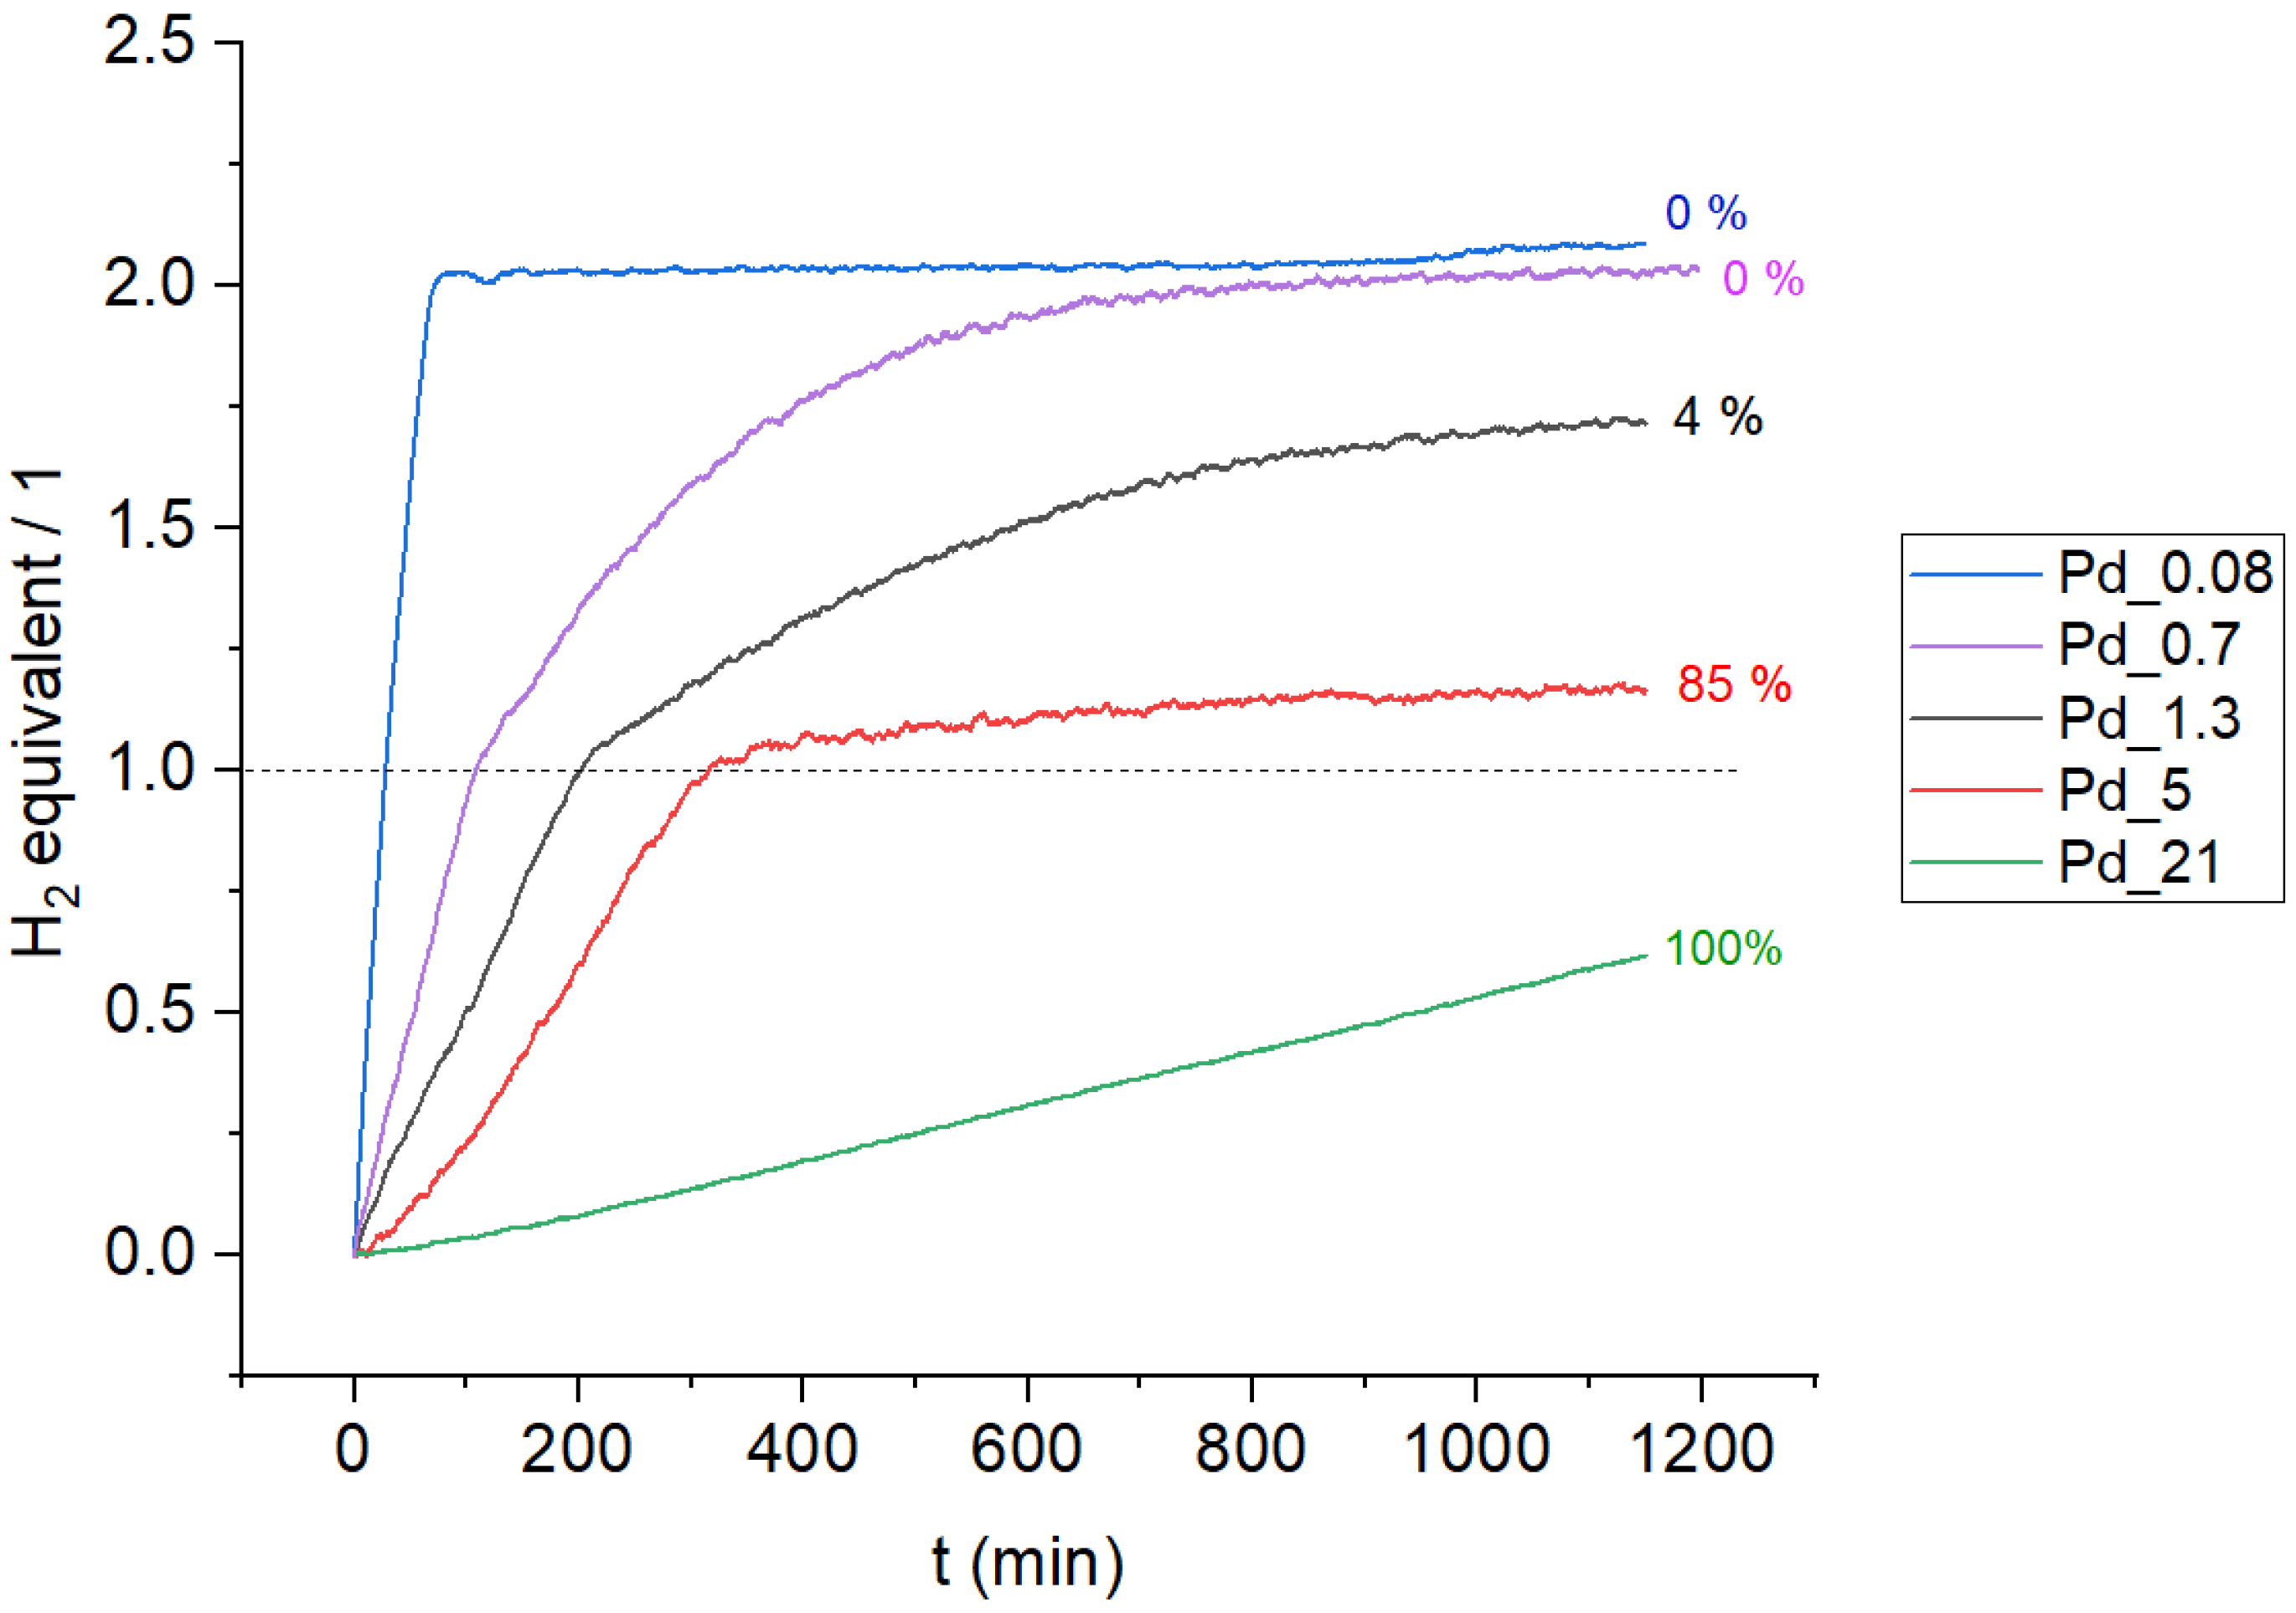
Then, the catalytic performance of the microemulsion-prepared, weakly bound Pd agglomerates was studied. According to Figure 2 , it is clear that the Pd agglomerates were totally nonselective at n a l k y n o l / A P d of 0.08 m o l / m 2 , which may have different reasons. Pd agglomerates produced through the microemulsion synthesis route may still have a lot of nonselective edge and corner sites, which are accessible to the intermediate alkenol species. Also, it has been previously reported that when the concentration of the alkyne species in the reaction environment is reduced, there is a possibility for the intermediate alkene species to be re-adsorbed on the available catalytic sites, although the adsorption enthalpy of alkenes is much lower than that of the alkyne species [6]. Next, the amount of Pd agglomerates in the reaction was decreased stepwise, and, according to Figure 2 and also Table 1, the reaction rate was consequently reduced from 33.1 × 10 7   m o l / s for Pd agglomerates at n a l k y n o l / A P d of 0.08   m o l / m 2 , to 8.75 × 10 7   m o l / s , 4.60 × 10 7   m o l / s ,   3.49 × 10 7   m o l / s and 2.17 × 10 7   m o l / s at n a l k y n o l / A P d of 0.7   m o l / m 2 , 1.3   m o l / m 2 , 5   m o l / m 2 and 21   m o l / m 2 , respectively. Also, by reducing the amount of Pd in the reactor (as a result, decreasing the available catalytic surface area), the value of the average selectivity toward the cis-hexenol product was increased from 0% at n a l k y n o l / A P d of 0.08   m o l / m 2 to 85% at n a l k y n o l / A P d of 5   m o l / m 2 . When n a l k y n o l / A P d was further increased to 21   m o l / m 2 , the reaction rate was very low, and after about 20 h, only cis-3-hexen-1-ol and some of the non-converted 3-hexyn-1-ol were detected in the GC. More details about the activity and final product distribution can be found in Figure S4. It can be seen in Figure S4b that by reducing the amount of Pd agglomerates in the system, the reproducibility is reduced, which could also be attributed to the diversity of shape and structure of Pd nanoparticles synthesized via the microemulsion synthesis route. This will be further discussed below. It is also obvious from Figure 2 that the reaction order is negative, and by increasing the value of n a l k y n o l / A P d , an inhibition would occur, which maybe refers to the alkynol inhibition at high alkynol occupancies. Therefore, the rate is slow at first and increases after a while when the order turns positive before it decreases again due to the lack of reagent.
As noted earlier, this increased cis-hexenol selectivity could also be attributed to the fact that the cis-hexenol product has a much lower adsorption enthalpy, leading to a lower overhydrogenation rate compared to the hexynol species that was initially used. For the sake of comparison, the catalytic hydrogenation of the commercial cis-hexenol reagent was also performed, and the results are shown in Figure S5 . Accordingly, at n a l k e n o l / A P d of 0.08   m o l / m 2 , Pd agglomerates fully hydrogenated the cis-3-hexen-1-ol reagent to 1-hexanol, as they did under the same conditions with 3-hexyn-1-ol shown in Figure 2 (blue curve, Pd_0.08). Following the same behavior, by increasing n a l k e n o l / A P d from 0.08   m o l / m 2 to 4.20   m o l / m 2 , the hydrogenation rate of cis-hexenol was reduced, which shows that less cis-hexenol reagent could be converted and thus more non-converted cis-hexenol reagent was detected by GC in the end (0% at n a l k e n o l / A P d of 0.08   m o l / m 2 and 90% at n a l k e n o l / A P d   of 4.20   m o l / m 2 ). Therefore, these results confirm the previous data shown in Figure 2 in terms of the effect of the quantity of the catalytic sites on the final selectivity of the cis-hexenol product.
In the next step, we studied whether the formation of aggregates (as a fused collection of Pd nanoparticles) through thermal sintering can change the availability of the catalytic sites by blocking the nonselective corner and edge sites of Pd particles. In our previous study [15], Pd nanoparticles were supported on FDU-12 via different synthesis methods. It was shown that in a selective catalyst, Pd aggregates were produced by the addition of the microemulsion-prepared Pd agglomerates to the FDU-12 precursors, followed by thermal treatment at 823 K and further removal of structure-directing agents through a sintering process. However, in this study, non-supported Pd agglomerates and aggregates have been used in order to avoid the metal-support interaction effects. Two important temperatures for studying the Pd sintering process were calculated as THüttig = 549 K and TTamman = 914 K [19].
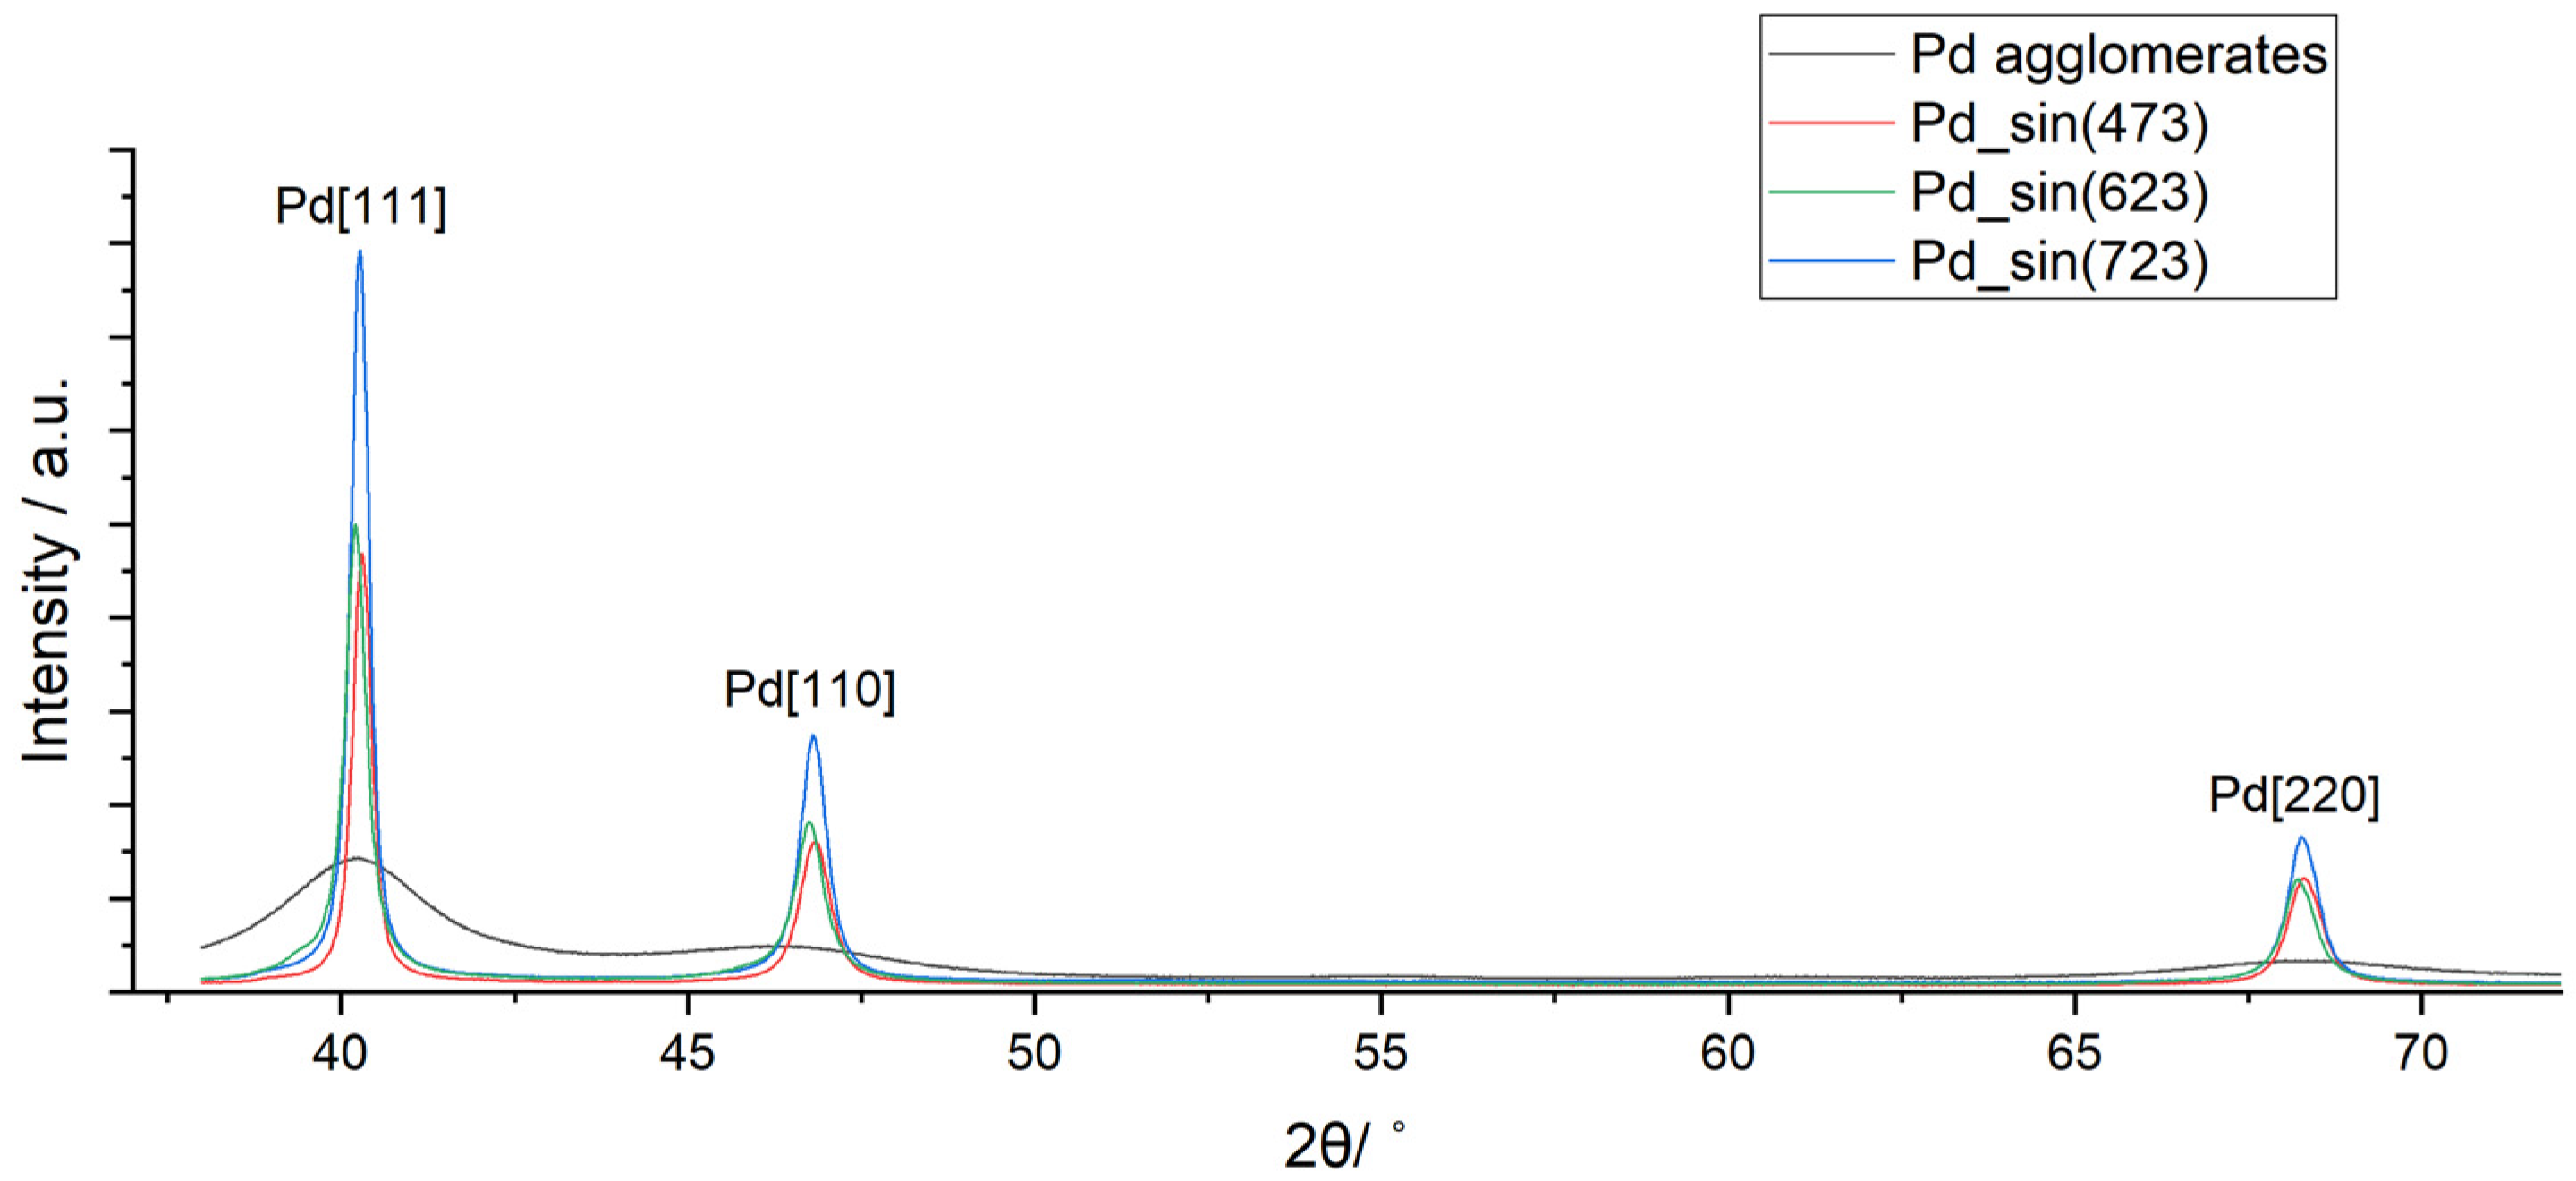
Next, the X-ray diffraction peaks of Pd samples (Figure 3) were detected at 2θ = 40.1°, 46.7°, and 68.1°, which is a good match to the [111], [110], and [220] crystalline facet reflections of Pd0 [20]. Thereby, it can be said that metallic Pd was successfully produced via the microemulsion synthesis route. The X-ray diffraction analysis of the non-sintered Pd agglomerates showed a broad peak, which indicates a crystallite size as low as 3.2 nm according to the Scherrer equation [21]. By raising the sintering temperature to 473 K, 623 K, and 723 K, the crystallite size was further increased to 27 nm, 34 nm, and 40 nm, respectively. This can indicate the formation of aggregates from the agglomerated Pd particles by fusing together even at T = 473 K, which is still below the value of THüttig of Pd (549 K) as an estimation for the threshold of sintering. Such particle size enlargement could occur due to the very high surface area of the agglomerated Pd nanoparticles [22], which facilitated the coalescence due to surface and grain boundary diffusion, or by the buildup of hydrocarbon species [23,24].
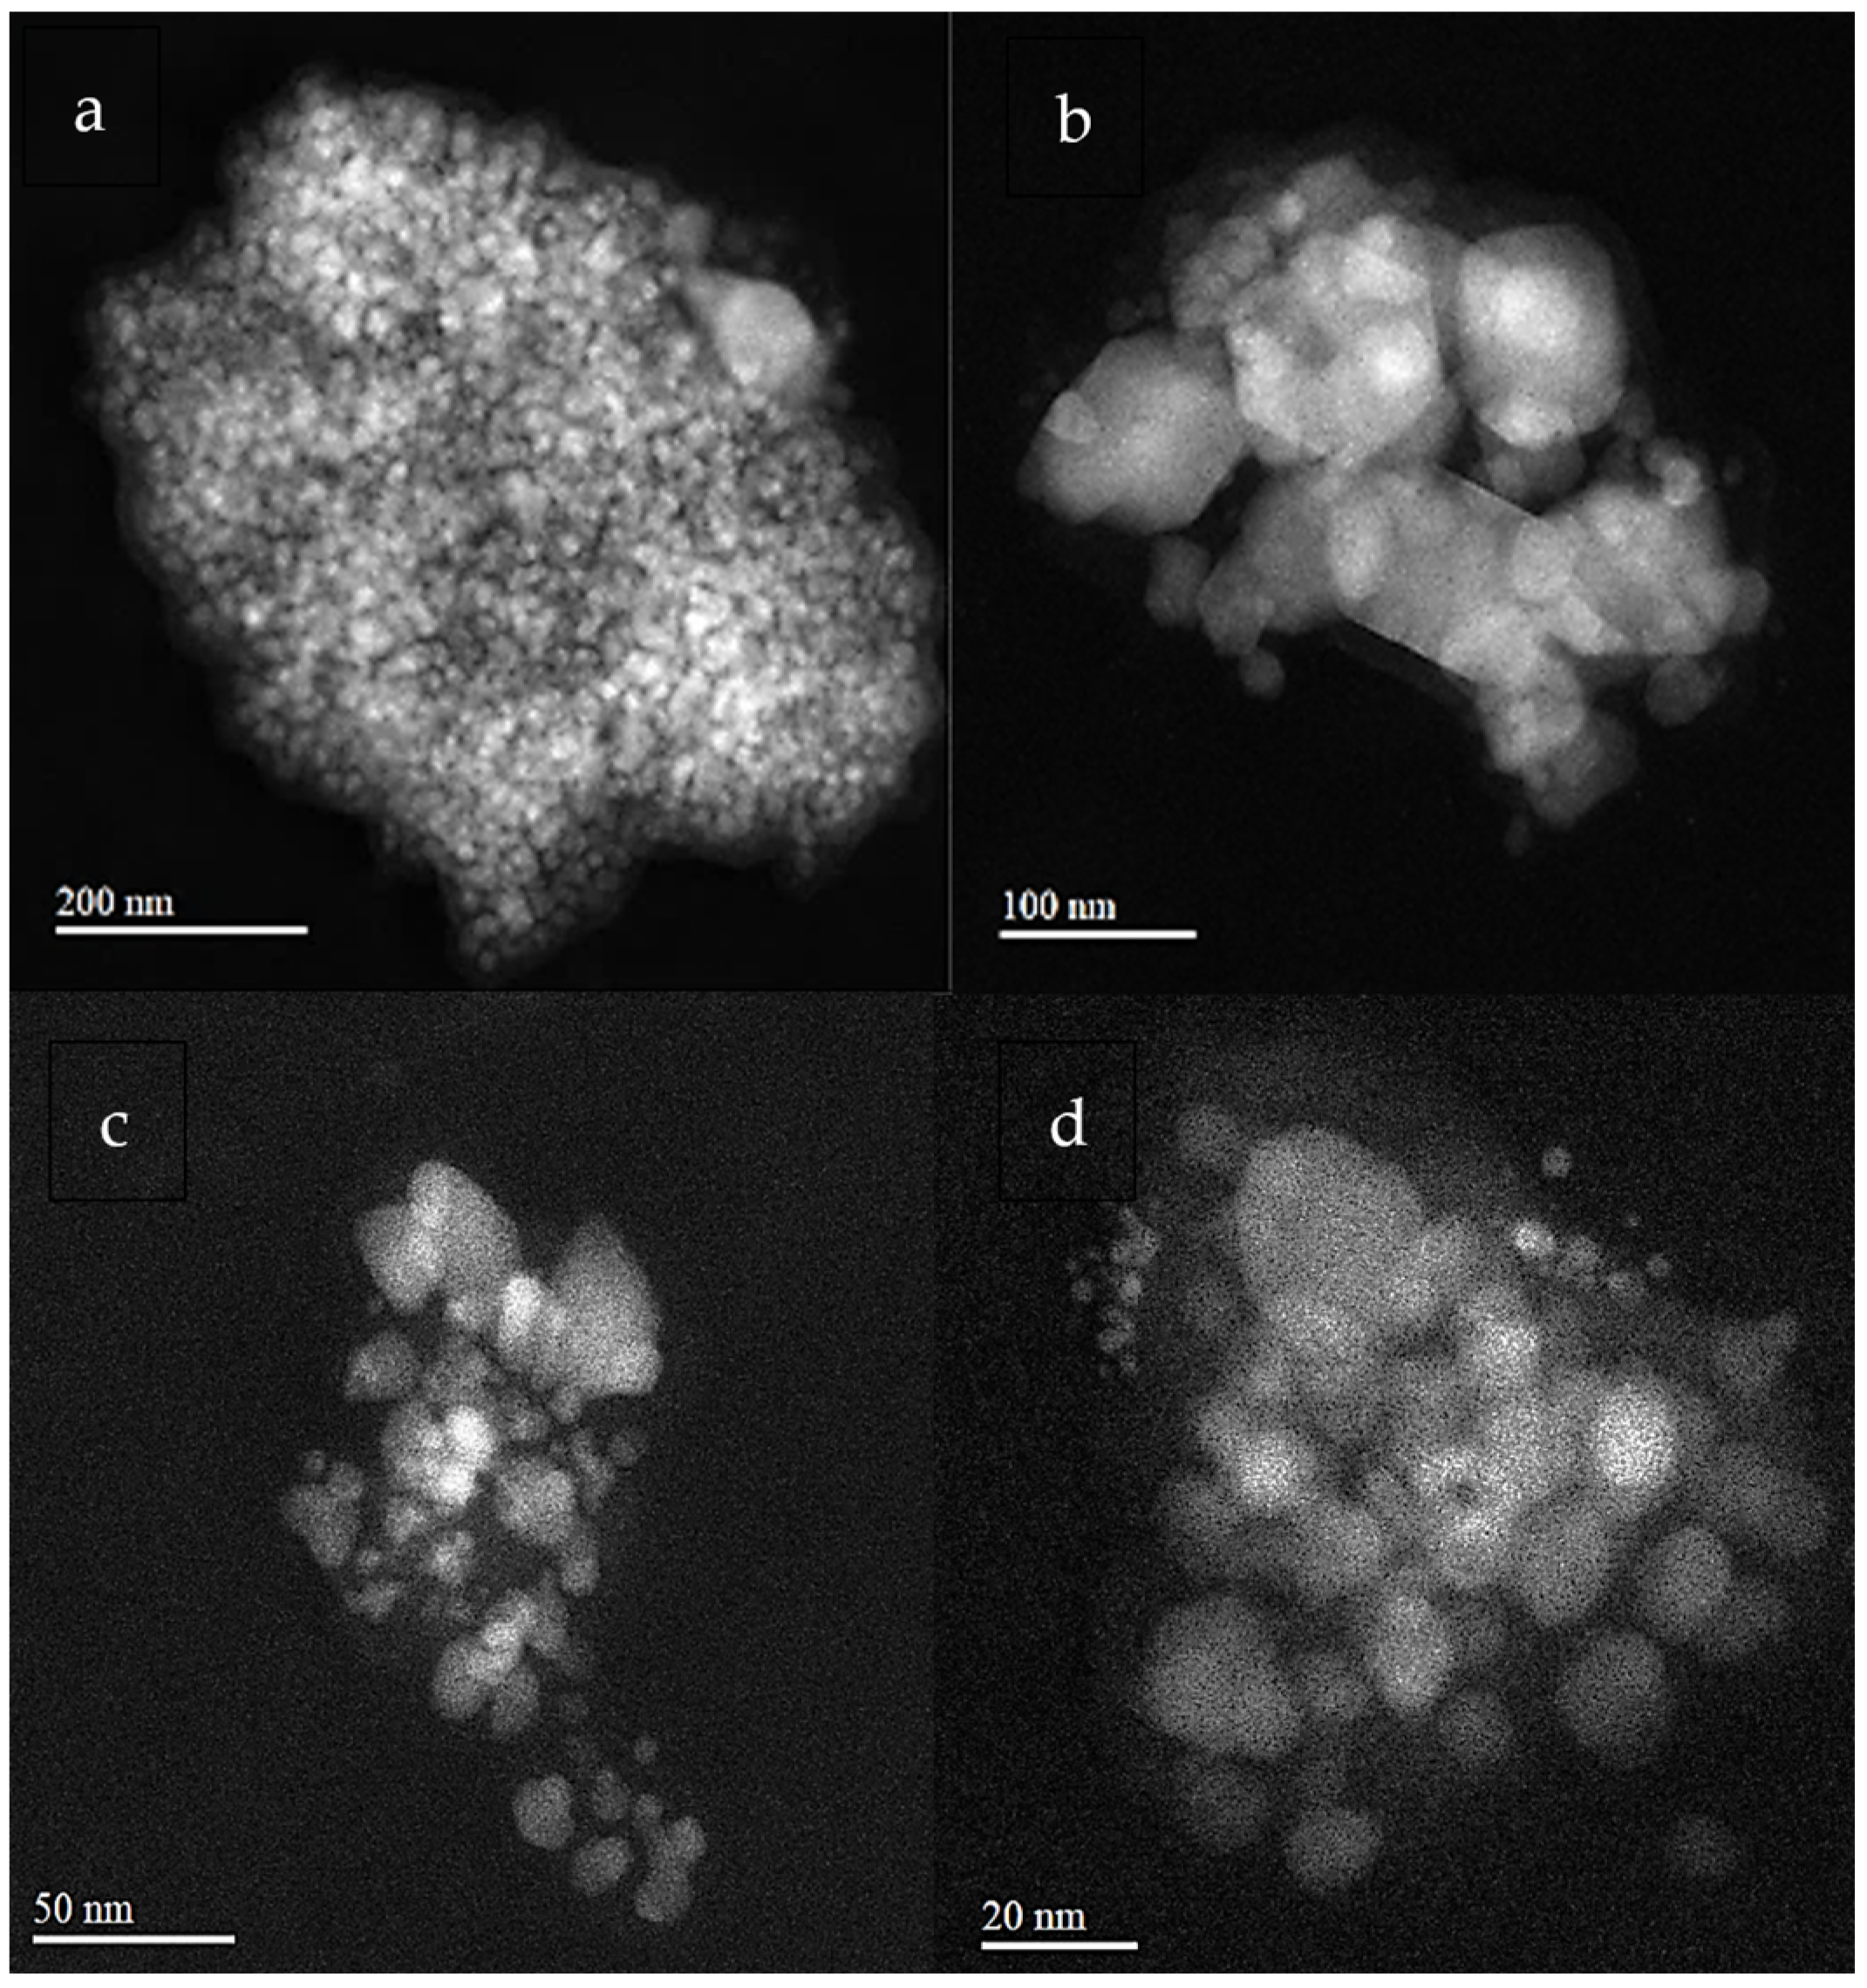
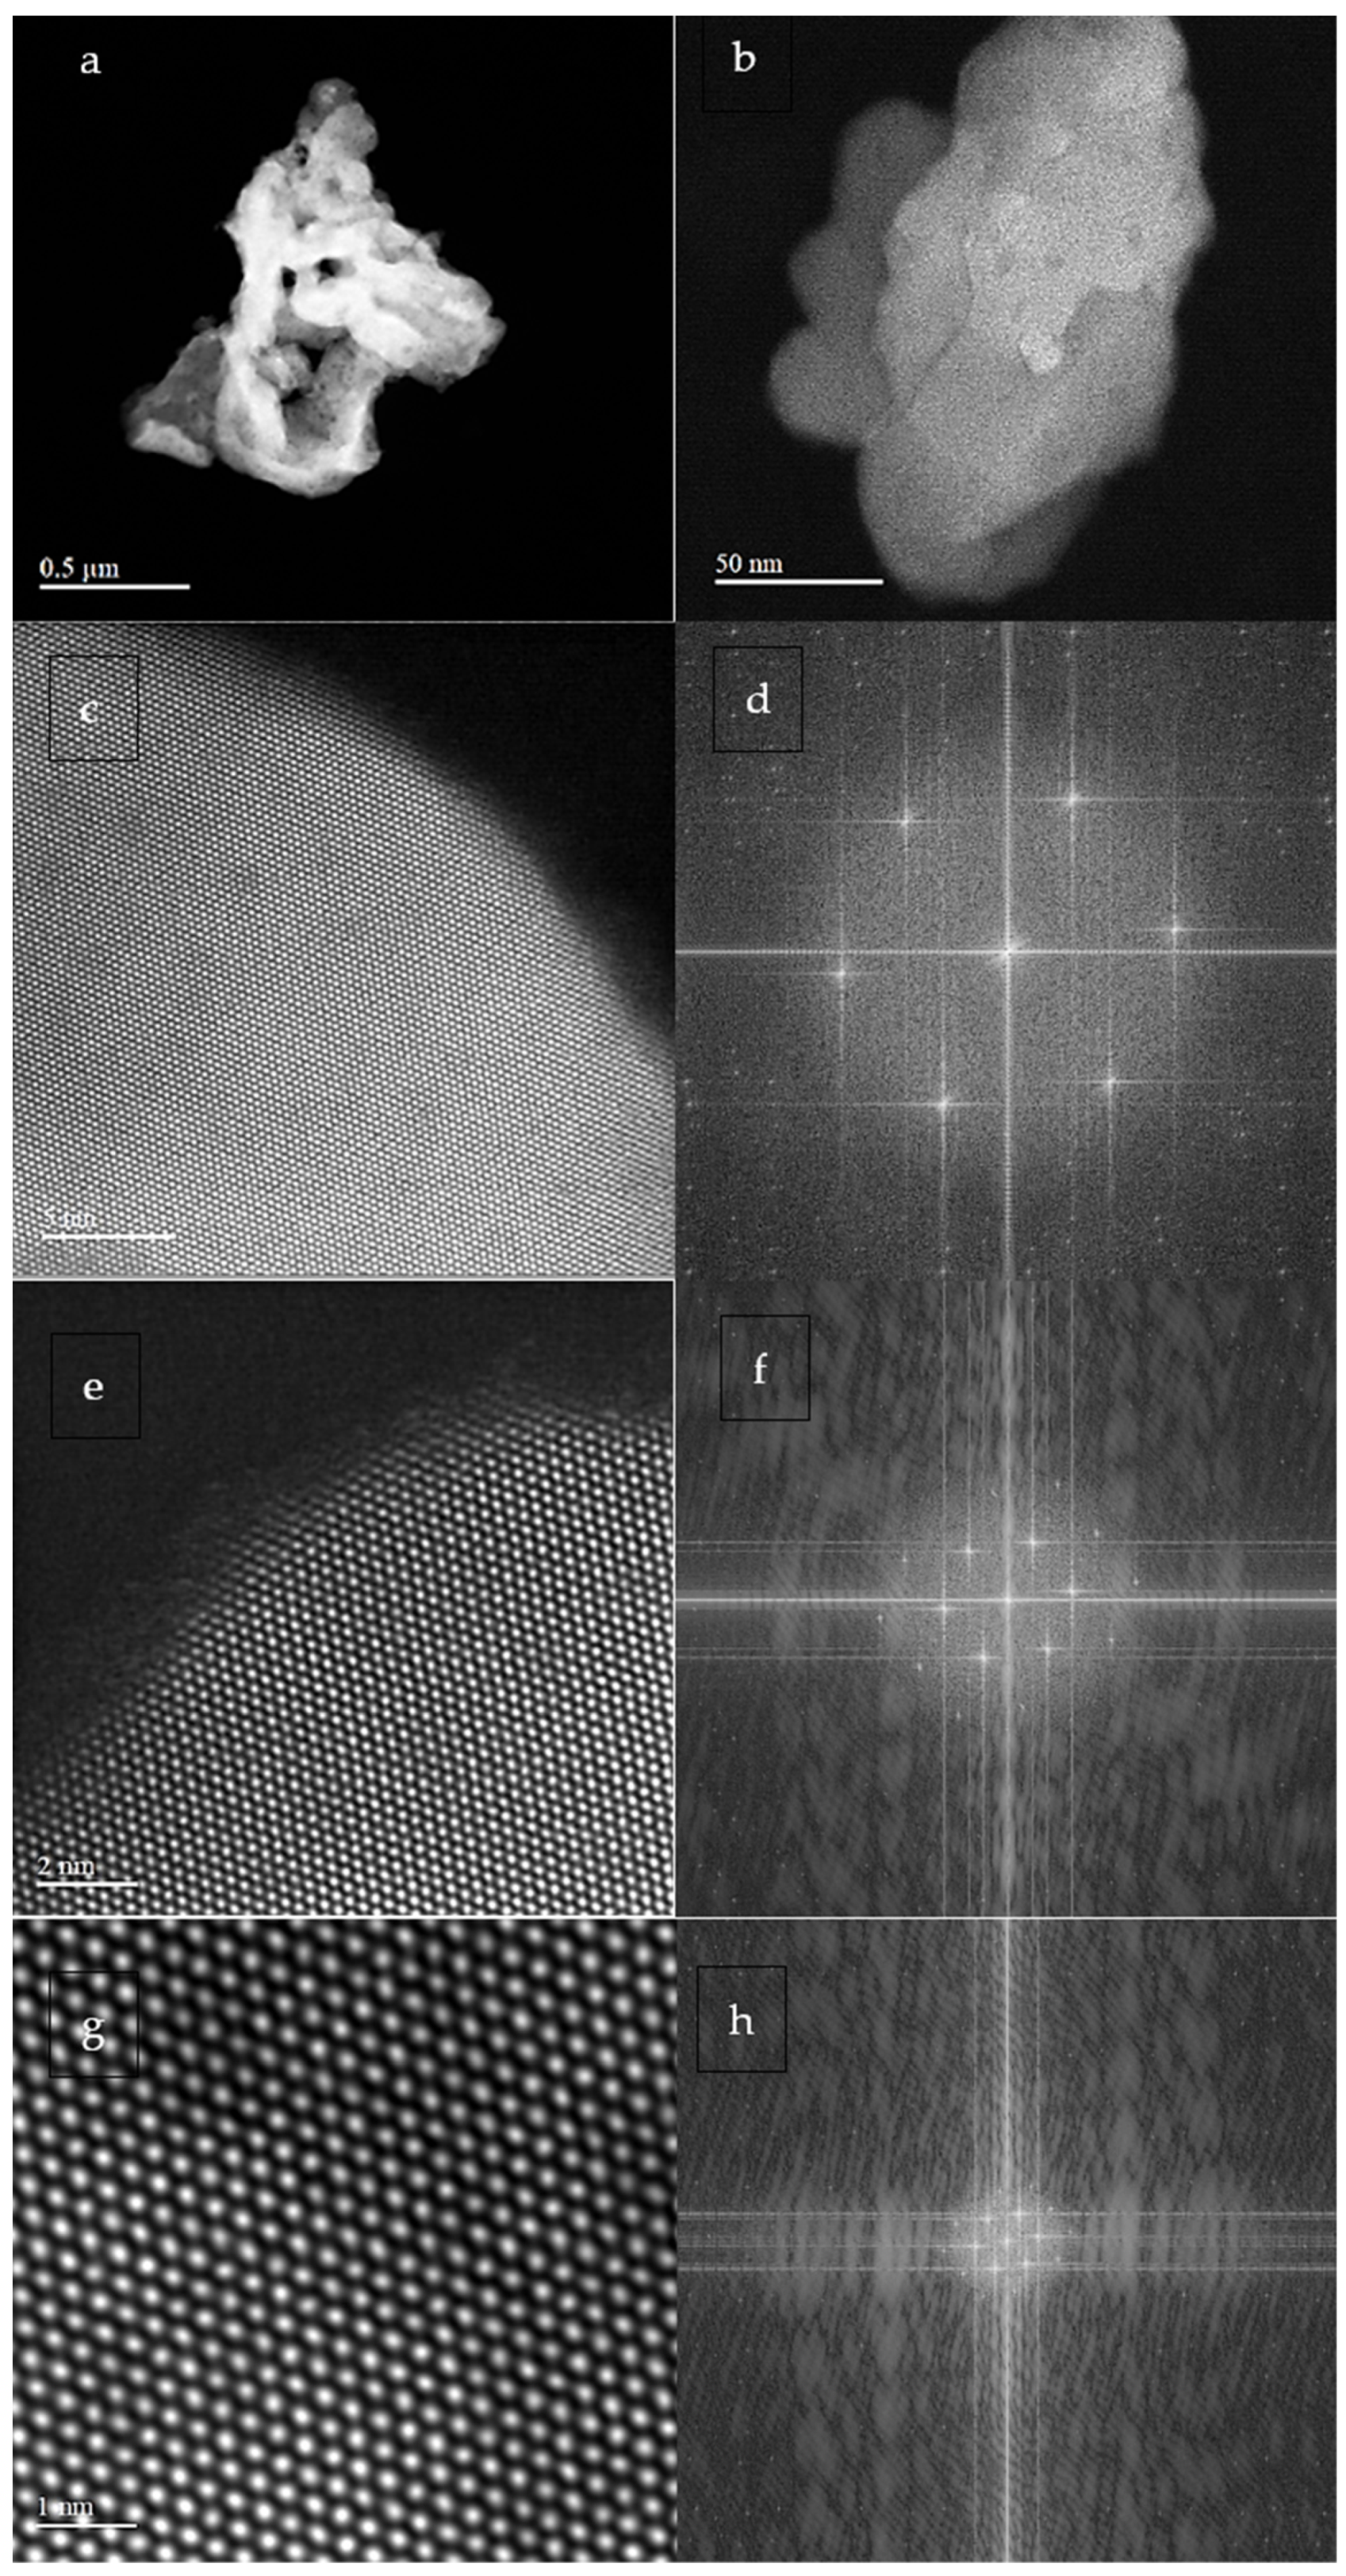
The HAADF-STEM and SEM analyses were also performed to characterize the morphology, structure, and size of the Pd particles. Accordingly, the non-sintered Pd agglomerates (Figure 4) are mainly composed of weakly bound particles with different sizes, mostly less than 10 nm, and different shapes like cubes and cuboctahedra. This may roughly confirm the results of the lack of reproducibility at low Pd content (Pd_21) in Figure S4b. By sintering at 623 K (Figure S6, top), larger aggregates with a size of 30–40 nm were formed from the smaller primary particles, which is in line with the results of the XRD analysis. When the sintering temperature reached 723 K, a uniform and homogeneous structure of the Pd crystal could be detected by the SEM and HAADF-STEM analyses at even atomic resolution (Figure S6, bottom; Figure 5a,b). Since the signal intensity of the HAADF-STEM image is proportional to the mass of the material, the relatively dark areas in the intermediate magnification image may result from the formation of pores during the sintering process (Figure 5b). These data are comparable with the results of the crystallite size analysis shown in Figure 3 and Table 1. As noted earlier, it can be seen in Figure 4a–d that the microemulsion-prepared Pd agglomerates mainly show quasi-spherical and unshaped particles and a variety of geometrical structures like cubes and cuboctahedra. One could imagine that lots of edge and corner sites in this catalyst are accessible to the reagents in the catalytic hydrogenation reaction. On the contrary, when Pd aggregates are produced by sintering at 723 K, surface and grain boundary diffusion lead to the generation of larger particles (Figure 5a,b), which may cause the fusion of different crystal planes. That is why no more cubic or octahedrally shaped particles could be easily found in the HRTEM images of the aggregated samples. There are also some standard statistical graphs in the literature [5], which show the decrease in the fraction of low-coordinated atoms versus size enlargement for different shapes of Pd nanoparticles. These STEM results are projections of a three-dimensional structure onto two-dimensional planes. However, the Pd particles in this work are three-dimensional, and a Fast Fourier Transform (FFT) of STEM images mainly shows which directions the materials are viewed (here, mostly Pd [111]). Nevertheless, STEM results convey a clear and also key message: As the temperature increases, the particle size increases as well, due to the fusion of crystal facets caused by the enhanced surface diffusion [25].
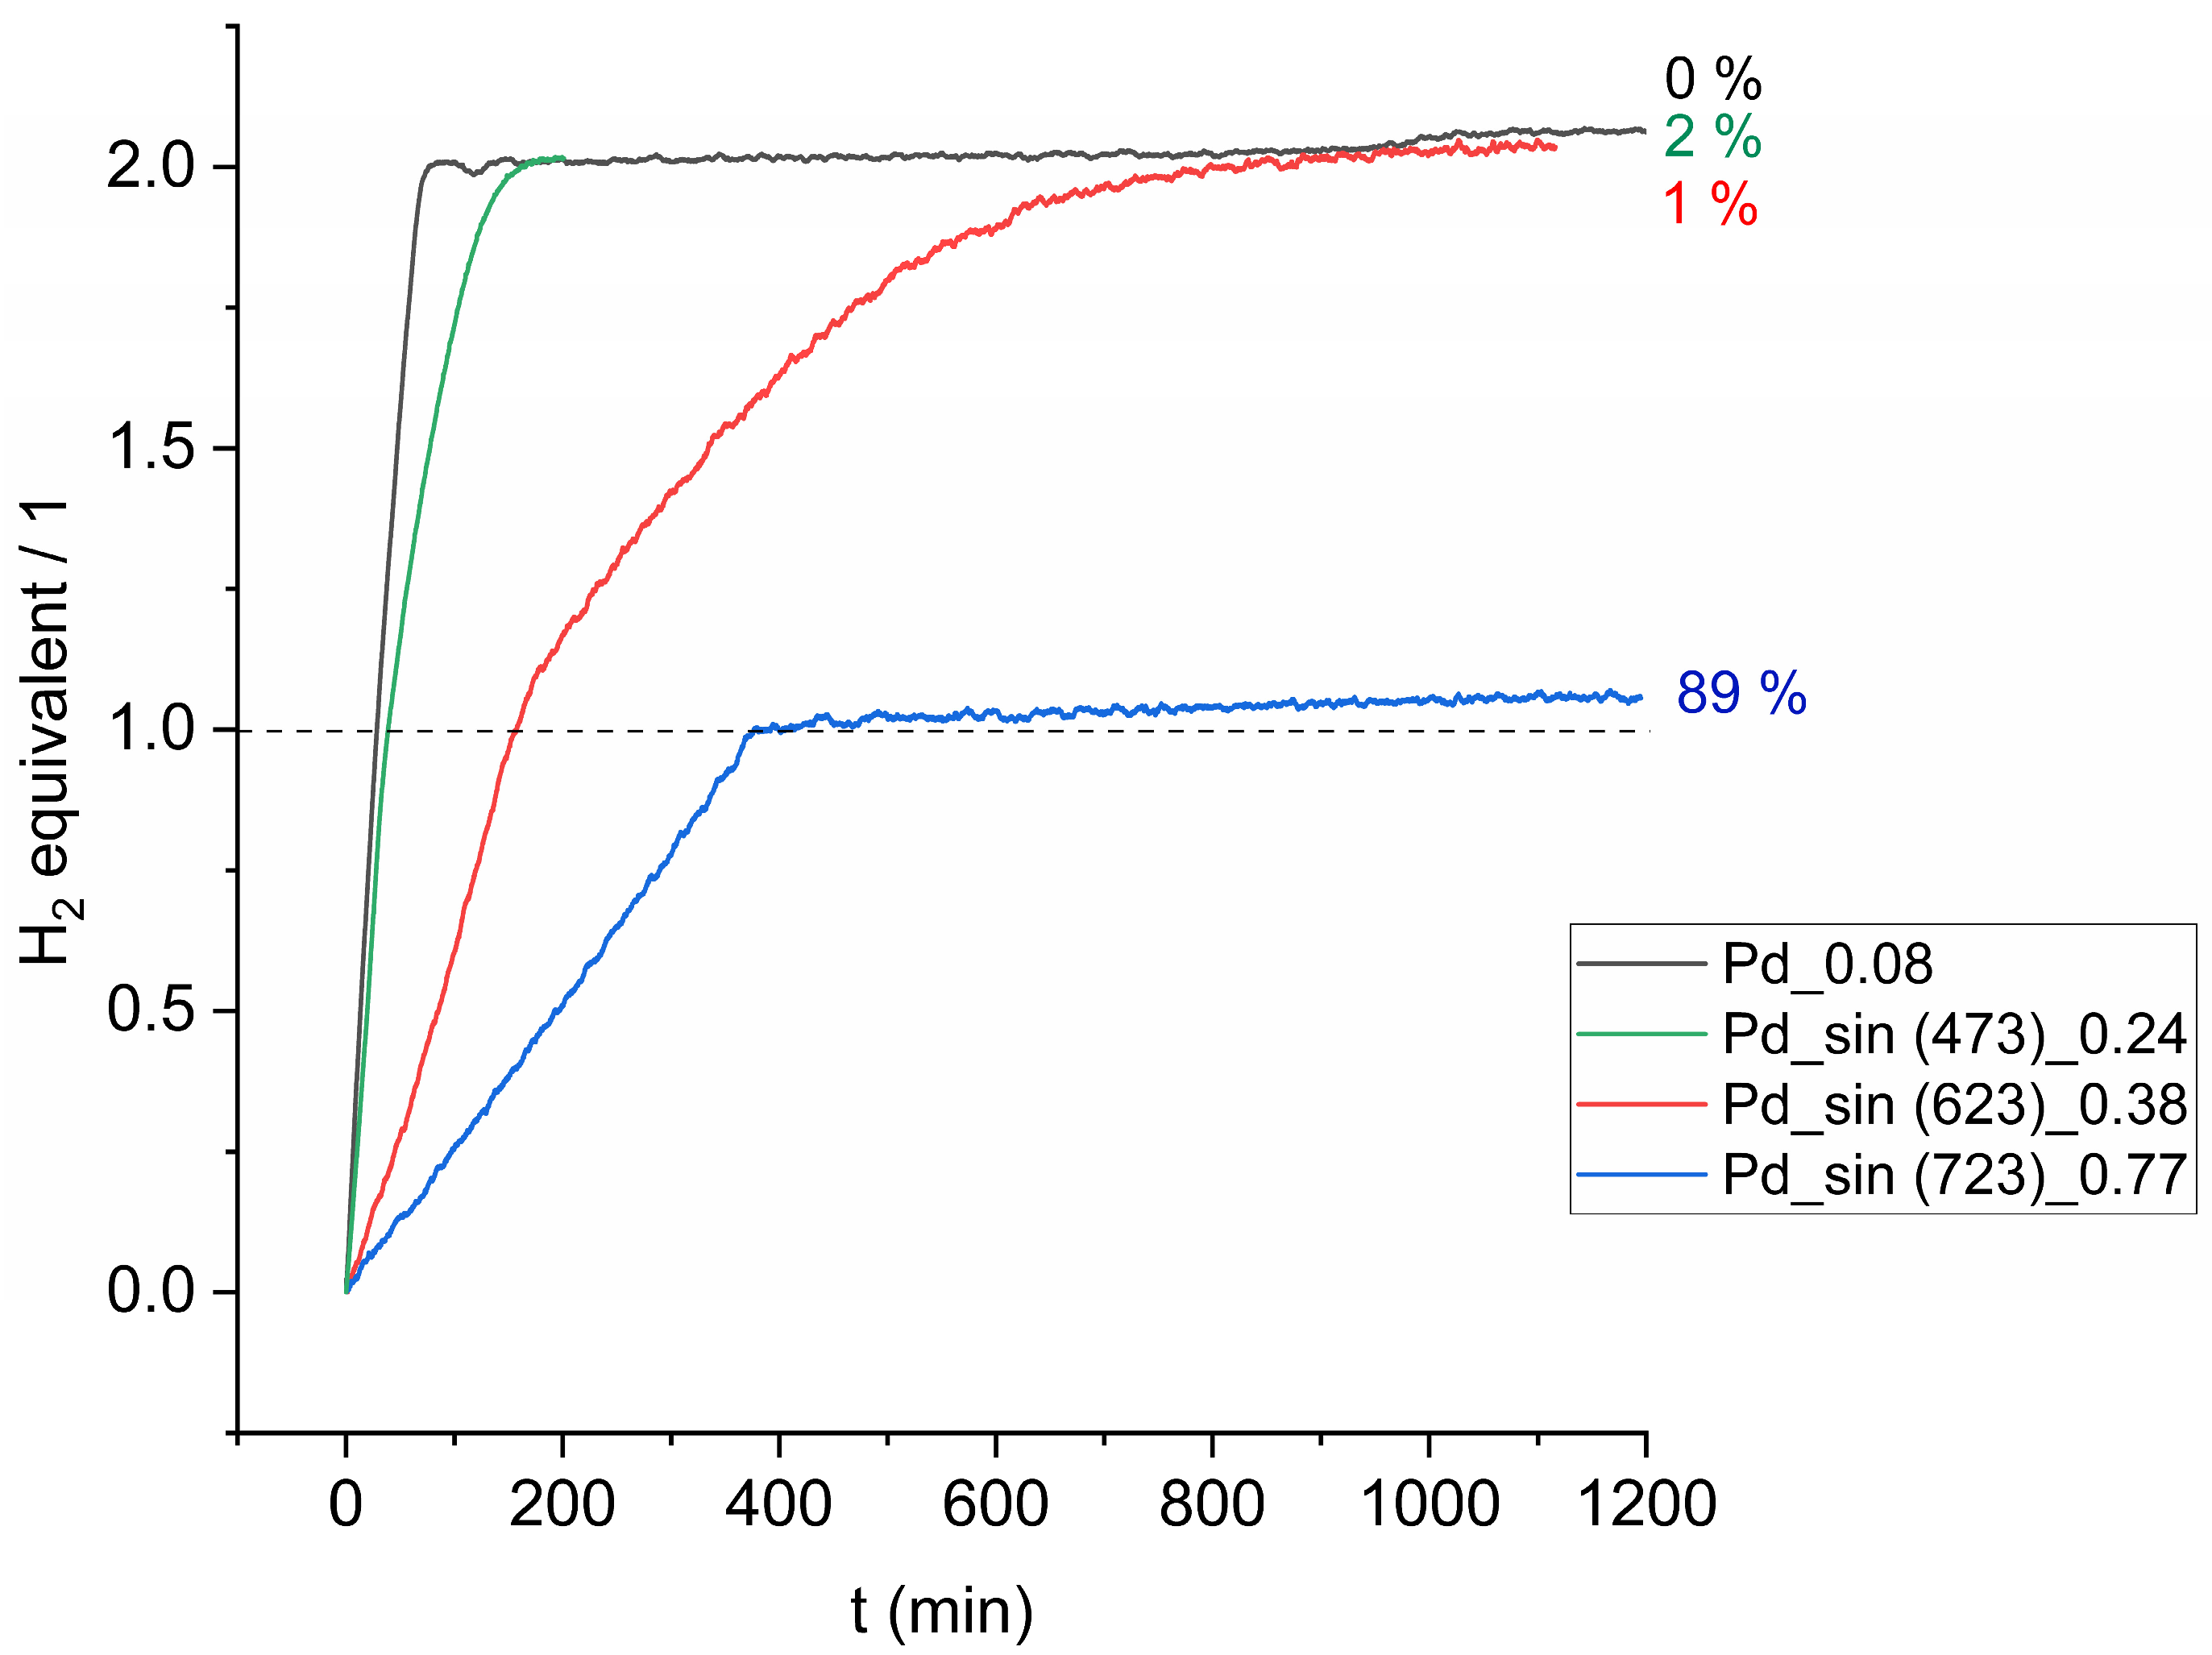
If we assume that sintering caused the coalescence and fusion of Pd particles, a decrease in the overall fraction of the edge and corner sites would also be expected. As shown in Figure 6 and also regarding the data noted in Table 1, one would see that the conversion rate was decreased from 33.1 × 10 7   m o l / s   for the Pd agglomerates at n a l k y n o l / A P d   of 0.08   m o l / m 2 , to 25.6 × 10 7   m o l / s for the Pd particles sintered at 473 K at n a l k y n o l / A P d   of 0.24   m o l / m 2 , even though the molar ratio of n a l k y n o l / n P d   was 100 for both of them. As noted above, this could be attributed to the lower availability of the non-saturated edge and corner sites and the increase of the crystallite size upon sintering at 473 K from 3.2 nm to 27 nm, which consequently led to a lower availability of the catalytic surfaces. This effect was also more intense when the sintering temperature reached 623 K and 723 K, which increased the crystallite size to 34 nm and 40 nm and resulted in further reduction of the initial rate to 5.77 × 10 7 m o l / s and 2.50 × 10 7   m o l / s , respectively. It can also be found in Table 1 that the dispersion value as an indicator of the ratio of the surface to bulk atoms decreased from 2.5% (Pd agglomerates) to 0.3% (Pd_sin (723)). Hence, the intermediate alkenol products had a lower possibility of being overhydrogenated using the Pd aggregates sintered at 723 K, and according to Figure 6, the value of the average selectivity to the cis-hexenol product was as high as 89% even after 20 h. Detailed information about the changes in activity and final product distribution is available in Figure S7. One can see in Figure S7b that with Pd_sin(723)_0.77, the catalytic reaction was repeated three times, and in all of the reactions, the rate of the first hydrogenation step was very similar. A difference could be observed in the rates of the second hydrogenation step, which could be attributed to the different catalytic facets exposed to the overhydrogenation reaction and emphasizes the importance of a homogeneous sintering process.
The Pd particles sintered at 723 K were then used to compare the kinetic behavior of 3-hexyn-1-ol and cis-3-hexen-1-ol as initial reagents in the catalytic hydrogenation reaction. According to Figure S8, it is obvious that at n a l k y n o l / A P d of 0.28   m o l / m 2 , the hexynol reagent followed an overhydrogenation path, so that only about 9% cis-hexenol was produced. While increasing n a l k y n o l / A P d to 0.77   m o l / m 2 through reducing the Pd catalyst content in the reactor from 15 mg to 6 mg at the same amount of alkynol ( 5.6 × 10 3   m o l ) , 89% of the cis-hexenol species were produced, which is very close to the selectivity value obtained for Pd_5 in Figure 2 (85%). The hydrogenation path of the cis-hexenol as an initial reagent also confirmed that by increasing n a l k e n o l / A P d from 0.35   m o l / m 2 to 0.60   m o l / m 2 , less cis-alkenol would be converted in the end.
However, the most important point, which is obvious from Table 1 , is that two samples, including the microemulsion-prepared Pd agglomerates and the Pd aggregates sintered at 723 K, showed selective behavior, with rather similar activities ( 3.49 × 10 7   m o l / s and 2.50 × 10 7   m o l / s ) , and high selectivity values toward the cis-hexenol (85% and 89%), but at different n a l k y n o l / A P d values ( 5   m o l / m 2 versus 0.77   m o l / m 2 ). Since the alkynol content for both experiments was the same ( 5.6 × 10 3   m o l ) , it could be said that only the change in the quantity of Pd catalytic surfaces was the reason for this. For the Pd agglomerates, this occurred at n a l k y n o l / A P d of 5   m o l / m 2 , which shows 1.11 × 10 3 m 2 active metal surface area, including the edge and corner sites (according to Table 1), while for the sintered Pd aggregates, this ratio was 0.77   m o l / m 2 , referring to 7.96 × 10 3 m 2 active metal surface area. Therefore, at rather the same conversion (X > 99%) and selectivity values, Pd agglomerates have around 7.17 times less active metal surface area compared to the sintered aggregates ( 1.11 × 10 3 m 2 versus 7.96 × 10 3 m 2 ), which, according to the Hougen–Watson kinetics, could be easily covered by the remaining alkyne species, and the value Φ of the fractional occupancy of the adsorption sites reaches 100%. This obviously hinders the readsorption of alkenes and the consequent overhydrogenation reactions. On the other hand, it could also be inferred that for the sintered Pd aggregates, the catalyst possessed 7.17 times more surface area, which could not be easily covered by the remaining alkyne species (Φ < 100%).
If we assume that the sintered aggregates have a lower fraction of low-coordinated edge and corner sites compared to the non-sintered agglomerates, then the effect of such non-saturated catalytic sites could also be monitored by comparing the behavior of the sintered (T = 723 K) Pd aggregates and Pd agglomerates at the same value of the active metal surface area. To do this, the amount of Pd agglomerates in the reactor could be changed so that the active metal surface area reaches the equivalent value of the sintered aggregates (around 7.96 × 10 3 m 2 ) . According to Table 1, the required amount is 0.7 mg of Pd agglomerates, which brings about an 7.77 × 10 3 m 2 active metal surface area at n a l k y n o l / A P d of 0.7   m o l / m 2 . As could be seen in Figure 2, at such a relatively comparable active metal surface area, Pd agglomerates were totally nonselective. Therefore, the sintered catalyst, which is assumed to have fused edges and corners, could establish better selective behavior during the catalytic hydrogenation process, and it could be said that the edges and corners are included in the total surface area of the Pd.
Such kinetic results of the non-supported Pd species are also in agreement with the recent findings of Ballesteros-Soberanas et al. [16], who used very low amounts of in-situ reduced Pd atoms and clusters for catalytic hydrogenation of 3-methyl-1-pentyn-3-ol (although their reduction and synthesis methods were different). The authors discussed that the size (and amount) of the active Pd species played a key role in maintaining high selectivity toward the alkene products, so that in the absence of large aggregates and at a very low concentration, Pd species could maintain their high selectivity even after reaching 100% conversion. In the same way, our data also show that the Pd agglomerates produced through the microemulsion synthesis route with a crystallite size of about 3.2 nm can maintain a high selectivity at higher n a l k y n o l / n P d . This indicates the importance of the quantity and availability of the catalytic surfaces in the catalytic hydrogenation reaction, even though they still possess low-coordinated edge and corner sites. Anyway, by using the in-situ reduction method, Ballesteros-Soberanas et al. [16] were also able to reduce the Pd concentration in the reaction environment to a part per million (ppm) order, which had a very positive effect on the yield of their catalytic reaction, while these low values are difficult to reach through the microemulsion synthesis route. It could also be mentioned that the separation of the Pd catalysts as aggregates after the reaction is easier since Pd cannot remain in the products of the food and cosmetics industries. Furthermore, sintering at high temperatures makes the Pd aggregates more stable and durable during the catalytic reactions, as the Pd particles sintered at 723 K were the best catalyst during these long-term catalytic hydrogenation studies.

3. Materials and Methods

3.1. General

The name and details (manufacturer and purity) of all chemicals used in this work are listed in Table 2.

3.2. Synthesis of Pd Nanoparticles

Pd agglomerates were synthesized through a microemulsion synthesis route, according to our previous work [15]. In brief, 0.0751 g of Pd nitrate dihydrate was dissolved in 14.07 g of H2O and added to a mixture of 1-octanol (9.85 g), n-octane (196.3 g), and Brij 30 (15.41 g) at 310 K under stirring. After 30 min, 0.0427 g of solid NaBH4 was added, and the pale color of the solution rapidly turned black. The magnetic stirrer was stopped after 15 min, and Pd agglomerates were collected by adding ethanol, centrifuging, and washing. The final wet precipitate was dried at 363 K overnight.

3.3. Sintering of Pd Nanoparticles

Pd agglomerates were placed in a fixed-bed quartz reactor (Scheme S1, bottom) and treated with H2 (5 mL/min) and Ar (40 mL/min) mixed flow at 473 K, 623 K, and 723 K for a duration of 2 h. These samples are named hereafter as Pd_sin (473), Pd_sin (623), and Pd_sin (723), respectively.

3.4. Characterization of Pd Nanoparticles

The fine structure and crystallite size of the Pd catalysts were determined by X R D analysis performed on an   D 8 Advance (Bruker Corporation, AXS GmbH, Karlsruhe, Germany) machine with Cu-Kα radiation ( λ = 1.5406   Å ) and a voltage of 30 kV. Moreover, d P and morphology were further characterized by using a V E G A 3 SEM (Tescan GmbH, Brno, Czech Republic) and a spherical aberration-corrected STEM (JEM-ARM200F, JEOL Ltd., Tokyo, Japan) equipped with a cold-field emission gun and a DCOR probe Cs corrector (CEOS GmbH, Heidelberg, Germany) operated at 200 kV. High-angle annular dark-field images (HAADF-STEM) were obtained by an ADF detector using a convergent semi-angle of 20.4 mrad and collection semi-angles of 70–300 mrad. D and A P d values were also calculated by CO chemisorption using a Quantachrome AUTOSORB-1C (Anton Paar, Ostfildern, Germany) automated system at 313 K. For the C, H, N, and S content determination, elemental analysis was performed using MicroCube (Elementar Analysensysteme GmbH, Langenselbold, Germany). The weight was about 1.5 mg in tin capsules (IVA Analysentechnik GmbH, Meerbusch, Germany) against acetanilide from Merck as a standard substance (Merck KGaA, Darmstadt, Germany). The Pd content of the catalysts was determined by optical emission spectroscopy with inductively coupled plasma (ICP-OES) on an Avio 200 (Perkin-Elmer Inc., Rodgau, Germany).

3.5. Catalytic Hydrogenation

Details of the catalytic reactor setup used in our laboratory can be found in Scheme S1, top. Accordingly, H2 is supplied in a 500 mL stainless steel gas burette (GB, 316L-50DF4-500, Swagelok, Solon, OH, USA) at a pressure of 0.9 MPa. The GB is equipped with a self-made heating jacket connected to a temperature controller (TC, 2050 West) to maintain a constant temperature of 313 K overnight and avoid undesirable environmental changes. Hydrogen can be filled into the GB by opening valves V1 and V2. The temperature and pressure of the GB are recorded every 10 s using temperature recorder (TR) and pressure recorder (PR) tools connected to the controller (Parr 4848, Parr Instruments Co., Moline, IL, USA). In a typical catalytic hydrogenation experiment, considering the required n r e a g e n t / n P d ratio, a proper amount of catalyst is placed in a glass inset inside the autoclave reactor (AR, Parr Instruments Co., Moline, IL, USA) and dispersed in 20 mL EtOH, 1 mL 1-octanol (as the internal standard), and the calculated amount of the reagent (alkynol or alkenol). The AR is then tightly closed and flushed by N2 through V5 and V6 at p = 0.3 MPa, while the temperature and agitation rate values were set at T = 308 K and 775 RPM (mechanical stirrer). By opening V3, H2 can be fed into the reactor and filled until 0.3 MPa, while the flow rate and pressure inside the reactor are controlled by a mass flow controller (MFC, F-211-CV, Bronkhorst High-Tech B.V., Veenendaal, The Netherlands) and a mass flow meter (MFM, F-121M, Bronkhorst High-Tech B.V.). The amount of H2 consumed in the catalytic hydrogenation reaction is then monitored by recording the H2 pressure drop in the GB. At the end of each catalytic run, the pressure in the reactor is released via V6, and a sample is analyzed by a gas chromatography analyzer (7890A GC, Agilent, Beijing, China) equipped with a DB-WAX column (30 m), a flame ionization detector, and He as the carrier gas to determine the final product distribution. The GC machine was initially calibrated based on the peaks corresponding to the possible reaction products, including 3-hexyn-1-ol, cis-3-hexen-1-ol, trans-3-hexen-1-ol, 4-hexen-1-ol, 2-hexen-1-ol, and 1-hexanol. The reaction chamber was finally cleaned by diluting 5 mL of nitric acid (65%) with 20 mL of deionized water in the glass liner under stirring at 333 K for 2 h, followed by washing and drying at room temperature to ensure that all Pd residues are oxidized and removed.

4. Conclusions

In this study, we show that neat Pd particles could be used as a selective catalyst for the hydrogenation of 3-hexyn-1-ol without any need for surface modification by reducing the availability of the edge and corner sites of the catalyst particles in two ways: reducing the amount of Pd catalyst in the reactor and fusion of the surface sites upon thermal sintering. In both cases, a high selectivity toward cis-3-hexen-1-ol as a valuable alkene market product was obtained, while no modifier or doping agent was used in the structure of the catalyst. On the other hand, since the sintered Pd catalysts are stabilizer-free and have already been treated at elevated temperatures, there is less concern about their stability and durability in long-term catalytic hydrogenation reactions. The effect of the edge and corner sites is more evident when we consider that the fused particles possess a much higher catalytic surface area than the non-sintered ones.

Supplementary Materials

The following supporting information can be downloaded at: https://www.mdpi.com/article/10.3390/catal14040271/s1. Scheme S1. Catalytic hydrogenation setup (top), and fixed-bed quartz reactor for sintering (bottom). Figure S1. Possible product distribution pattern obtained by gas chromatography. Figure S2. Catalytic hydrogenation of 3-hexyn-1-ol by Lindlar catalyst: activity (a), reproducibility (b), and average selectivity (c) at the end of the reaction (around 100% conversion) at different nalkynol/APd ratios. Figure S3. Catalytic hydrogenation of 3-hexyn-1-ol: activity (a) reproducibility (b), and average selectivity (c) of the BASF LF200 catalyst to different products at the end of the reaction (around 100% conversion) at different nalkynol/APd ratios. Figure S4. Catalytic hydrogenation of 3-hexyn-1-ol over Pd agglomerates: activity (a), reproducibility (b), and average selectivity at the end of the reaction (c) at different nalkynol/APd ratios (all catalytic hydrogenation reactions could reach 99.99% conversion, except Pd_21 which could reach around 60% at the end of 20 h). Figure S5. Long-term kinetics plots for catalytic hydrogenation of cis-3-hexen-1-ol by Pd agglomerates at different nalkenol/APd ratios, T = 308 K, p = 0.3 MPa, and an agitation rate of 775 RPM, activity (a), reproducibility (b), and average selectivity (c) to different products at the end of the reaction. The conversion values after 20 h for Pd_0.08, Pd_0.3, Pd_1.4 and Pd_4.2 were around 100%, 75%, 25% and 10%, respectively. Figure S6. SEM micrographs of Pd_sin (623) particles (top) and Pd_sin (723) particles (bottom). Figure S7. Catalytic hydrogenation of 3-hexyn-1-ol: activity (a), reproducibility (b), and average selectivity (c) of the sintered Pd aggregates at different nalkynol/APd ratios (but at the same nalkynol/nPd molar ratio of 100). Figure S8. Long-term kinetics plots for catalytic hydrogenation of 3-hexyn-1-ol and cis-3-hexen-1-ol by Pd_sin (723) particles at different nalkynol/APd ratios and T = 308 K, p = 0.3 MPa, and an agitation rate of 775 RPM (a): for the heyxnol substrate, at H2 eq. = 1, the conversion value and also the selectivity to the cis-hexenol are considered to be around 100%, while by further H2 uptake isomer products are produced and the selectivity to the cis-hexenol drops to lower values. For the cis-hexenol substrate, the activity in both cases could not reach 100%; activity (b), and average selectivity of the Pd_sin (723) aggregates to different products (c) at different nalkynol/APd ratios at the end of the reaction. The numbers shown at the end of each curve in (a) give the average cis-hexenol selectivity.

Author Contributions

Conceptualization, T.S., E.K. and Y.T.; methodology, J.F., P.A.v.A., T.S., E.K., and Y.T.; software, F.T. and H.W.; validation, P.A.v.A., T.S., E.K. and Y.T.; formal analysis, F.T., S.H. and H.W.; investigation, F.T., S.H. and H.W.; resources, P.A.v.A., T.S., E.K. and Y.T.; data curation, F.T. and H.W.; writing—original draft preparation, F.T.; writing—review and editing, F.T., S.H., P.A.v.A., T.S., E.K. and Y.T.; visualization, F.T. and H.W.; supervision, J.F., P.A.v.A., T.S., E.K. and Y.T.; project administration, H.W.; funding acquisition, P.A.v.A. All authors have read and agreed to the published version of the manuscript.

Funding

This project has received funding from the European Union’s Horizon 2020 research and innovation program under Grant Agreement No. 823717–ESTEEM3.

Data Availability Statement

All data will be made available via DaRUS—the Data Repository of the University of Stuttgart: https://doi.org/10.18419/darus-4136 (accessed on 7 January 2024).

Acknowledgments

The authors would like to thank Heike Fingerle, Barbara Gehring, and Maximilian Schmidt for the ICP-OES, XRD, and SEM analyses and also Barbara Förtsch for the elemental analyses.

Conflicts of Interest

The authors declare no conflicts of interest.

Nomenclature

A P d Active metal surface area of Pd/m2
DMetal dispersion/%
d P Mean particle (crystallite) size/nm
ΦFractional occupancy of the adsorption sites
λ Wavelength/ Å
n P d Amount of Pd/mol
n a l k e n o l Amount of alkenol reagent/mol
n a l k y n o l Amount of alkynol reagent/mol
pPressure/MPa
S ¯ Average selectivity/%
TTemperature/K
θDiffraction angle
ARAutoclave reactor
BASF LF100BASF Nanoselect TM (0.6 wt.% c-Pd/C)
BASF LF200BASF Nanoselect TM (0.5 wt.% c-Pd/TiS)
eq.Equivalent
FFTFast Fourier transform
GBGas burette
GCGas chromatography
HAADF–STEMHigh-angle annular dark-field scanning transmission electron microscopy
HHDMAHexadecyl (2-hydroxyethyl) dimethyl ammonium dihydrogen phosphate
ICP_OESOptical emission spectroscopy with inductively coupled plasma
MFCMass flow controller
MFMMass flow meter
ppmParts per million
PRPressure recorder
RPMRounds per minute
SEMScanning electron microscopy
TCTemperature controller
TRTemperature recorder
XRDX-ray powder diffraction

References

  1. Delgado, J.A.; Benkirane, O.; Claver, C.; Curulla-Ferré, D.; Godard, C. Advances in the Preparation of Highly Selective Nanocatalysts for the Semi-Hydrogenation of Alkynes Using Colloidal Approaches. Dalton Trans. 2017, 46, 12381–12403. [Google Scholar] [CrossRef] [PubMed]
  2. Liu, K.; Qin, R.; Zheng, N. Insights into the Interfacial Effects in Heterogeneous Metal Nanocatalysts toward Selective Hydrogenation. J. Am. Chem. Soc. 2021, 143, 4483–4499. [Google Scholar] [CrossRef] [PubMed]
  3. Witte, P.T.; Berben, P.H.; Boland, S.; Boymans, E.H.; Vogt, D.; Geus, J.W.; Donkervoort, J.G. BASF NanoSelect™ Technology: Innovative Supported Pd- and Pt-based Catalysts for Selective Hydrogenation Reactions. Top. Catal. 2012, 55, 505–511. [Google Scholar] [CrossRef]
  4. Crespo-Quesada, M.; Cárdenas-Lizana, F.; Dessimoz, A.L.; Kiwi-Minsker, L. Modern Trends in Catalyst and Process Design for Alkyne Hydrogenations. ACS Catal. 2012, 2, 1773–1786. [Google Scholar] [CrossRef]
  5. Crespo-Quesada, M.; Yarulin, A.; Jin, M.; Xia, Y.; Kiwi-Minsker, L. Structure Sensitivity of Alkynol Hydrogenation on Shape- and Size-Controlled Palladium Nanocrystals: Which Sites Are Most Active and Selective? J. Am. Chem. Soc. 2011, 133, 12787–12794. [Google Scholar] [CrossRef]
  6. Cherkasov, N.; Murzin, Y.D.; Catlow, C.R.A.; Chutia, A. Selectivity of the Lindlar Catalyst in Alkyne Semi-Hydrogenation: A Direct Liquid-Phase Adsorption Study. Catal. Sci. Technol. 2021, 11, 6205–6216. [Google Scholar] [CrossRef]
  7. Zhao, X.; Chang, Y.; Chen, W.J.; Wu, Q.; Pan, X.; Chen, K.; Weng, B. Recent Progress in Pd-Based Nanocatalysts for Selective Hydrogenation. ACS Omega 2021, 7, 17–31. [Google Scholar] [CrossRef]
  8. Albani, D.; Shahrokhi, M.; Chen, Z.; Mitchell, S.; Hauert, R.; López, N.; Pérez-Ramírez, J. Selective Ensembles in Supported Palladium Sulfide Nanoparticles for Alkyne Semi-Hydrogenation. Nat. Commun. 2018, 9, 2634. [Google Scholar] [CrossRef]
  9. Paganelli, S.; Angi, A.; Pajer, N.; Piccolo, O. A Smart Heterogeneous Catalyst for Efficient, Chemo- and Stereoselective Hydrogenation of 3-Hexyn-1-ol. Catalysts 2021, 11, 14. [Google Scholar] [CrossRef]
  10. Prekob, Á.; Muránszky, G.; Szőri, M.; Karacs, G.; Kristály, F.; Ferenczi, T.; Fiser, B.; Viskolcz, B.; Vanyorek, L. Preparation of highly effective carbon black supported Pd-Pt bimetallic catalysts for nitrobenzene hydrogenation. Nanotechnology 2021, 32, 425701–425712. [Google Scholar] [CrossRef]
  11. Cao, Y.; Fu, W.; Sui, Z.; Duan, X.; Chen, D.; Zhou, X. Kinetics Insights and Active Sites Discrimination of Pd-Catalyzed Selective Hydrogenation of Acetylene. Ind. Eng. Chem. Res. 2019, 58, 1888–1895. [Google Scholar] [CrossRef]
  12. McNeice, P.; Müller, M.A.; Medlock, J.; Bonrath, W.; Rockstroh, N.; Bartling, S.; Lund, H.; Junge, K.; Beller, M. Designing a Green Replacement for the Lindlar Catalyst for Alkyne Semi-hydrogenation Using Silica-Supported Nickel Nanoparticles Modified by N-Doped Carbon. ACS Sustain. Chem. Eng. 2022, 10, 9787–9797. [Google Scholar] [CrossRef]
  13. Chen, X.; Shi, C.; Liang, C. Highly Selective Catalysts for the Hydrogenation of Alkynols: A Review. Chin. J. Catal. 2021, 42, 2105–2121. [Google Scholar] [CrossRef]
  14. Witte, P.T.; Boland, S.; Kirby, F.; van Maanen, R.; Bleeker, B.; de Winter, D.A.M.; Post, J.A.; Geus, J.W.; Berben, P.H. NanoSelect Pd Catalysts: What Causes the High Selectivity of These Supported Colloidal Catalysts in Alkyne Semi-Hydrogenation? ChemCatChem 2013, 5, 582–587. [Google Scholar] [CrossRef]
  15. Montsch, T.; Heuchel, M.; Traa, Y.; Klemm, E.; Stubenrauch, C. Selective Hydrogenation of 3-Hexyn-1-ol with Pd Nanoparticles Synthesized via Microemulsions. Appl. Catal. A Gen. 2017, 539, 19–28. [Google Scholar] [CrossRef]
  16. Ballesteros-Soberanas, J.; Carrasco, J.A.; Leyva-Pérez, A. Parts-Per-Million of Soluble Pd0 Catalyze the Semi-Hydrogenation Reaction of Alkynes to Alkenes. J. Org. Chem. 2023, 88, 18–26. [Google Scholar] [CrossRef] [PubMed]
  17. Berguerand, C.; Yuranov, I.; Cárdenas-Lizana, F.; Yuranova, T.; Kiwi-Minsker, L. Size-Controlled Pd Nanoparticles in 2-Butyne-1,4-diol Hydrogenation: Support Effect and Kinetics Study. J. Phys. Chem. C. 2014, 118, 12250–12259. [Google Scholar] [CrossRef]
  18. Vilé, G.; Almora-Barrios, N.; Mitchell, S.; López, N.; Pérez-Ramírez, J. From the Lindlar Catalyst to Supported Ligand-Modified Palladium Nanoparticles: Selectivity Patterns and Accessibility Constraints in the Continuous-Flow Three-Phase Hydrogenation of Acetylenic Compounds. Chemistry 2014, 20, 5926–5937. [Google Scholar] [CrossRef] [PubMed]
  19. Moulijn, J.A.; Van Diepen, A.E.; Kapteijn, F. Deactivation and Regeneration. In Handbook of Heterogeneous Catalysis, 2nd ed.; WILEY-VCH: Weinheim, Germany, 2008; Volume 4, pp. 1829–1845. [Google Scholar]
  20. Chen, X.; Hou, Y.; Wang, H.; Cao, Y.; He, J. Facile Deposition of Pd Nanoparticles on Carbon Nanotube Microparticles and Their Catalytic Activity for Suzuki Coupling Reactions. J. Phys. Chem. C 2008, 112, 8172–8176. [Google Scholar] [CrossRef]
  21. Bergeret, G.; Gallezot, P. Particle Size and Dispersion Measurements. In Handbook of Heterogeneous Catalysis, 2nd ed.; Wiley-VCH: Weinheim, Germany, 2008; pp. 738–765. [Google Scholar]
  22. Vons, V.A.; Leegwater, H.; Legerstee, W.J.; Eijt, S.; Schmidt-Ott, A. Hydrogen Storage Properties of Spark Generated Palladium Nanoparticles. Int. J. Hydrogen Energy 2010, 35, 5479–5489. [Google Scholar] [CrossRef]
  23. Liu, R.J.; Crozier, P.A.; Smith, C.M.; Hucul, D.A.; Blackson, J.; Salaita, G. Metal Sintering Mechanisms and Regeneration of Palladium/Alumina Hydrogenation Catalysts. Appl. Catal. A Gen. 2005, 282, 111–121. [Google Scholar] [CrossRef]
  24. Liu, R.J.; Crozier, P.A.; Smith, C.M.; Hucul, D.A.; Blackson, J.; Salaita, G. In Situ Electron Microscopy Studies of the Sintering of Palladium Nanoparticles on Alumina During Catalyst Regeneration Processes. Microsc Microanal. 2004, 10, 77–85. [Google Scholar] [CrossRef] [PubMed]
  25. Harbola, V.; Wu, Y.J.; Wang, H.; Smink, S.; Parks, S.C.; Van Aken, P.A.; Mannhart, J. Self-Assembly of Nanocrystalline Structures from Freestanding Oxide Membranes. Adv. Mater. 2022, 35, 2210989. [Google Scholar] [CrossRef] [PubMed]
Scheme 1. Selective and nonselective paths for hydrogenation of 3-hexyn-1-ol [3].
Catalysts 14 00271 sch001
Figure 1. Long-term kinetic plots for catalytic hydrogenation of 3-hexyn-1-ol at different n a l k y n o l / A P d ratios over the Lindlar and BASF LF200 catalysts at T = 308   K ,   p = 0.3 MPa and an agitation rate of 775   R P M . At H 2   e q . = 1 , the conversion value and also the selectivity to the cis-hexenol are considered to be around 100%, while by further H 2 uptake, isomer products are produced and the selectivity to the cis-hexenol drops to lower values. The numbers shown at the end of each curve give the average cis-hexenol selectivity.
Catalysts 14 00271 g001
Figure 2. Long-term kinetic plots for the catalytic hydrogenation of 3-hexyn-1-ol by Pd agglomerates at different n a l k y n o l / A P d ratios, T = 308   K ,   p = 0.3   M P a , and an agitation rate of 775 RPM. At H 2 e q . = 1 , the conversion value and also the selectivity to the cis-hexenol are considered to be around 100%, while by further H 2   uptake, isomer products are produced and the selectivity to the cis-hexenol drops to lower values. The numbers shown at the end of each curve give the average cis-hexenol selectivity.
Catalysts 14 00271 g002
Figure 3. X-ray diffraction patterns of the non-sintered Pd agglomerates and Pd aggregates sintered at 473 K, 623 K, and 723 K.
Catalysts 14 00271 g003
Figure 4. HAADF-STEM micrographs of Pd agglomerates at different resolutions, 200 nm (a), 100 nm (b), 50 nm (c), and 20 nm (d).
Catalysts 14 00271 g004
Figure 5. HAADF-STEM micrographs of Pd aggregates sintered at 723 K (a,b) and atomic resolution images of them (c,e,g) together with their corresponding FFT results (d,f,h).
Catalysts 14 00271 g005
Figure 6. Long-term kinetic plots for catalytic hydrogenation of 3-hexyn-1-ol using non-sintered and sintered Pd particles at different n a l k y n o l / A P d   ratios (but all at the same n a l k y n o l / n P d   of 100), T = 308   K , p = 0.3 MPa, and an agitation rate of 775   R P M . At H 2   e q . = 1 , the conversion value and also the selectivity to the cis-hexenol are considered to be around 100%, while by further H 2 uptake, isomer products are produced and the selectivity to the cis-hexenol drops to lower values. The numbers shown at the end of each curve give the average cis-hexenol selectivity.
Catalysts 14 00271 g006
Table 1. Results of catalyst characterization and catalytic tests, compared to values from the literature [16,17,18].
N a m e Catalyst
/mg
Pd in Reactor
/mol
Alkynol Reagent
/mol
Cis-Alkenol Reagent
/mol
n r e a g e n t n P d 1
/ m o l   m o l 1
d P *
/ n m
D * *
/ %
APd **
/m2
n r e a g e n t   A P d 1
/mol m−2
n r e a g e n t t 1
/ m o l   s 1
n r e a g e n t
n P d 1 t 1 / m o l   m o l 1 s 1
S ¯ c i s h e x e n o l
/%
S ¯ h e x e n o l
/%
Lindlar10 0.46 × 10 5 9 × 10 3 - 2 × 10 3 7.5
(12.5 [17])
7
(6 [18])
1.65 × 10 3 5 44.0 × 10 7 0.936798
Lindlar [16]---- 2.5 × 10 3 ---- 0.77 × 10 7 0.1999-
Lindlar1 0.04 × 10 5 9 × 10 3 - 20 × 10 3 7.57 0.16 × 10 3 50 15.6 × 10 7 3.318898
Lindlar0.2 0.008 × 10 5 23 × 10 3 - 250 × 10 3 0.03 × 10 3 700 6.38 × 10 7 6.799399
Lindlar0.1 0.004 × 10 5 23 × 10 3 - 500 × 10 3 0.01 × 10 3 1400 3.13 × 10 7 6.679799
Lindlar [16]---- 500 × 10 3 ---- 0.02 × 10 7 1.16--
BASF LF20010 0.04 × 10 5 9 × 10 3 - 20 × 10 3 5.420 (14 [18]) 0.02 × 10 3 400 12.1 × 10 7 2.594885
BASF LF200 [16]---- 2.5 × 10 3 ---- 1.42 × 10 7 0.3590-
BASF LF2001 0.004 × 10 5 23 × 10 3 - 500 × 10 3 5.420 0.002 × 10 3 10,300 3.96 × 10 7 8.439699
BASF LF200 [16]---- 500 × 10 3 ---- 0.03 × 10 7 1.55--
Pd agglomerates6 5.63 × 10 5 5.6 × 10 3 -1003.22.5 66.7 × 10 3 0.08 33.1 × 10 7 0.0600
0.7 0.65 × 10 5 5.6 × 10 3 -850 7.77 × 10 3 0.7 8.75   × 10 7 0.1300
0.4 0.37 × 10 5 5.6 × 10 3 - 1.5 × 10 3 4.44 × 10 3 1.34.60  × 10 7 0.12413
0.1 0.09 × 10 5 5.6 × 10 3 - 6 × 10 3 1.11 × 10 3 53.49  × 10 7 0.378597
0.1 0.09 × 10 5 23.5 × 10 3 - 25 × 10 3 1.11 × 10 3 212.17  × 10 7 0.23100 ***100 ***
5 4.69 × 10 5 - 4.7 × 10 3 100 55.6 × 10 3 0.08 8.91 × 10 7 19  × 10 3 --
1.3 1.22 × 10 5 - 4.7 × 10 3 380 14.4 × 10 3 0.3 0.42 × 10 7 3.4  × 10 3 --
0.3 0.28 × 10 5 - 4.7 × 10 3 1.6 × 10 3 3.33 × 10 3 1.4 0.06 × 10 7 2.4  × 10 3 --
0.1 0.09 × 10 5 - 4.7 × 10 3 5 × 10 3 1.11 × 10 3 4.2 0.06 × 10 7 × 10 3 --
Pd_sin (473)6 5.63 × 10 5 5.6 × 10 3 -100270.90 23.7 × 10 3 0.24 25.6  × 10 7 4 5 × 10 3 22
Pd_sin (623)6 5.63 × 10 5 5.6 × 10 3 -100340.56 15.0 × 10 3 0.38 5.77  × 10 7 10 × 10 3 14
Pd_sin (723)6 5.63 × 10 5 5.6 × 10 3 -100400.30 7.96 × 10 3 0.77 2.50  × 10 7 × 10 3 8994
15 14.0 × 10 5 5.6 × 10 3 -40 19.9 × 10 3 0.28 15.3 × 10 7 10  × 10 3 97
10 9.39 × 10 5 - 4.7 × 10 3 50 13.2 × 10 3 0.350.15  × 10 7 0.16  × 10 3 --
6 5.63 × 10 5 - 4.7 × 10 3 85 7.96 × 10 3 0.600.10  × 10 7 0.19  × 10 3 --
* determined by XRD; ** determined by CO chemisorption; *** after about 20 h, the conversion value was around 60%.
Table 2. Details of the chemicals used in this study, including the purity grade and the manufacturer company. All materials were used without further purification.
ChemicalPurityManufacturer
3-Hexyn-1-ol98%Sigma Aldrich, St. Louis, MO, USA
Cis-3-Hexen-1-ol98%Sigma Aldrich, St. Louis, MO, USA
Trans-3-Hexen-1-ol97%Sigma Aldrich, St. Louis, MO, USA
4-Hexen-1-ol97%Sigma Aldrich, St. Louis, MO, USA
2-Hexen-1-ol98%Sigma Aldrich, St. Louis, MO, USA
1-Hexanol>99%Sigma Aldrich, St. Louis, MO, USA
Brij30n.a.Sigma Aldrich, St. Louis, MO, USA
Palladium (II) nitrate dihydrate99.99%Sigma Aldrich, St. Louis, MO, USA
n-Octane98%Sigma Aldrich, St. Louis, MO, USA
1-Octanol≥99%Sigma Aldrich, St. Louis, MO, USA
Sodium borohydride (NaBH4)98%Sigma Aldrich, St. Louis, MO, USA
Ethanol (EtOH)AbsoluteMerck KGaA, Darmstadt, Germany
Water (H2O)DemineralizedUniversity of Stuttgart, Stuttgart, Germany
Nitric acid 65%Sigma Aldrich, St. Louis, MO, USA
Lindlar catalystn.a.Sigma Aldrich, St. Louis, MO, USA
BASF LF200 catalystn.a.Strem (Europe), Bischheim, France
Hydrogen ( H 2 )99.99%Westfalen, Münster, Germany
Argon (Ar)99.99%Westfalen, Münster, Germany
Nitrogen ( N 2 )99.99%Westfalen, Münster, Germany
Helium (He)99.99%Westfalen, Münster, Germany
Disclaimer/Publisher’s Note: The statements, opinions and data contained in all publications are solely those of the individual author(s) and contributor(s) and not of MDPI and/or the editor(s). MDPI and/or the editor(s) disclaim responsibility for any injury to people or property resulting from any ideas, methods, instructions or products referred to in the content.

