Abstract
Methanol synthesis from CO2 can be made in the presence of a sorbent to increase the achievable yield. If the fresh sorbent is continuously fed to a fluidized bed and separated from the catalyst bed by segregation, a steady-state operation can be achieved. The objective of the present work is to provide insight on the suitable operating conditions for such a fluidized bed reactor system. For this, a conventional CuO/ZnO/Al2O3 was selected as the catalyst, and the SiOLITE® zeolite was selected as the sorbent. Different particle sizes were used to be tested in various proportions to perform the fluidized bed segregation study. The fluid dynamics and segregation of the catalyst–sorbent binary mixtures were the most critical points in the development of this proof of concept. A good bed segregation with a mixing index of 0.31 was achieved. This fact favors the correct operation of the system with the continuous addition of adsorbent, which had hardly any catalyst losses during the tests carried out, achieving a loss of 0.005 g/min under optimal conditions. Continuous feeding and removal of sorbent with a low loss of catalyst was observed. Reactor simulations with MATLAB provided promising results, indicating that the addition of sorbent considerably improves the methanol yield under some operating conditions. This makes it more viable for industrial scaling, since it allows us to considerably reduce the pressure used in the methanol synthesis process or to increase the yield per step, reducing the recirculation of unconverted reactants.
1. Introduction
The development of e-fuels, such as green methanol, is an opportunity for our society to reduce dependence on fossil fuels and to contribute to the reduction of CO2 emissions [1,2]. This green methanol would be produced by the hydrogenation of CO2, with the hydrogen being obtained by the electrolysis of water using renewable energy (e.g., solar or wind). The search for improvements in the technology of direct production of methanol by the hydrogenation of CO2 has inspired numerous researchers, both in the development of new catalysts and in the improvement of the process [3,4,5,6,7]. A comprehensive review on the different approaches for CO2 conversion was published by Saravanan et al. [8].
One of the main drawbacks of the direct conversion of CO2 to methanol is the low yield of methanol per step, due to the thermodynamic limitations in conventional reactors [9]. This yield may be increased using high pressure, but it would increase both the capital expenditure (CAPEX) and operational expenditure (OPEX).
Several research groups seeking to improve this performance have contributed with developments in the fields of membrane reactors [10,11,12,13] and sorption-enhanced reactors (SER) [14,15,16]. In both types of reactors, the basic concept is similar: the aim is to remove one or more of the reaction products to shift the equilibrium towards the formation of products, according to the Le Chatelier’s principle. In this way, a membrane that selectively removes some reaction products (i.e., water or methanol) increases performance even beyond the limit set by thermodynamic equilibrium in a conventional reactor. SER technology involves adding a sorbent to the reaction medium, which removes some of the products by their adsorption from the reacting atmosphere. A wide review on SER based on the removal of steam was published by van Kampen et al. [17].
In the case of SER applied to the production of methanol by the hydrogenation of CO2, zeolites, which preferentially adsorb the water formed in the reaction, are typically used. Most experimental SER studies for the hydrogenation of CO2 to methanol have used fixed-bed reactors [18], in which the zeolite is mixed with the catalyst. The process causes the zeolite to become saturated after a certain time, and then the reactor performance drops to the level that it would have when using the catalyst in the absence of sorbent. This would require industrial operation in a non-steady state with several catalyst beds so that while the SER is carried out in one of them, the zeolite is regenerated in another bed (by heating and/or lowering the pressure to desorb the adsorbed water).
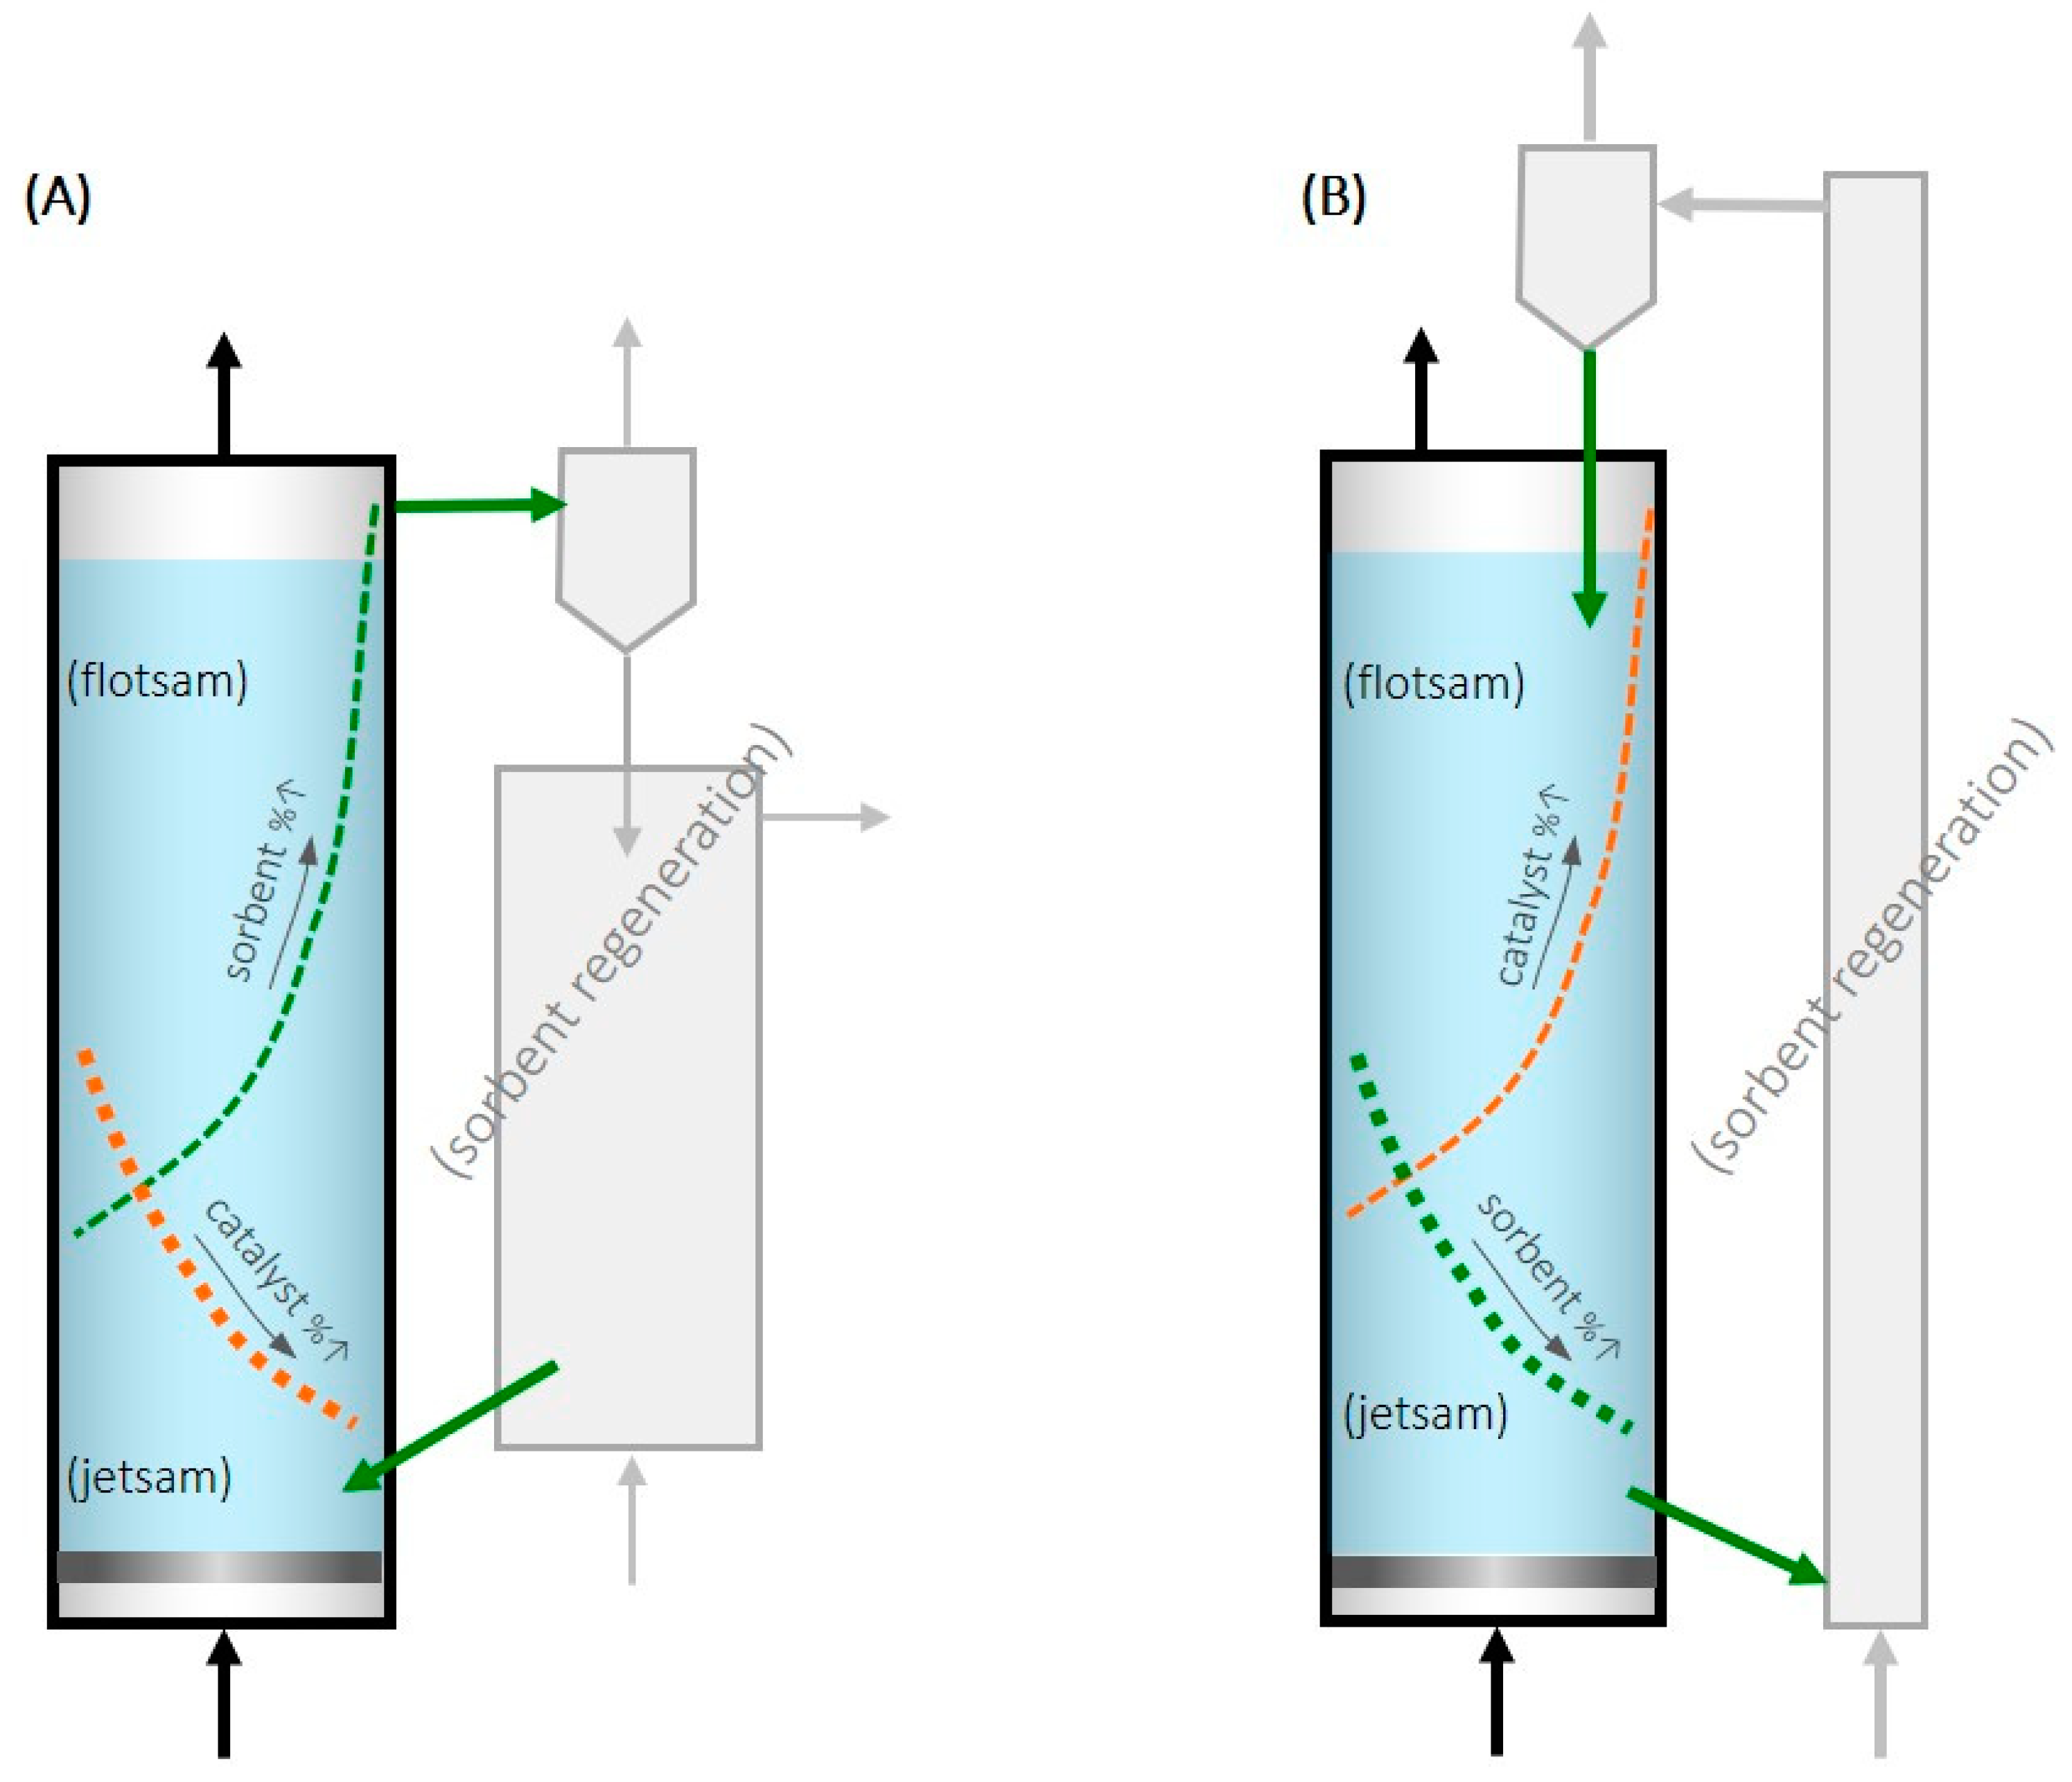
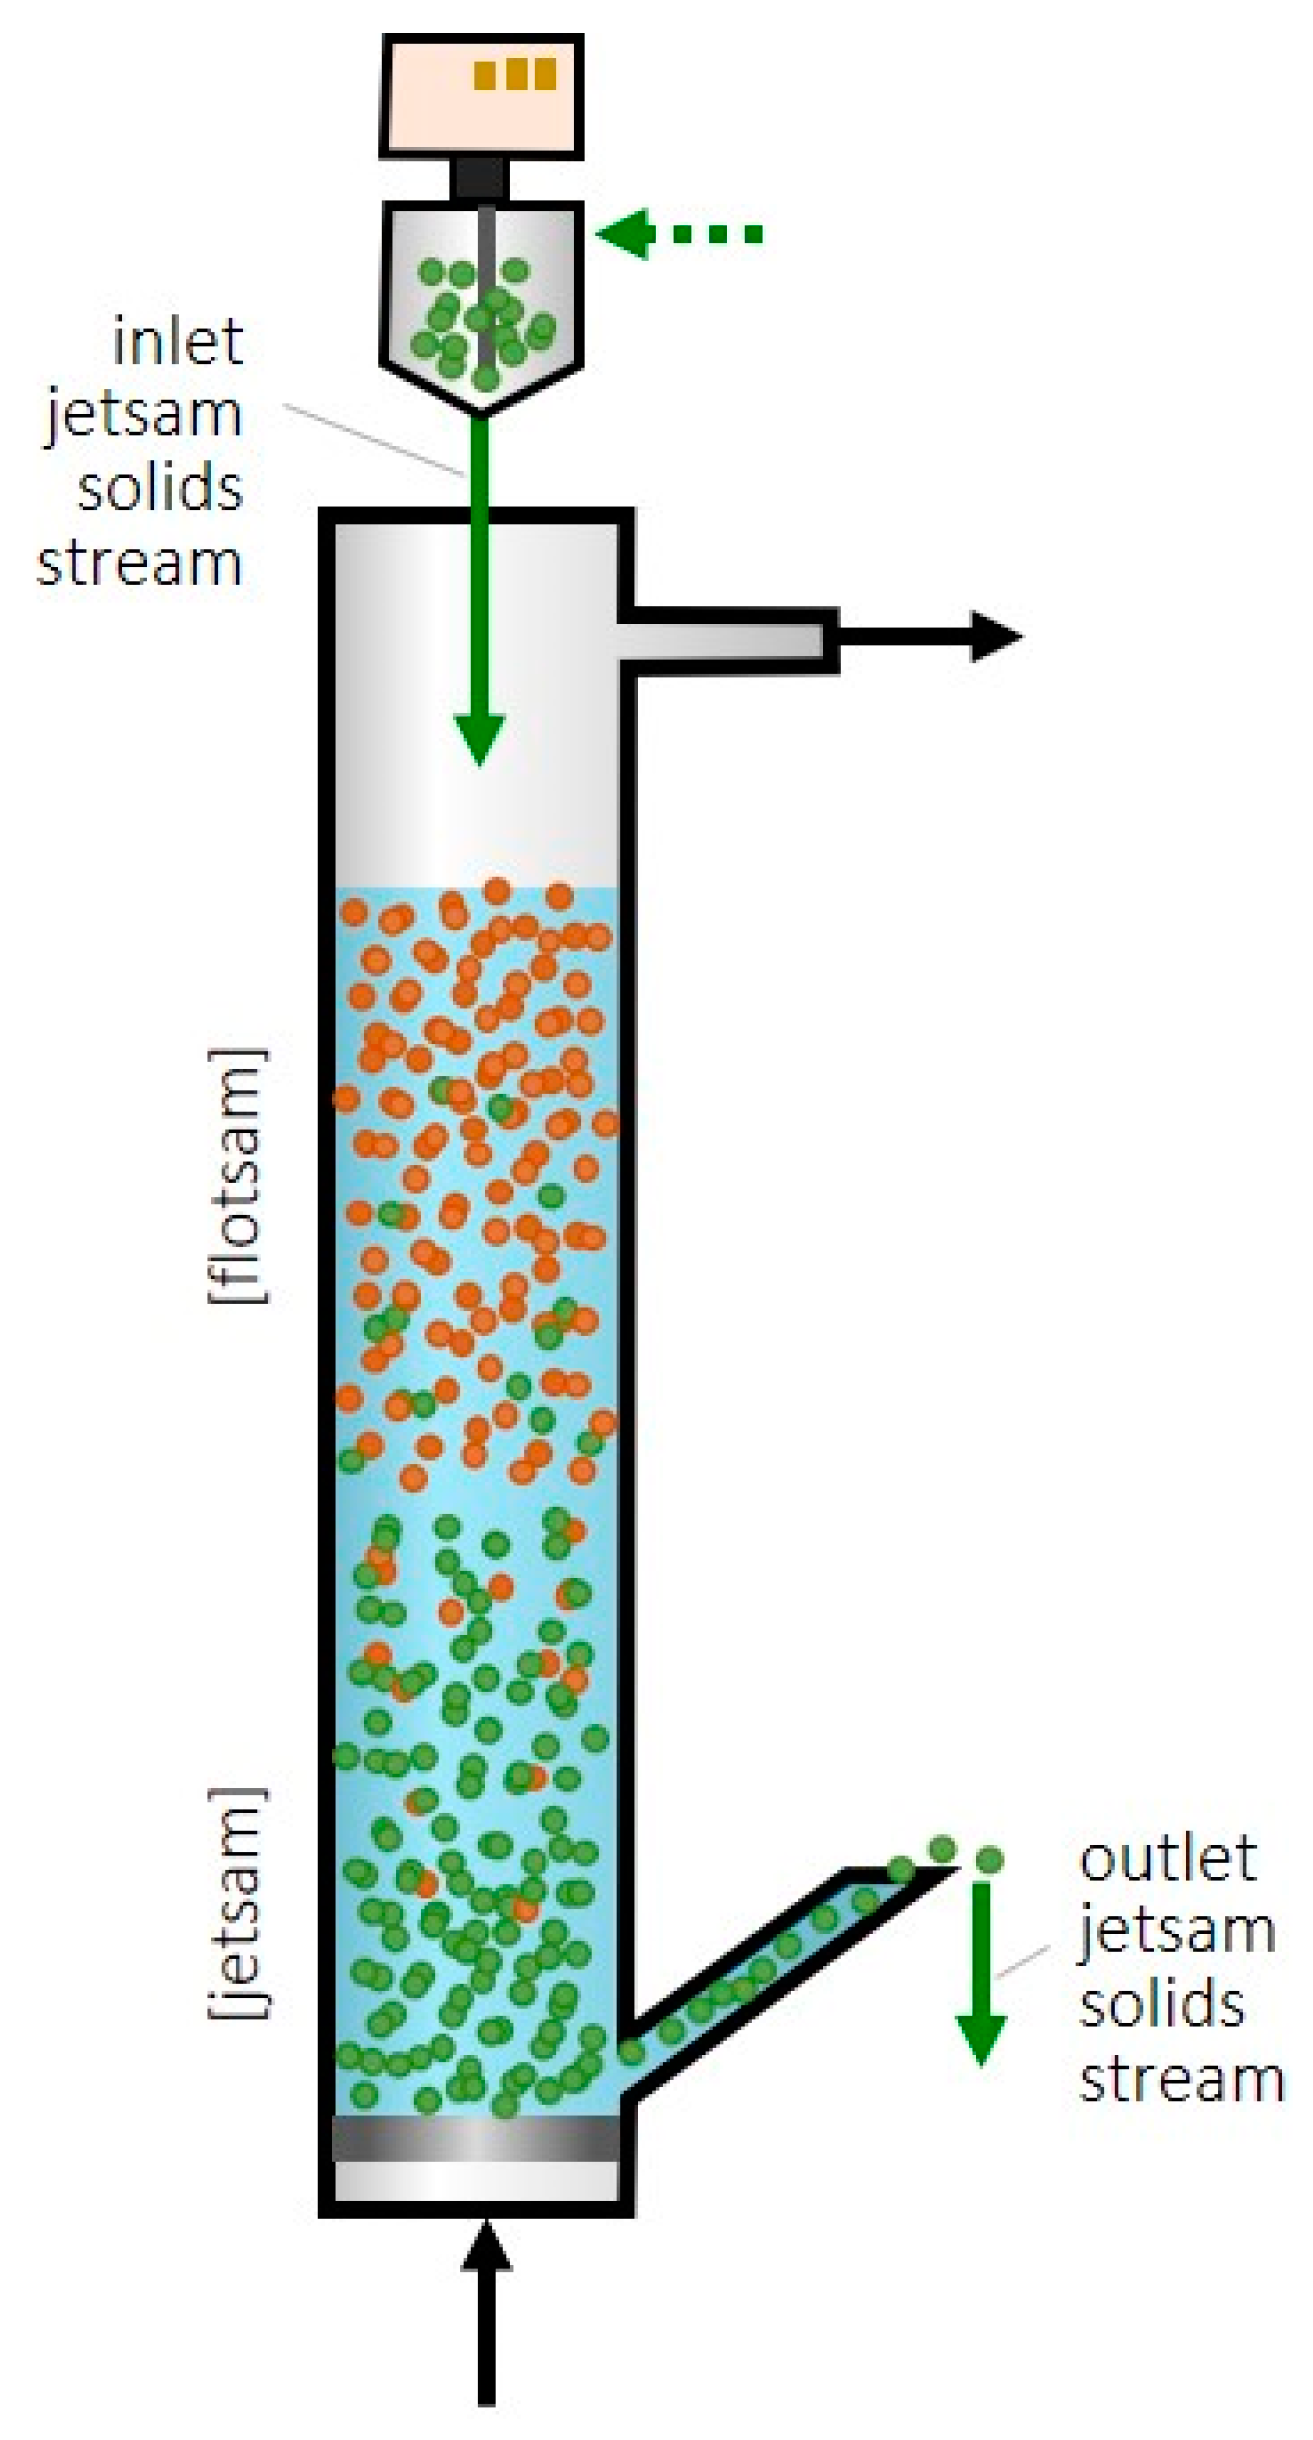
A recent patent [19] proposed taking advantage of the segregation phenomenon in fluidized beds to achieve continuous feeding and the removal of sorbent and thus to operate in a steady state. A selective output flow of sorbent is intended while the catalyst remains in the bed of the CO2 hydrogenation reactor. One option to achieve this continuous feeding and removal may be with a catalyst with particles larger (or denser) than the sorbent, in which case the sorbent would be flotsam, and fresh sorbent could be fed into the bottom of the fluidized bed and removed, in a saturated state, from the top (Figure 1A).

Figure 1.
Scheme of the proposed fluidized bed for methanol SER and selective feeding/removal of sorbent particles from/towards their regeneration (Green color is related to the sorbent and orange is related to the catalyst as the leyend says). (A) Sorbent as flotsam. (B) Sorbent as jetsam.
In another option, if the sorbent is made up of larger or denser particles than the catalyst, the sorbent would be jetsam, and the sorbent could be fed to the top of the fluidized bed and removed from the bottom (Figure 1B). This reactor design would have the advantage, compared to the fixed-bed SER, of being able to operate in a steady state, which is industrially advantageous. Furthermore, by regenerating the zeolite outside the reactor where the catalyst is located, the catalyst deactivation during the regeneration process due to high temperatures and/or high partial pressures of water vapor is avoided.
The idea of the continuous feeding of sorbent for the SER of methanol was previously proposed but using a fixed bed of catalyst and a very fine sorbent flowing in the space among the catalyst particles [20]. The use of a fluidized bed, with one of the solids acting as flotsam and the other as jetsam, is expected to provide an easier flow of sorbent than the gas-flowing solid-fixed bed system.
This work aims to verify, using real catalyst and sorbent mixtures, the feasibility of obtaining a suitable segregation of catalyst and sorbent in a fluidized bed. To this end, the flotsam/jetsam concentration profiles ere experimentally determined in a fluidized bed containing both solids at several operating conditions. In addition, the feasibility of operating with continuous feeding and the selective removal of sorbent in a fluidized bed will be verified by studying operation variables that may affect the undesired catalyst content in the sorbent outlet stream. Finally, a simple mathematical reactor model will be applied to obtain some insight about the methanol yields achievable in the SER system with the proposed continuous input and output of sorbent.
2. Results and Discussion
2.1. Segregation Tests
Once the minimum fluidization velocity (umf) of the binary bed was calculated, we studied the segregation of the solids in the bed. For this, tests were carried out with different bed configurations and nitrogen flow rates.
To know the distribution of solids, once the steady state was reached, the analysis was carried out by sieving the bed previously divided into sections with equal bed heights. Results are presented in Tables S1–S7 of Supplementary Materials.
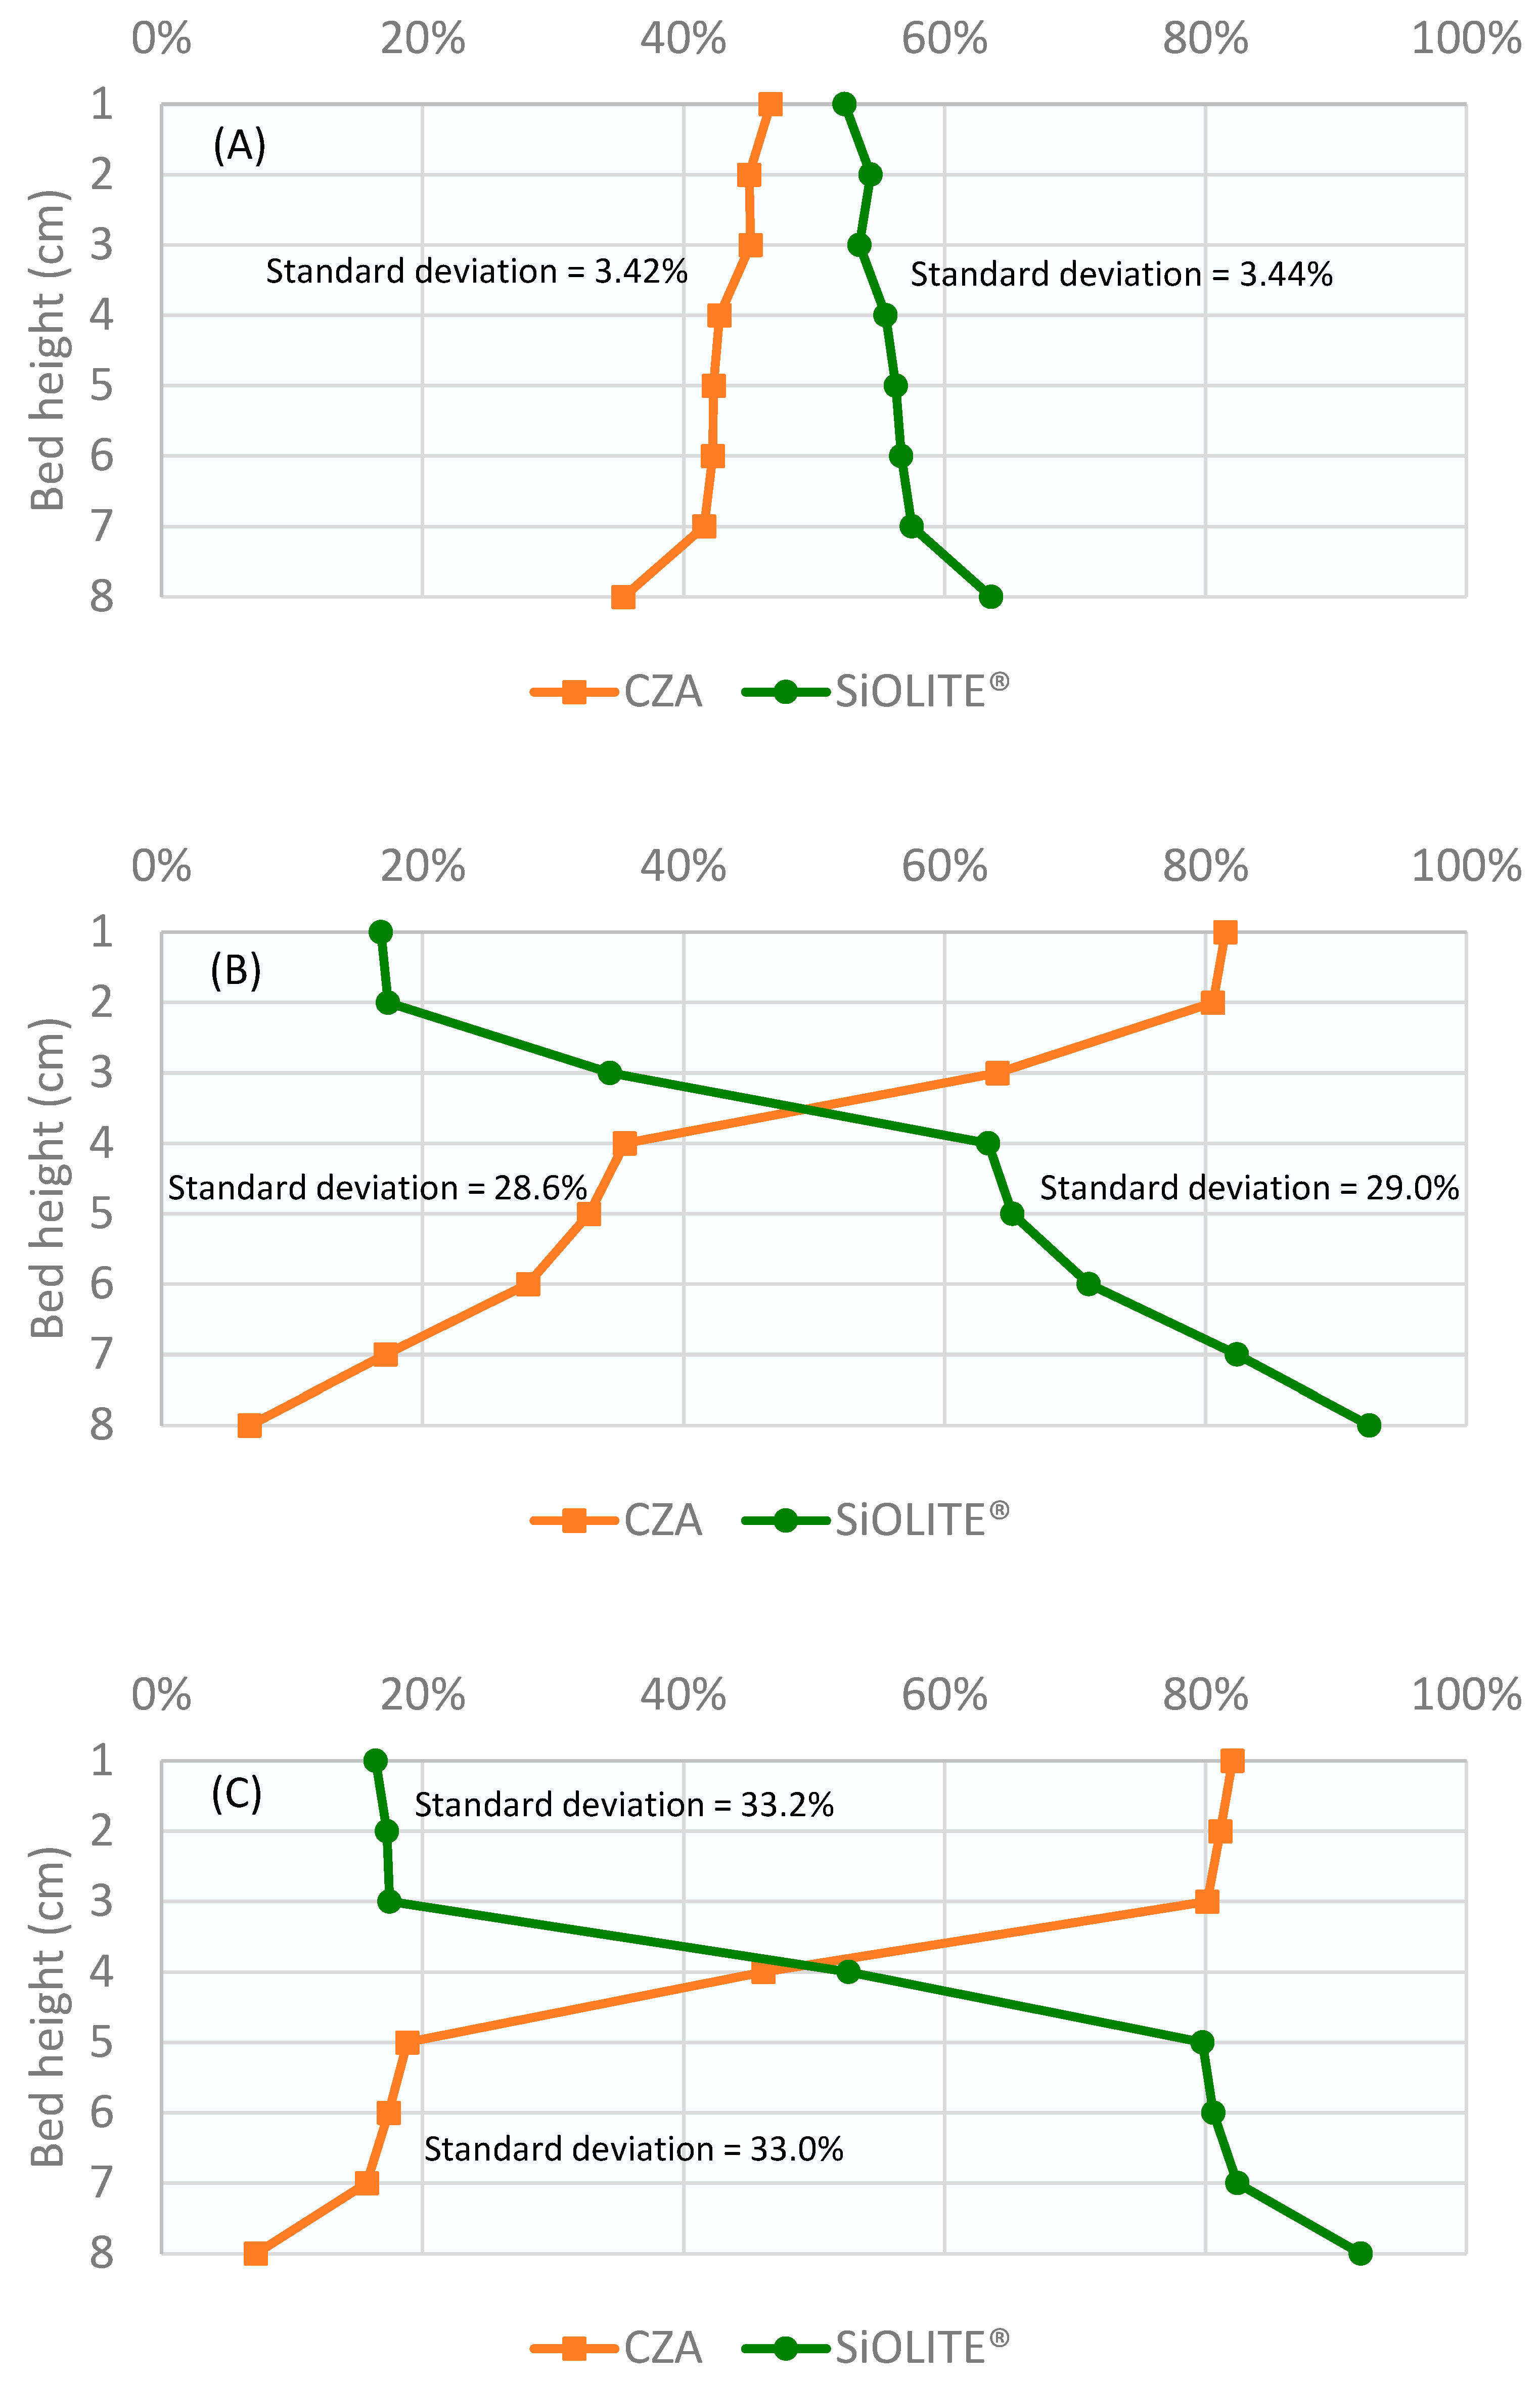
Profiles obtained for the CuO/ZnO/Al2O3 catalyst: SiOLITE® zeolite sorbent (CZA: SiOLITE®) mixture with a vol% proportion of 50:50 (44:56 wt%) is shown in Figure 2. It can be seen that segregation took place only for gas velocity/minimum fluidization velocity ratio values (u0/umf) between 1.25 and 1.75. At u0/umf = 1, there were no bubbles, and thus, there was no mixing; at u0/umf = 2, a good mixing was obtained.
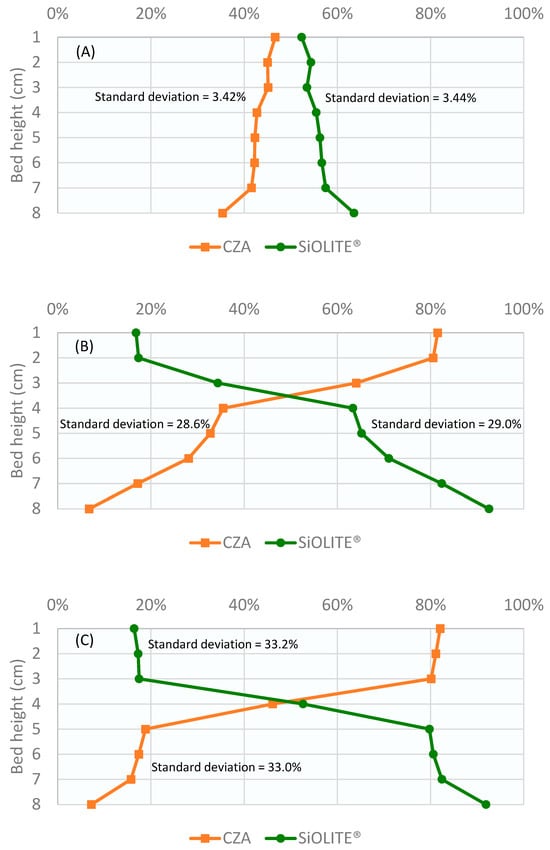
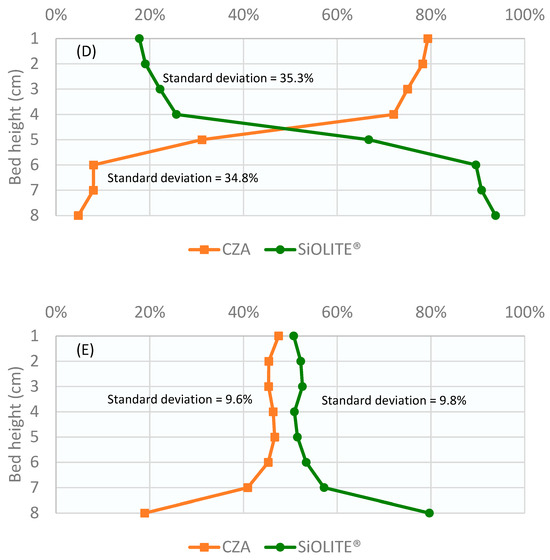
Figure 2.
Weight percentage of both solids vs height of the bed for a CZA: SiOLITE® vol% proportion of 50:50 and different u0/umf: (A) 1, (B) 1.25, (C) 1.5, (D) 1.75, and (E) 2. Lines only for visual guidance.
Subsequently, to compare the efficiency of segregation, the equation described by Marzocchella et al. [21] was used to calculate the mixing index (M.I.) (1). This expression showed that the mixing index must have a value between 0 and 1, being closer to unity the less segregated the mixture of solids is.
where is the experimental weight solid fraction, Xj is the ideal weight solid fraction if fully segregated, and Xj0 is the initial weight solid fraction.
First, a 50% CZA–50% SiOLITE® bed by volume is studied at different nitrogen flow rates, using q0 (i.e., different u0/umf ratios) to find the optimal segregation value, which will be the one with the lowest mixing index. The experiments were made starting with a fully mixed bed. The results obtained are shown in Table 1.

Table 1.
Results of binary bed segregation tests with gas flow rate variation.
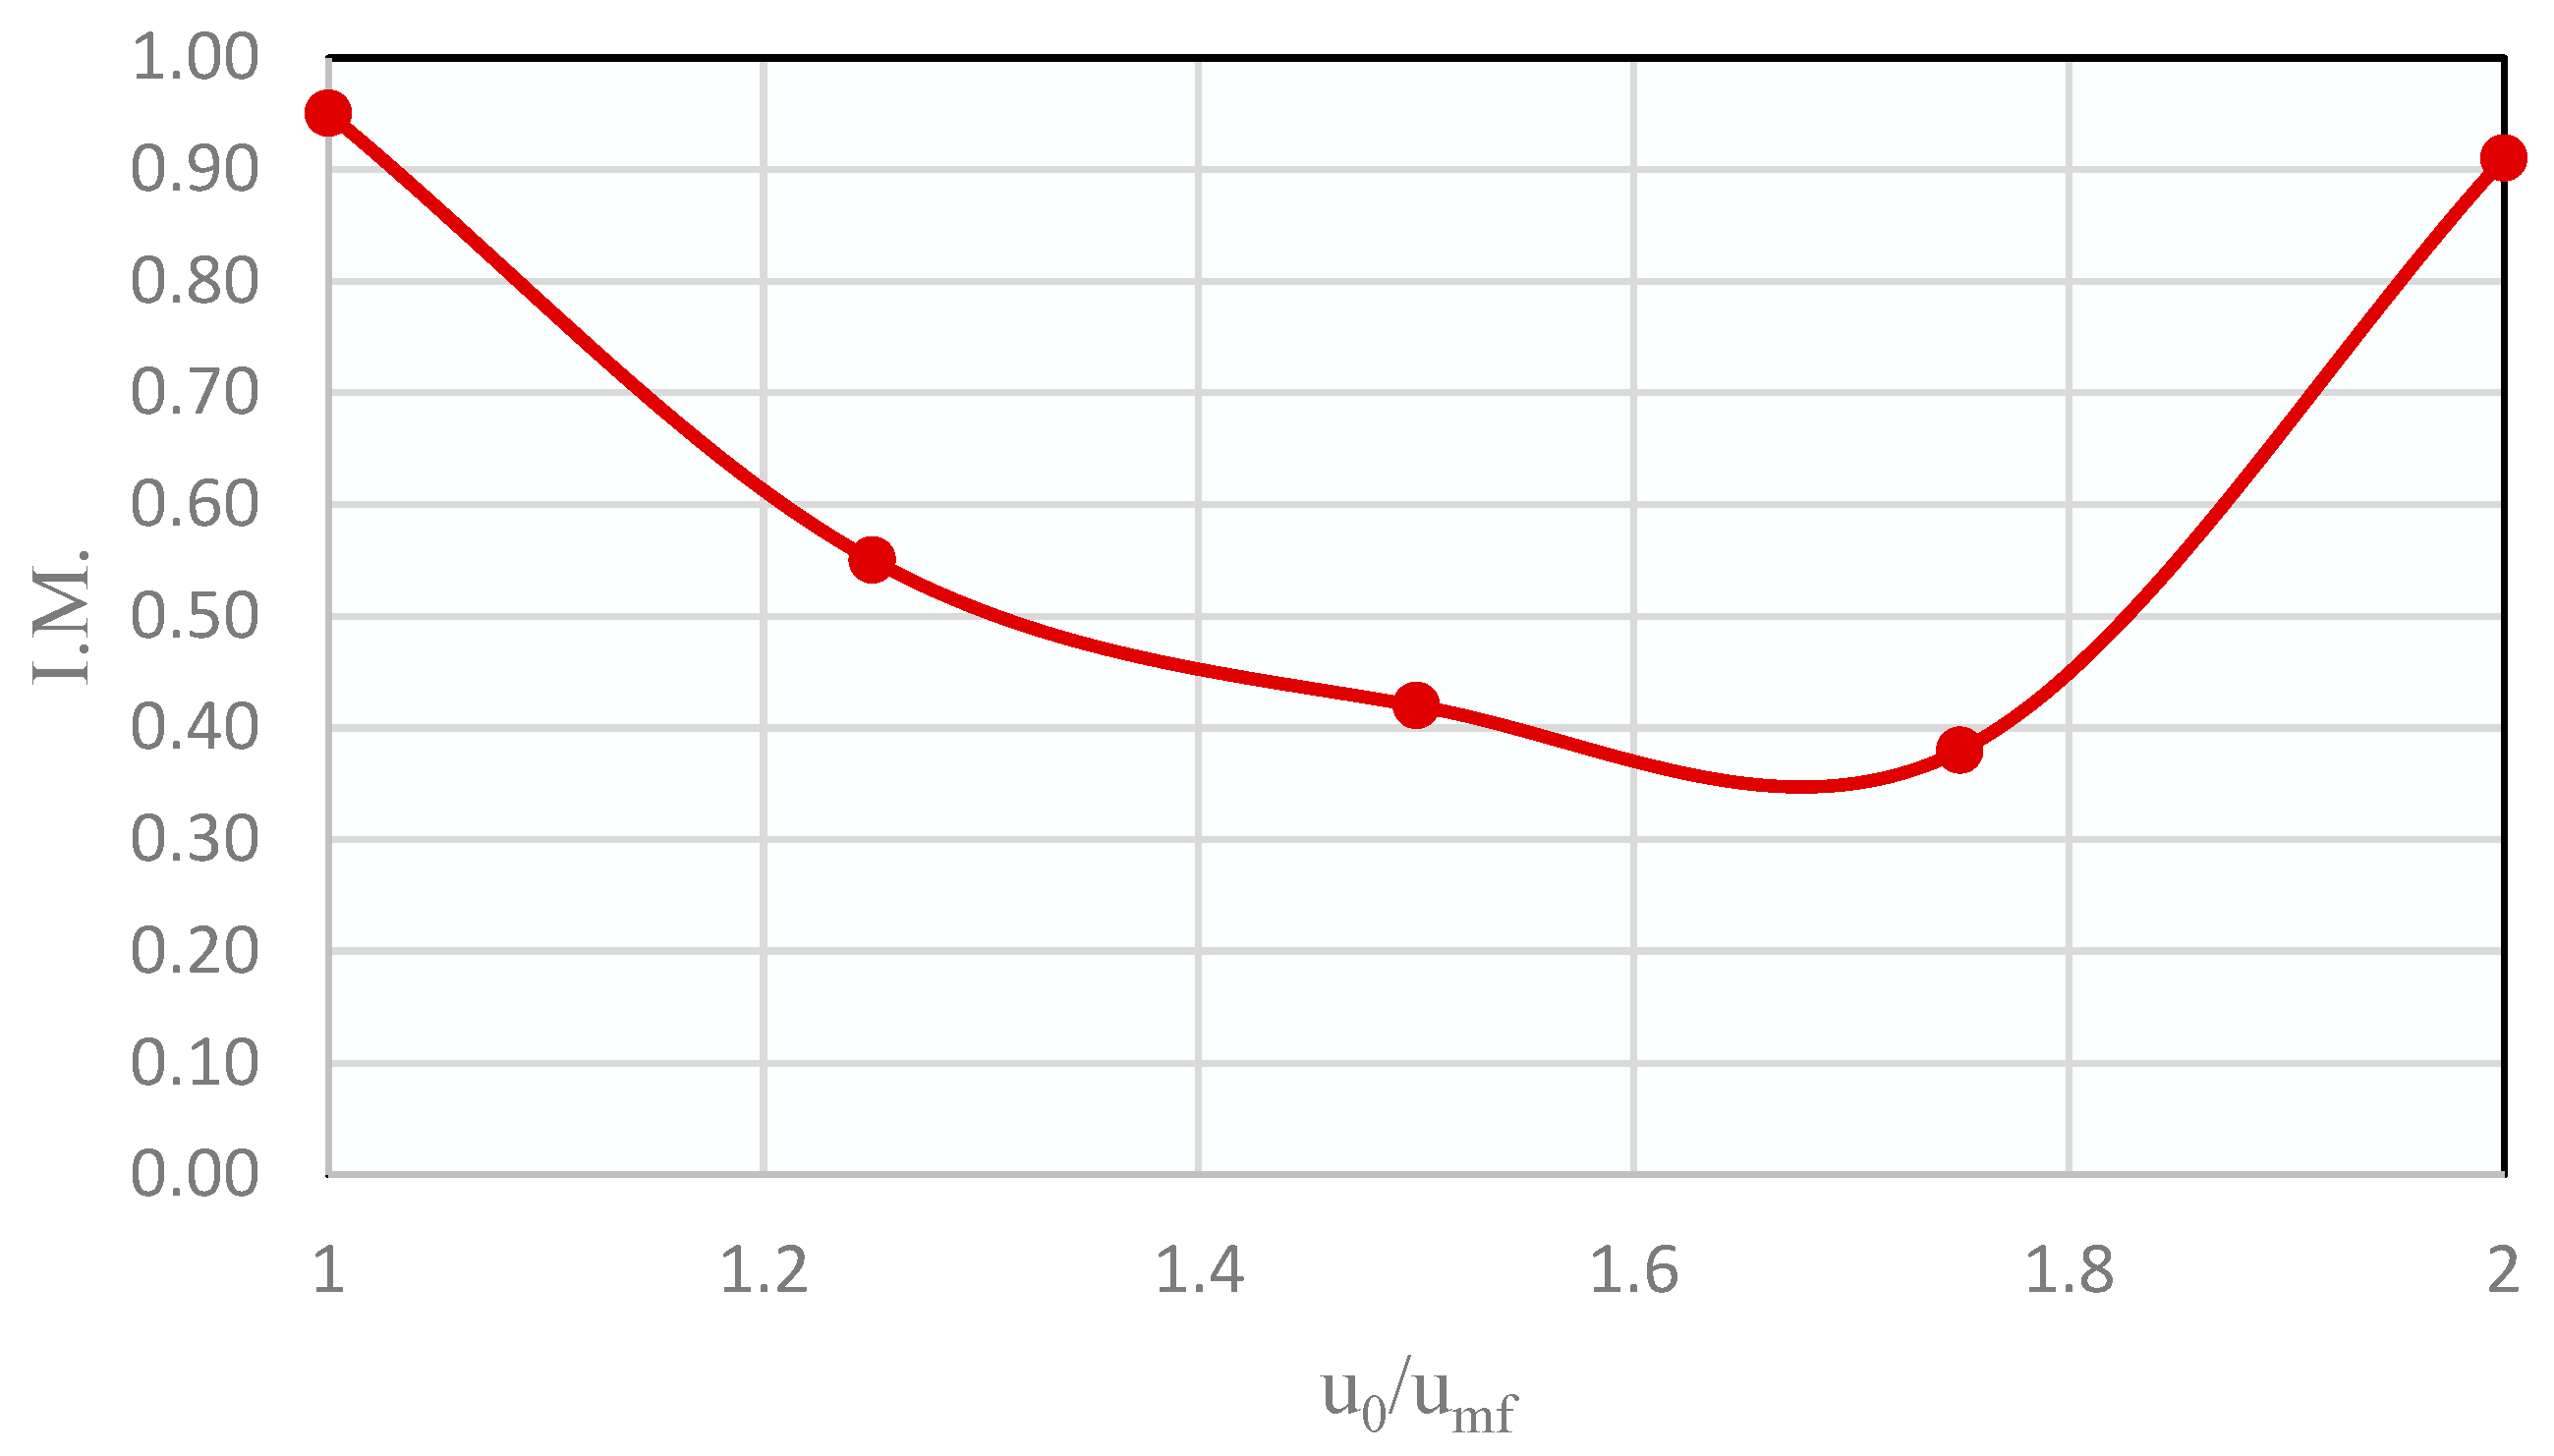
The plot of the mixing indices against u0/umf is shown in Figure 3. It can be seen that there was a minimum when working at a gas velocity around 1.75 times the umf of the solids mixture, i.e., at those conditions the segregation will be maximum. Therefore, the following segregation tests were made with this u0/umf ratio.
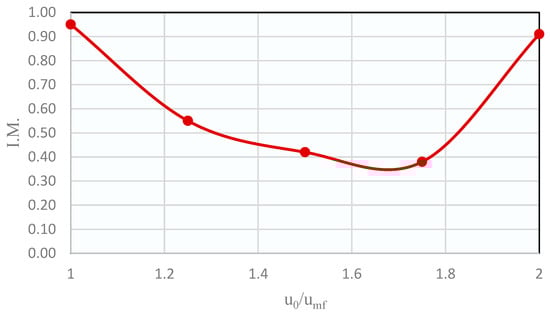
Figure 3.
Distribution of mixing indices obtained in the binary bed segregation experiments with a 50 vol% CZA–50 vol% SiOLITE®.
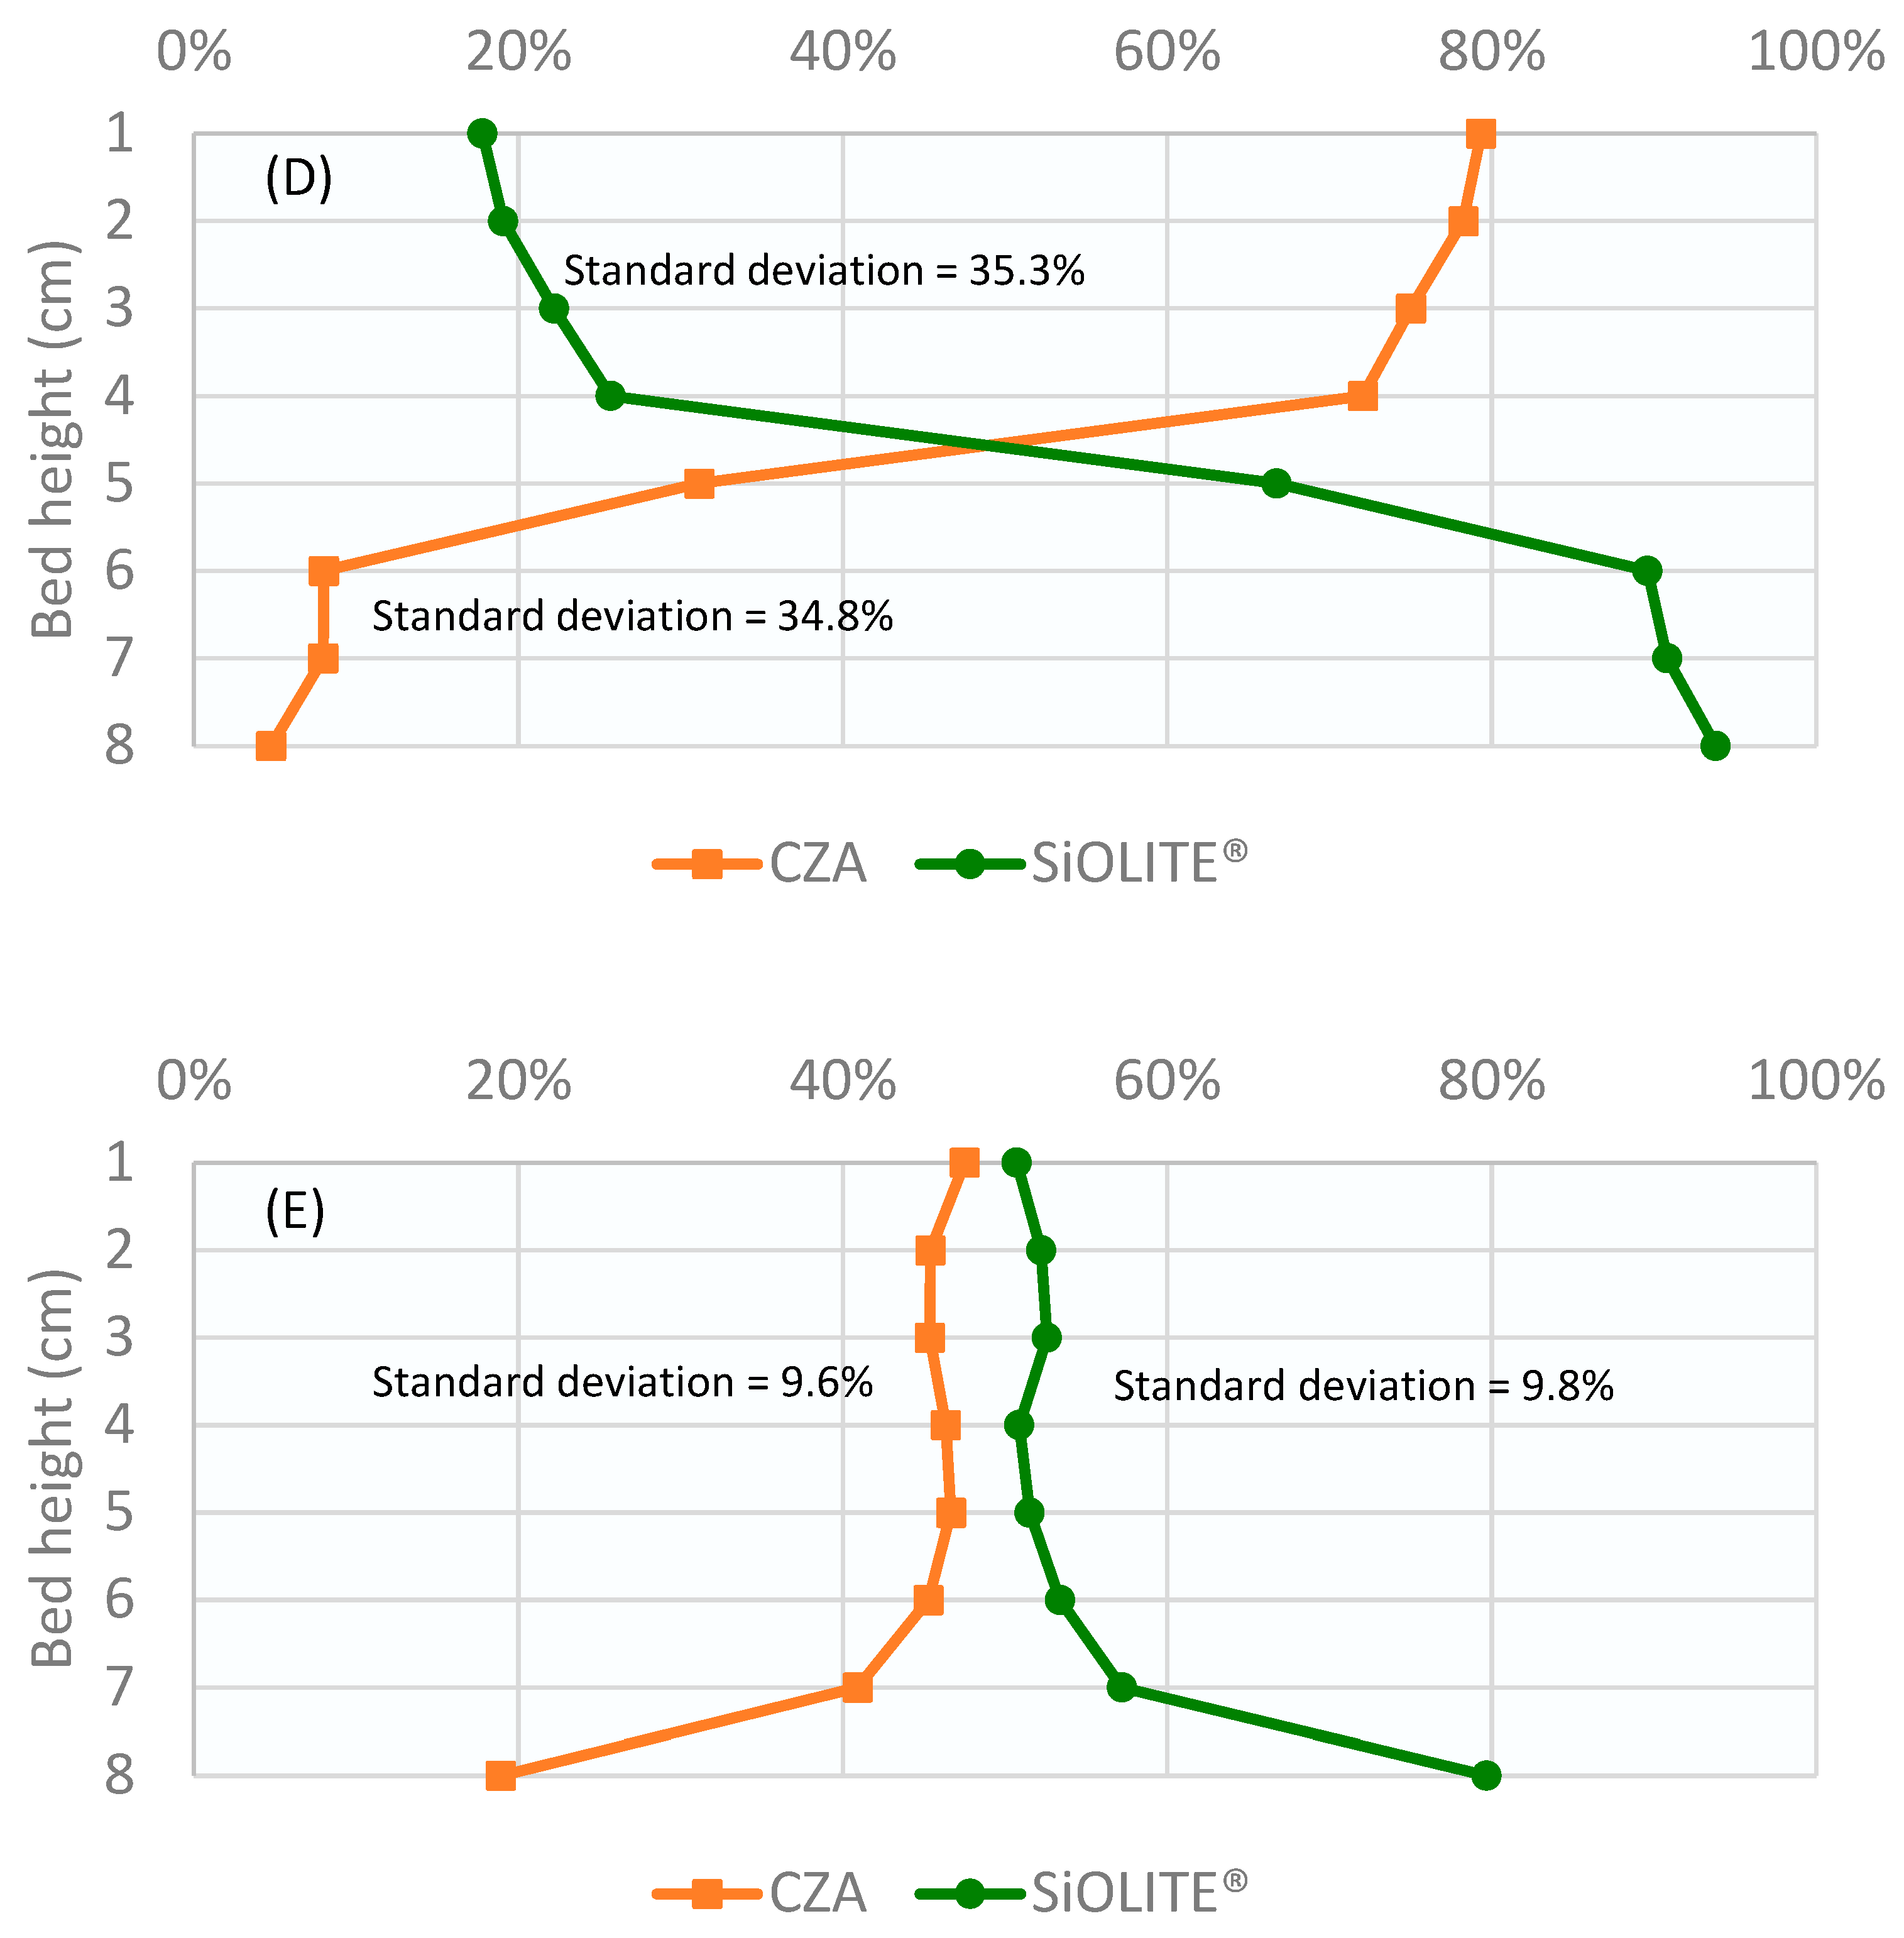
Subsequently, tests were carried out to check the variations in the mixing index with the fraction of each solid in the bed: CZA: SiOLITE® with a vol% proportion of 50:50 (44:56 wt%); CZA: SiOLITE® with a vol% proportion of 30:70 (23:77 wt%); and CZA: SiOLITE® with a vol% proportion of 70:30 (69:31 wt%). Results are shown in Table 2.
Table 2.
Results of binary bed segregation tests with bed composition variations.
The corresponding bed profiles are shown in Figure 4. The percentage of each solid obtained from the sieving analysis is represented against the bed height divided into sections. Because the 30% CZA–70% SiOLITE® bed produced the best segregation result, we decided to use this proportion for the study of the continuous system.
Figure 4.
Percentage of both solids vs height of the bed for u0/umf = 1.75 and different CZA: SiOLITE® vol% proportions: (A) 50:50, (B) 30:70, and (C) 70:30. Lines are only for visual guidance.
2.2. Tests with Continuous Sorbent Addition
A series of experiments were carried out in a fluidized bed reactor system with a binary mixture of solids (catalyst and sorbent). These experiments consisted of loading the bed and operating it with the optimal conditions studied (bed 30 vol% CZA–70 vol% SiOLITE® and nitrogen flow 1181 mL/min) and studying how the sorbent feed rate affected the loss of the catalyst through the outlet jetsam solids stream (Figure 5). The sorbent was fed at the top of the bed, constituting the inlet jetsam solids stream (Figure 5), with the Lambda doser solids dispenser. In the first experiment, a high amount of catalyst was lost with the sorbent, and we found that this was due to some gas leaving the bed through the lateral outlet of the reactor. It was found that around 21% of the gas flow was lost, thus reducing the amount of gas that effectively fluidized the solids, therefore causing it to operate in conditions below the optimal ones for a good segregation. For this reason, the flow rate was readjusted to a value of q0 = 1429 mL/min.

Figure 5.
Scheme of the system where tests with continuous sorbent addition are carried out.
Experiments were carried out for 1 h, taking samples of the solids that left the system every 10 min to analyze the amount of catalyst that was lost in the process. The amounts of solids used in the development of these tests were 12.3 g of CZA and 38.4 g of SiOLITE®. Most of the sorbent was removed from the “jetsam” zone, while new sorbent was simultaneously introduced from the top of the reactor, maintaining the segregation of the solids.
The results shown in Table 3 were obtained. It may be concluded that the percentage of catalyst in the lateral exit was quite small, less than 0.6% in all cases and less than 0.1% in the best experimental conditions. Therefore, the segregation allowed us to obtain an almost pure stream of sorbent at the reactor exit.
Table 3.
Results obtained in tests with the continuous addition of sorbent.
2.3. Simulation
To verify the effectiveness of our system with the selective addition/removal of sorbent, a simulation was carried out using the MATLAB program, according to a model based on plug flow for the gases and for the sorbent and using the kinetic equations and the adsorption isotherm employed in the simulation of a transient operation of a SER by Maksimov et al. [15].
CO + 2 H2 ⇄ CH3OH ΔH298 K = −90.7 kJ/mol CO (R1)
CO2 + H2 ⇄ CO + H2O ΔH298 K = 41.2 kJ/mol CO2 (R2)
CO2 + 3 H2 ⇄ CH3OH + H2O ΔH298 K = −49.5 kJ/mol CO2 (R3)
The reaction rates were calculated according to Equations (2)–(4).
The mathematical model of the reactor was described with the Equations (5)–(7), which assume the plug flow for the gases and the sorbent. The isothermal operation was also assumed.
Mass balance for the component i ≠ H2O:
Mass balance for H2O:
Mass balance for the sorbent:
Finally, the Langmuir-type isotherm that describes the adsorption of water (8) was also considered.
Simulations were carried out, with the parameters summarized in Table 4. Gas hour space velocity (GHSV) was calculated with the catalyst bed (not including the volume occupied by the sorbent).
Table 4.
Operating conditions considered for the simulation.
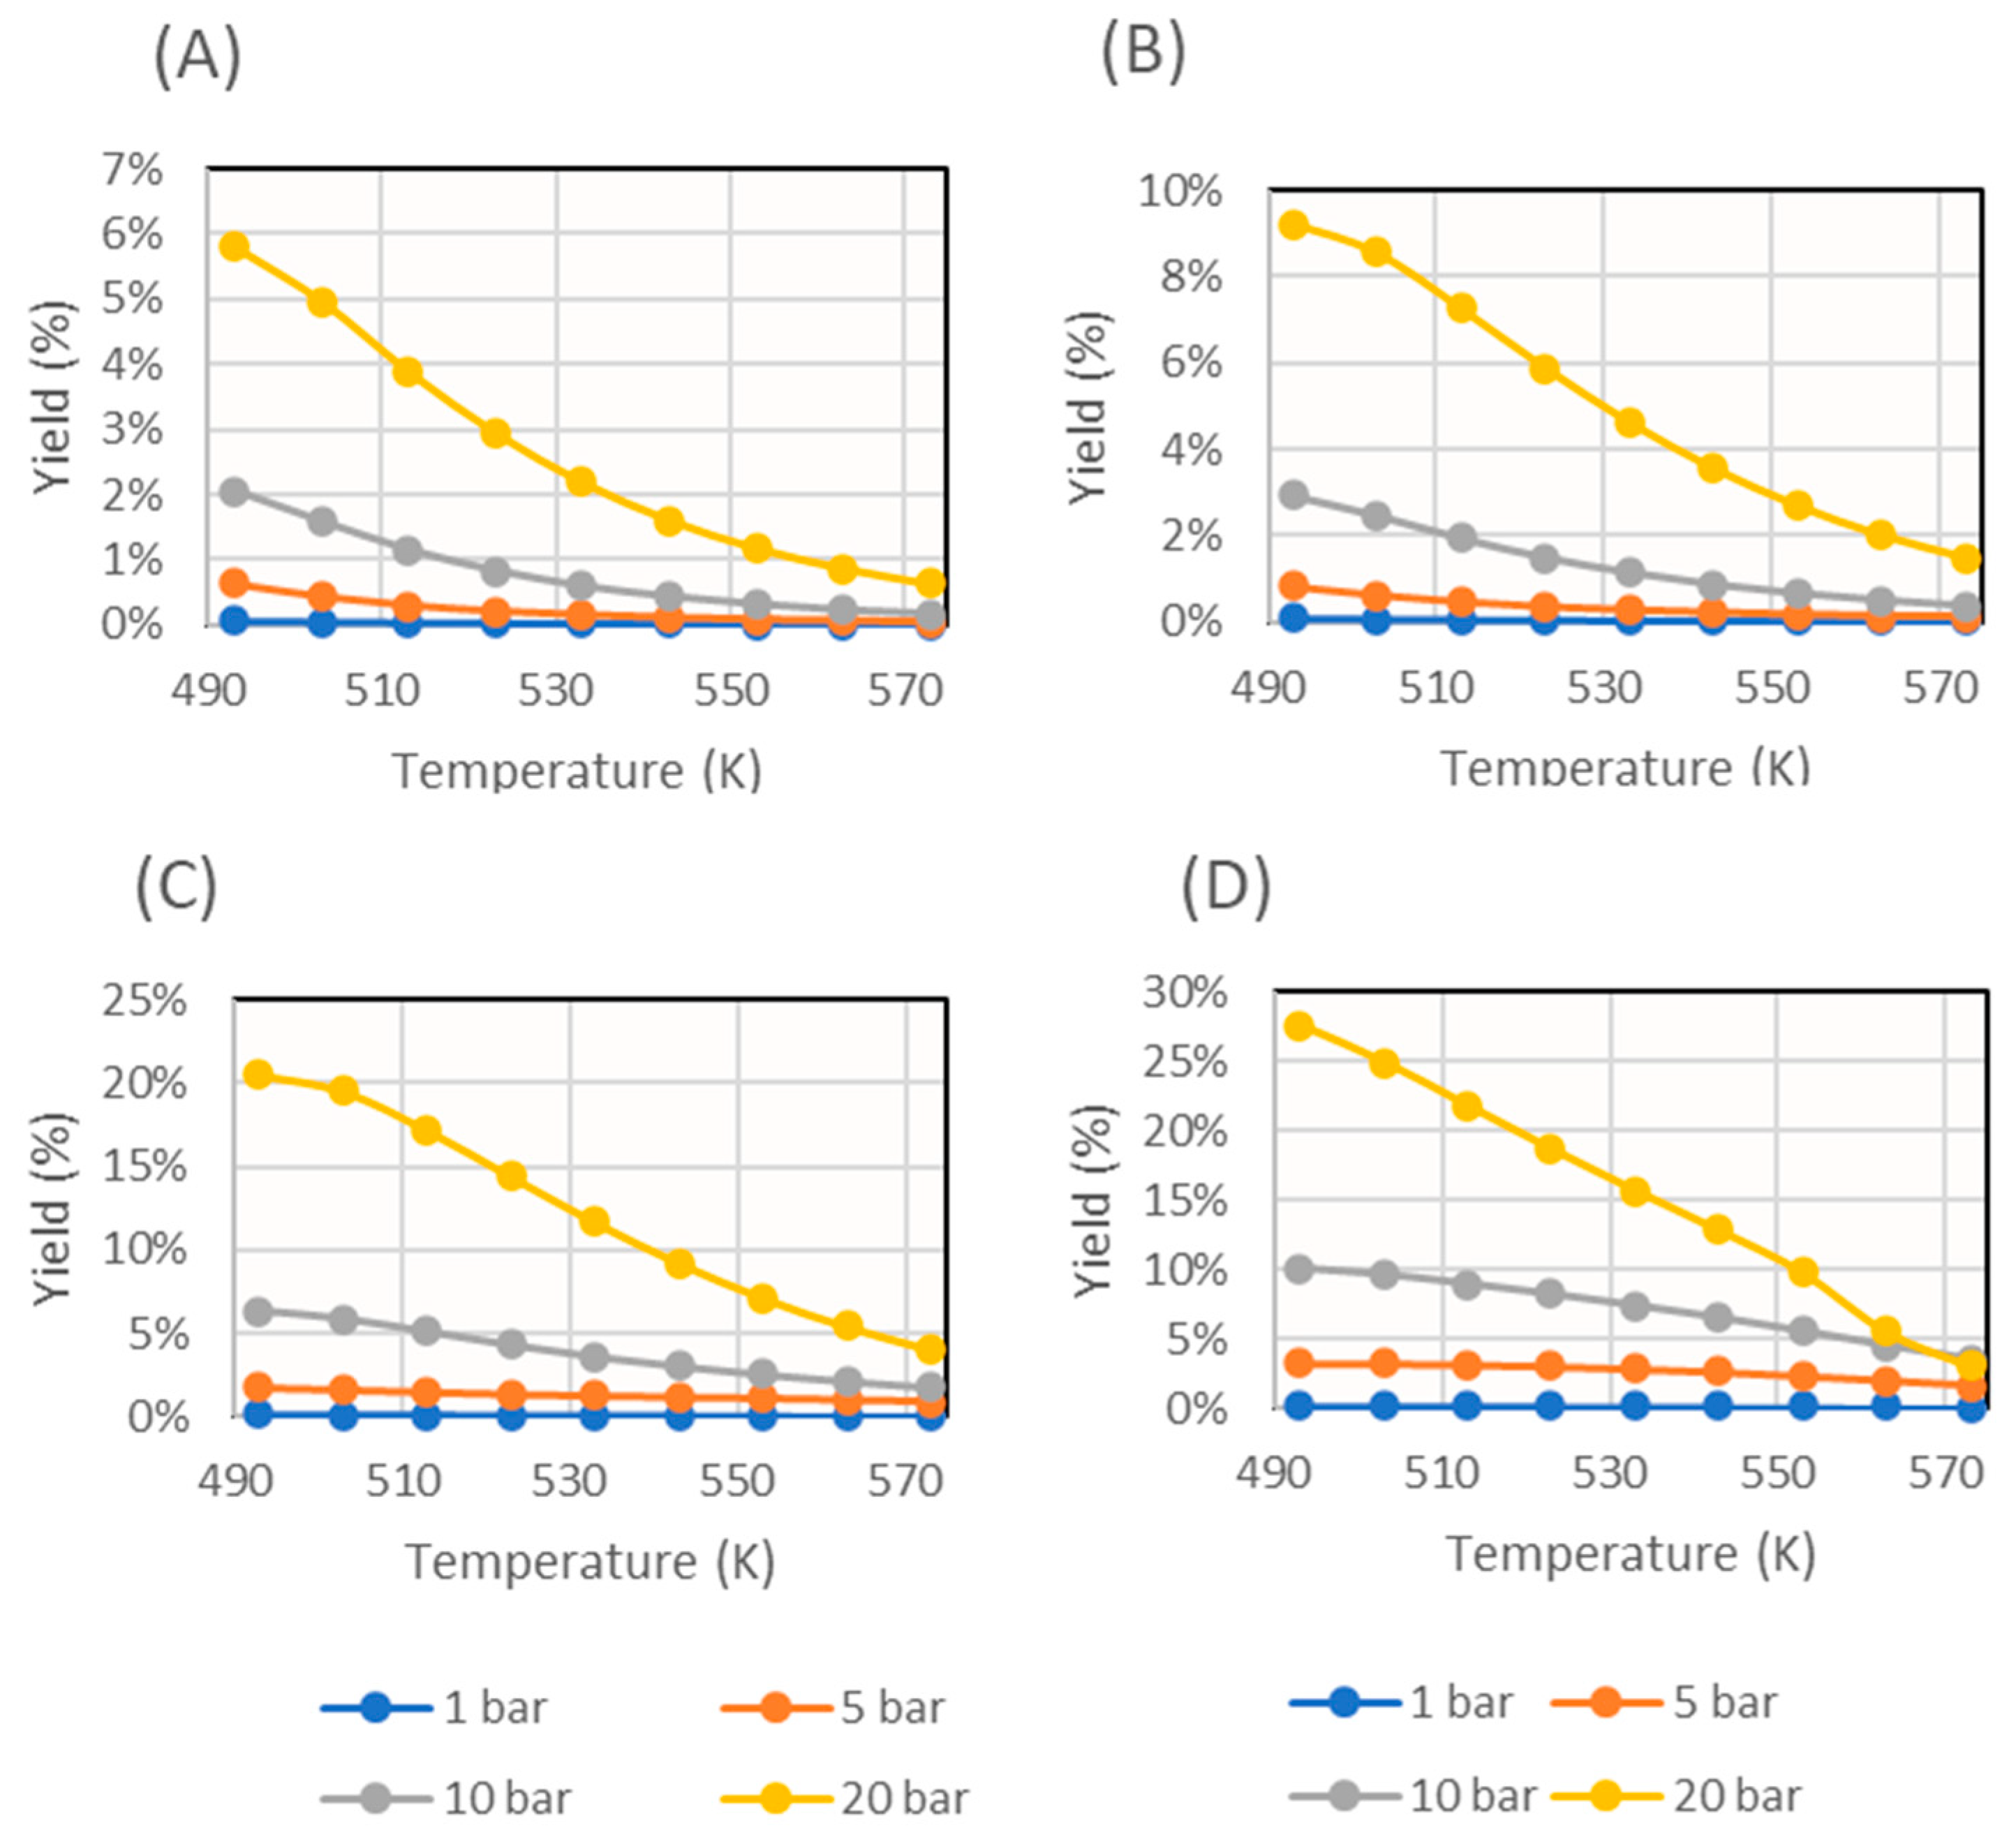
First, a simulation without sorbent feed was run. The results obtained are presented in Figure 6. Analogously, the graphs with different sorbent feed rates are shown in Figure 7.
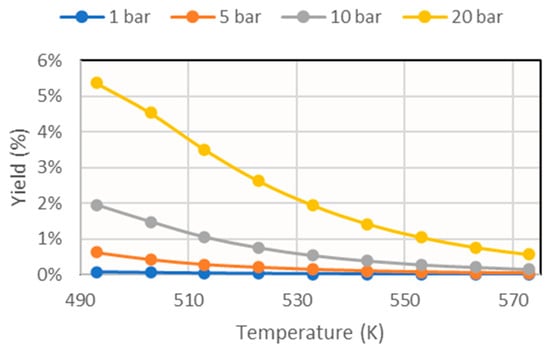
Figure 6.
Methanol yield for different operating pressures obtained in the simulation without considering the addition of sorbent.
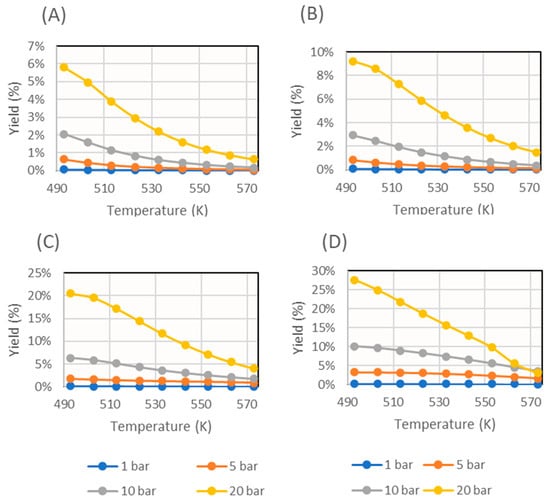
Figure 7.
Methanol yield obtained for several operating pressures in the simulation with several sorbent feed rates (expressed as sorbent feed rate/catalyst mass): (A) 10−1 min−1, (B) 100 min−1, (C) 101 min−1, and (D) 102 min−1.
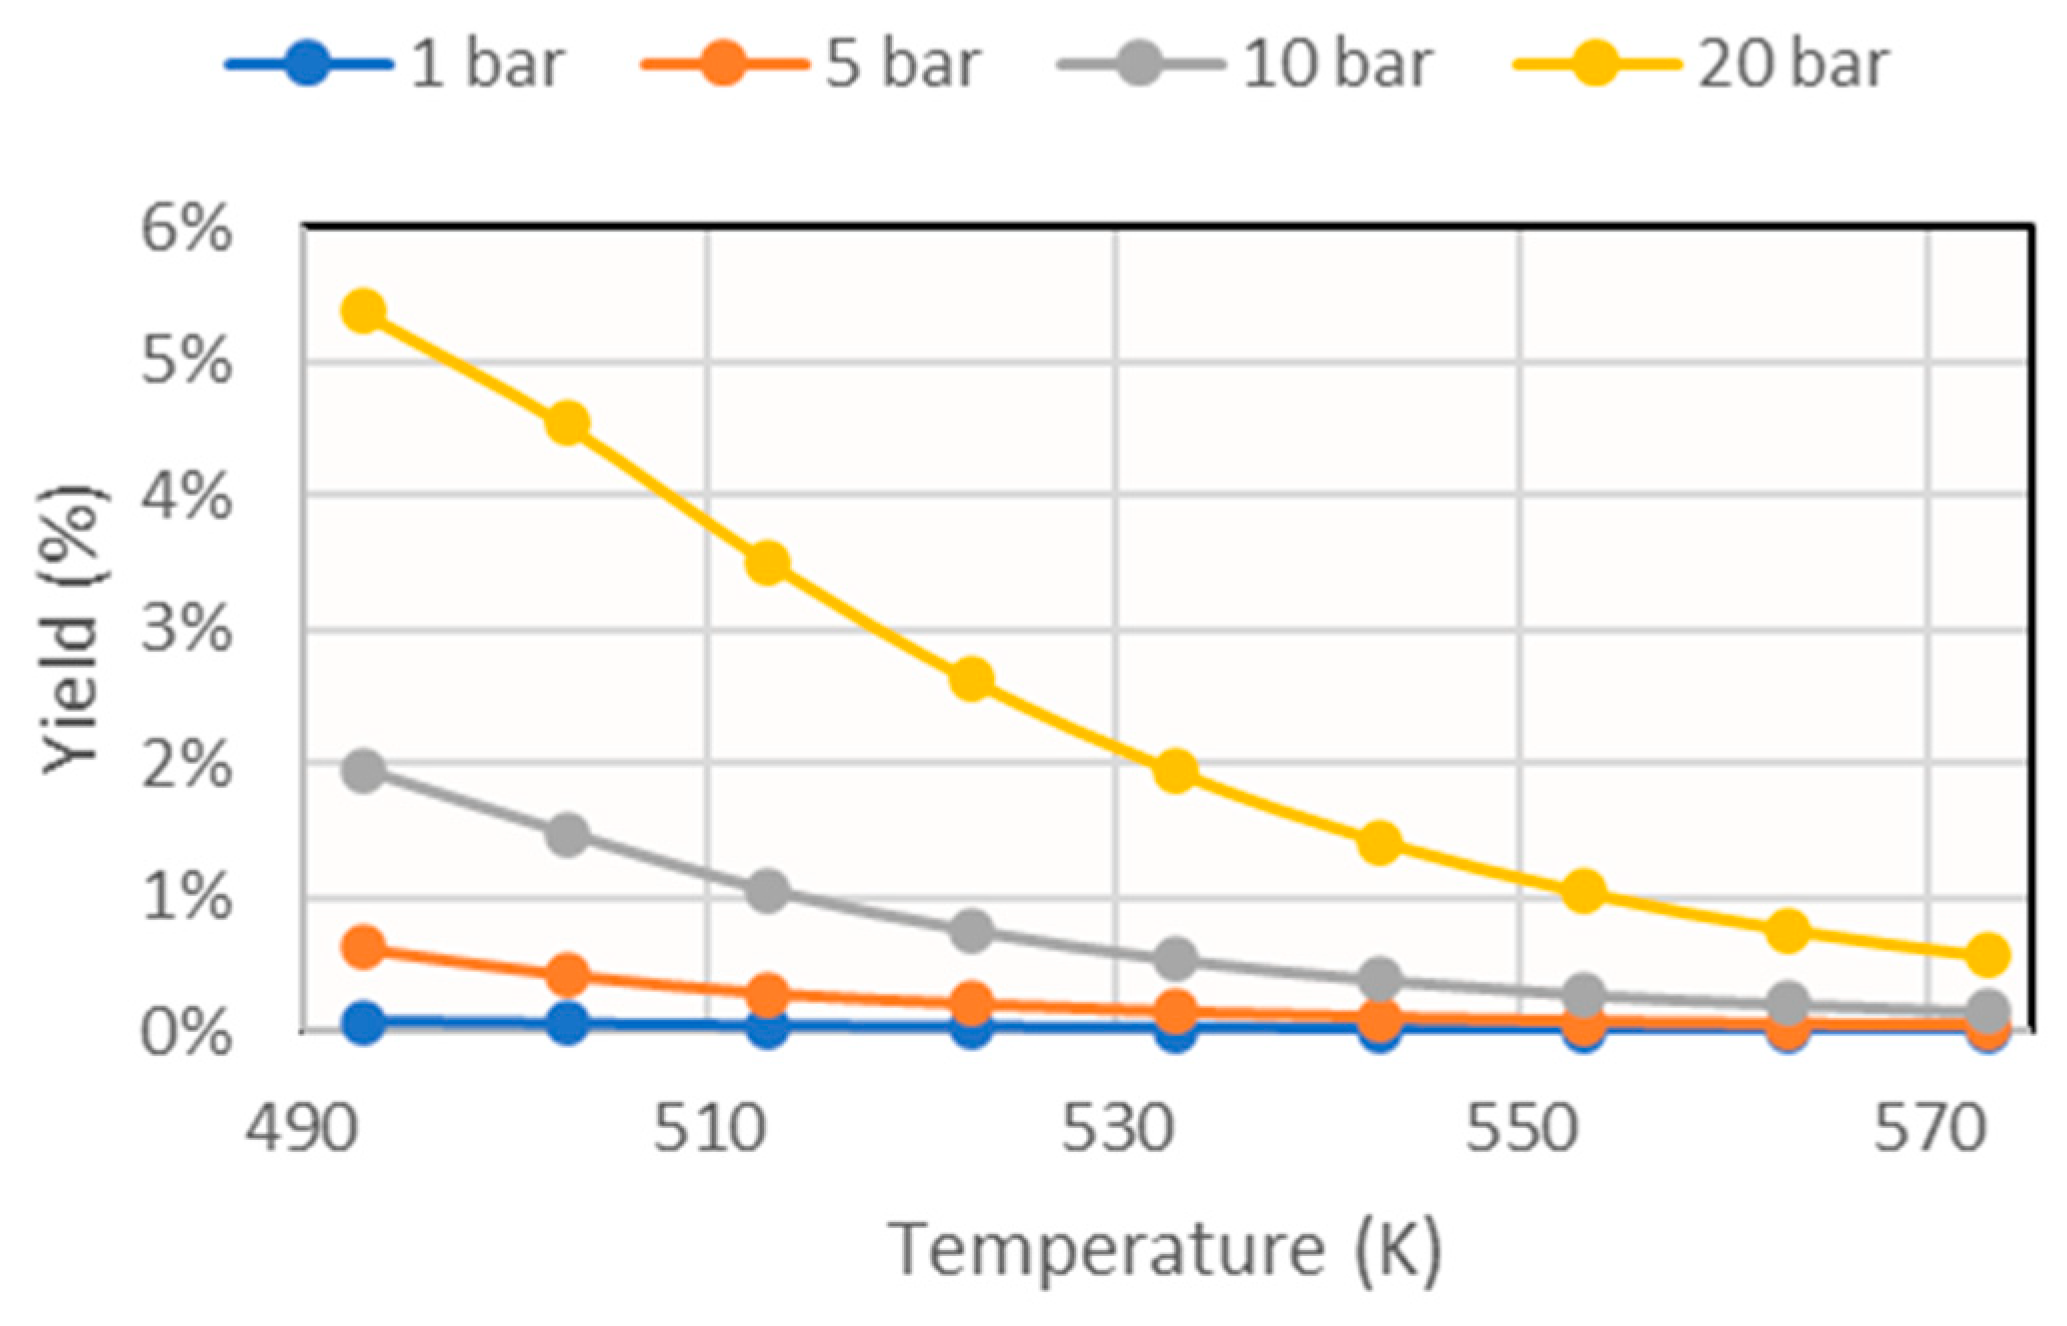
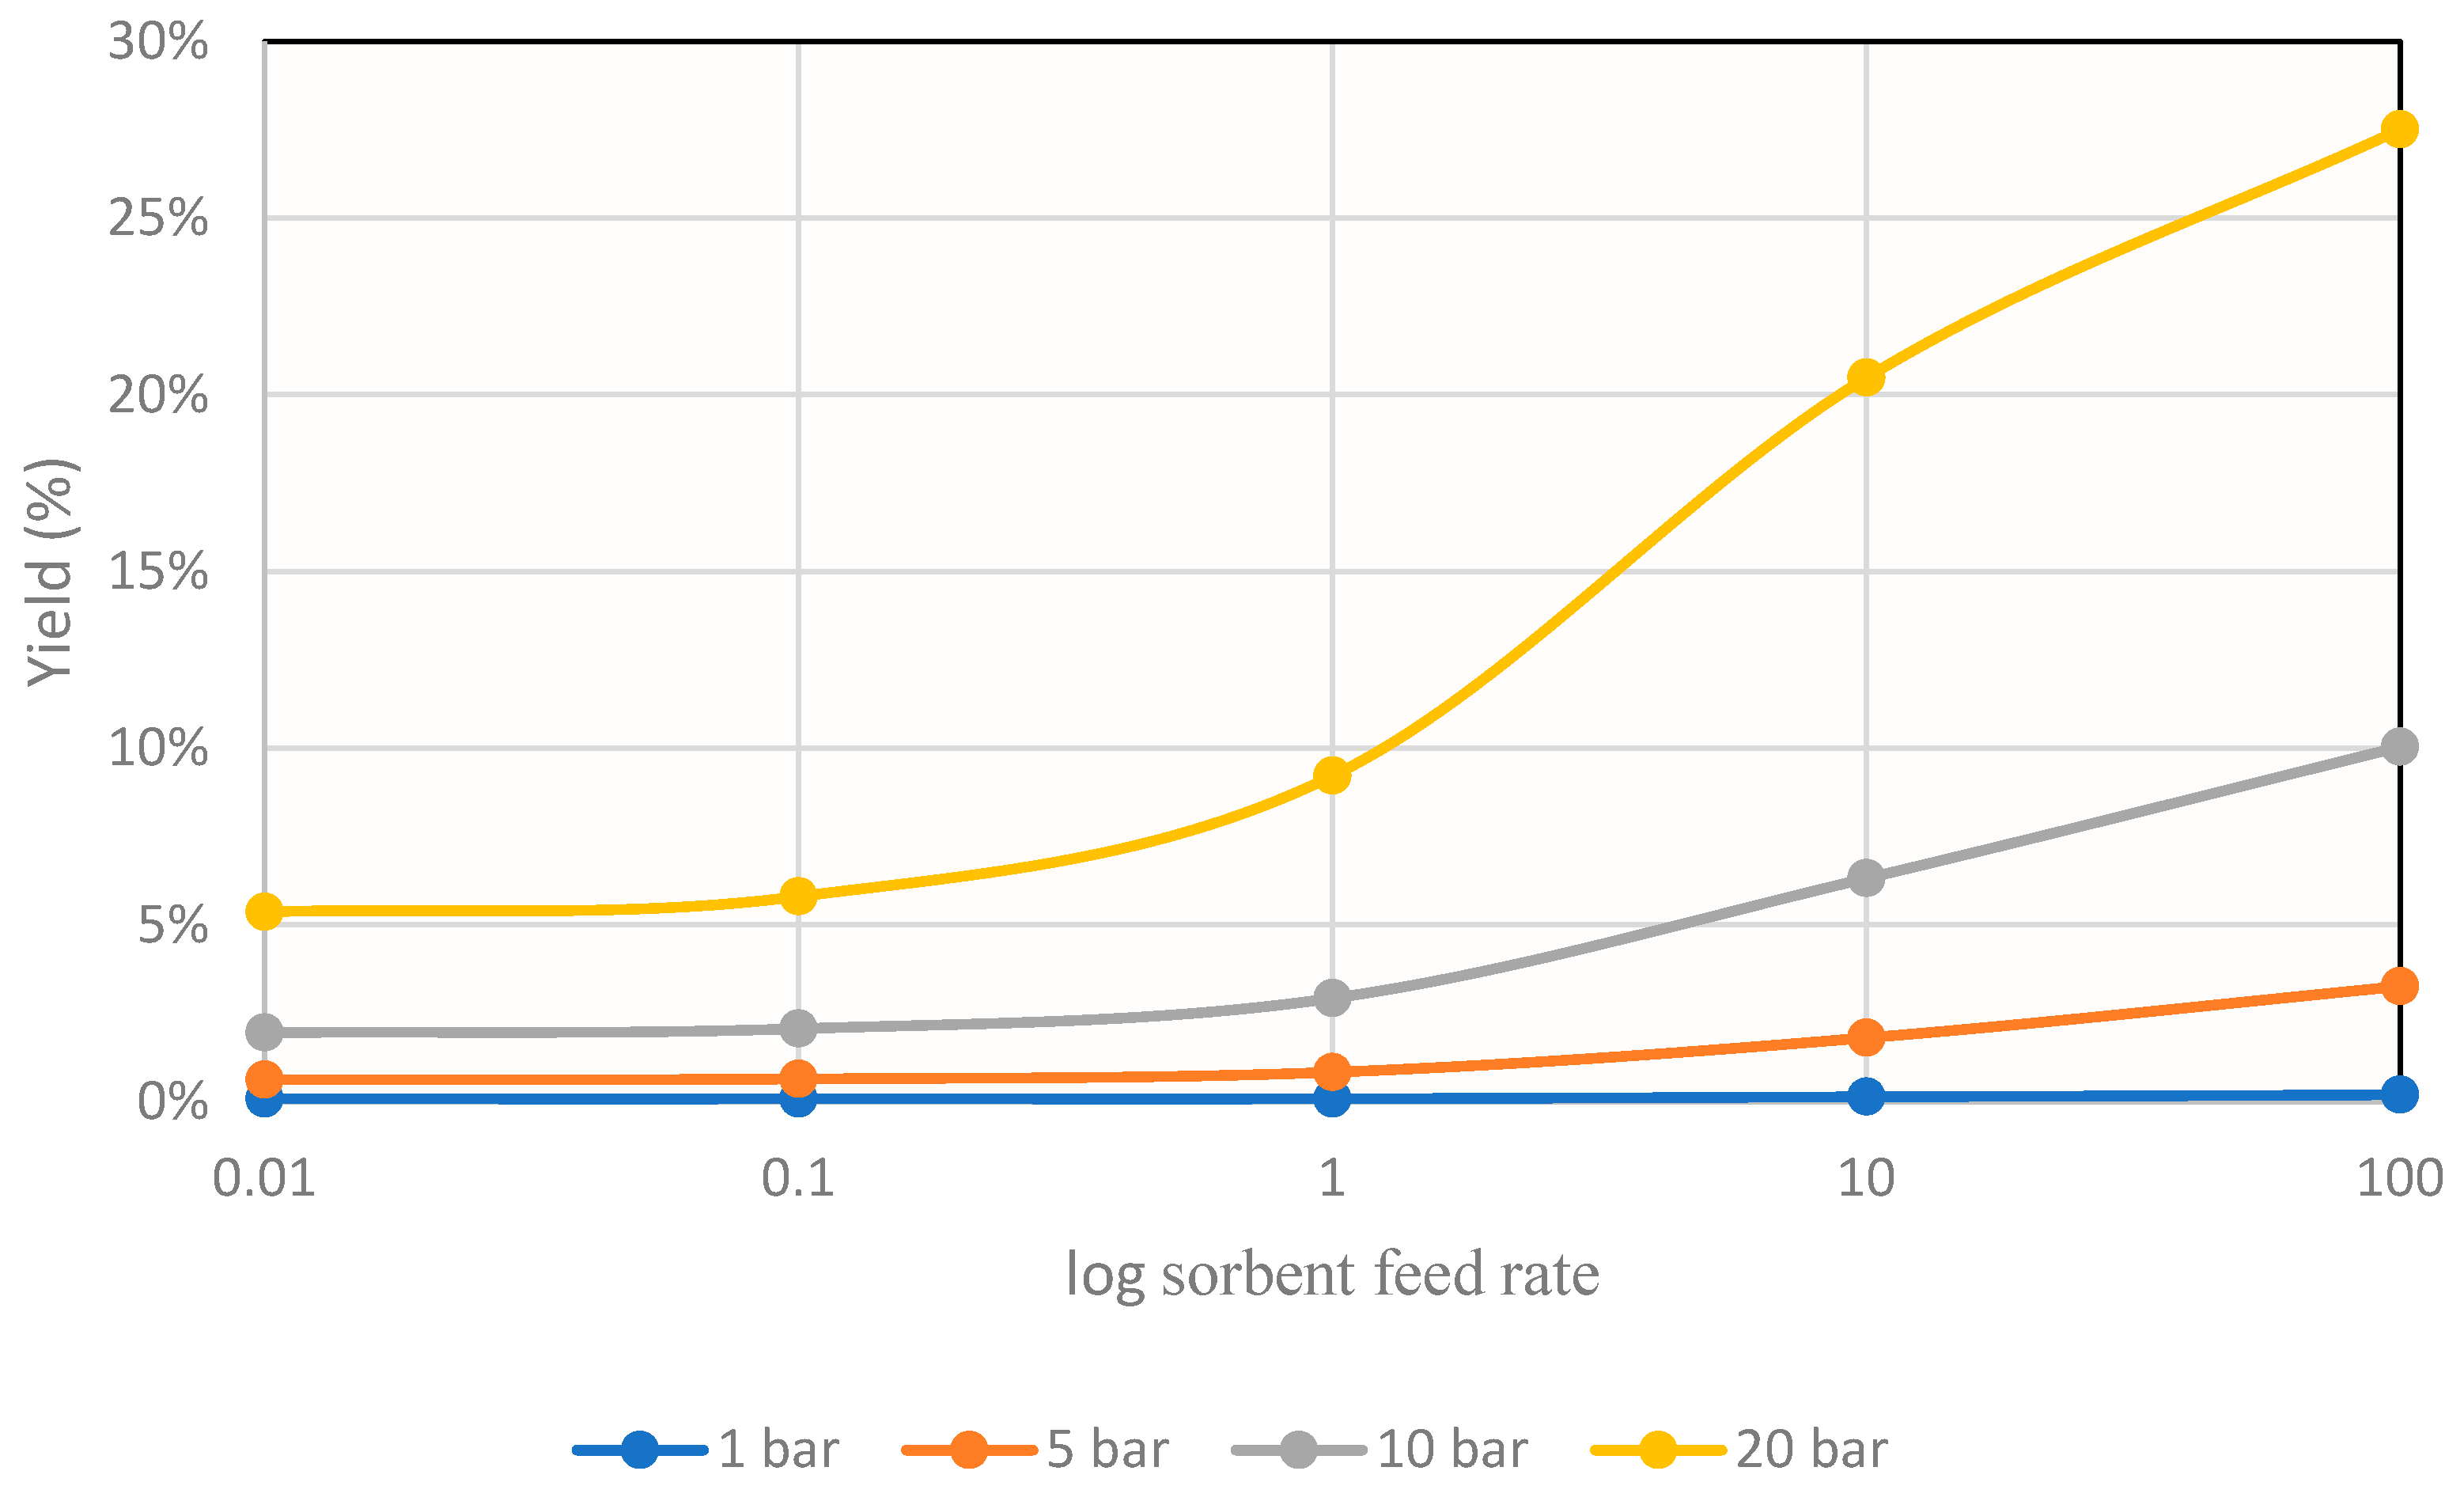
From these results, it can be seen that the reaction depended strongly on thermodynamics, since increasing the temperature considerably decreased its conversion. For this reason, to study the effect of sorbent addition, the temperature 493 K was taken as reference, and the graph shown in Figure 8 was obtained.
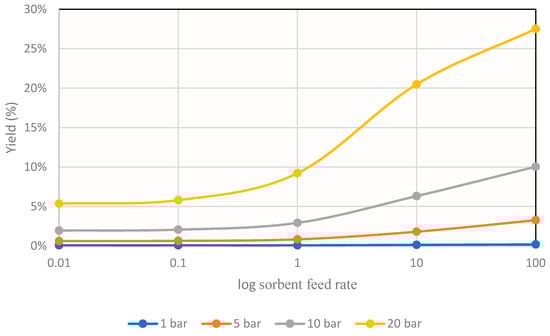
Figure 8.
Methanol yields obtained for different operating pressures in the simulation at 493K at different sorbent feeds.
These results mark the same trends as those obtained in other investigations [15].
3. Experimental
3.1. Experimental System
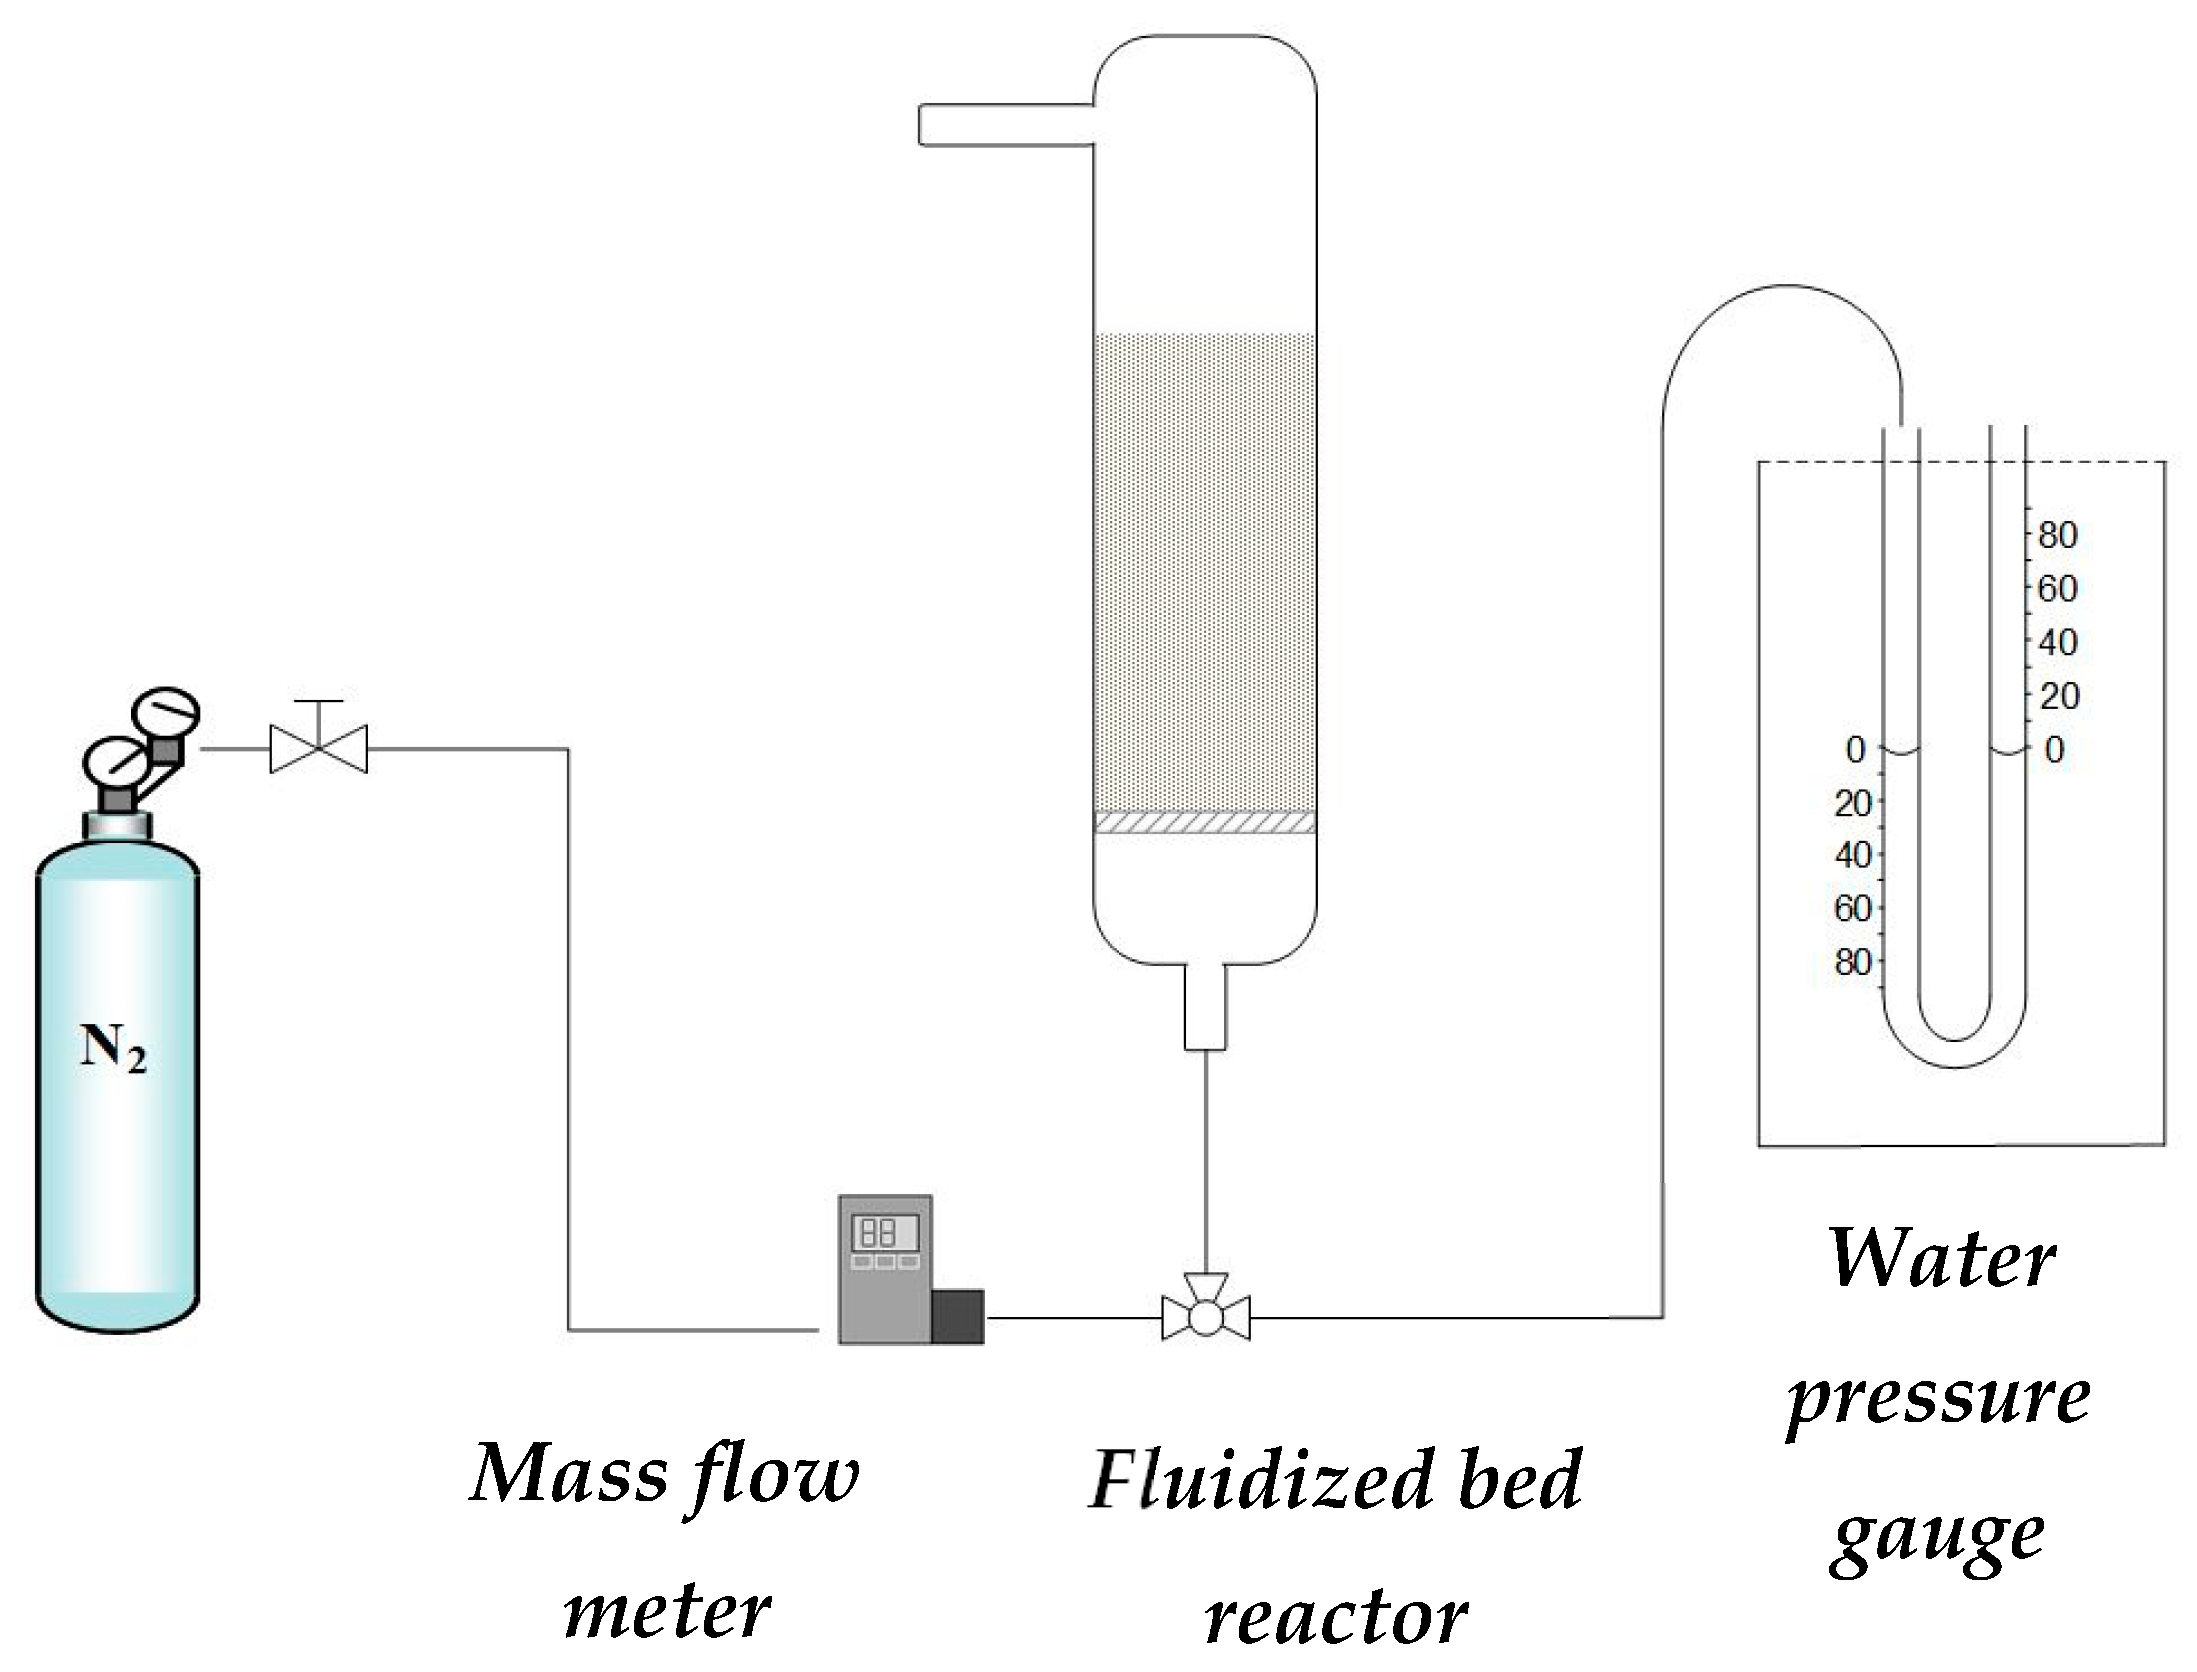
The fluidization and segregation experiments were carried out in a system that consisted of a fluidized bed reactor in which individual solids or binary mixtures, the catalyst for methanol synthesis (CZA), and the sorbent capable of adsorbing water (SIOLITE®, could be studied (Figure 9). The reactor was made of glass, with a height of 25 cm and a diameter of 3 cm, and at the bottom, there was a porous plate (40 microns pore size) on which the solid was placed. In the facility, nitrogen was fed with a mass flow controller. The pressure was measured in the system with a water pressure gauge to obtain the fluidization curve.
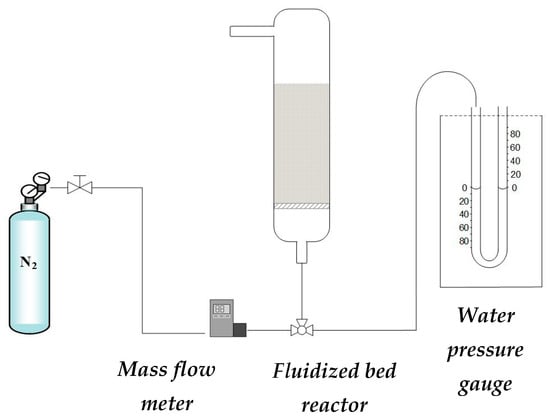
Figure 9.
Scheme of the experimental setup.
For tests with continuous sorbent addition, it was intended that the sorbent could be renewed continuously without the need to stop the process by using the excellent transport properties of the solids in a fluidized bed reactor. As described by Nienow and Chiba [22], when a binary mixture is fluidized, if the particle size or density of the two solids is different enough, the mixture will reach a steady state where segregation is achieved, with the lower part of the bed being rich in “jetsam” and the upper part being rich in “flotsam”.
These tests with a continuous sorbent addition were made in the same facility but using a different reactor (see Figure 5) that was made of glass, with a height of 25 cm and a diameter of 3 cm, and at the bottom, there was a porous plate (40 microns pore size) on which the solid was placed. Just above this plate, there was a tube that was 19 cm long and 1 cm in diameter, inclined at an angle of 40°, through which the solid was extracted. The solids dispenser was a Lambda doser model (LAMBDA Instruments GmbH, Baar, Switzerland). It had a capacity of 3 L and could add the solid at a speed of up to 13.7 g/min. The experiments carried out lasted one hour, and samples of the solids leaving the system were taken every 10 min to analyze the amount of catalyst being lost from the bed with this stream (outlet jetsam).
3.2. Solids Preparation
3.2.1. Catalyst Synthesis
A CuO/ZnO/Al2O3 (CZA) catalyst was used, since it provided good yields in the hydrogenation of CO2 to methanol. The catalyst was synthesized by the coprecipitation method, as described by Hong et al. [23], using the following reagents: (i) copper (ii) nitrate trihydrate EPR with a purity > 99% (Labkem, Dublin, Ireland), (iii) zinc nitrate hexahydrate EPR with a purity > 98% (Labkem), and (iv) aluminum nitrate nonahydrate with a purity > 98% (Sigma-Aldrich, St. Louis, MO, USA). A 1 M solution was prepared, consisting of the three nitrates in a molar ratio of 45% Cu(NO3)2, 45% Zn(NO3)2, and 10% Al(NO3)3. Coprecipitation was carried out at pH = 8, controlled by adding a 1 M Na2CO3 solution.
Once the coprecipitation of the carbonates was completed, the solution was allowed to mature for 30 min. Subsequently, it was washed with distilled water at 70 °C to eliminate non-precipitated reagents and carbonate. As described by Llorente et al. [24], it was washed with a quantity of water of 300 mL/g, precipitated in a 700 mL batch every 15 min. To check the effectiveness of the washings, the conductivity of the mother liquor of each of the filtrations was measured, where a considerable decrease of more than three orders of magnitude was observed.
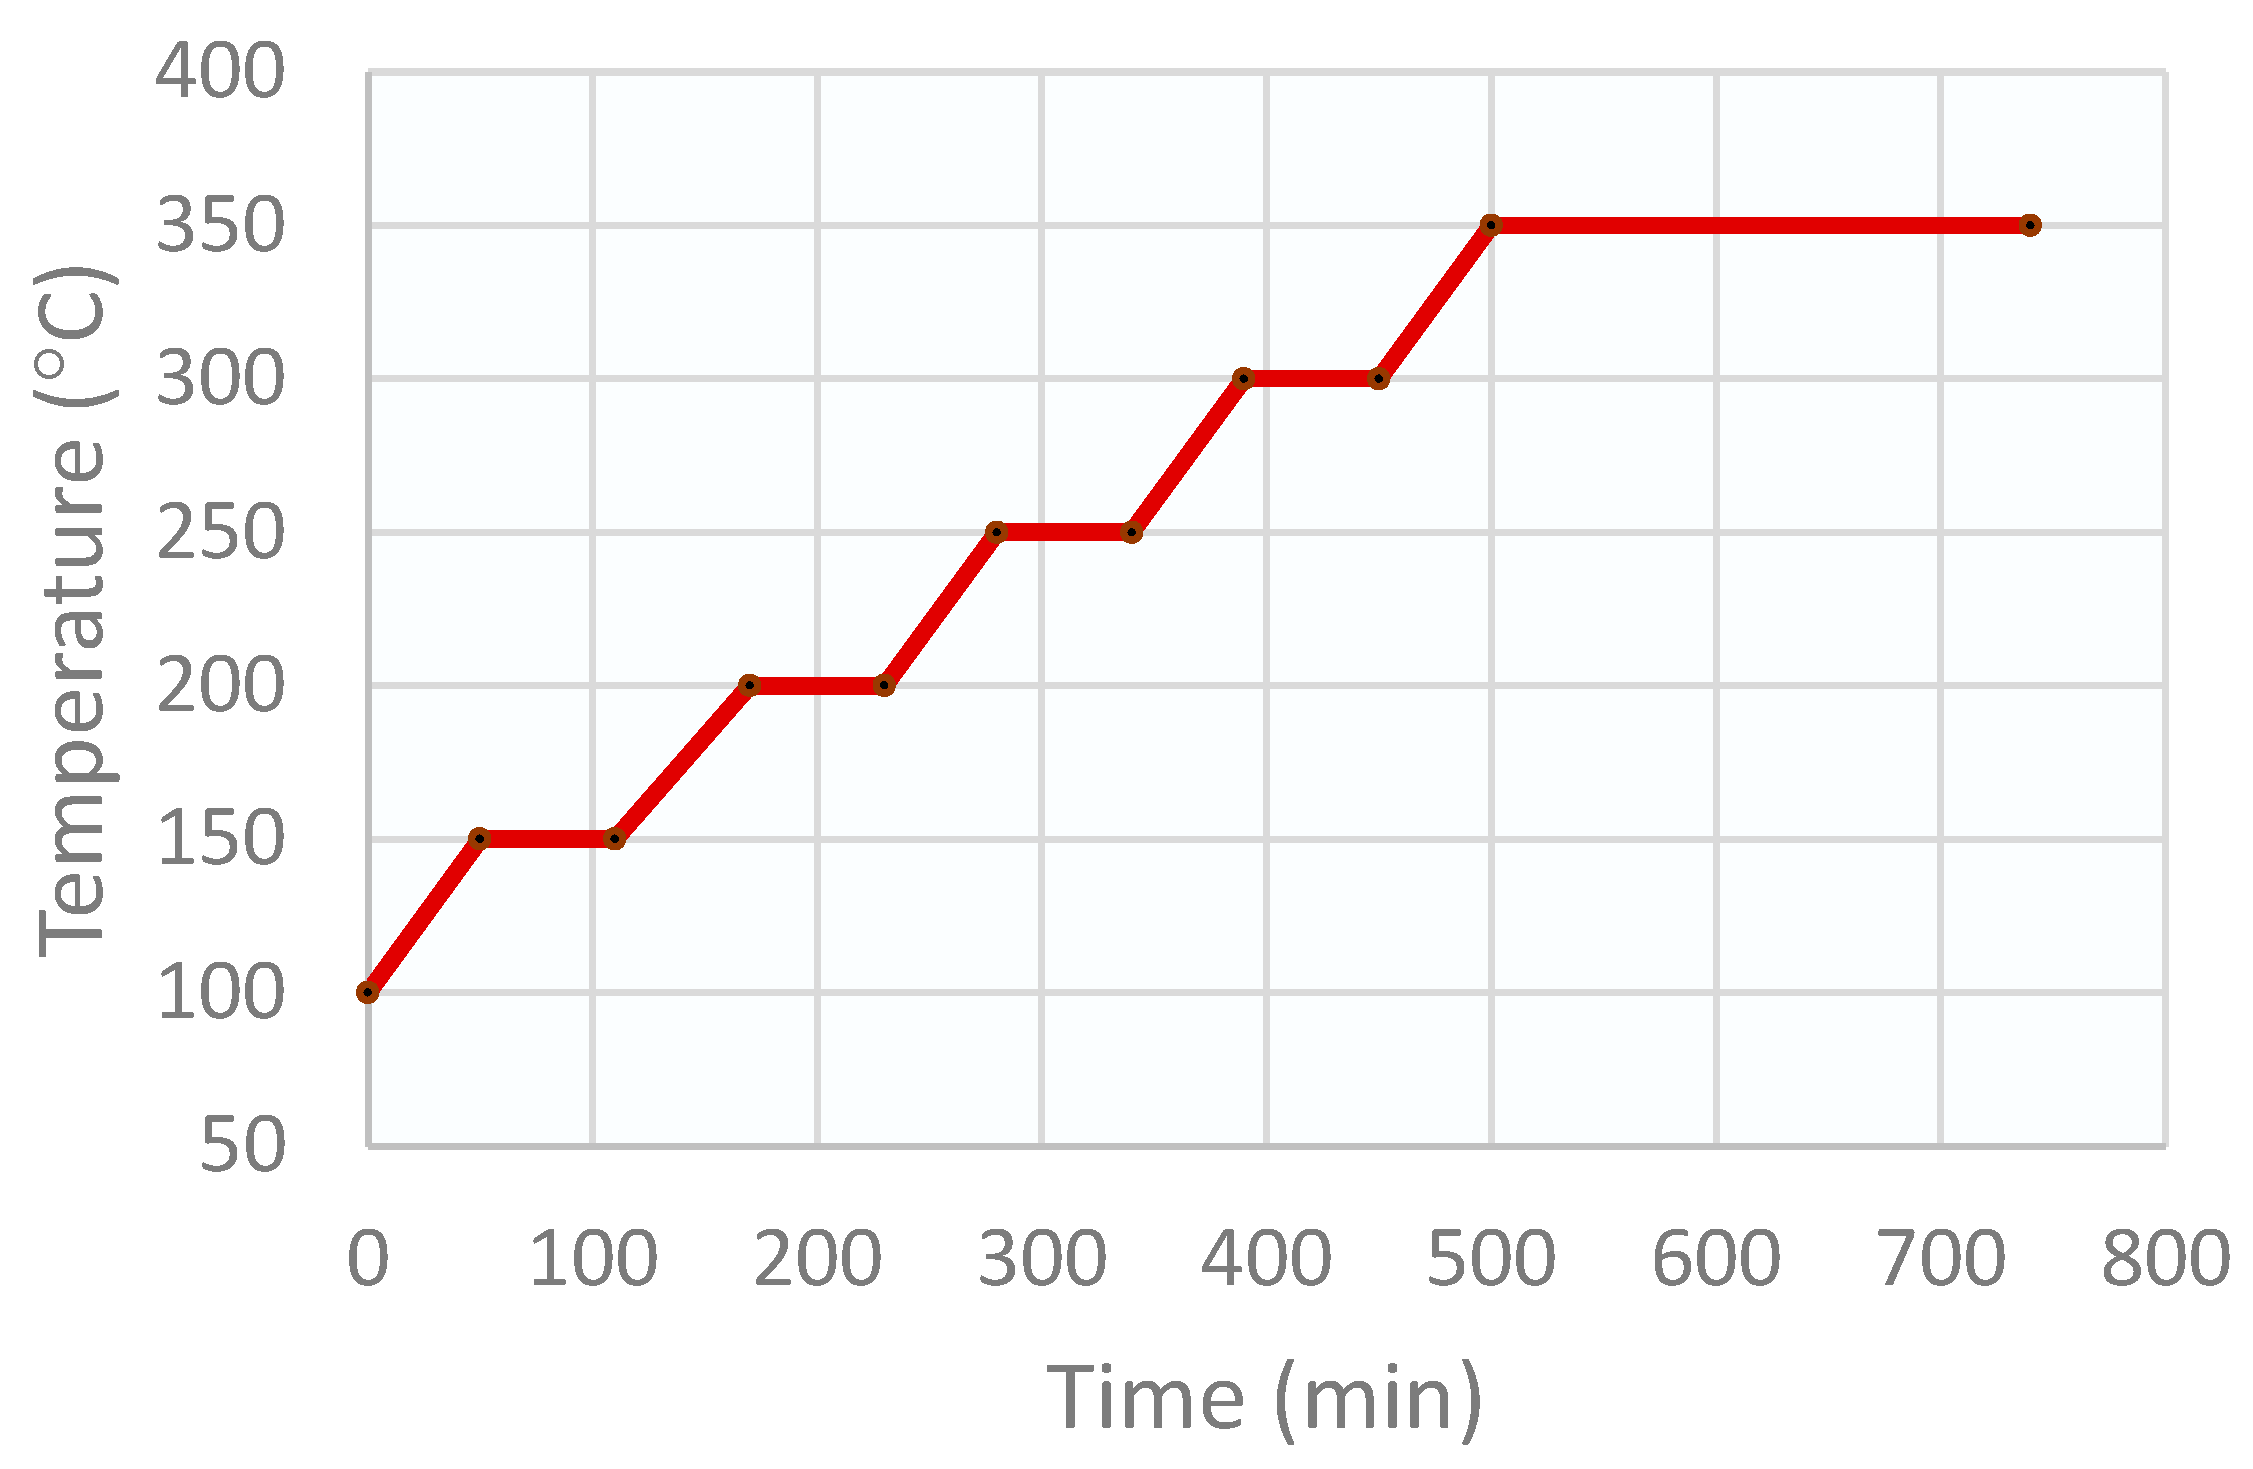
To eliminate the carbonates and to obtain the oxides, the precipitate was dried and calcined. This process was carried out in a muffle, which was programmed for a drying stage of 12 h at 100 °C, followed by the catalyst calcination program in several stages, as shown in Figure 10. A ramp of 5 °C/min was used for the drying stage, and a ramp of 1 °C/min was used for the calcination stages.
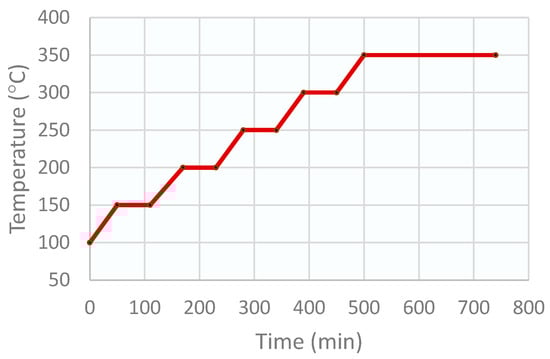
Figure 10.
Stages of the CZA catalyst calcination program.
Once the catalyst was calcined, it was sieved to obtain the particle size that was used in this work (75–150 μm). Because the yield of particles of the desired size was very small (<7%), an intermediate stage of particle agglomeration was added. To carry out this agglomeration, two different routes were used, in which their performances in obtaining particles of the appropriate size were analyzed:
1. In the first method, water was used as a binding agent by carrying out incipient wetness impregnation. Once finished, the solids were compressed with a hydraulic press to form a pellet that was dried in the stove for subsequent sieving. This method provided a yield of particles at the desired size of only 7.2%.
2. The second method consisted of carrying out an incipient wetness impregnation but using, as a binding agent, a 20% Ludox (GRACE Materials Technologies, Tarragona, Spain) suspension. Once finished, the solid was dried in the oven and finally sieved, obtaining a yield of the desired particle size of 49.3%. Therefore. we choose this second method for catalyst preparation.
3.2.2. Preparation of Zeolites
The SiOLITE® 13-X zeolite, provided by Industrias Quimicas del Ebro, Zaragoza, Spain), was used as a sorbent for this study. To achieve the particle size required for its use (200–315 μm), it was agglomerated with silica. It also improved the mechanical resistance of the particles. Several tests were carried out to select the binding agent with which the best particle size yields were obtained. Ludox® was selected as the binding agent due to its greater performance compared to Aerosil® R972 (Evonik, Essen, Germany). In fact, using Ludox®, the yield of the desired particle size was c.a. 48%, and with Aerosil® R972, the yield was c.a. 30%.
3.3. Solids Characterization
One of the main problems in fluidized bed reactors is particle attrition. To check the losses that occur due to friction between particles, tests were carried out in the experimental setup (Figure 9), where the solids were subjected to a high air flow for a prolonged period of time (6 h). It was observed that during the first 3 h, the catalyst loss was 1.5 wt%/h, while for the zeolite, it was 3 wt%/h, which is consistent with the lower mechanical resistance of the zeolite. However, in the following 3 h, the catalyst had a loss of less than 0.1% by weight, and the zeolite had less than 0.4%.
The amount of silica in the solids was measured by X-ray fluorescence analysis with a Thermo Fisher PERFORM sequential spectrometer with a rhodium tube (Waltham, MA, USA. The results obtained with respect to the theoretical ones (i.e., those calculated from the preparation method) are presented in Table 5. As can be seen in the table, the deviation was very small.
Table 5.
XRF results.
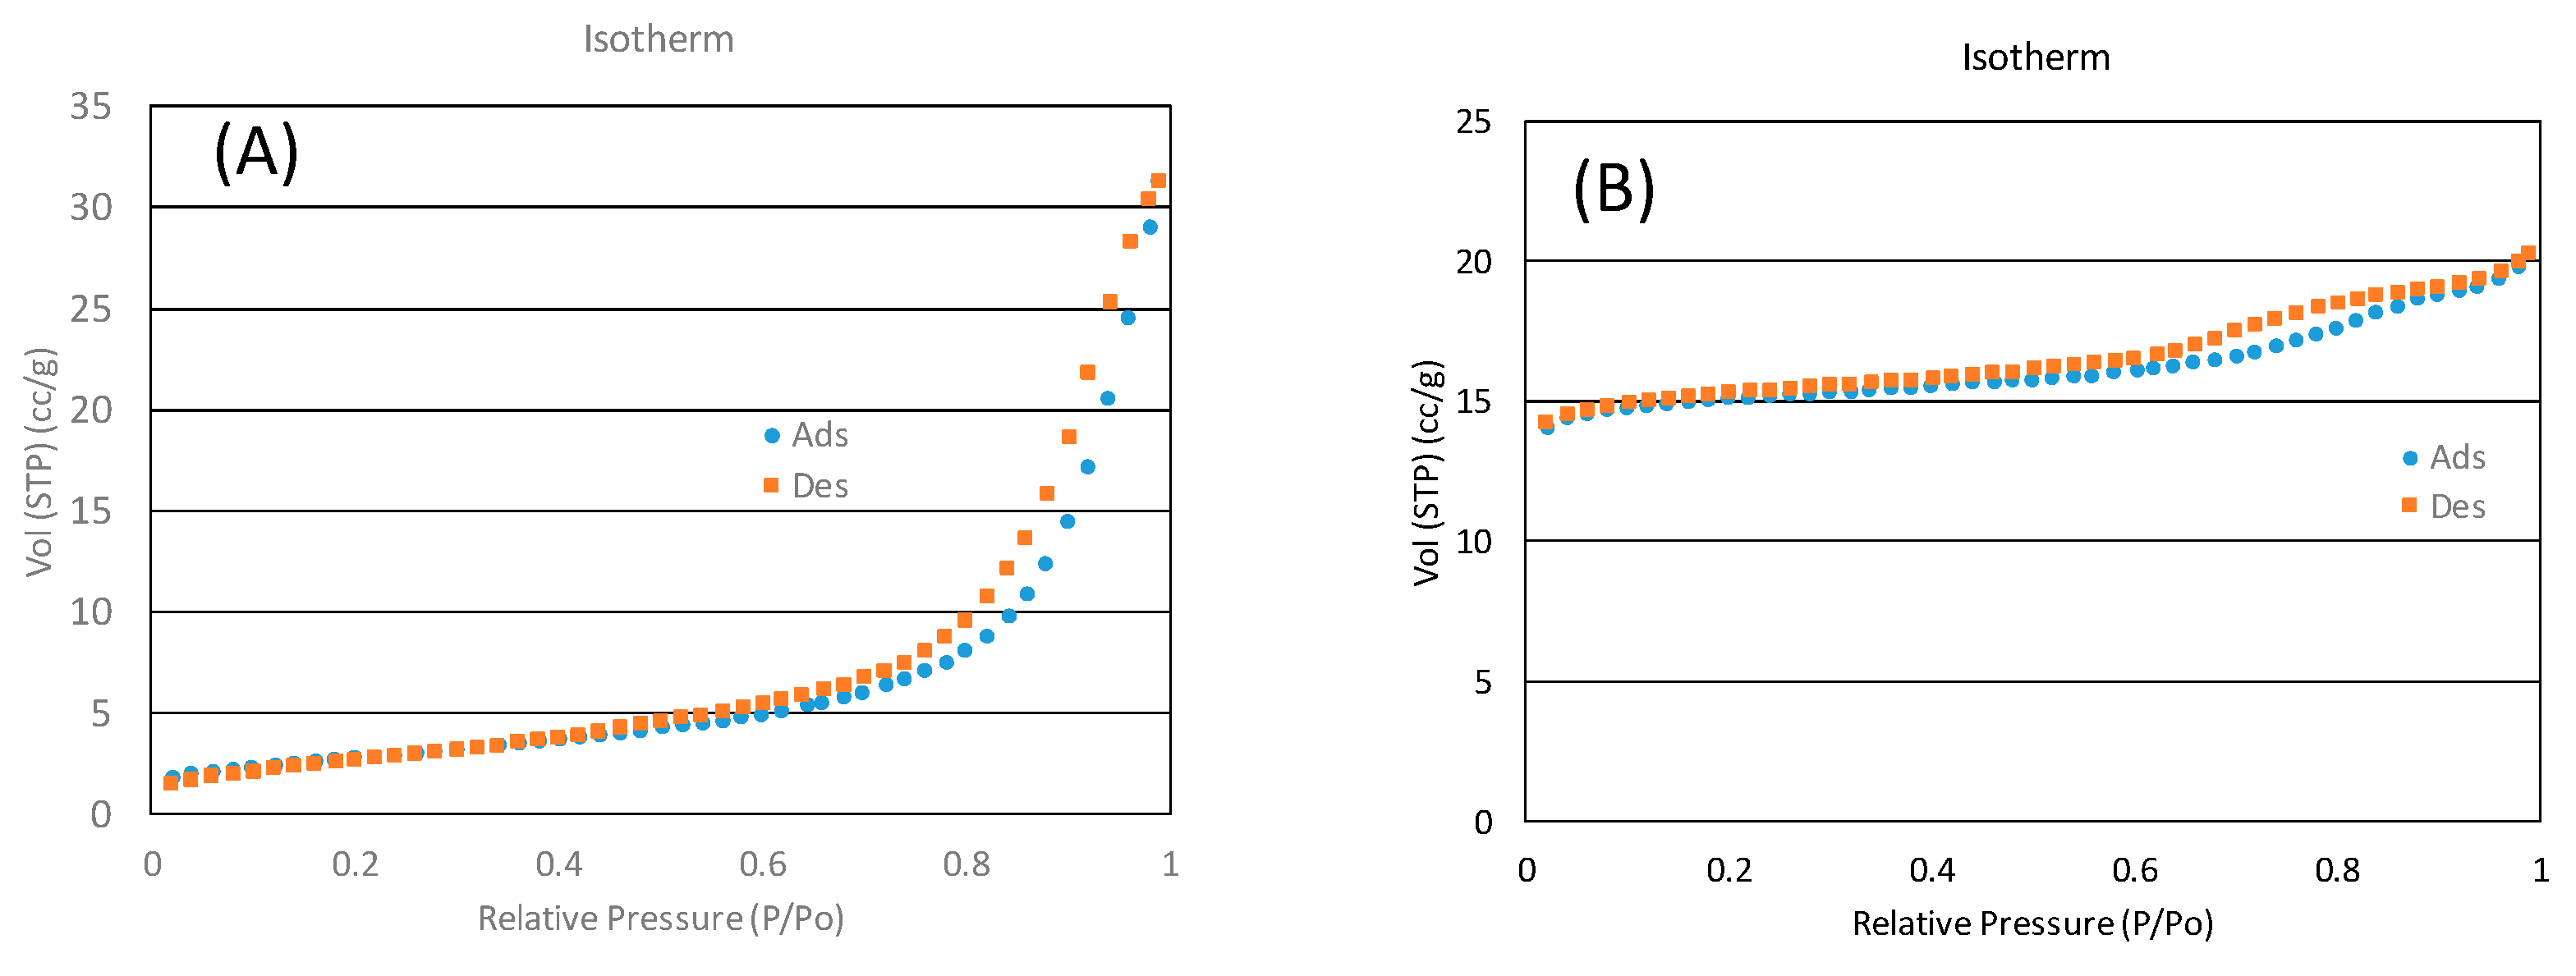
BET measurements were carried out in a Quantachrome® ASIQWinTM (Boynton Beach, FL, USA) device, obtaining values of 101 m2/g and 493 m2/g for the catalyst and zeolite, respectively. Figure 11 shows the BET hysteresis. It shows a minor hysteresis, which indicates ordered structures of both the catalyst and the zeolite.
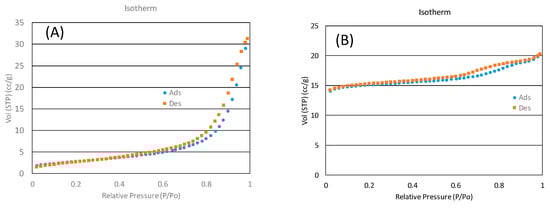
Figure 11.
BET hysteresis for (A) the catalyst and (B) SiOLITE@ 13-X.
Fluid Dynamic Study
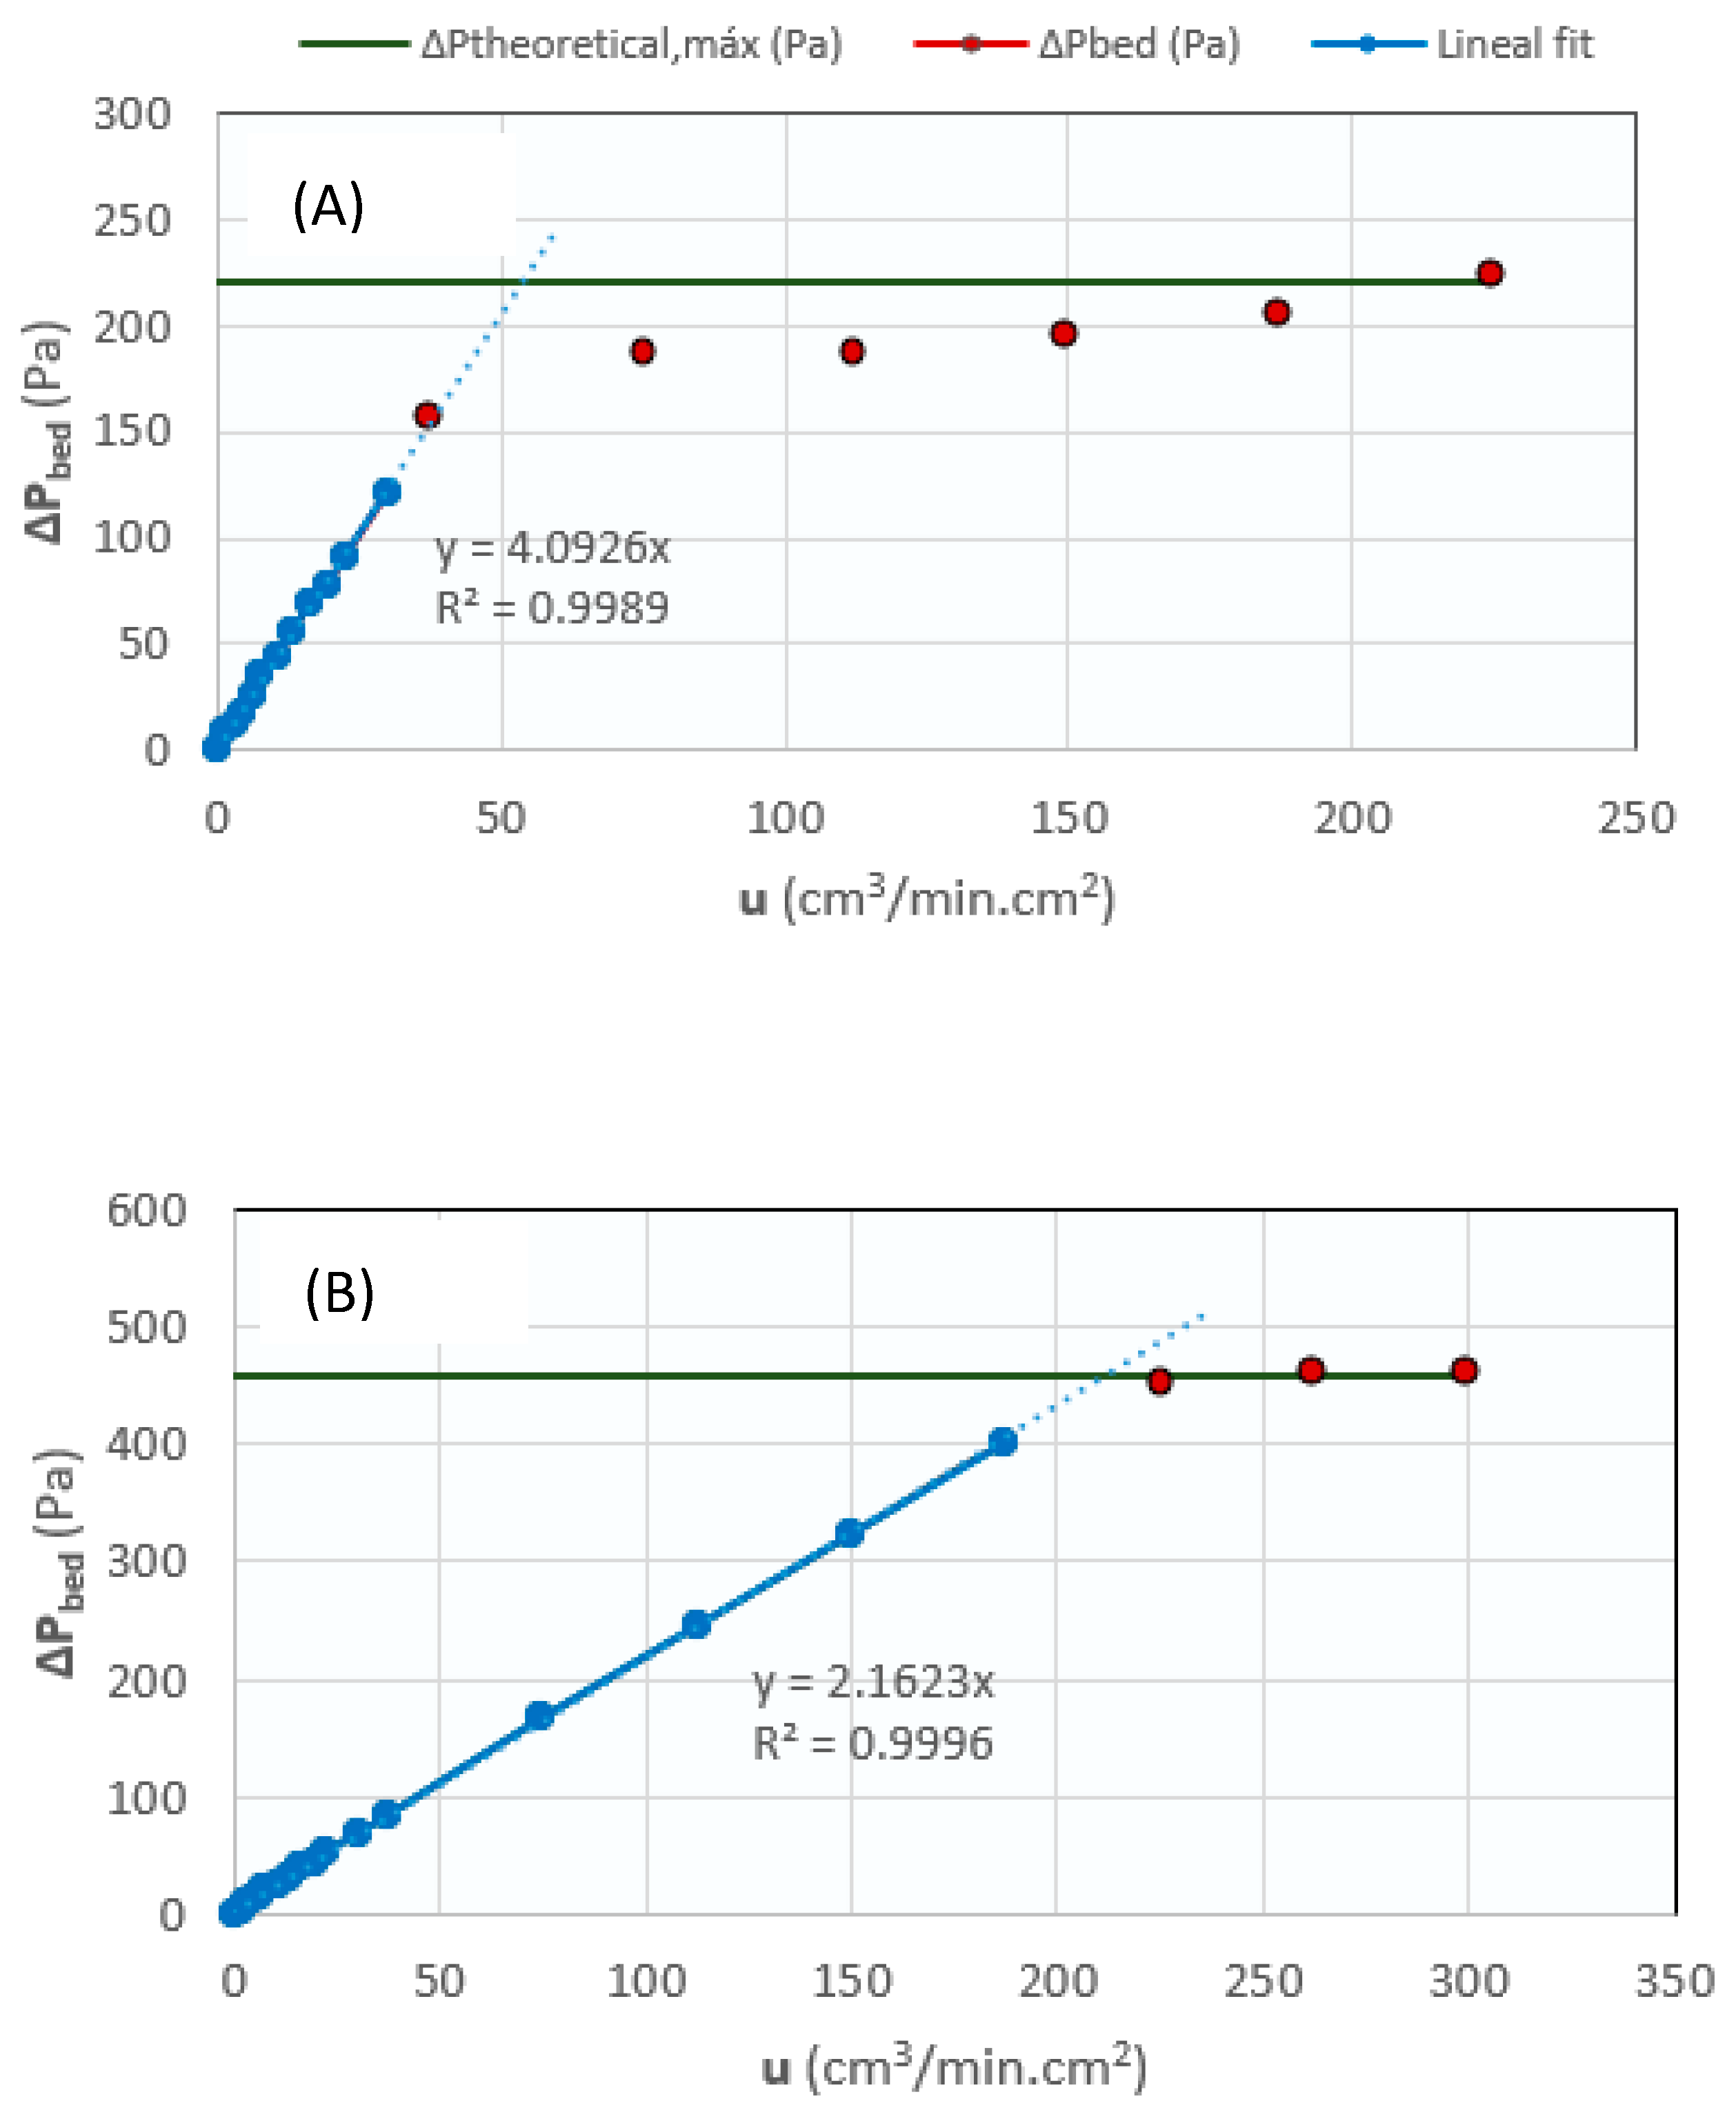
To study the fluidization properties of the solids, a test was carried out on each of them, where the pressure drop ΔP of the bed was measured vs the flow rate of a nitrogen stream fed using an Alicat Scientific® flow meter controller (Duiven, The Netherlands). From these measurements, the following parameters were determined:
- Minimum fluidization velocity (umf): It was extracted from the ΔP vs. u graph as the intersection of the linear approximation of the solid curve with the maximum theoretical ΔP line. Figure 12 shows the minimum fluidization graphs for the CZA catalyst (Figure 12A) and the SiOLITE@ 13-X zeolite (Figure 12B). Specifically, the graphs correspond to tests carried out with 12.5 g of catalyst (ΔPmax = 220.6 Pa) and 26.06 g of zeolite (ΔPmax = 459.5 Pa).
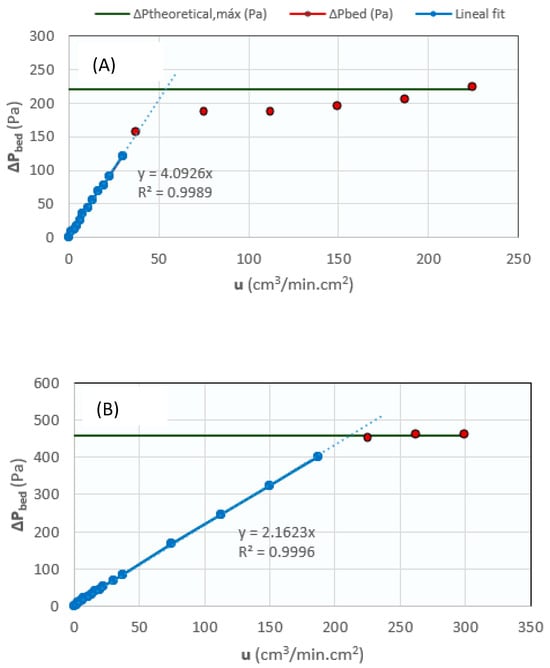 Figure 12. Fluidization graphs for (A) the CZA catalyst (12.5 g), and (B) SiOLITE@ 13-X (26.06 g).
After obtaining these parameters, a study of the umf of a mixed bed of catalyst and zeolite in different proportions was carried out according to the following equations [25]:
- Porosity (ε): The Ergun Equation (8) describes the pressure drop in a packed bed under laminar conditions. Equation (9) is from the application of the Ergun equation to the packed bed behavior in two states: a more densely packed one (the initial state, with L1 being its total height and ΔP1 being its pressure drop at a given u0) and another less densely packed one (the final state after fluidization and the slow decrease of u0, with L2 and ΔP2).
- 2.
- Particle density (ρs) and sphericity (ϕs) were obtained from expressions (11) and (12), with the last one also being derived from the Ergun equations.
Table 6 shows some of the obtained parameters from these specific fluidization tests.
Table 6.
Parameters obtained in the fluidization study of CZA and SiOLITE@ 13-X.
Subsequently, we proceeded to study the CZA/SiOLITE® 13-X (sintetized in this work) binary bed that will be used in the final system. Measurements were made in a well-mixed bed. According to Nienow and Chiba [22], the umf of a mixture of solids will be within the range formed by the individual umf values of the solids measured individually.
The results obtained are summarized in Table 7 for some representative catalyst: zeolite ratios. These results confirm what is described in literature, since the umf of the mixtures were within the range (53.9–212.2 cm3/min·cm2) bounded by CZA and SiOLITE® 13-X.
Table 7.
Minimum fluidization velocities obtained for the binary solid mixtures.
4. Conclusions
The feasibility of segregating a catalyst and a sorbent in a fluidized bed reactor for the methanol synthesis was studied. To this end, an optimal binder was selected for the preparation of solids, maximizing the yield of the desired particle size.
The fluid dynamics and segregation of the catalyst–sorbent binary mixture, the most critical points in the development of the proposed concept, were studied. A good level of segregation was achieved, with a mixing index of 0.31. This favors the correct operation of the system with the continuous addition/removal of sorbent, with only small catalyst losses during the tests carried out. Indeed, under optimal conditions, the concentration of catalyst in the solid stream leaving the bed was less than 0.1%.
Finally, promising results were obtained from simulations of a reactor with the continuous addition and removal of sorbent, indicating that the way of operation may considerably improve the reaction yield of methanol. This can make the process more feasible for industrial operation, since it would considerably reduce the pressure that must be used in the methanol synthesis process; alternatively, it would increase the yield per step, reducing the recirculation of unconverted reactants.
5. Patents
The patent resulting from the work reported in this manuscript is reference [19].
Supplementary Materials
The following supporting information can be downloaded at: https://www.mdpi.com/article/10.3390/catal14070409/s1. Table S1. Particle size distributions vs height of the bed for a CZA: SiOLITE® vol% proportion 50:50 and u0 /umf = 1. Table S2. Particle size distributions vs height of the bed for a CZA: SiOLITE® vol% proportion 50:50 and u0 /umf = 1.25. Table S3. Particle size distributions vs height of the bed for a CZA: SiOLITE® vol% proportion 50:50 and u0 /umf = 1.5. Table S4. Particle size distributions vs height of the bed for a CZA: SiOLITE® vol% proportion 50:50 and u0 /umf = 1.75. Table S5. Particle size distributions vs height of the bed for a CZA: SiOLITE® vol% proportion 50:50 and u0 /umf = 2. Table S6. Particle size distributions vs height of the bed for a CZA: SiOLITE® vol% proportion 30:70 and u0 /umf = 1.75. Table S7. Particle size distributions vs height of the bed for a CZA: SiOLITE® vol% proportion 70:30 and u0 /umf = 1.75
Author Contributions
Conceptualization, J.S., J.H., and M.M.; methodology, J.S., J.H., and M.M.; validation, R.C. and J.L.; writing—original draft preparation, J.S. and J.H.; supervision, M.M. All authors have read and agreed to the published version of the manuscript.
Funding
Agencia Española de Investigación (Project PDC2022-133066-I00/AEI/10.13039/501100011033) and the European Union Fund for Recovery and Resilience is gratefully acknowledged. Authors would like to acknowledge the use of Servicio General de Apoyo a la Investigación-SAI, Universidad de Zaragoza. In addition, the consolidated research group Catalysis and Reactor Engineering Group (CREG) (T43–23R) has the financial support of Gobierno de Aragón (Aragón, Spain) through the European Social Fund—FEDER.
Data Availability Statement
Data are original and does not are available in other documents.
Conflicts of Interest
The authors declare no conflicts of interest.
Nomenclature
| Variable | Description | Units |
| ΔP1 | Loosened bed pressure drop | [Pa] |
| ΔP2 | Packed bed pressure drop | [Pa] |
| W | Weight | [kg] |
| L1 | Loosened bed height | [m] |
| L2 | Packed bed height | [m] |
| μ | Gas viscosity | [kg m−1 s−1] |
| u0 | Gas velocity | [m s−1] |
| ϕs | Solid particle sphericity | [-] |
| dp | Mean particle diameter | [m] |
| S | Bed surface | [m] |
| ρs | Solid density | [kg m−3] |
| Experimental solid fraction | [-] | |
| Xj | Ideal solid fraction if fully segregated | [-] |
| Xj0 | Initial solid fraction | [-] |
| ε | Loosened bed porosity | [-] |
References
- Olah, G.A. Beyond Oil and Gas: The Methanol Economy. Angew. Chem. Int. Ed. 2005, 44, 2636–2639. [Google Scholar] [CrossRef] [PubMed]
- Olah, G.A. Towards oil independence through renewable methanol chemistry. Angew. Chem. Int. Ed. 2013, 52, 104–107. [Google Scholar] [CrossRef] [PubMed]
- Jadhav, S.G.; Vaidya, P.D.; Bhanage, B.M.; Joshi, J.B. Catalytic carbon dioxide hydrogenation to methanol: A review of recent studies. Chem. Eng. Res. Des. 2014, 92, 2557–2567. [Google Scholar] [CrossRef]
- Dang, S.; Yang, H.; Gao, P.; Wang, H.; Li, X.; Wei, W.; Sun, Y. A review of research progress on heterogeneous catalysts for methanol synthesis from carbon dioxide hydrogenation. Catal. Today 2018, 330, 61–75. [Google Scholar] [CrossRef]
- Guil-López, R.; Mota, N.; Llorente, J.; Millán, E.; Pawelec, B.; Fierro, J.L.G.; Navarro, R.M. Methanol Synthesis from CO2: A Review of the Latest Developments in Heterogeneous. Materials 2019, 12, 3902. [Google Scholar] [CrossRef] [PubMed]
- Estevez, R.; Aguado-Deblas, L.; Bautista, F.M.; López-Tenllado, F.J.; Romero, A.A.; Luna, D. A Review on Green Hydrogen Valorization by Heterogeneous Catalytic Hydrogenation of Captured CO2 into Value-Added Products. Cataysts 2022, 12, 1555. [Google Scholar] [CrossRef]
- Velty, A.; Corma, A. Advanced zeolite and ordered mesoporous silica-based catalysts for the conversion of CO2 to chemicals and fuels. Chem. Soc. Rev. 2023, 52, 1773–1946. [Google Scholar] [CrossRef] [PubMed]
- Saravanan, A.; Senthil Kumar, P.; Vo, D.V.N.; Jeevanantham, S.; Bhuvaneswari, V.; Anantha Narayanan, V.; Yaashikaa, P.R.; Swetha, S.; Reshma, B. A comprehensive review on different approaches for CO2 utilization and conversion pathways. Chem. Eng. Sci. 2021, 236, 116515. [Google Scholar] [CrossRef]
- Skrzypek, J.; Lachowska, M.; Grzesik, M.; Sloczyński, J.; Nowak, P. Thermodynamics and kinetics of low pressure methanol synthesis. Chem. Eng. J. Biochem. Eng. J. 1995, 58, 101–108. [Google Scholar] [CrossRef]
- Menéndez, M.; Piera, E.; Coronas, J.; Santamaría, J. Zeolite Membrane Reactor for the Production of Methanol and other Alcohols Form Synthesis Gas. Spanish Patent ES2164544, 22 July 1999. [Google Scholar]
- Struis, R.P.W.J.; Stucki, S.; Wiedorn, M. A membrane reactor for methanol synthesis. J. Membr. Sci. 1996, 113, 93–100. [Google Scholar] [CrossRef]
- Gallucci, F.; Paturzo, L.; Basile, A. An experimental study of CO2 hydrogenation into methanol involving a zeolite membrane reactor. Chem. Eng. Process. Process Intensif. 2004, 43, 1029–1036. [Google Scholar] [CrossRef]
- Gorbe, J.; Lasobras, J.; Francés, E.; Herguido, J.; Menéndez, M.; Kumakiri, I.; Kita, H. Preliminary study on the feasibility of using a zeolite A membrane in a membrane reactor for methanol production. Sep. Purif. Technol. 2018, 200, 164–168. [Google Scholar] [CrossRef]
- Bayat, M.; Dehghani, Z.; Hamidi, M.; Rahimpour, M.R. Methanol synthesis via sorption-enhanced reaction process: Modeling and multi-objective optimization. J. Taiwan Inst. Chem. Eng. 2014, 45, 481–494. [Google Scholar] [CrossRef]
- Maksimov, P.; Laari, A.; Ruuskanen, V.; Koiranen, T.; Ahola, J. Methanol synthesis through sorption enhanced carbon dioxide hydrogenation. Chem. Eng. J. 2021, 418, 129290. [Google Scholar] [CrossRef]
- Nieminen, H.; Maksimov, P.; Laari, A.; Väisänen, V.; Vuokila, A.; Huuhtanen, M.; Koiranen, T. Process modelling and feasibility study of sorption-enhanced methanol synthesis. Chem. Eng. Process. Process Intensif. 2022, 179, 109052. [Google Scholar] [CrossRef]
- van Kampen, J.; Boon, J.; van Berkel, F.; Vente, J.; van Sint Annaland, M. Steam separation enhanced reactions: Review and outlook. Chem. Eng. J. 2019, 374, 1286–1303. [Google Scholar] [CrossRef]
- Terrini, J.; Trottmann, M.; Franken, T.; Heel, A.; Borgschulte, A. Sorption-Enhanced Methanol Synthesis. Energy Technol. 2019, 7, 1801093. [Google Scholar] [CrossRef]
- Menéndez, M.; Herguido, J.; Soler, J.; Lasobras, J. Reactor System for Sorption-Enhanced Catalytic Reactions with Continuous Regeneration of Sorbent and Related Methods. Spanish Patent EP23382685, 8 July 2023. [Google Scholar]
- Kuczynski, M.; Oyevaar, M.H.; Pieters, R.T.; Westerterp, K.R. Methanol synthesis in a countercurrent gas-solid-solid trickle flow reactor. An experimental study. Chem. Eng. Sci. 1987, 42, 1887–1898. [Google Scholar] [CrossRef]
- Marzocchella, A.; Salatino, P.; Di Pastena, V.; Lirer, L. Transient fluidization and segregation of binary mixtures of particles. AIChE J. 2004, 46, 2175–2182. [Google Scholar] [CrossRef]
- Nienow, A.W.; Chiba, T. Fluidization of Dissimilar materials. In Fluidization, 2nd ed.; Davidson, J.F., Clift, R., Harrison, D., Eds.; Academic Press: Cambridge, MA, USA, 1985; pp. 357–381. [Google Scholar]
- Hong, Z.-S.; Cao, Y.; Deng, J.-F.; Fan, K.-N. CO2 hydrogenation to methanol over Cu/ZnO/Al2O3 catalysts prepared by a novel gel-network-coprecipitation method. Catal. Lett. 2002, 82, 37–44. [Google Scholar] [CrossRef]
- Llorente, J.; Guil-López, R.; Mota, N.; Millán, E.; Pawelec, B.; García, R.; Navarro, R.M.; Fierro, J.L.G. Descifrando el efecto del Na residual en los precursores de catalizadores Cu/ZnO/Al2O3 para la síntesis de methanol. In Book of Abstracts of the Spanish Society of Catalysis (SECAT); SPANISH SOCIETY OF CATALYSIS (SECAT): MADRID, Spain, 2019; pp. 89–90. [Google Scholar]
- Kunii, D.; Levenspiel, O. Fluidization Engineering, 2nd ed.; Butterworth-Heinemann: Newton, MA, USA, 1991; ISBN 0409902330. [Google Scholar]
Disclaimer/Publisher’s Note: The statements, opinions and data contained in all publications are solely those of the individual author(s) and contributor(s) and not of MDPI and/or the editor(s). MDPI and/or the editor(s) disclaim responsibility for any injury to people or property resulting from any ideas, methods, instructions or products referred to in the content. |
© 2024 by the authors. Licensee MDPI, Basel, Switzerland. This article is an open access article distributed under the terms and conditions of the Creative Commons Attribution (CC BY) license (https://creativecommons.org/licenses/by/4.0/).