Article

Investigation of an Ethanol Electroreforming Cell Based on a Pt1Ru1/C Catalyst at the Anode

Consiglio Nazionale delle Ricerche, Istituto di Tecnologie Avanzate per l’Energia “Nicola Giordano”, CNR-ITAE, Via Salita Santa Lucia sopra Contesse 5, 98126 Messina, Italy
*
Author to whom correspondence should be addressed.
Catalysts 2024, 14(7), 415; https://doi.org/10.3390/catal14070415
Submission received: 9 May 2024 / Revised: 18 June 2024 / Accepted: 26 June 2024 / Published: 29 June 2024

Abstract

:
The production of H2 from renewable sources represents a crucial challenge for the planet’s future to achieve net zero emissions and store renewable energy. A possible alternative to water electrolysis (WE), which requires high potential (E > 1.48 V) to trigger the oxygen evolution reaction (OER), would be alcohol electrochemical reforming (ER), which implies the oxidation of short organic molecules such as methanol or ethanol. In ER, energy must be supplied to the system, but from a thermodynamic point of view, the energy request for the methanol or ethanol oxidation reaction is much lower than that of the OER. To study this process, an in-house 50 wt.% Pt1Ru1/C anodic catalyst was easily synthesized according to the Pt sulphite complex route and the impregnation of a carbon support (Ketjenblack, KB) and a Ru precursor. X-ray diffraction (XRD), X-ray fluorescence (XRF) spectroscopy, and Transmission Electron Microscopy (TEM) were used to characterize the structure, composition, and morphology of the catalyst. It appears that two distinct crystallographic phases of the Pt and Ru nanoparticles were encountered after the synthesis conducted by Ru impregnation. For the electrochemical measurements, ethanol electrooxidation (2 M CH3CH2OH) was studied first in a half cell with a rotating disc electrode (RDE) configuration under acid conditions and then in a direct ethanol electroreforming (or electrolysis) cell, equipped with a proton exchange membrane (PEM) as the electrolyte. The output current density was 0.93 A cm−2 at 1 V and 90 °C in 2 M ethanol. The remarkable current densities obtained in the alcohol electrolyzer at a low voltage are better than the actual state of the art for PEM ethanol ER.

1. Introduction

Over 80% of the world’s energy comes from fossil fuels, negatively impacting the environment and ecosystem balance [1]. To slow down climate change, research needs to provide a route for sustainable development, as well as substitution of harmful fossil fuels. Nowadays, solar cells and turbines for wind power are the main sources of large-scale renewable energy production [2,3,4,5]. However, one of the reasons why research in the field of advanced energy technologies is concentrated on potential solutions in storing energy through an environmentally friendly hydrogen (H2) energy vector is the intermittent and unpredictable nature of solar and wind energies due to weather variability [6,7,8]. Subsequently, the stored H2 could be oxidized at the anode and O2 reduced at the cathode of polymer electrolyte fuel cells in two membrane-separated compartments to generate electrical energy and water as the unique reaction product [9,10].
Nowadays, the “greenest” way to produce and store the hydrogen energy vector is water electrolysis (WE) [11], a technology without any direct carbon emissions when combined with a renewable energy source. The oxygen evolution reaction (OER) and the hydrogen evolution reaction (HER) from water occur at the anode and cathode of the electrolyzer, respectively, whereas the OER represents the rate-determining step of the overall WE, which requires a high energy input [12] for thermodynamic and kinetic reasons. In this context, the oxidation of short-chain alcohols can serve as a viable substitute for the OER. For instance, methanol and ethanol have reversible potentials of 0.016 and 0.084 V vs. the RHE, respectively, whereas the OER requires 1.23 V vs. the RHE, or 0.227 V and 0.301 compared to 1.48 V when taking the thermoneutral potential into account [13]. Alcohol oxidation is generally investigated for direct alcohol fuel cell (DAFC) applications due to their high energy density and the liquid’s properties at room temperature [14,15,16,17,18]. In contrast, this reaction is less studied for electroreforming (ER) applications, in which alcohol oxidation at the anode produces hydrogen evolution at the cathode, applying electrical energy (DG > 0). According to a recent review by Dolle et al. [13], the ER concept becomes appealing for industrial use when biomasses are used to form alcohol. It is also more energy-efficient than polymer electrolyte membrane (PEM) WE, and the hydrogen cost can be reduced if highly active catalysts are used. High selectivity toward CO2 results in the highest efficiency of the electroreformer, whereas the oxidation of large organic compounds can yield specific added-value chemicals in the case of uncompleted oxidation reactions.
Among the short-chain alcohols, ethanol exhibits notable benefits compared to methanol, including reduced manufacturing and handling costs and increased safety during storage and transportation. Furthermore, ethanol is less harmful and can be produced more readily from biomass or agricultural waste [19]. Based on its production process (sugarcane, hemp, cassava, corn), it can be categorized as a carbon-neutral fuel source, making it a viable option for sustainable energy sources. A complete ethanol oxidation reaction (EOR) leads to CO2 evolution (Equation (1)), which yields 8.0 kWh kg−1, whereas this process is complicated since the ethanol C-C bond is hard to break. There could be more parallel reactions, such as those shown in Equations (2) and (3) characterized by the production of intermediates, such as acetaldehyde and acetic acid. The latter is an important industrial product for producing polyethylene terephthalate, employed mainly for plastic bottles; cellulose acetate, mainly for photographic films; polyvinyl acetate for wood glues; and in many synthetic fibers and fabrics.
CH3CH2OH + 3H2O → 2CO2 + 12H+ +12e
CH3CH2OH → CH3CHO + 2H+ +2e
CH3CH2OH + H2O → CH3COOH + 4H+ + 4e
By using a proton exchange membrane as the electrolyte, the protons (H+) cross over the membrane and reach the cathode, where oxygen can trigger the DAFC reaction spontaneously if it is present at the cathode. Alternatively, alcohol ER utilizes the oxidation of short organic molecules like methanol or ethanol (Equations (1)–(3)) to produce H+, which can be reduced into molecular hydrogen (Erev = 0 V), as illustrated by Equation (4).
12H+ + 12e → 6H2
In alcohol ER, energy must be provided to the system but considerably lower amounts than in water electrolysis [12]. Figure 1 illustrates how DEFCs (Figure 1a) and ethanol ER (Figure 1b) differ from each other: (i) in DEFCs, electrical energy is generated due to spontaneous reactions, whereas in ER, the energy must be supplied to the system for hydrogen formation; (ii) oxygen flows to the cathode inlet in DEFCs, whereas nothing is fed to the cathode of an electroreformer; (iii) water or hydrogen is the product at the cathode for DEFCs and ER, respectively.
Regarding the catalyst layers, Pt is typically utilized as the benchmark catalyst in PEMFCs and PEMWEs for several reactions, including the hydrogen oxidation reaction (HOR), the hydrogen evolution reaction (HER), and the oxygen reduction reaction (ORR) [10,20,21]. However, PtRu alloys are the reference catalysts for alcohol (especially methanol) oxidation because Pt is easily poisoned by CO, which results from the partial oxidation of alcohol. As described in the literature [22], a generally accepted pathway foresees a bifunctional mechanism for PtRu catalysts. Ethanol adsorption and dissociations of H+ and e give the formation of acetaldehyde adsorbed over Pt’s active site (Pt-CO-CH3). In contrast, water dissociation mainly occurs over Ru nanoparticles (Ru-OH). The two compounds react for acetic acid formation and the reactivation of the Pt and Ru catalysts. It has been shown that the addition of a second or third metal to Pt can enhance the catalyst’s durability and activities when employed for the EOR [23].
Chen et al. [12] investigated the usage of several alcohols for ER applications in alkaline conditions, highlighting the compounds’ selectivity, as well as the superior current density at low-bias voltage. Bio-derived alcohols not only make the electrolysis process for producing H2 more versatile but they also enable the electrooxidation of a wide range of reactants, such as salts of lactate, glycolate, oxalate, glycerate, and tartronate, to produce valuable chemicals.
Lamy et al. [24] showed that the cell voltage of the most effective catalyst they used for alcohol electrochemical oxidation was below 0.9 V for an evolution rate of approximately 220 cm3 of hydrogen per hour at 100 mA cm−2 or 0.5 A with the 5 cm2 geometric area cell employed. The electrical energy consumed was less than 2.3 kWh (Nm3)−1 or less than half of the energy required for water electrolysis (4.7 kWh (Nm3)−1 at 2 V).
Herein, a 50% Pt1Ru1/C anode catalyst was prepared according to a facile Pt sulphite complex route and subsequent impregnation with a high-surface-area carbonaceous support (Ketjenblack, named KB) and a Ru precursor. The electrooxidation of ethanol was studied in a rotating disk electrode configuration in acidic conditions and in an ER cell with a proton exchange membrane (PEM) to evaluate the activity, performance, and short-term durability of the synthesized catalyst. Additionally, a gas flow meter was used to track the evolution of H2 at the ER cell cathode by fixing the current within a 0.5–2 A interval (0.4–0.7 V potential range) and correlating the results with Faraday’s law.

2. Results

2.1. Physicochemical Characterization

The Pt1Ru1 ratio was calculated and revealed by X-ray fluorescence (XRF) analysis, whereas the carbon percentage was calculated by weight loss. A total of 50 mg of the sample was treated in air at 550 °C for 2 h, and after cooling, the weight corresponded to 25 mg, confirming a carbonaceous matrix percentage of 50 wt.%.

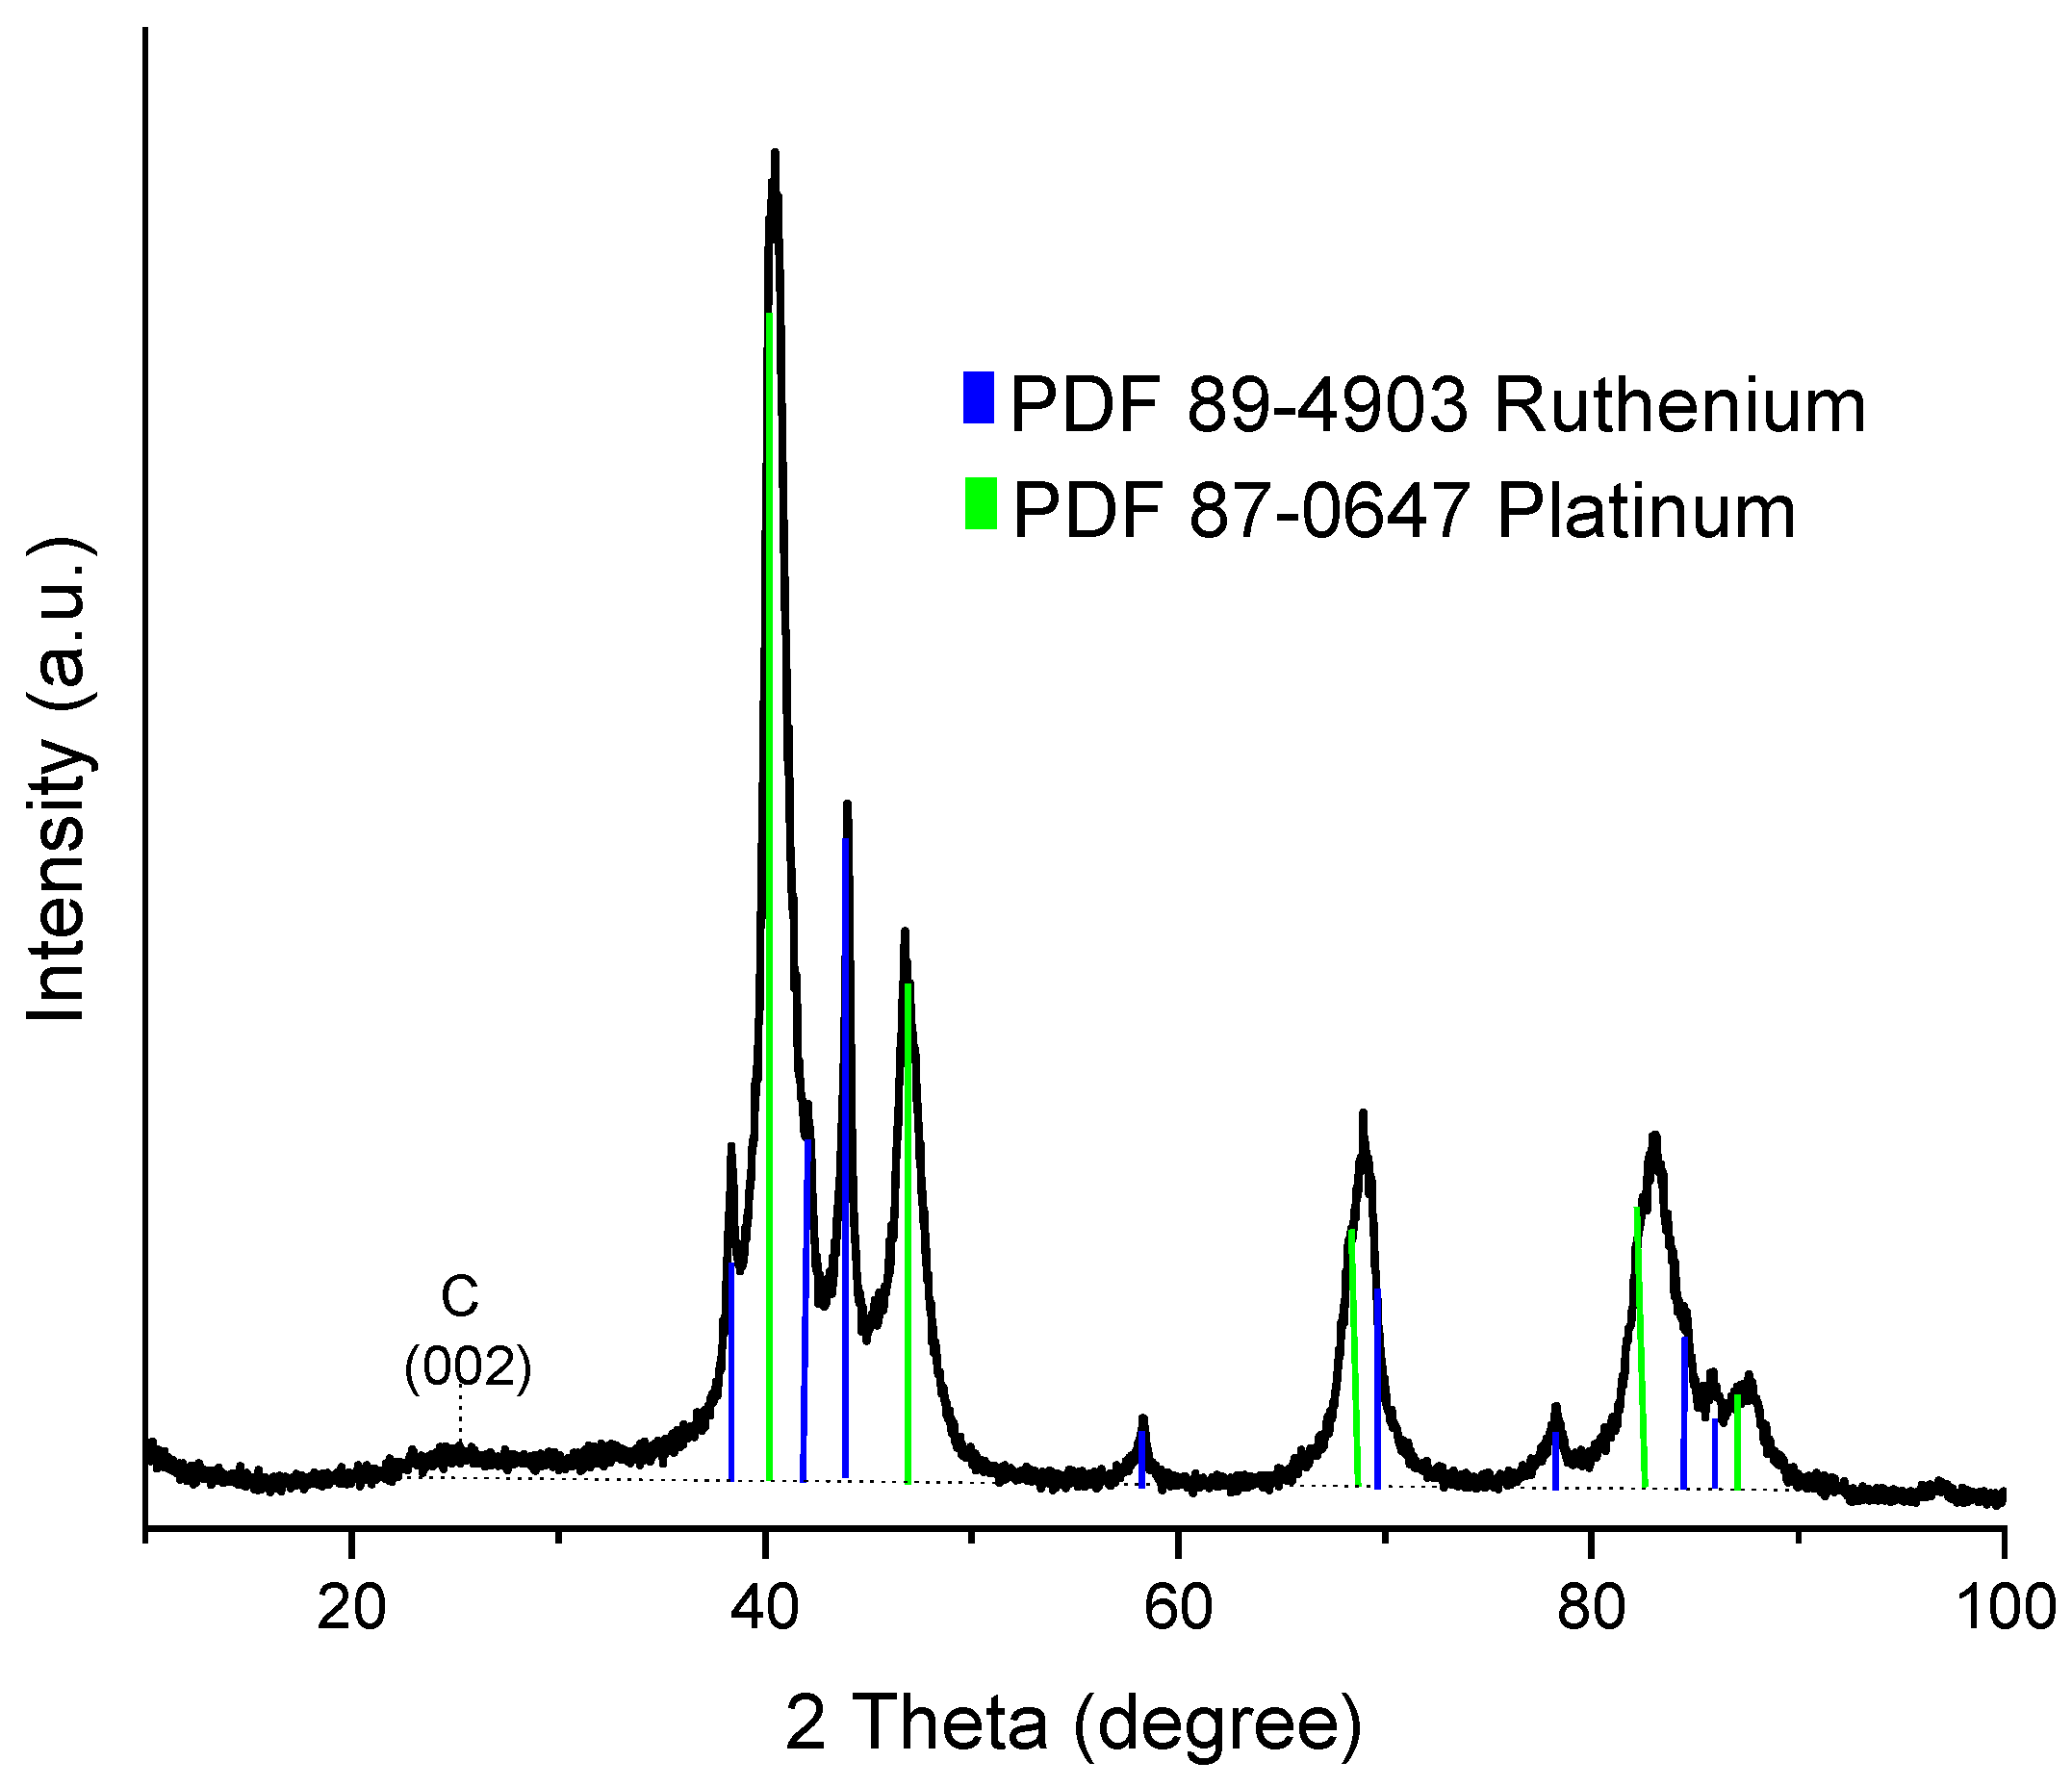
2.1.1. X-ray Diffraction (XRD) Analysis

The 50 wt.% Pt1Ru1/C was analyzed by X-ray diffraction (XRD), as shown in Figure 2. The sample reveals a face-centered cubic (fcc) structure for Pt, although the hexagonal phase of the Ru nanoparticles is also evident due to the synthetic procedure, which includes the impregnation of the Ru precursor over the PtOx/KB before the reduction. The peak at 24.8° is characteristic of hexagonal carbon graphite (002), the peaks at 40.2°, 46.8°, 68.4°, 82.4°, and 86.9° are related to the respective (111), (200), (220), (311), and (222) crystallographic orientations of the fcc structure typical of Pt and its alloys, and those at 38.4°, 42.2°, 44.0°, 58.3°, 69.5°, 78.4°, 84.7°, and 86.0° correspond to the (100), (002), (101), (102), (103), (200), (112), and (201) orientations of the hexagonal Ru structure.

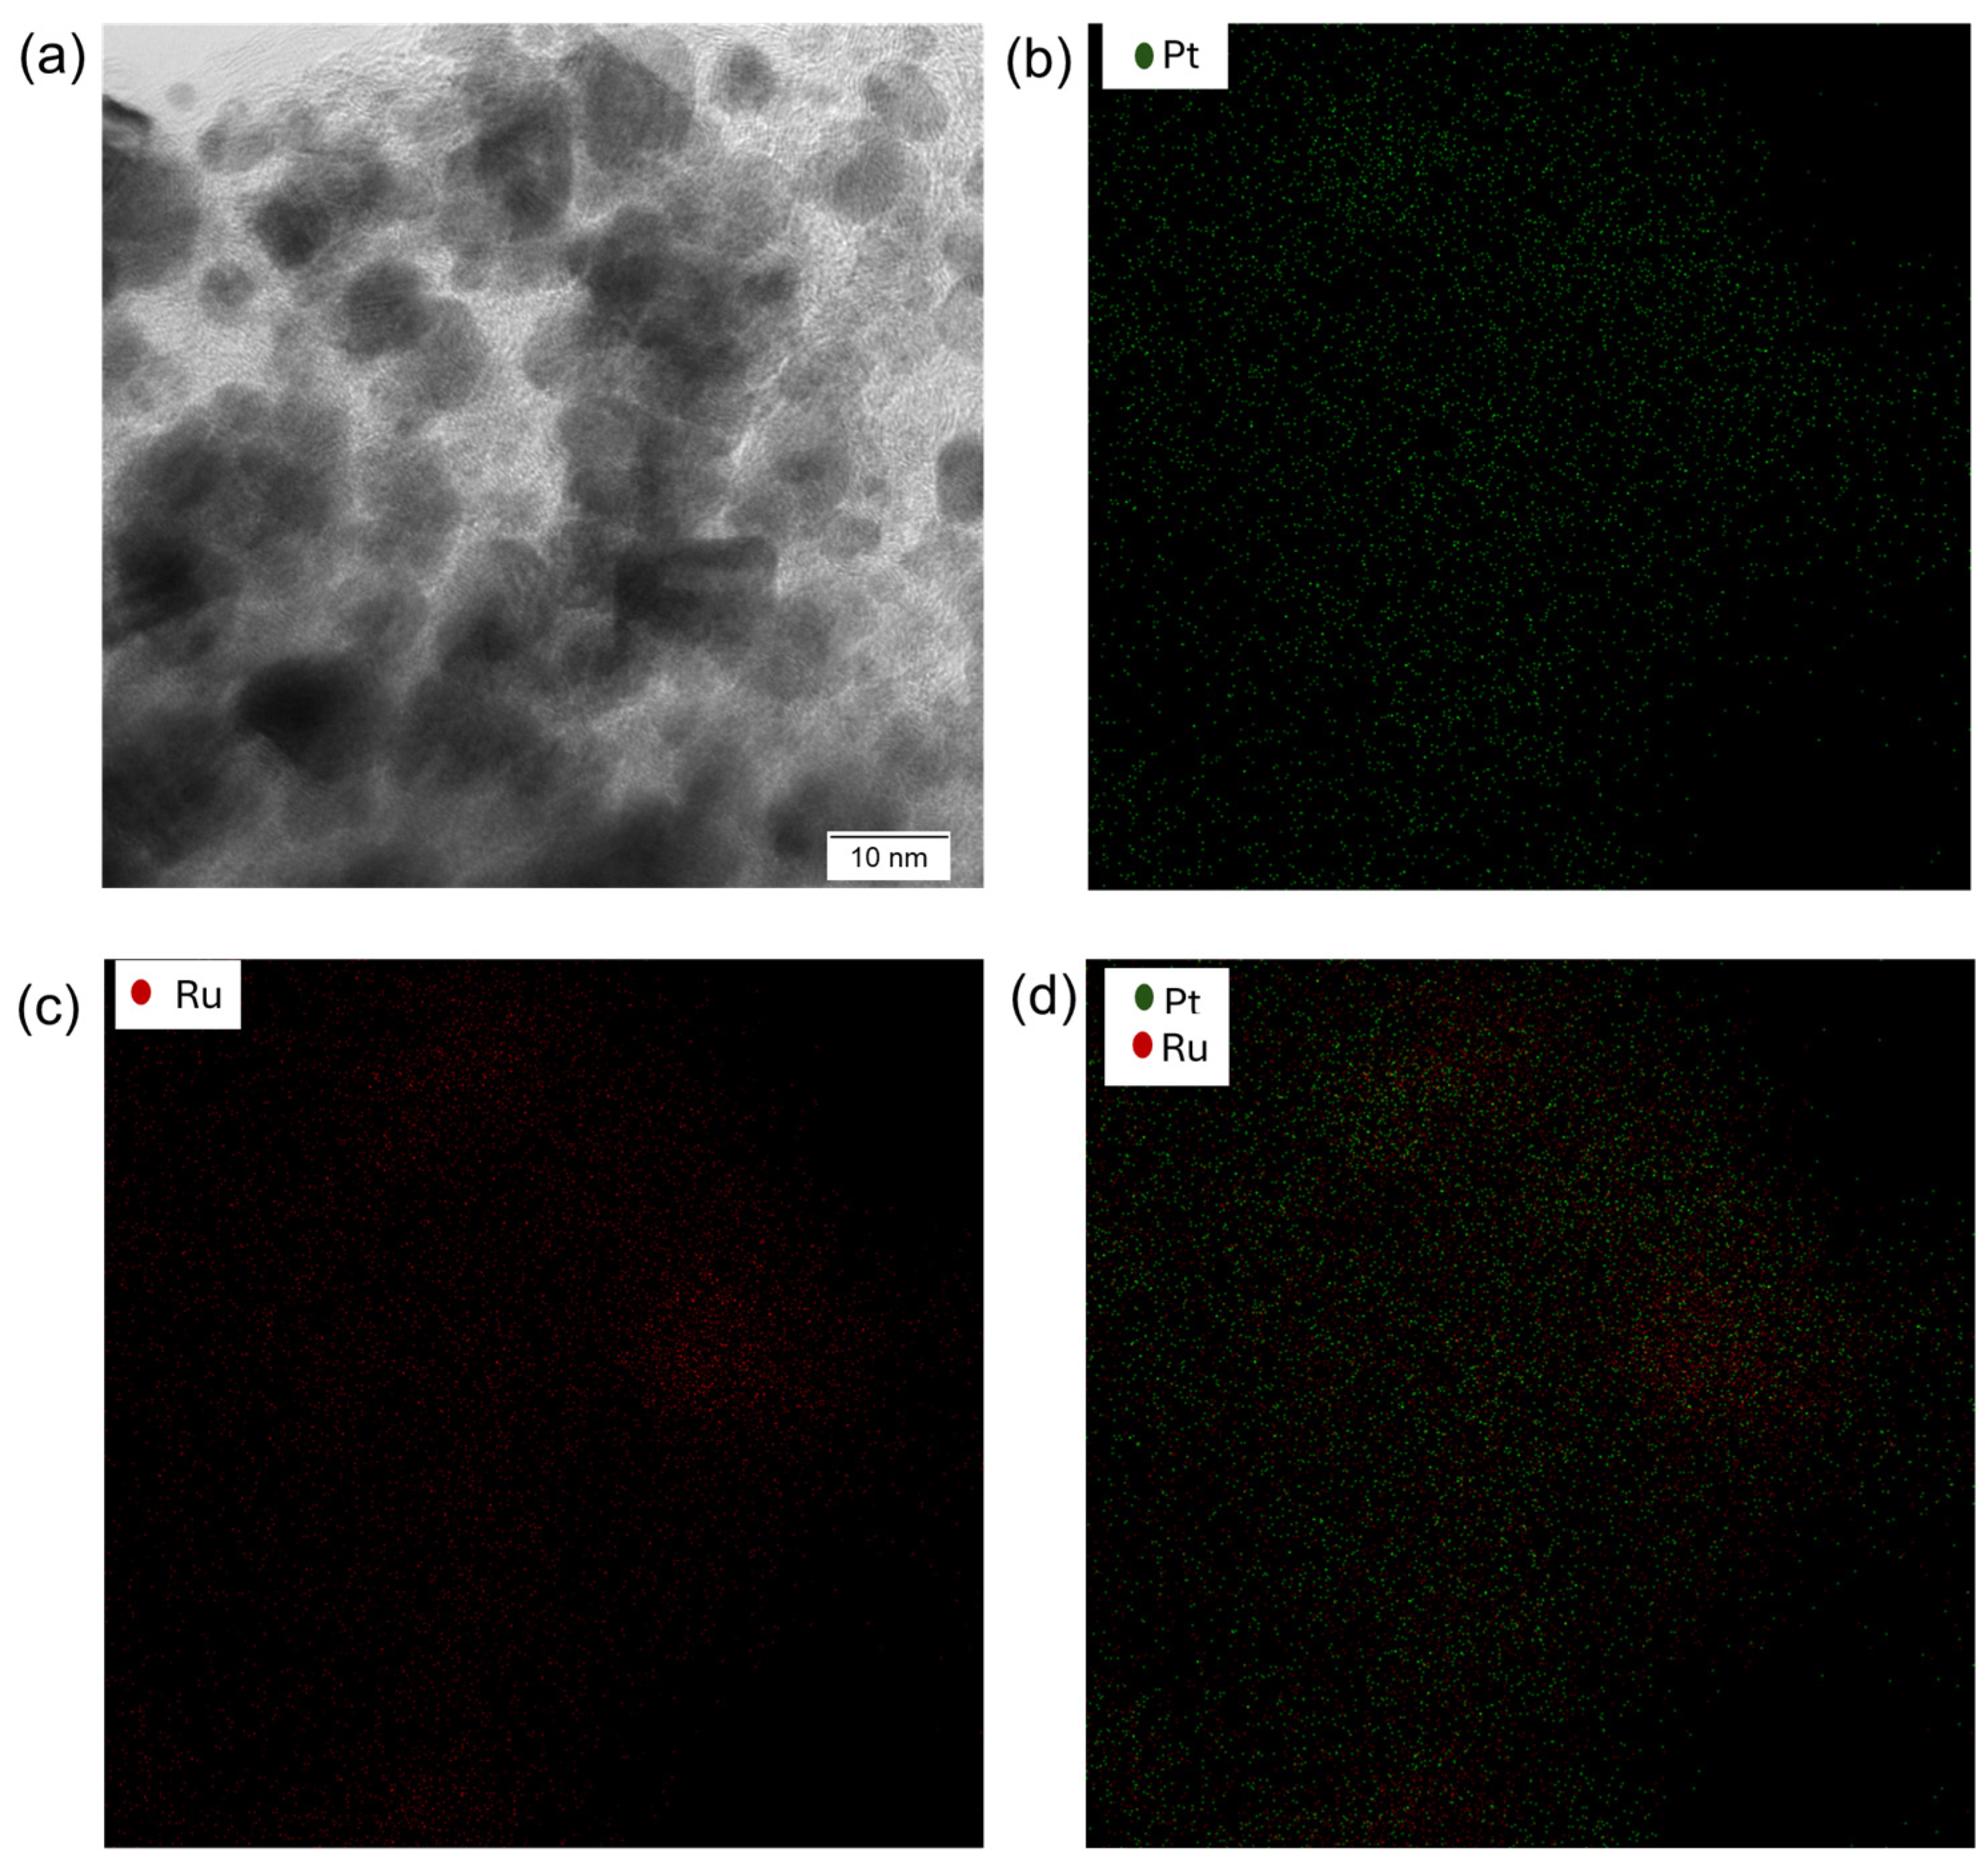
2.1.2. Scanning Transmission Electron Microscopy–Energy-Dispersive X-ray Spectroscopy (S/TEM-EDX) Investigations

Figure 3a shows TEM images of the PtRu catalyst, in which the Pt and Ru nanoparticles are homogeneously distributed over the entire carbonaceous support. The quasi-spherical Pt and Ru nanoparticles are well distributed, with a particle size ranging between 2 and 4 nm. Mapping of the Pt and Ru nanoparticles, displayed in Figure 3b,c, confirms the homogeneous distribution of the single metals over the carbonaceous support, whereas, in Figure 3d, Pt and Ru appear overlayed in most cases. In another few portions of the space, the particles related to Pt (in blue) and Ru (in red) seem to be isolated, as demonstrated by the XRD structure of the homemade 50% Pt1Ru1/C.

2.2. Electrochemical Characterization

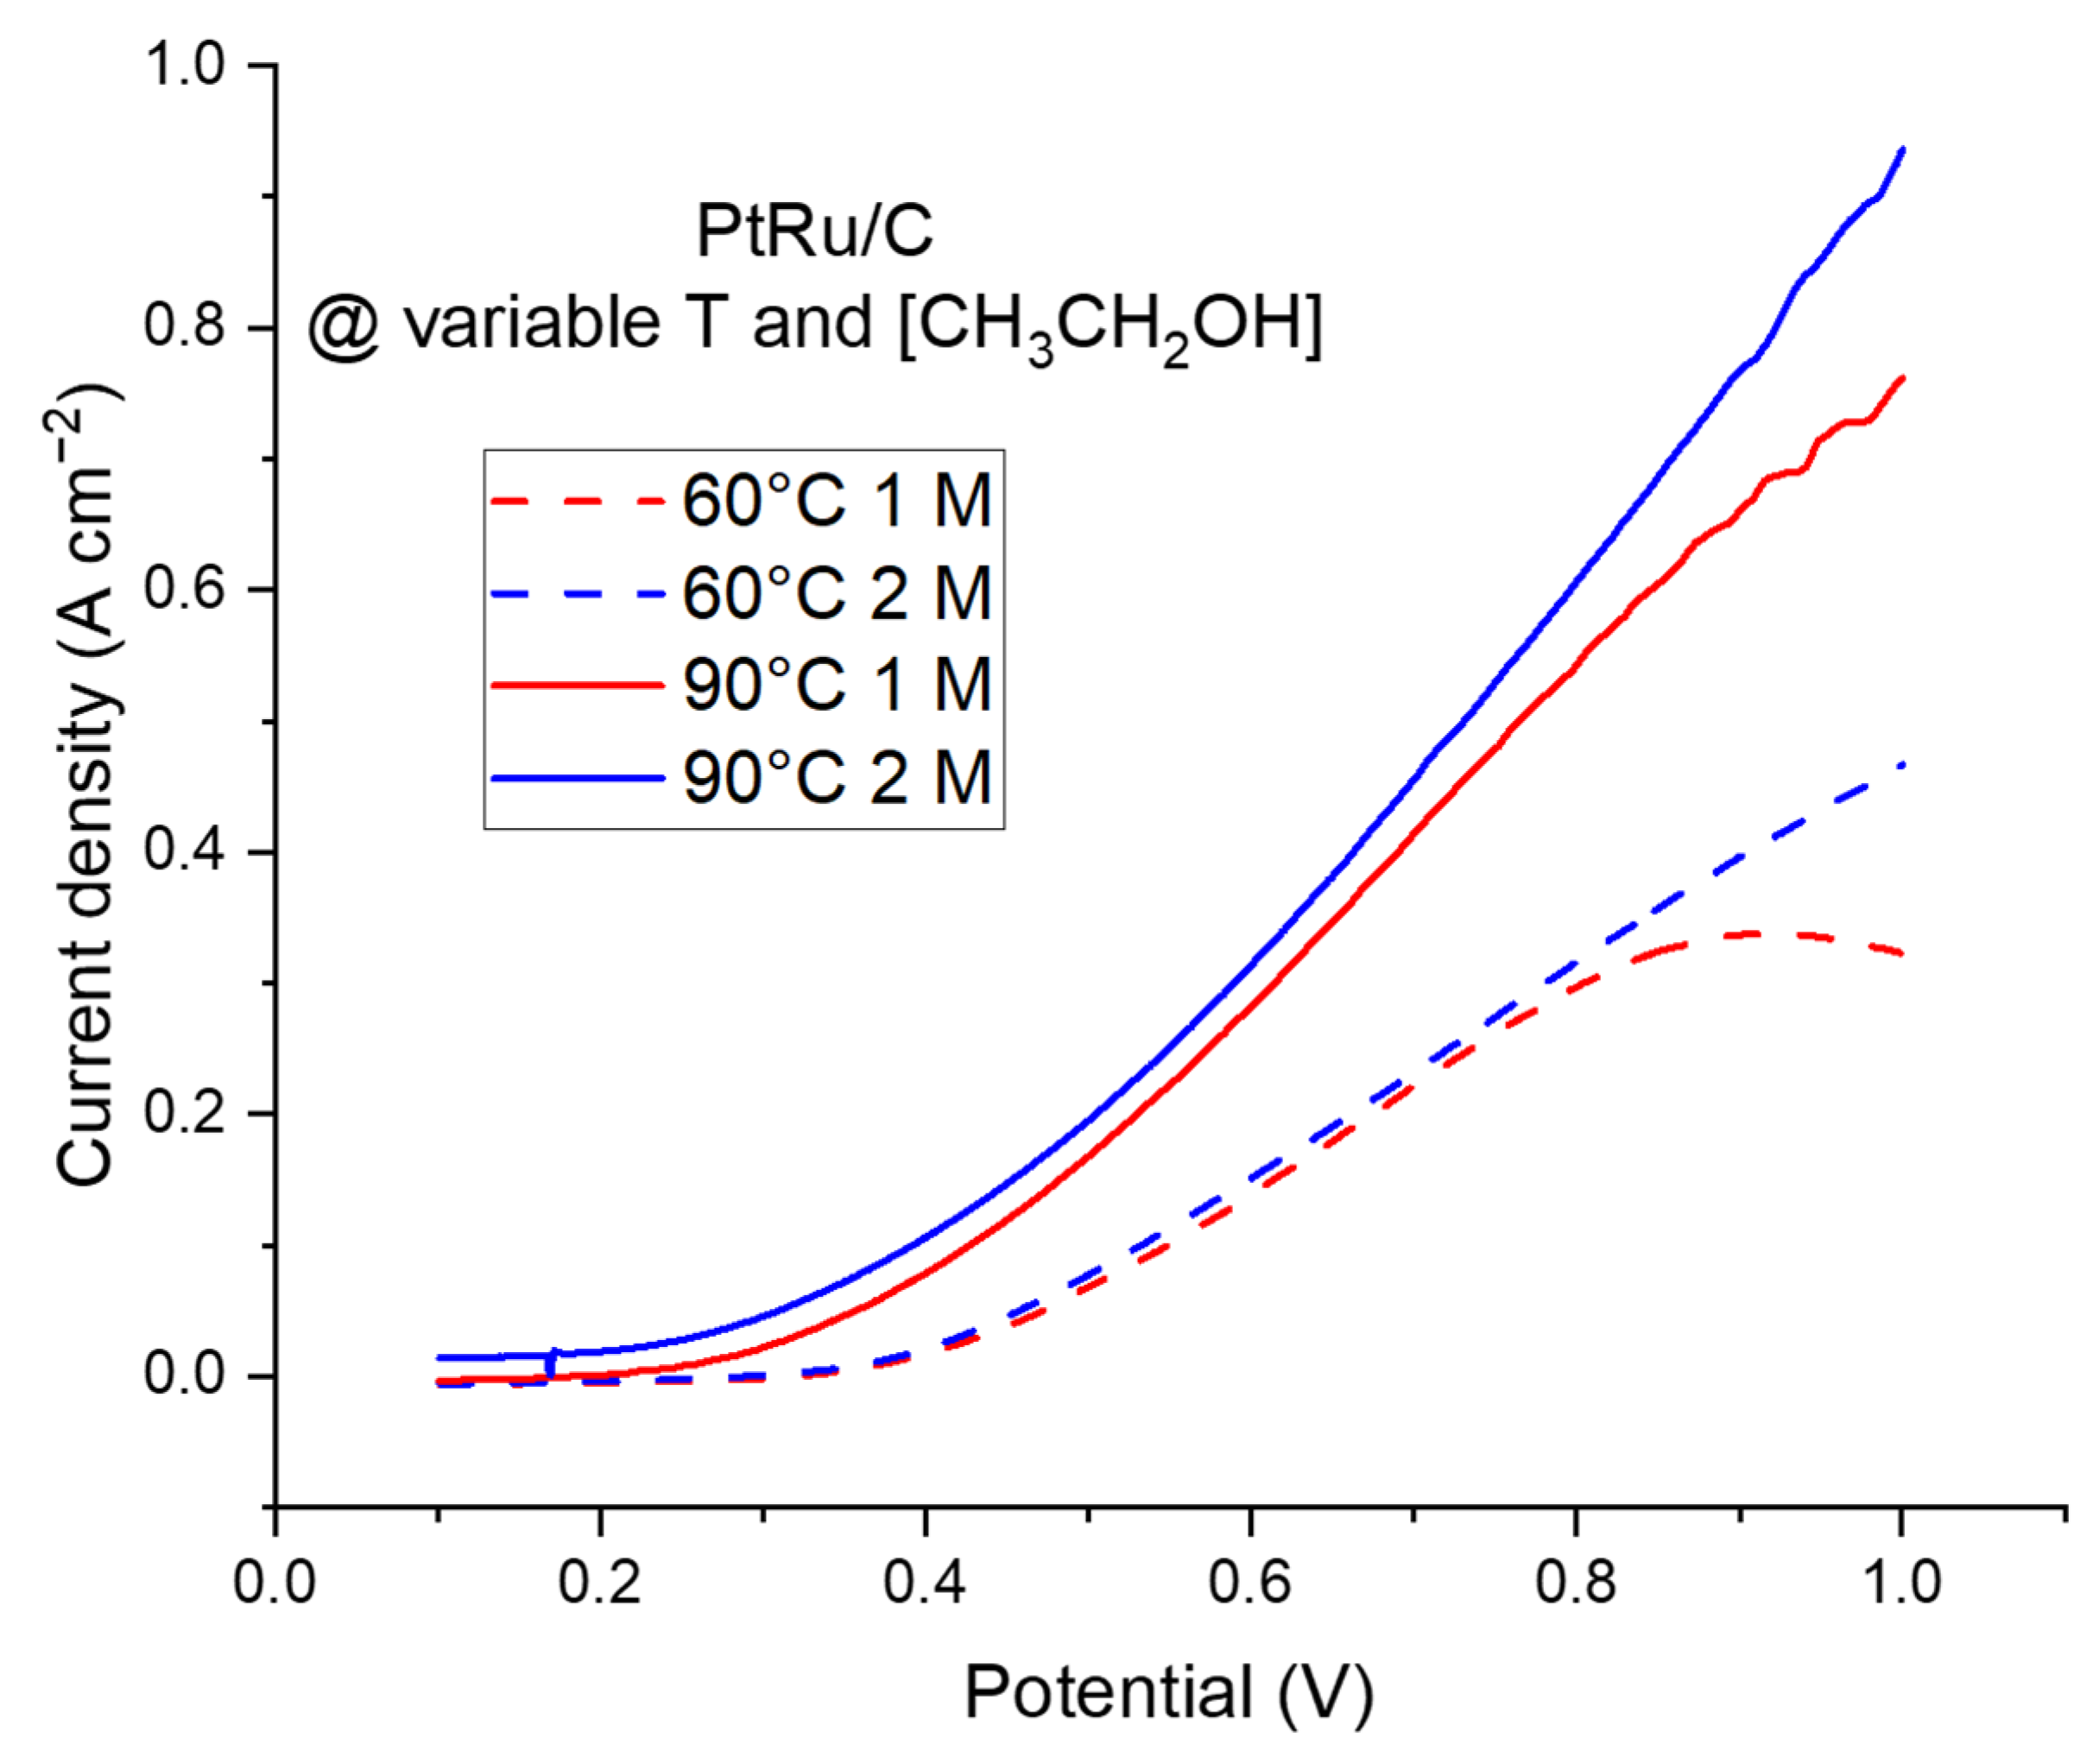
2.2.1. Half-Cell Electrochemical Measurements

Using a glassy carbon (GC) disc as the substrate, the 50% PtRu/C catalyst was initially studied electrochemically for the ethanol oxidation reaction (EOR) in a half-cell setup. Different ethanol solutions (ranging from 0 to 2 M) in 0.5 M sulfuric acid were used for the measurements. Figure 4 displays the linear sweep voltammetries (LSVs). The ink was made of the PtRu/C catalyst, isopropanol:water 3:1 (v/v), and 15 wt.% Nafion ionomer (with respect to the catalyst amount). It was then put onto the GC to yield a loading of 50 μgPt cm−2. The addition of ethanol increased the EOR current density, indicating improved kinetics and mass transport capabilities. At 0.7 V, the maximum current density for 2 M EtOH in the electrolyte was 11.4 mA cm−2. This value is comparable with that reported in the literature when using 2 M MeOH solution [25].
Tafel curves of the different ethanol solutions added to the electrolyte are represented in Figure 4b. The values of the Tafel slope agree with a previously published paper related to PtRu/C catalysts [25]. Furthermore, the lowest Tafel slope of 115 mV dec−1 was achieved at a 2M ethanol concentration in the electrolyte, suggesting faster reaction kinetics.

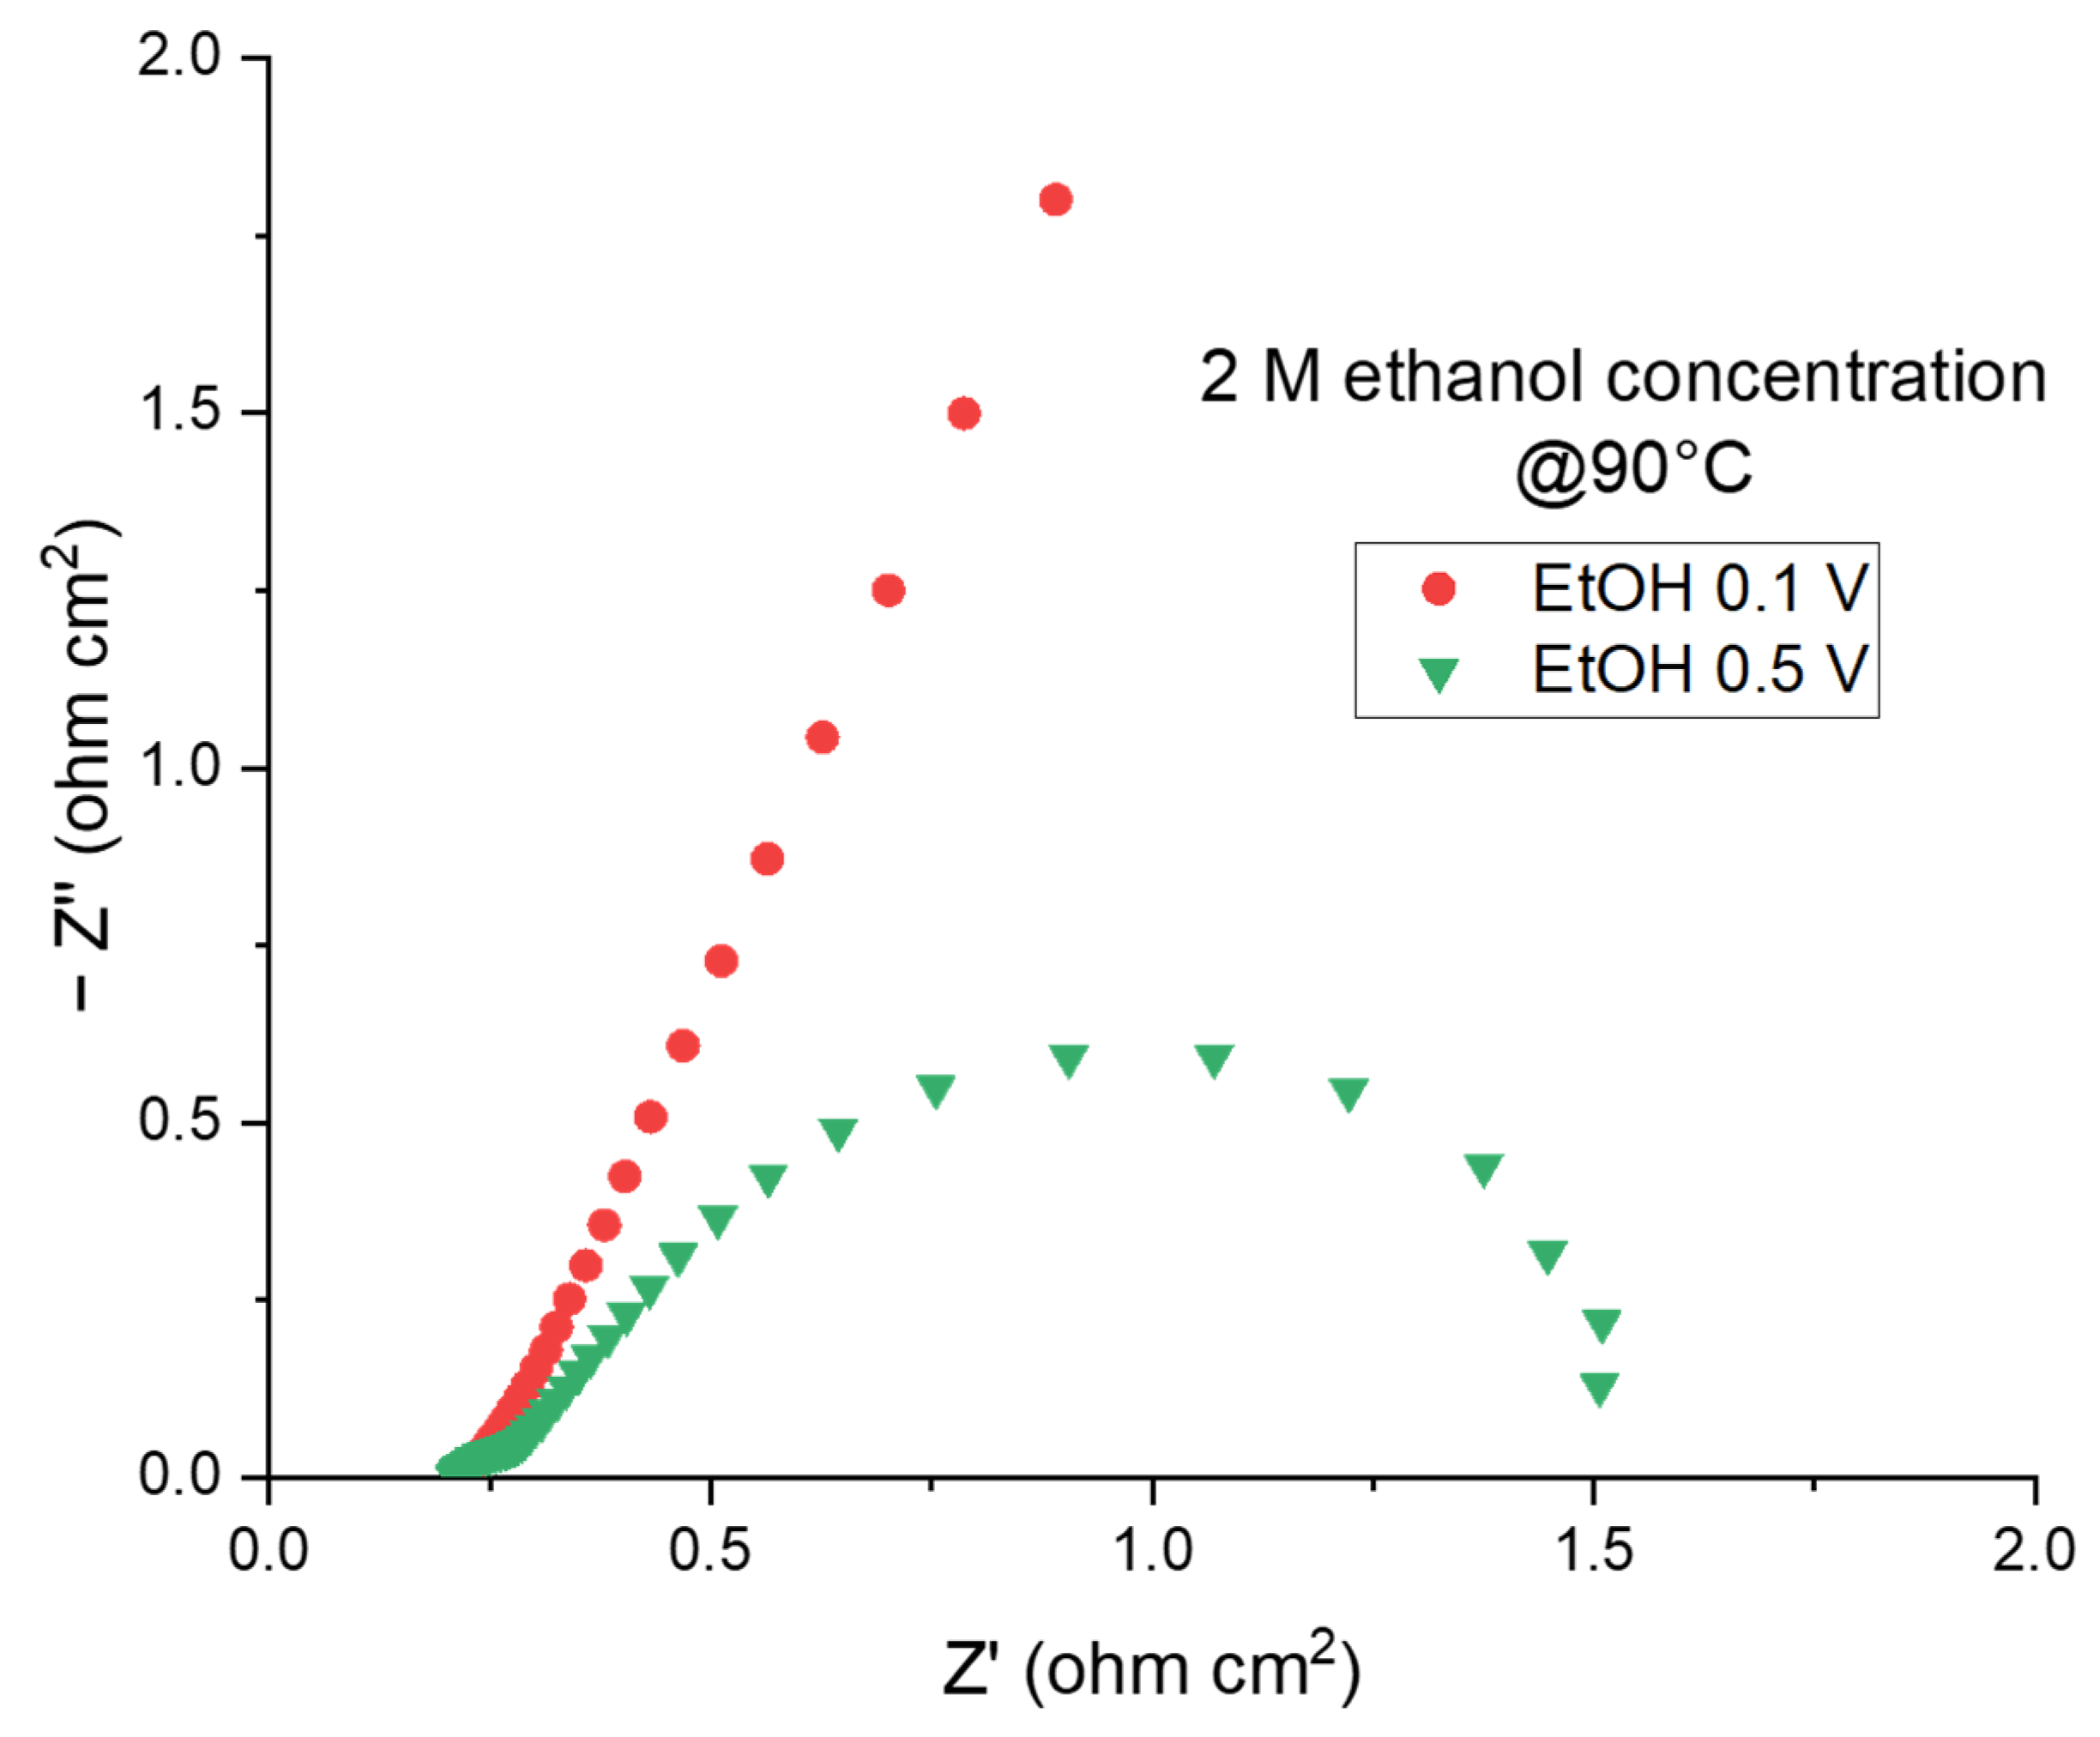
2.2.2. The Electroreforming (ER) Process in a Complete Cell

The ethanol ER cell was equipped with a proton exchange membrane (Nafion 115) as the electrolyte, commercial 40% Pt/C (0.5 mgPt cm−2) on a GDL (SGL 39BB) as the cathode, and the homemade 50% PtRu/C catalyst over SGL 39BB at the anode. A 2 M ethanol solution was fed to the anode, whereas N2 was supplied to the cathode compartment. The linear sweep voltammetry (LSV) curves obtained at 60 and 90 °C with different ethanol concentrations are displayed in Figure 5. Bending-down phenomena, observed at a high potential, 1M ethanol feeding, and 60 °C, are probably related to the lower alcohol diffusion towards the catalysts’ interface at low temperatures and ethanol concentrations, as also noticed in the half-cell measurements. At 90 °C and a cell potential of 1 V, the output current density increases with an increasing ethanol concentration, reaching a value of 0.47 A cm−2 in 2 M ethanol at 60 °C and 0.94 A cm−2 at 90 °C. This behavior can be explained by the ethanol electrooxidation process’s improved kinetics at higher temperatures and concentrations.
Impedance spectra, shown in Figure 6, were recorded at 0.1 V, when no reaction took place, and at 0.5 V, when ethanol was oxidised at the anode and hydrogen evolved at the cathode side. The series resistances (Rs) are very similar (about 200 mΩ cm2), confirming a similar membrane hydration. When the anode is fed with 2 M ethanol solution, the charge transfer resistance (Rct) at 0.5 V is 1.5 Ω cm2, and the semicircle indicates that the reactions are occurring.
In comparing the results obtained in the literature for ethanol electroreforming, it appears that only a few papers have been published on this topic (Table 1). Ethanol or alcohol electrooxidation is usually investigated in alkaline media due to the kinetic advantages. Table 1 summarizes the effect of different MEAs as a function of the temperature and oxidant feeding at the anode side. With the use of a Tokuyama membrane, a Pt/C cathode catalyst, and a Pd/TNTA web anode catalyst in a mixed EtOH/NaOH solution, Chen et al. [12] achieved a noteworthy maximum current density (Jmax) of 1.95 A cm−2 (80 °C) at 1.0 V. Further examples of performance, reported in the literature in an alkaline environment, range from 0.4 to 0.5 A cm−2 between 0.7 and 0.9 V. In acid conditions, the maximum current density, achieved at 80 °C with 6 M ethanol solution, was 0.24 A cm−2. In this work, when 1 M ethanol was fed to the anode side, Jmax was 0.34 A cm−2 (0.9 V) at 60 °C and 0.76 A cm−2 (1.0 V) at 90 °C. When the ethanol concentration was doubled, performance improvements of 0.13 and 0.18 A cm−2 at 60 °C and 90 °C, respectively, were observed.

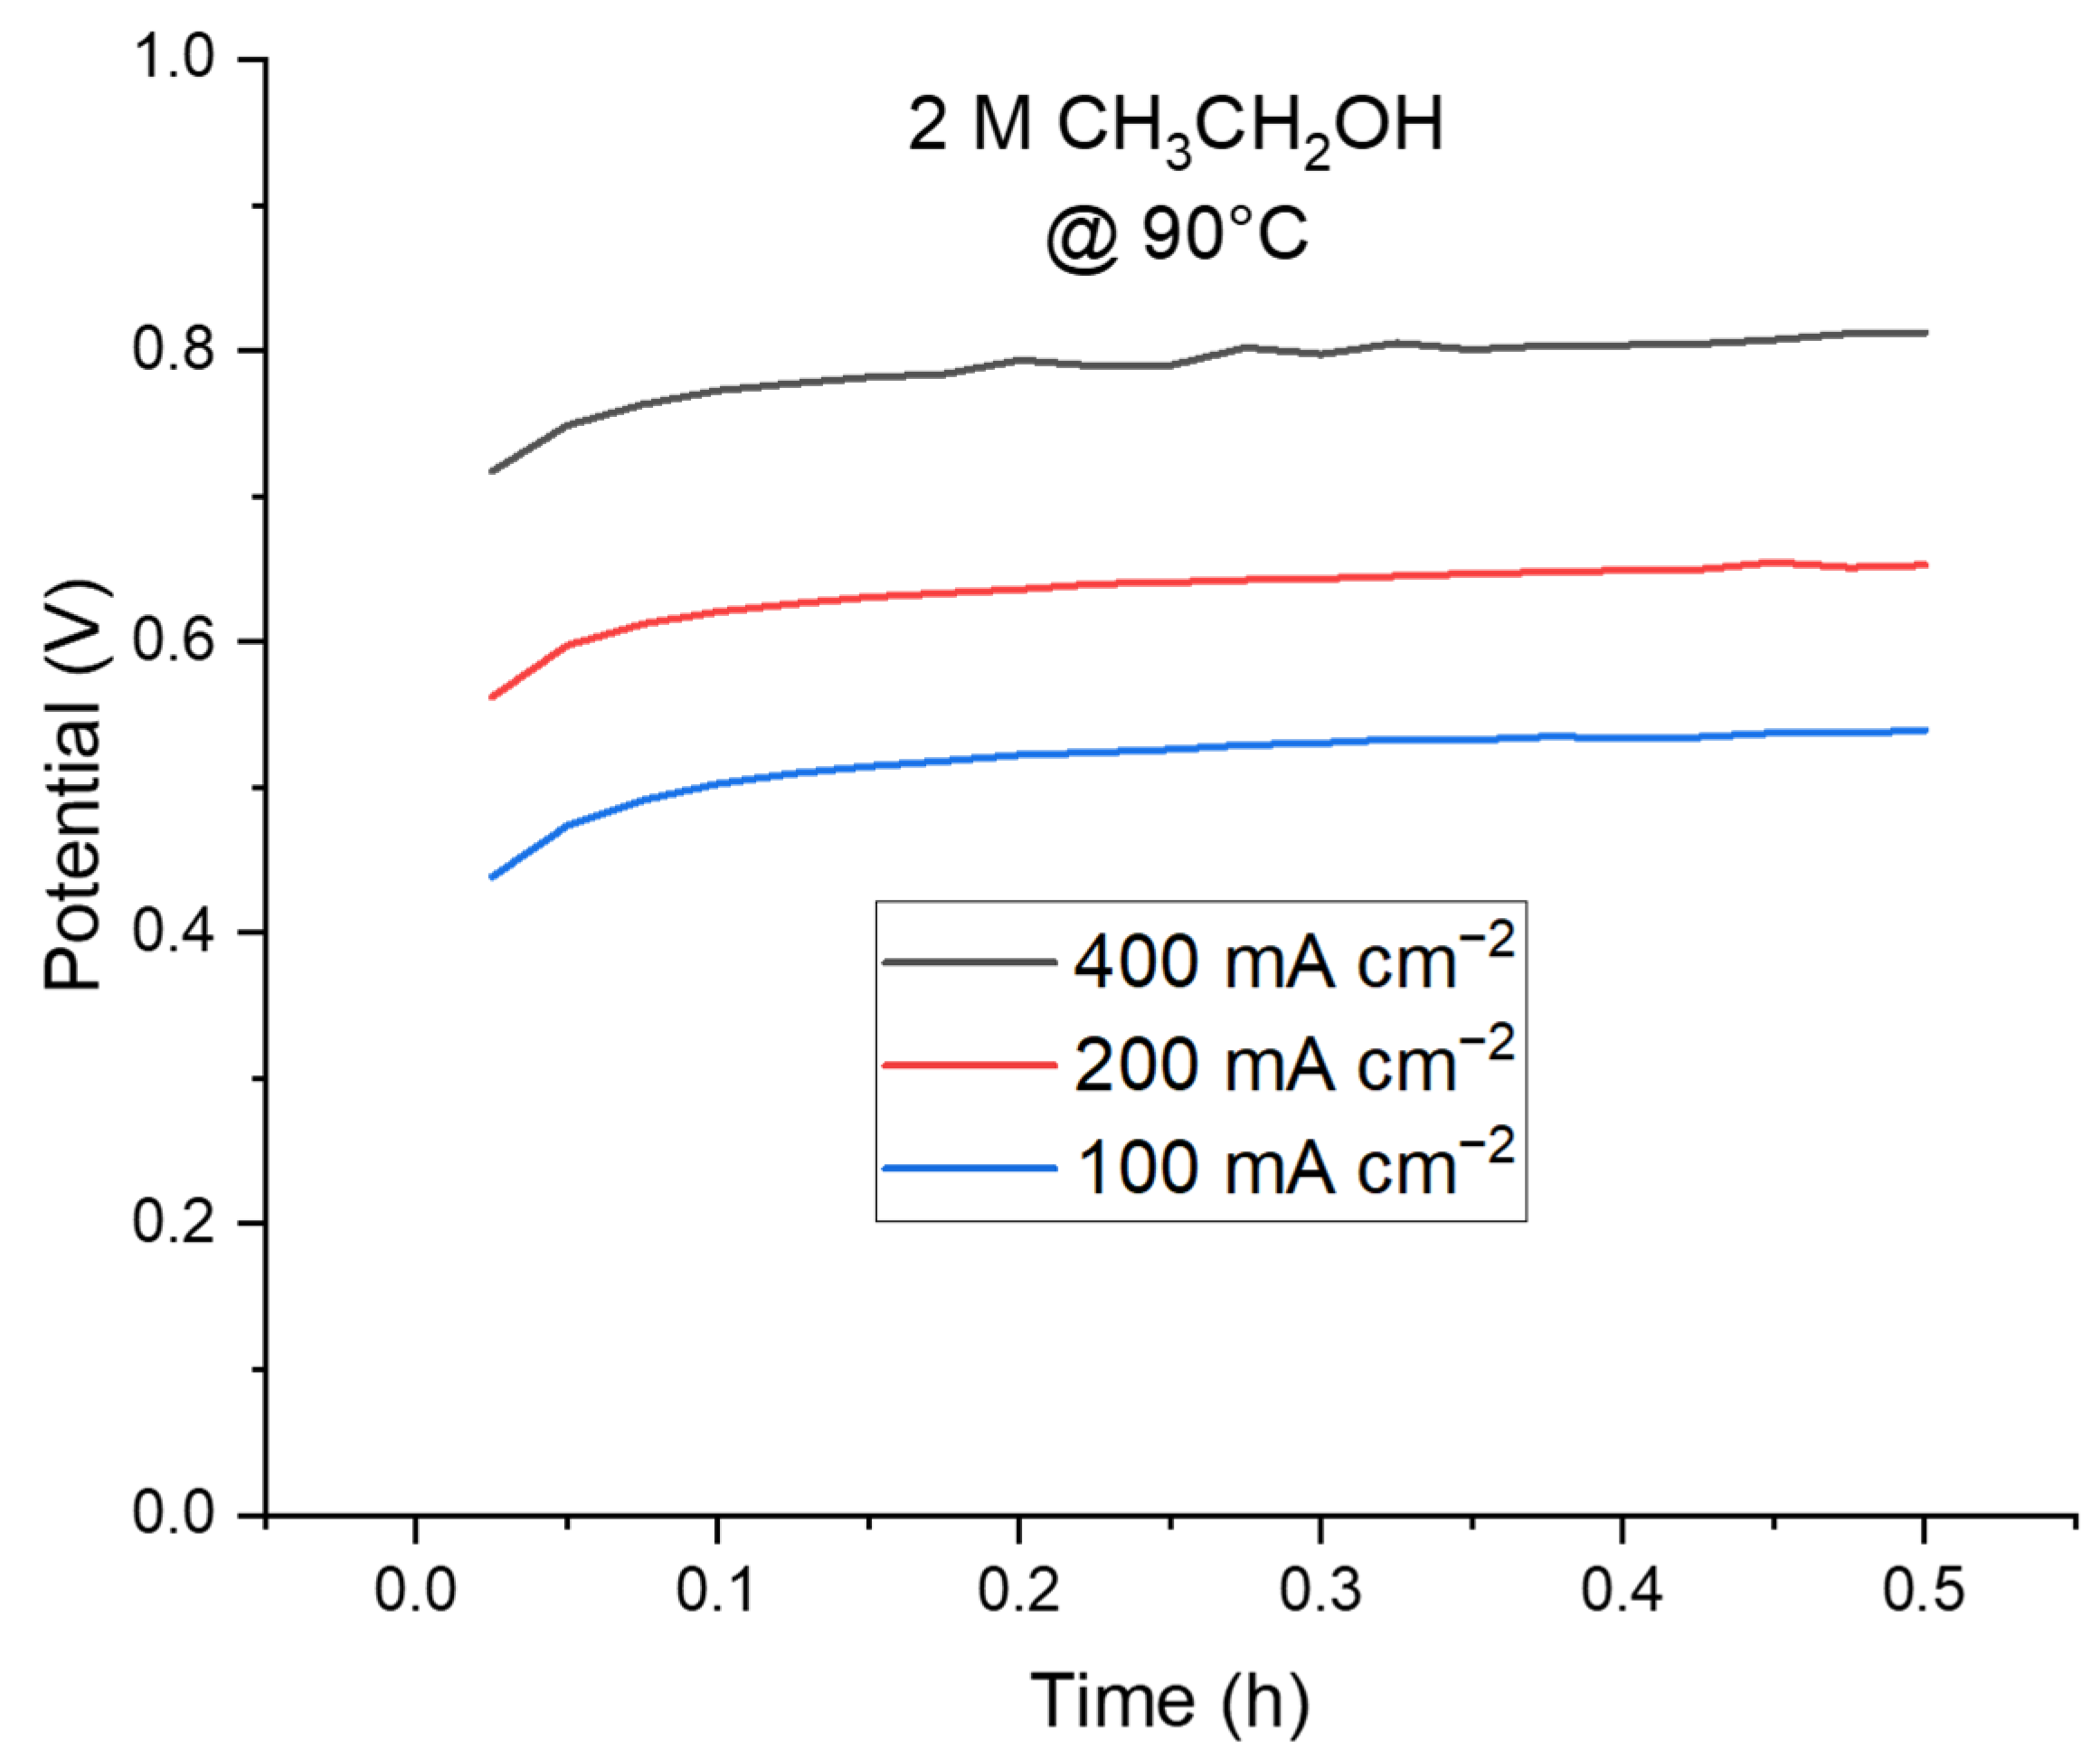
2.2.3. Stability and Hydrogen Detection in a Complete Cell

A short-term stability test in 2 M ethanol solution is shown in Figure 7, demonstrating that the cell is almost stable for half an hour at 100, 200, and 400 mA cm−2. An initial increase in the potential (60 mV) occurs in the first 5 min, but this is observed for all the experiments, likely due to switching from the open circuit to a selected current density.
The amount of evolved hydrogen as a function of time for three distinct current densities (100, 200, and 400 mA cm−2) was used to calculate the hydrogen evolution rate during the electrolysis of a 2 M ethanol solution. The observed volume of hydrogen in each experiment shows a linear relationship with time, depending only on the current density, according to Faraday’s law. The hydrogen flow, revealed using a gas flow meter, was 3.3 ± 0.2 mL min−1 at 100 mA cm−2, 7.0 ± 0.2 mL min−1 at 200 mA cm−2, and 15.8 ± 0.2 mL min−1 at 400 mA cm−2.

2.2.4. Physicochemical Characterization after the Stability Test

XRD analyses of PtRu/C as powder; over the gas diffusion layer (GDL) at the end of the test (EOT), scraped out from the electrode; and pristine GDL are shown in Figure 8. It appears that two distinct crystallographic phases of the Pt and Ru nanoparticles were encountered at the beginning of the test. In contrast, the intensity of the signals related to hexagonal ruthenium at 38.4°, 42.2°, 44.0°, 58.3°, 69.5°, 78.4°, 84.7°, and 86.0° significantly decreases at the EOT. The other peaks at 18.0°, 26.5°, and 54.5° are associated with the hexagonal graphite phase of the pristine GDL.
S-TEM-EDX and the mapping at the end of the test are displayed in Figure 9. The TEM image (Figure 9a) shows an agglomeration of the samples with particle sizes ranging between 4 and 10 nm. From the EDX, the atomic percentage of Pt:Ru shifts from 50:50 at the BOT to 60:40 at the EOT, corroborating the misplacement of some of the non-alloyed ruthenium nanoparticles. The mapping of the PtRu catalyst at the EOT reveals that Pt (Figure 9b) is homogenously distributed over the entire support, as reported at the beginning of the test (BOT). In contrast, Ru (Figure 9c) appears to be more agglomerated in certain portions of the space due to the presence of unalloyed particles, as revealed by the overlay in Figure 9d.

3. Materials and Methods

3.1. Synthesis of 50 wt.% Pt1Ru1/KB

First, as described in our previous paper [30], Na6Pt(SO3)4 was prepared. In brief, after mixing H2PtCl6 (Engelhard SrL, Roma, Italy) with NaHSO3 (Acros Organics, Geel, Belgium) at 75 °C, the solution’s colour transitioned from orange to yellow, and then it became transparent. Finally, a white colloidal powder was precipitated, filtered, and left to dry in an oven for an entire night. Then, the carbonaceous compound (KB from AkzoNobel, Amsterdam, The Netherlands) was dissolved in a 3:1 (v:v) H2O:ethanol solution, whereas Na6Pt(SO3)4 was dissolved in H2O with 50% of the metal concentration on carbon. The pH of the Pt aqueous solution mixed with KB was adjusted to 5.2. Dropwise, a molar excess of 35 wt.% H2O2 (Carlo Erba, Milano, Italy) was added, and the pH was subsequently increased to 5.4.
The solution was stirred for 30 min at a temperature of 70 °C before it was vacuum-filtered. After thorough washing with water, the solid was left to dry overnight at 80 °C (PtOx/KB). Subsequently, using a molar ratio of Pt:Ru of 1:1, salt solutions were added to PtOx/KB dissolved in 200 mL of H2O to impregnate it with ruthenium, coming from the RuCl3*3H2O (Aldrich, St. Louis, MO, USA) precursor. After stirring the mixture and gradually evaporating the solvent at 85 °C, an impregnated product was formed and dried. Lastly, 400 mg of the sample was heated for one hour at 600 °C with a He flow.
To calculate the carbon percentage, 50 mg of the sample was burned at 550 °C in air for 2 h, and 25 mg (50%) was its weight after cooling.

3.2. Physicochemical Analysis

X-ray diffraction (XRD) analyses were carried out using a Bruker D8 Advance spectrometer (Bruker Italia srl, Milano, Italy) on the 50% Pt1Ru1/KB powder, employing a Cu-K source operating at 40 kV and 40 mA. The analysis of the crystallographic orientation was carried out with Bragg–Bentano optical geometry in the range of 10–100 degrees.
Scanning Transmission Electron Microscopy–Energy-Dispersive X-Ray Spectroscopy (S/TEM-EDX) investigations were performed using a JEOL JEM-F200 electron microscope (JEOL Italia S.p.A., Milano, Italy) to investigate the morphology of the catalyst.
X-ray fluorescence (XRF) spectroscopy was carried out using a Bruker S8 Tiger instrument to understand the sample purity and the metallic ratio.

3.3. Electrochemical Investigation

3.3.1. Half-Cell Analyses

Using a standard three-electrode cell, electrochemical tests of the catalysts were carried out at room temperature with a rotating disk electrode (RDE) configuration. Hg/Hg2SO4, saturated with K2SO4, served as the reference electrode. A platinum wire with a high surface area was utilized as the counter electrode, whereas a 5 mm glassy carbon (GC) disk was used as the working electrode to deposit the thin film catalyst. To achieve 50 μg·cm−2 platinum loading, the 50% Pt1Ru1/KB catalysts were first sonicated for 30 min in a mixture of water:isopropyl alcohol 3:1 (v.v.) and 30% Nafion. The resulting catalytic inks were then deposited onto a GC disk. The glassy carbon was polished using an OP-Felt cloth and an alumina suspension before each measurement. The catalyst’s conditioning was carried out under a N2 flow in the base electrolyte using cyclic voltammetry at 100 mV s−1 between 0.05 and 1.2 V towards the RHE. A total of 50 cycles were acquired until a stable voltammogram was achieved. Afterward, five potential cycles were carried out at a voltage ranging between 0.05 and 1.2 V vs. the RHE by using a scan speed of 20 mV/s. The electrolyte was a 0.5 M H2SO4 solution. Ethanol (EtOH) was progressively added to the base electrolyte to test the catalyst’s activity towards methanol or ethanol oxidation reactions at alcohol concentrations of 0.1 M, 0.5 M, 1 M, and 2 M. Linear sweep voltammetry was used to measure the EOR activity at a scan rate of 5 mV·s−1 between 0 and 0.7 V vs. the RHE.
A Metrohm Autolab (Utrecht, The Netherlands) potentiostat/galvanostat was used to perform the electrochemical experiments.

3.3.2. Electroreforming in a Full Cell

Commercial gas diffusion layer (GDL)-coated carbon paper, Sigracet 39BB, was used as the backing layer at the anode and cathode in the electrodes made for the electroreforming experiments. The 50% Pt1Ru1/KB catalyst was mixed in water:isopropyl alcohol 3:1 (v.v.) solvent, sonicated with 33% weight percent Nafion® ionomer (Ion Power, München, Germany, 5% solution), and then applied using an airbrush with the spray deposition technique to the GDL. Pt loading of 1.7 mg·cm−2 was applied to the anode. In contrast, the cathodic ink was prepared by sonicating 40% Pt/C (from Alfa Aesar, Ward Hill, MA, USA) catalyst and 33% Nafion® ionomer (Ion Power, 5% solution). Pt loading of 0.5 mg·cm−2 was employed at the cathode. The electrodes were cold-pressed onto the Nafion® 115 PEM. The membrane electrode assembly (MEA) was tested in a Fuel Cell Technologies Inc. (Albuquerque, NM, USA) station that was coupled to 5 cm2 single-cell hardware. Either a 1 or 2 M ethanol concentration was sent at a flow rate of 2 mL·min−1 to the anode, while the cathode was maintained at 100 mL·min−1 of fully humidified nitrogen under atmospheric pressure. The performance was evaluated under a steady-state configuration between 30 and 90 °C. Before each I-V curve, the cell was maintained at 0.4 V for 15 min. Using a voltage scan rate of 5 mV·s−1 and a voltage range of 0 to 1 V, a linear sweep voltammetry (LSV) analysis was performed using Metrohm Autolab equipment. Electrochemical impedance spectroscopy was recorded at 0.1 V, without any reaction, and at 0.5 V when ethanol and hydrogen were oxidized and evolved at the anode and cathode, respectively. The root mean square voltage (Vrms) was 10 mV, and the frequency ranged between 10 kHz and 0.1 Hz. Chronopotentiometric tests were run for 30 min at 0.5, 1, and 2 A (100, 200, and 400 mAcm−2) without the N2 flow, while a gas flow meter was used to evaluate the hydrogen production at the cathode. All the electrochemical measurements were obtained using an AutoLab PG-STAT Metrohm instrument.

4. Conclusions

Alcohol electrochemical reforming could be a viable alternative to water electrolysis for hydrogen production. The advantage of ER is that achieving a current density greater than 1 A cm−2 is possible at low-bias voltage (<1 V) towards the value > 1.8 V required by an oxygen evolution reaction (OER) from WE. In this study, a 50% Pt1Ru1/C anode catalyst was prepared using versatile synthesis (sulphite route and impregnation) and used at the anode of an ER cell to oxidize an ethanol solution. The cell was assembled with a proton exchange membrane (Nafion 115) between the as-prepared anode and a commercial cathode (40% Pt/C). Current density values > 0.9 A cm−2 were recorded at 90 °C and 1 V by feeding 2 M CH3CH2OH solution at the anode. Short-term chronopotentiometry showed a quite stable potential of 0.8 V at 400 mA cm−2. According to Faraday’s law, the observed volume of hydrogen in each experiment exhibits a linear relationship with time and a unique dependence on the current density.

Author Contributions

Conceptualization, V.B.; methodology, C.L.V. and V.B.; synthesis, E.M. and C.L.V.; investigation, E.M. and S.T.; data curation, C.L.V. and E.M.; writing—original draft preparation, C.L.V. and E.M.; writing—review and editing, V.B. All authors have read and agreed to the published version of the manuscript.

Funding

This research was funded by the European Union’s NextGenerationEU from the Italian Ministry of Environment and Energy Security POR H2 AdP MMES/ENEA with the involvement of CNR and RSE, PNRR—Mission 2, Component 2, Investment 3.5 “Ricerca e sviluppo sull’idrogeno”, CUP: B93C22000630006.

Data Availability Statement

Data will be made available on request.

Conflicts of Interest

The authors declare no conflicts of interest.

References

  1. Liu, J.; Yan, Q.; Zhang, M. Ecosystem Carbon Storage Considering Combined Environmental and Land-Use Changes in the Future and Pathways to Carbon Neutrality in Developed Regions. Sci. Total Environ. 2023, 903, 166204. [Google Scholar] [CrossRef] [PubMed]
  2. Chatterjee, P.; Ambati, M.S.K.; Chakraborty, A.K.; Chakrabortty, S.; Biring, S.; Ramakrishna, S.; Wong, T.K.S.; Kumar, A.; Lawaniya, R.; Dalapati, G.K. Photovoltaic/Photo-Electrocatalysis Integration for Green Hydrogen: A Review. Energy Convers. Manag. 2022, 261, 115648–115685. [Google Scholar] [CrossRef]
  3. Rabaia, M.K.H.; Abdelkareem, M.A.; Sayed, E.T.; Elsaid, K.; Chae, K.J.; Wilberforce, T.; Olabi, A.G. Environmental Impacts of Solar Energy Systems: A Review. Sci. Total Environ. 2021, 754, 141989. [Google Scholar] [CrossRef] [PubMed]
  4. Sadorsky, P. Wind Energy for Sustainable Development: Driving Factors and Future Outlook. J. Clean. Prod. 2021, 289, 125779. [Google Scholar] [CrossRef]
  5. Dhar, A.; Naeth, M.A.; Jennings, P.D.; Gamal El-Din, M. Perspectives on Environmental Impacts and a Land Reclamation Strategy for Solar and Wind Energy Systems. Sci. Total Environ. 2020, 718, 134602. [Google Scholar] [CrossRef] [PubMed]
  6. Züttel, A.; Remhof, A.; Borgschulte, A.; Friedrichs, O. Hydrogen: The Future Energy Carrier. Philos. Trans. R. Soc. A Math. Phys. Eng. Sci. 2010, 368, 3329–3342. [Google Scholar] [CrossRef] [PubMed]
  7. Sazali, N. Emerging Technologies by Hydrogen: A Review. Int. J. Hydrogen Energy 2020, 45, 18753–18771. [Google Scholar] [CrossRef]
  8. Benghanem, M.; Mellit, A.; Almohamadi, H.; Haddad, S.; Chettibi, N.; Alanazi, A.M.; Dasalla, D.; Alzahrani, A. Hydrogen Production Methods Based on Solar and Wind Energy: A Review. Energies 2023, 16, 757. [Google Scholar] [CrossRef]
  9. Serov, A.; Kwak, C. Review of Non-Platinum Anode Catalysts for DMFC and PEMFC Application. Appl. Catal. B 2009, 90, 313–320. [Google Scholar] [CrossRef]
  10. Yang, D.; Yan, Z.; Li, B.; Higgins, D.C.; Wang, J.; Lv, H.; Chen, Z.; Zhang, C. Highly Active and Durable Pt–Co Nanowire Networks Catalyst for the Oxygen Reduction Reaction in PEMFCs. Int. J. Hydrogen Energy 2016, 41, 18592–18601. [Google Scholar] [CrossRef]
  11. Pan, Y.; Li, Y.; Nairan, A.; Khan, U.; Hu, Y.; Wu, B.; Sun, L.; Zeng, L.; Gao, J. Constructing FeNiPt@C Trifunctional Catalyst by High Spin-Induced Water Oxidation Activity for Zn-Air Battery and Anion Exchange Membrane Water Electrolyzer. Adv. Sci. 2024, 11, 2308205. [Google Scholar] [CrossRef] [PubMed]
  12. Chen, Y.X.; Lavacchi, A.; Miller, H.A.; Bevilacqua, M.; Filippi, J.; Innocenti, M.; Marchionni, A.; Oberhauser, W.; Wang, L.; Vizza, F. Nanotechnology Makes Biomass Electrolysis More Energy Efficient than Water Electrolysis. Nat. Commun. 2014, 5, 4036. [Google Scholar] [CrossRef] [PubMed]
  13. Dolle, C.; Neha, N.; Coutanceau, C. Electrochemical Hydrogen Production from Biomass. Curr. Opin. Electrochem. 2022, 31, 100841. [Google Scholar] [CrossRef]
  14. Sebastián, D.; Serov, A.; Matanovic, I.; Artyushkova, K.; Atanassov, P.; Aricò, A.S.; Baglio, V. Insights on the Extraordinary Tolerance to Alcohols of Fe-N-C Cathode Catalysts in Highly Performing Direct Alcohol Fuel Cells. Nano Energy 2017, 34, 195–204. [Google Scholar] [CrossRef]
  15. Berretti, E.; Longhi, M.; Atanassov, P.; Sebastián, D.; Lo Vecchio, C.; Baglio, V.; Serov, A.; Marchionni, A.; Vizza, F.; Santoro, C.; et al. Platinum Group Metal-Free Fe-Based (Fe–N–C) Oxygen Reduction Electrocatalysts for Direct Alcohol Fuel Cells. Curr. Opin. Electrochem. 2021, 29, 100756. [Google Scholar] [CrossRef]
  16. Gupta, U.K.; Pramanik, H. Electrooxidation Study of Pure Ethanol/Methanol and Their Mixture for the Application in Direct Alcohol Alkaline Fuel Cells (DAAFCs). Int. J. Hydrogen Energy 2019, 44, 421–435. [Google Scholar] [CrossRef]
  17. Lo Vecchio, C.; Aricò, A.S.; Baglio, V. Application of Low-Cost Me-N-C (Me = Fe or Co) Electrocatalysts Derived from Edta in Direct Methanol Fuel Cells (DMFCs). Materials 2018, 11, 1193. [Google Scholar] [CrossRef] [PubMed]
  18. Peng, H.; Ren, J.; Wang, Y.; Xiong, Y.; Wang, Q.; Li, Q.; Zhao, X.; Zhan, L.; Zheng, L.; Tang, Y.; et al. One-Stone, Two Birds: Alloying Effect and Surface Defects Induced by Pt on Cu2−xSe Nanowires to Boost C-C Bond Cleavage for Electrocatalytic Ethanol Oxidation. Nano Energy 2021, 88, 106307. [Google Scholar] [CrossRef]
  19. Yaqoob, L.; Noor, T.; Iqbal, N. A Comprehensive and Critical Review of the Recent Progress in Electrocatalysts for the Ethanol Oxidation Reaction. RSC Adv. 2021, 11, 16768–16804. [Google Scholar] [CrossRef]
  20. Miller, H.A.; Bouzek, K.; Hnat, J.; Loos, S.; Bernäcker, C.I.; Weißgärber, T.; Röntzsch, L.; Meier-Haack, J. Green Hydrogen from Anion Exchange Membrane Water Electrolysis: A Review of Recent Developments in Critical Materials and Operating Conditions. Sustain. Energy Fuels 2020, 4, 2114–2133. [Google Scholar] [CrossRef]
  21. Gatto, I.; Caprì, A.; Lo Vecchio, C.; Zignani, S.; Patti, A.; Baglio, V. Optimal Operating Conditions Evaluation of an Anion-Exchange-Membrane Electrolyzer Based on FUMASEP® FAA3-50 Membrane. Int. J. Hydrogen Energy 2023, 48, 11914–11921. [Google Scholar] [CrossRef]
  22. Rodríguez-Gómez, A.; Lepre, E.; Sánchez-Silva, L.; López-Salas, N.; de la Osa, A.R. PtRu Nanoparticles Supported on Noble Carbons for Ethanol Electrooxidation. J. Energy Chem. 2022, 66, 168–180. [Google Scholar] [CrossRef]
  23. Sudachom, N.; Warakulwit, C.; Parpainainar, P. The Effect of Ternary Catalyst Atomic Ratios (PtRuSn/C and PtRuNi/C) on Ethanol Electrooxidation for Direct Ethanol Fuel Cell. In Key Engineering Materials; Trans Tech Publications Ltd.: Zurich, Switzerland, 2015; Volume 659, pp. 247–251. [Google Scholar]
  24. Lamy, C.; Jaubert, T.; Baranton, S.; Coutanceau, C. Clean Hydrogen Generation through the Electrocatalytic Oxidation of Ethanol in a Proton Exchange Membrane Electrolysis Cell (PEMEC): Effect of the Nature and Structure of the Catalytic Anode. J. Power Sources 2014, 245, 927–936. [Google Scholar] [CrossRef]
  25. Sebastián, D.; Stassi, A.; Siracusano, S.; Lo Vecchio, C.; Aricò, A.S.; Baglio, V. Influence of Metal Oxide Additives on the Activity and Stability of PtRu/C for Methanol Electro-Oxidation. J. Electrochem. Soc. 2015, 162, F713. [Google Scholar] [CrossRef]
  26. Caravaca, A.; Sapountzi, F.M.; De Lucas-Consuegra, A.; Molina-Mora, C.; Dorado, F.; Valverde, J.L. Electrochemical Reforming of Ethanol-Water Solutions for Pure H2 Production in a PEM Electrolysis Cell. Int. J. Hydrogen Energy 2012, 37, 9504–9513. [Google Scholar] [CrossRef]
  27. Pagliaro, M.V.; Bellini, M.; Bevilacqua, M.; Filippi, J.; Folliero, M.G.; Marchionni, A.; Miller, H.A.; Oberhauser, W.; Caporali, S.; Innocenti, M.; et al. Carbon Supported Rh Nanoparticles for the Production of Hydrogen and Chemicals by the Electroreforming of Biomass-Derived Alcohols. RSC Adv. 2017, 7, 13971–13978. [Google Scholar] [CrossRef]
  28. Miller, H.A.; Bellini, M.; Vizza, F.; Hasenöhrl, C.; Tilley, R.D. Carbon Supported Au-Pd Core-Shell Nanoparticles for Hydrogen Production by Alcohol Electroreforming. Catal. Sci. Technol. 2016, 6, 6870–6878. [Google Scholar] [CrossRef]
  29. Bellini, M.; Pagliaro, M.V.; Marchionni, A.; Filippi, J.; Miller, H.A.; Bevilacqua, M.; Lavacchi, A.; Oberhauser, W.; Mahmoudian, J.; Innocenti, M.; et al. Hydrogen and Chemicals from Alcohols through Electrochemical Reforming by Pd-CeO2/C Electrocatalyst. Inorganica Chim. Acta 2021, 518, 120245. [Google Scholar] [CrossRef]
  30. Lo Vecchio, C.; Sebastián, D.; Alegre, C.; Aricò, A.S.; Baglio, V. Carbon-Supported Pd and Pd-Co Cathode Catalysts for Direct Methanol Fuel Cells (DMFCs) Operating with High Methanol Concentration. J. Electroanal. Chem. 2017, 808, 464–473. [Google Scholar] [CrossRef]
Figure 1. Sketch of the different devices: (a) direct ethanol fuel cell and (b) direct ethanol electrolyzer or electrochemical reformer.
Catalysts 14 00415 g001
Figure 2. XRD of the homemade 50 wt.% PtRu/C catalyst.
Catalysts 14 00415 g002
Figure 3. (a) TEM image and mapping of (b) Pt, (c) Ru, and (d) overlay of Pt and Ru particles for the homemade Pt1Ru1/C catalyst.
Catalysts 14 00415 g003
Figure 4. (a) LSV curves in RDE for the 50 wt.% PtRu/C catalyst at 0.1, 0.5, 1, and 2 M ethanol concentrations in 0.5 M H2SO4 bare electrolyte; (b) Tafel plot for the different ethanol concentrations.
Catalysts 14 00415 g004
Figure 5. LSV curves in the 5 cm2 cell for the PtRu/C//Nafion 115//Pt/C MEA feeding at the anode with 1 or 2 M ethanol solutions at 60 °C or 90 °C.
Catalysts 14 00415 g005
Figure 6. Impedance spectra of the 5 cm2 cell at 0.1 V or 0.5 V feeding at the anode with 2 M ethanol solution.
Catalysts 14 00415 g006
Figure 7. Chronopotentiomentric test of the 5 cm2 cell at 100, 200, and 400 mAc m−2 feeding at the anode with 2 M ethanol solution.
Catalysts 14 00415 g007
Figure 8. XRD of the homemade 50 wt.% PtRu/C powder, PtRu/C over GDL at the end of the test (EOT), and pristine GDL.
Catalysts 14 00415 g008
Figure 9. (a) TEM image and mapping of (b) Pt, (c) Ru, and (d) overlay of Pt and Ru particles for the Pt1Ru1/C catalyst scraped from the anode electrode at the end of the test.
Catalysts 14 00415 g009
Table 1. Main literature data for direct ethanol electrolysis cells.
Ref.AnodeMembraneCathodeOxidantT (°C)Jmax @1.0 V (A cm−2)
This work50% PtRu/KBNafion 11540% Pt/C2 M EtOH900.94
This work50% PtRu/KBNafion 11540% Pt/C1 M EtOH900.76
This work50% PtRu/KBNafion 11540% Pt/C2 M EtOH600.47
This work50% PtRu/KBNafion 11540% Pt/C1 M EtOH600.34 @0.9V
[26]40% Pt-20% Ru/CSterion PEM20% Pt/C6M EtOH800.24
[26]40% Pt-20% Ru/CSterion PEM20% Pt/C6M EtOH600.14
[24]30% PtSnRuNafion 117 PEM30% Pt/C2M EtOH + 0.5M H2SO4200.13
[27]Rh/CTokuyama A-201 AEM40% Pt/C2M EtOH + 2M KOH600.5 @0.7V
[28]AuPd/CTokuyama A-201 AEM40% Pt/C2M EtOH + 2M KOH600.41 @0.9V
[12]Pd/TNTA-webTokuyama A-201 AEM40% Pt/C2M EtOH + 2M NaOH801.95
[12]Pd/TNTA-webTokuyama A-201 AEM40% Pt/C2M EtOH + 2M NaOH501.25 @0.9V
[29]Pd-CeO2/CTokuyama A-201 AEM40% Pt/C2M EtOH + 2M KOH600.48
Disclaimer/Publisher’s Note: The statements, opinions and data contained in all publications are solely those of the individual author(s) and contributor(s) and not of MDPI and/or the editor(s). MDPI and/or the editor(s) disclaim responsibility for any injury to people or property resulting from any ideas, methods, instructions or products referred to in the content.

